The document discusses the potential impacts of the EU's resolution to ban palm oil in biofuels by 2020 on the Indonesian and Malaysian palm oil industries. It finds that the two countries, which contribute around 90% of global palm oil exports, will likely see a notable reduction in palm oil export revenue and a negative impact on their trade balances. Specifically, it estimates that Indonesia's trade deficit could widen to $10.9 billion by 2020 from $6.1 billion in 2016 under a worst-case scenario where exports to both the EU and India decline. Similarly, Malaysia's trade surplus is projected to fall to $19.3 billion by 2020 from $22.3 billion in 2016. The resolution poses a critical challenge
Indian Crop Protection Market: Trends and Opportunities (2014-2019) – New Rep...Daedal Research
Â
The report titled “Indian Crop Protection Market: Trends and Opportunities (2014-2019)” provides an. For details, write to info@daedal-research.com
Cocoa farmer faces increasing challenging environment through exposure to risks factors which have impacted negatively on their production or output. Since farmers are primary producers and often times lack capacity to control risks factor, it is important to manage this factors. This study examines the cocoa farmers’ risk preferences and crop insurance perception and isolates the drivers of decision to uptake crop insurance among cocoa farmers in Ekiti state. The sample for the study consist of 200 cocoa farmers who were household heads selected through multi-stage sampling across four Local government areas of Ekiti State who are predominantly cocoa producers. Data collected on socio-demographic characteristics, perception of crop insurance and risk preferences, were analyzed using descriptive statistics and binary logistic model. Results showed that majority of the cocoa farmers were without crop insurance, with higher enrolment in Membership of cooperative society, owned their land, larger household size and lower educational level but higher level of farm experience when compared to cocoa farmers who are holding crop insurance. Farmers risk preferences showed no significant difference between farmers with or without insurance. Education (β=0.59), Household size (β=0.0029) and Debt use (β=0.02), Membership of cooperative (β=-4.53), Farming Experience (β=-2.51), Owned Land (β=-2.19) and Non-Farm Income (β=-0.65) were among the significant determinants of insurance uptake. Risk mitigating measures such as provision of necessary incentives such as improved varieties of cocoa seedling, as well as provision of fertiliser and approved pesticides, financial assistance, and simple processing technologies that produce standard cocoa bean plus a re-jigged Nigeria Agricultural Insurance Corporation (NAIC) for an improved discharge of its function are recommended.
Environmental impact of indonesian crude palm oil industryAbida Muttaqiena
Â
This short paper talks about circumstances around crude oil industry in Indonesia that is being widely talked by environmentalist and politicians alike.
Endangered Orangutans and the Palm Oil IndustryProject Purpose.docxchristinemaritza
Â
Endangered Orangutans and the Palm Oil Industry
Project Purpose
In this project, you will evaluate the business decision the Tengku needs to make to keep his company a viable commercial opportunity The purpose of this assignment is to develop the critical thinking and decision making skills necessary to make a contemporary business decision. Along with critical thinking skills, you will develop research, communication and data evaluation skills.
Outcomes You Will Meet by Completing This Project:
· applies the basic steps of the MDQ model to make a sound business decision
· describes and explains the reasoning behind the application steps used and the ultimate decision
· demonstrate the use of collaboration to help determine the final decision
· analyze, evaluate and explain both the decision factors in making the decision as well as the stakeholders involved
Setting the Stage
Palm oil is the most widely consumed vegetable oil on Earth. Referred to as the “Miracle Crop” (Wan, 2017) it can be found in seventy-one percent of most supermarket food products like pizza and doughnuts, 24 percent of cosmetic products like lipstick and makeup, and five percent for energy uses like heating fuel (Deutsch bank, 2015). Known as a super food, the demand for palm oil is already high, and it is expected to triple by 2050 (Deutsch Bank (db), 2015).
Currently Malaysia, Indonesia and India produce 50 of the 56 million tons needed to meet international consumer demand. While the production of Palm Oil promotes economic development badly needed in these countries, it does not come without serious environmental and social consequences (Deutsch Bank(db), 2015).
One prominent side effect of the deforestation caused by the rapid growth of palm oil production is the reduction of the Orangutan population. It is estimated that over fifty thousand Orangutans died because of palm oil production in the last 20 years. It is also estimated that 2,000- 3,000 die every year (Orangutan. n.d.). The guestimates by experts suggest that in the next 30-50 years those found in the wild will be extinct. Environmentalists are attempting to stave off the extinction by creating refuges on nearby islands and transporting the remaining Orangutans from Borneo (where most Orangutans have traditionally lived) to the sanctuaries (Emont, 2017).
Orangutan’s are not the only victims of the increased number of palm oil plantations, but humans also suffer from the side effects. A study estimated that 91,600 people in Indonesia, 6,500 in Malaysia and 2,200 in Singapore may have died prematurely because of exposure to fine particle pollution from burning forests (France-Presse, 2016).
The large destruction of rain forests by plantation owners and its effect on global climate is also a serious problem brought about by palm oil production. Deforestation is a significant contributor to climate change; when the forests are lost, carbon is released into the atmosphere, causing the climate to heat up.
Policy, achievement and competitiveness of sustainable palm oil for the globa...CIFOR-ICRAF
Â
Presented by Musdhalifah Machmud (Deputy Minister for Food and Agribisnis, Coordinating Ministry for Economic Affairs) at "GCRF TRADE Hub high-level policy dialogue: Indonesian Palm Oil Sustainability to Address the EU Deforestation-free Regulation and FOLU Net Sink 2030", on 4 Apr 2023
Indonesian Government's Commitment in Achieving Sustainable Developmet of Pal...CIFOR-ICRAF
Â
Presented by Moch. Edy Yusuf, Assistant to Deputy Minister for Estate Crops' Agribusiness Development at G20 - Recover Together, Recover Stronger: Advancing global trade in sustainable palm oil to benefit the planet and its people on 22 March 2022.
Presentation by Dr. Ruslan Abdullah, Director, Science, Environment and Sustainability Division, MPOC
was presented during Techno-Economic Marketing for Palm Oil (TEMPO) in Algeria 2022
Bioplastics are regarded as a potential solution to address
environmental and economic challenges. They represent the
fastest-growing product line for bio-based products. Several
countries have taken action and significantly increased awareness of the use of bioplastics.
As a land of agriculture, Thailand enjoys competitive advantages in the bioplastics industry. The richness of biomass,materials supply, research driven resources, strong downstream industry demand, and supporting government Moreover, Thailand has the necessary workforce and supporting organizations to encourage a vibrant agricultural products.
ASEAN Macroeconomic Trends_Indonesia’s Economic Growth for 3Q Remained Buoyan...Kyna Tsai
Â
During the period of 1–15 November, Indonesia reported its economic growth rate (real GDP growth rate) for 3Q at 5.1%, levelling off from the 5.0% for 2Q. The central banks of Thailand, Malaysia, and the Philippines decided to maintain their policy interest rates at their respective monetary policy meetings. Retail sales in Singapore were affected by seasonal factors and showed negative growth for the first time in seven months. For more information, refer to the list of macroeconomic indices released over 1–15 November at the end of this report.
ASEAN Macroeconomic Trends_Malaysia Announces Budget Draft, Looks to Provide ...Kyna Tsai
Â
During 16–31 October, Indonesia estimated its growth rate for 2018 at 5.4% YoY within the budget that it recently established for the next financial year, with the government predicting that the country’s economic growth will accelerate gradually in comparison to 2017. In addition, the budget draft proposed to the Parliament of Malaysia for the next financial year estimated the country’s growth at 5.0–5.5% YoY, which remains at a high level despite minor deceleration. Another important activity took place in the southern region of the Philippines, where a five-month-long conflict between a militant group operating under the name “Islamic State” (IS) and the country’s military came to a close.
More Related Content
Similar to SPEEDA INSIGHTS_Indonesian and Malaysian Palm Oil Industry at Critical Crossroads, given EU Resolution to Ban Palm Oil in Biofuels by 2020?
Environmental impact of indonesian crude palm oil industryAbida Muttaqiena
Â
This short paper talks about circumstances around crude oil industry in Indonesia that is being widely talked by environmentalist and politicians alike.
Endangered Orangutans and the Palm Oil IndustryProject Purpose.docxchristinemaritza
Â
Endangered Orangutans and the Palm Oil Industry
Project Purpose
In this project, you will evaluate the business decision the Tengku needs to make to keep his company a viable commercial opportunity The purpose of this assignment is to develop the critical thinking and decision making skills necessary to make a contemporary business decision. Along with critical thinking skills, you will develop research, communication and data evaluation skills.
Outcomes You Will Meet by Completing This Project:
· applies the basic steps of the MDQ model to make a sound business decision
· describes and explains the reasoning behind the application steps used and the ultimate decision
· demonstrate the use of collaboration to help determine the final decision
· analyze, evaluate and explain both the decision factors in making the decision as well as the stakeholders involved
Setting the Stage
Palm oil is the most widely consumed vegetable oil on Earth. Referred to as the “Miracle Crop” (Wan, 2017) it can be found in seventy-one percent of most supermarket food products like pizza and doughnuts, 24 percent of cosmetic products like lipstick and makeup, and five percent for energy uses like heating fuel (Deutsch bank, 2015). Known as a super food, the demand for palm oil is already high, and it is expected to triple by 2050 (Deutsch Bank (db), 2015).
Currently Malaysia, Indonesia and India produce 50 of the 56 million tons needed to meet international consumer demand. While the production of Palm Oil promotes economic development badly needed in these countries, it does not come without serious environmental and social consequences (Deutsch Bank(db), 2015).
One prominent side effect of the deforestation caused by the rapid growth of palm oil production is the reduction of the Orangutan population. It is estimated that over fifty thousand Orangutans died because of palm oil production in the last 20 years. It is also estimated that 2,000- 3,000 die every year (Orangutan. n.d.). The guestimates by experts suggest that in the next 30-50 years those found in the wild will be extinct. Environmentalists are attempting to stave off the extinction by creating refuges on nearby islands and transporting the remaining Orangutans from Borneo (where most Orangutans have traditionally lived) to the sanctuaries (Emont, 2017).
Orangutan’s are not the only victims of the increased number of palm oil plantations, but humans also suffer from the side effects. A study estimated that 91,600 people in Indonesia, 6,500 in Malaysia and 2,200 in Singapore may have died prematurely because of exposure to fine particle pollution from burning forests (France-Presse, 2016).
The large destruction of rain forests by plantation owners and its effect on global climate is also a serious problem brought about by palm oil production. Deforestation is a significant contributor to climate change; when the forests are lost, carbon is released into the atmosphere, causing the climate to heat up.
Policy, achievement and competitiveness of sustainable palm oil for the globa...CIFOR-ICRAF
Â
Presented by Musdhalifah Machmud (Deputy Minister for Food and Agribisnis, Coordinating Ministry for Economic Affairs) at "GCRF TRADE Hub high-level policy dialogue: Indonesian Palm Oil Sustainability to Address the EU Deforestation-free Regulation and FOLU Net Sink 2030", on 4 Apr 2023
Indonesian Government's Commitment in Achieving Sustainable Developmet of Pal...CIFOR-ICRAF
Â
Presented by Moch. Edy Yusuf, Assistant to Deputy Minister for Estate Crops' Agribusiness Development at G20 - Recover Together, Recover Stronger: Advancing global trade in sustainable palm oil to benefit the planet and its people on 22 March 2022.
Presentation by Dr. Ruslan Abdullah, Director, Science, Environment and Sustainability Division, MPOC
was presented during Techno-Economic Marketing for Palm Oil (TEMPO) in Algeria 2022
Bioplastics are regarded as a potential solution to address
environmental and economic challenges. They represent the
fastest-growing product line for bio-based products. Several
countries have taken action and significantly increased awareness of the use of bioplastics.
As a land of agriculture, Thailand enjoys competitive advantages in the bioplastics industry. The richness of biomass,materials supply, research driven resources, strong downstream industry demand, and supporting government Moreover, Thailand has the necessary workforce and supporting organizations to encourage a vibrant agricultural products.
Similar to SPEEDA INSIGHTS_Indonesian and Malaysian Palm Oil Industry at Critical Crossroads, given EU Resolution to Ban Palm Oil in Biofuels by 2020? (20)
ASEAN Macroeconomic Trends_Indonesia’s Economic Growth for 3Q Remained Buoyan...Kyna Tsai
Â
During the period of 1–15 November, Indonesia reported its economic growth rate (real GDP growth rate) for 3Q at 5.1%, levelling off from the 5.0% for 2Q. The central banks of Thailand, Malaysia, and the Philippines decided to maintain their policy interest rates at their respective monetary policy meetings. Retail sales in Singapore were affected by seasonal factors and showed negative growth for the first time in seven months. For more information, refer to the list of macroeconomic indices released over 1–15 November at the end of this report.
ASEAN Macroeconomic Trends_Malaysia Announces Budget Draft, Looks to Provide ...Kyna Tsai
Â
During 16–31 October, Indonesia estimated its growth rate for 2018 at 5.4% YoY within the budget that it recently established for the next financial year, with the government predicting that the country’s economic growth will accelerate gradually in comparison to 2017. In addition, the budget draft proposed to the Parliament of Malaysia for the next financial year estimated the country’s growth at 5.0–5.5% YoY, which remains at a high level despite minor deceleration. Another important activity took place in the southern region of the Philippines, where a five-month-long conflict between a militant group operating under the name “Islamic State” (IS) and the country’s military came to a close.
ASEAN Macroeconomic Trends_Indonesia Continues to Lower Interest Rates; Vietn...Kyna Tsai
Â
During 16–30 September, amongst the participating countries in ASEAN, the central banks of Indonesia,
Thailand, and the Philippines each held monetary policy meetings, and Indonesia’s second consecutive
decision to lower its interest rates is worth attention. Furthermore, Vietnam exhibited a high real GDP
growth rate for 3Q, recording 7.5%. Please refer to the table attached at the end of this report for an
overview of the macroeconomic indices for ASEAN economies released during 16–30 September.
ASEAN Macroeconomic Trends_Malaysia and the Philippines Undergoing Rapid Grow...Kyna Tsai
Â
Of the critical macroeconomic indicators released for the ASEAN economies from 16–31 August, Thailand, Malaysia, and the Philippines announced their real economic growth rates (GDP growth rates) for 2Q 2017. The central banks of Indonesia and Thailand also held monetary policy meetings.
This report will focus on and look into the indices and economic policies of Indonesia, Thailand, Malaysia, and the Philippines, as well as the stirring political trends concerning the former Thai Prime Minister Yingluck Shinawatra.
“ASEAN Macroeconomic Trends” is a new series of SPEEDA reports released once every two weeks, compiled by Takashi Kawabata, our Chief Asia Economist. With macroeconomic indicators and financial policies as the fundamentals, the reports look into public economic policies when there are significant moves, as well as political and social issues that may affect economic and business trends.
SPEEDA INSIGHTS_A Brief Glance at Japan's Mobile Communications Related Indus...Kyna Tsai
Â
A special edition for industries related to Mobile Communications, featuring the three main telecom carriers in Japan and companies in the smartphone-related field.
Turin Startup Ecosystem 2024 - Ricerca sulle Startup e il Sistema dell'Innov...Quotidiano Piemontese
Â
Turin Startup Ecosystem 2024
Una ricerca de il Club degli Investitori, in collaborazione con ToTeM Torino Tech Map e con il supporto della ESCP Business School e di Growth Capital
Empowering the Unbanked: The Vital Role of NBFCs in Promoting Financial Inclu...Vighnesh Shashtri
Â
In India, financial inclusion remains a critical challenge, with a significant portion of the population still unbanked. Non-Banking Financial Companies (NBFCs) have emerged as key players in bridging this gap by providing financial services to those often overlooked by traditional banking institutions. This article delves into how NBFCs are fostering financial inclusion and empowering the unbanked.
how can I sell pi coins after successfully completing KYCDOT TECH
Â
Pi coins is not launched yet in any exchange đź’± this means it's not swappable, the current pi displaying on coin market cap is the iou version of pi. And you can learn all about that on my previous post.
RIGHT NOW THE ONLY WAYÂ you can sell pi coins is through verified pi merchants. A pi merchant is someone who buys pi coins and resell them to exchanges and crypto whales. Looking forward to hold massive quantities of pi coins before the mainnet launch.
This is because pi network is not doing any pre-sale or ico offerings, the only way to get my coins is from buying from miners. So a merchant facilitates the transactions between the miners and these exchanges holding pi.
I and my friends has sold more than 6000 pi coins successfully with this method. I will be happy to share the contact of my personal pi merchant. The one i trade with, if you have your own merchant you can trade with them. For those who are new.
Message: @Pi_vendor_247 on telegram.
I wouldn't advise you selling all percentage of the pi coins. Leave at least a before so its a win win during open mainnet. Have a nice day pioneers ♥️
#kyc #mainnet #picoins #pi #sellpi #piwallet
#pinetwork
what is the future of Pi Network currency.DOT TECH
Â
The future of the Pi cryptocurrency is uncertain, and its success will depend on several factors. Pi is a relatively new cryptocurrency that aims to be user-friendly and accessible to a wide audience. Here are a few key considerations for its future:
Message: @Pi_vendor_247 on telegram if u want to sell PI COINS.
1. Mainnet Launch: As of my last knowledge update in January 2022, Pi was still in the testnet phase. Its success will depend on a successful transition to a mainnet, where actual transactions can take place.
2. User Adoption: Pi's success will be closely tied to user adoption. The more users who join the network and actively participate, the stronger the ecosystem can become.
3. Utility and Use Cases: For a cryptocurrency to thrive, it must offer utility and practical use cases. The Pi team has talked about various applications, including peer-to-peer transactions, smart contracts, and more. The development and implementation of these features will be essential.
4. Regulatory Environment: The regulatory environment for cryptocurrencies is evolving globally. How Pi navigates and complies with regulations in various jurisdictions will significantly impact its future.
5. Technology Development: The Pi network must continue to develop and improve its technology, security, and scalability to compete with established cryptocurrencies.
6. Community Engagement: The Pi community plays a critical role in its future. Engaged users can help build trust and grow the network.
7. Monetization and Sustainability: The Pi team's monetization strategy, such as fees, partnerships, or other revenue sources, will affect its long-term sustainability.
It's essential to approach Pi or any new cryptocurrency with caution and conduct due diligence. Cryptocurrency investments involve risks, and potential rewards can be uncertain. The success and future of Pi will depend on the collective efforts of its team, community, and the broader cryptocurrency market dynamics. It's advisable to stay updated on Pi's development and follow any updates from the official Pi Network website or announcements from the team.
What price will pi network be listed on exchangesDOT TECH
Â
The rate at which pi will be listed is practically unknown. But due to speculations surrounding it the predicted rate is tends to be from 30$ — 50$.
So if you are interested in selling your pi network coins at a high rate tho. Or you can't wait till the mainnet launch in 2026. You can easily trade your pi coins with a merchant.
A merchant is someone who buys pi coins from miners and resell them to Investors looking forward to hold massive quantities till mainnet launch.
I will leave the telegram contact of my personal pi vendor to trade with.
@Pi_vendor_247
when will pi network coin be available on crypto exchange.DOT TECH
Â
There is no set date for when Pi coins will enter the market.
However, the developers are working hard to get them released as soon as possible.
Once they are available, users will be able to exchange other cryptocurrencies for Pi coins on designated exchanges.
But for now the only way to sell your pi coins is through verified pi vendor.
Here is the telegram contact of my personal pi vendor
@Pi_vendor_247
how to sell pi coins on Bitmart crypto exchangeDOT TECH
Â
Yes. Pi network coins can be exchanged but not on bitmart exchange. Because pi network is still in the enclosed mainnet. The only way pioneers are able to trade pi coins is by reselling the pi coins to pi verified merchants.
A verified merchant is someone who buys pi network coins and resell it to exchanges looking forward to hold till mainnet launch.
I will leave the telegram contact of my personal pi merchant to trade with.
@Pi_vendor_247
what is the best method to sell pi coins in 2024DOT TECH
Â
The best way to sell your pi coins safely is trading with an exchange..but since pi is not launched in any exchange, and second option is through a VERIFIED pi merchant.
Who is a pi merchant?
A pi merchant is someone who buys pi coins from miners and pioneers and resell them to Investors looking forward to hold massive amounts before mainnet launch in 2026.
I will leave the telegram contact of my personal pi merchant to trade pi coins with.
@Pi_vendor_247
US Economic Outlook - Being Decided - M Capital Group August 2021.pdfpchutichetpong
Â
The U.S. economy is continuing its impressive recovery from the COVID-19 pandemic and not slowing down despite re-occurring bumps. The U.S. savings rate reached its highest ever recorded level at 34% in April 2020 and Americans seem ready to spend. The sectors that had been hurt the most by the pandemic specifically reduced consumer spending, like retail, leisure, hospitality, and travel, are now experiencing massive growth in revenue and job openings.
Could this growth lead to a “Roaring Twenties”? As quickly as the U.S. economy contracted, experiencing a 9.1% drop in economic output relative to the business cycle in Q2 2020, the largest in recorded history, it has rebounded beyond expectations. This surprising growth seems to be fueled by the U.S. government’s aggressive fiscal and monetary policies, and an increase in consumer spending as mobility restrictions are lifted. Unemployment rates between June 2020 and June 2021 decreased by 5.2%, while the demand for labor is increasing, coupled with increasing wages to incentivize Americans to rejoin the labor force. Schools and businesses are expected to fully reopen soon. In parallel, vaccination rates across the country and the world continue to rise, with full vaccination rates of 50% and 14.8% respectively.
However, it is not completely smooth sailing from here. According to M Capital Group, the main risks that threaten the continued growth of the U.S. economy are inflation, unsettled trade relations, and another wave of Covid-19 mutations that could shut down the world again. Have we learned from the past year of COVID-19 and adapted our economy accordingly?
“In order for the U.S. economy to continue growing, whether there is another wave or not, the U.S. needs to focus on diversifying supply chains, supporting business investment, and maintaining consumer spending,” says Grace Feeley, a research analyst at M Capital Group.
While the economic indicators are positive, the risks are coming closer to manifesting and threatening such growth. The new variants spreading throughout the world, Delta, Lambda, and Gamma, are vaccine-resistant and muddy the predictions made about the economy and health of the country. These variants bring back the feeling of uncertainty that has wreaked havoc not only on the stock market but the mindset of people around the world. MCG provides unique insight on how to mitigate these risks to possibly ensure a bright economic future.
The secret way to sell pi coins effortlessly.DOT TECH
Â
Well as we all know pi isn't launched yet. But you can still sell your pi coins effortlessly because some whales in China are interested in holding massive pi coins. And they are willing to pay good money for it. If you are interested in selling I will leave a contact for you. Just telegram this number below. I sold about 3000 pi coins to him and he paid me immediately.
Telegram: @Pi_vendor_247
how to sell pi coins at high rate quickly.DOT TECH
Â
Where can I sell my pi coins at a high rate.
Pi is not launched yet on any exchange. But one can easily sell his or her pi coins to investors who want to hold pi till mainnet launch.
This means crypto whales want to hold pi. And you can get a good rate for selling pi to them. I will leave the telegram contact of my personal pi vendor below.
A vendor is someone who buys from a miner and resell it to a holder or crypto whale.
Here is the telegram contact of my vendor:
@Pi_vendor_247
how to swap pi coins to foreign currency withdrawable.DOT TECH
Â
As of my last update, Pi is still in the testing phase and is not tradable on any exchanges.
However, Pi Network has announced plans to launch its Testnet and Mainnet in the future, which may include listing Pi on exchanges.
The current method for selling pi coins involves exchanging them with a pi vendor who purchases pi coins for investment reasons.
If you want to sell your pi coins, reach out to a pi vendor and sell them to anyone looking to sell pi coins from any country around the globe.
Below is the contact information for my personal pi vendor.
Telegram: @Pi_vendor_247
NO1 Uk Black Magic Specialist Expert In Sahiwal, Okara, Hafizabad, Mandi Bah...Amil Baba Dawood bangali
Â
Contact with Dawood Bhai Just call on +92322-6382012 and we'll help you. We'll solve all your problems within 12 to 24 hours and with 101% guarantee and with astrology systematic. If you want to take any personal or professional advice then also you can call us on +92322-6382012 , ONLINE LOVE PROBLEM & Other all types of Daily Life Problem's.Then CALL or WHATSAPP us on +92322-6382012 and Get all these problems solutions here by Amil Baba DAWOOD BANGALI
#vashikaranspecialist #astrologer #palmistry #amliyaat #taweez #manpasandshadi #horoscope #spiritual #lovelife #lovespell #marriagespell#aamilbabainpakistan #amilbabainkarachi #powerfullblackmagicspell #kalajadumantarspecialist #realamilbaba #AmilbabainPakistan #astrologerincanada #astrologerindubai #lovespellsmaster #kalajaduspecialist #lovespellsthatwork #aamilbabainlahore#blackmagicformarriage #aamilbaba #kalajadu #kalailam #taweez #wazifaexpert #jadumantar #vashikaranspecialist #astrologer #palmistry #amliyaat #taweez #manpasandshadi #horoscope #spiritual #lovelife #lovespell #marriagespell#aamilbabainpakistan #amilbabainkarachi #powerfullblackmagicspell #kalajadumantarspecialist #realamilbaba #AmilbabainPakistan #astrologerincanada #astrologerindubai #lovespellsmaster #kalajaduspecialist #lovespellsthatwork #aamilbabainlahore #blackmagicforlove #blackmagicformarriage #aamilbaba #kalajadu #kalailam #taweez #wazifaexpert #jadumantar #vashikaranspecialist #astrologer #palmistry #amliyaat #taweez #manpasandshadi #horoscope #spiritual #lovelife #lovespell #marriagespell#aamilbabainpakistan #amilbabainkarachi #powerfullblackmagicspell #kalajadumantarspecialist #realamilbaba #AmilbabainPakistan #astrologerincanada #astrologerindubai #lovespellsmaster #kalajaduspecialist #lovespellsthatwork #aamilbabainlahore #Amilbabainuk #amilbabainspain #amilbabaindubai #Amilbabainnorway #amilbabainkrachi #amilbabainlahore #amilbabaingujranwalan #amilbabainislamabad
Introduction to Indian Financial System ()Avanish Goel
Â
The financial system of a country is an important tool for economic development of the country, as it helps in creation of wealth by linking savings with investments.
It facilitates the flow of funds form the households (savers) to business firms (investors) to aid in wealth creation and development of both the parties
SPEEDA INSIGHTS_Indonesian and Malaysian Palm Oil Industry at Critical Crossroads, given EU Resolution to Ban Palm Oil in Biofuels by 2020?
1. 1
Indonesian and Malaysian Palm Oil Industry at
Critical Crossroads, given EU Resolution to Ban
Palm Oil in Biofuels by 2020?
Chamini Ranathunga
Global Research and Analysis Team 2017-09-22
2. 2
Indonesian and Malaysian Palm Oil Industry at Critical Crossroads, given EU
Resolution to Ban Palm Oil in Biofuels by 2020
Tropical deforestation caused by palm oil cultivation has been an area of ongoing tension between palm
oil producing nations (such as Malaysia and Indonesia) and legislative bodies in Europe. In April 2017, the
European Union (EU) passed a resolution to ban the use of palm oil in various products such as palm oil-
based biofuels by 2020. Simultaneously, the EU is discouraging the use of palm oil in food products
through its recently launched (August 2017) “International Palm Oil Free Certification Accreditation
Programme” (POFCAP).
Being amongst the largest palm oil consumers in the world (third-largest in 2015), the EU’s plan to ban
palm oil imports by 2020 is likely to exert pressure on major producing economies such as Indonesia and
Malaysia. The two countries together contributed around 90% of global palm oil exports in 2016. In our
view, given Indonesia’s and Malaysia’s high exposure to the EU market (export market shares were 14.0%
and 12.0% respectively in 2016), we expect a notable reduction in palm oil export revenue in the coming
period (at a CARC of 6-7% over 2016-20F, both in Indonesia and Malaysia). Consequently, the palm oil ban
is likely to be negative for the balance of trade of both Indonesia and Malaysia, given the importance of
palm oil as one of their major agricultural commodity exports. The impact is likely to become more severe
as India’s import substitution policy on vegetable oil reaches fruition. For instance, considering the worst-
case scenario (a reduction in exports to both the EU and India over 2016-20F), we can expect Indonesia’s
trade deficit to widen to USD 10.9 billion by 2020F from USD 6.1 billion in 2016. Moreover, in Malaysia,
we can anticipate the country’s balance of trade to fall to USD 19.3 billion by 2020F from USD 22.3 billion
in 2016. Although the two countries are focusing on increasing domestic consumption of palm oil (through
improved palm-based biofuels) to counter the impending slump in international demand, the
effectiveness of this strategy is likely to be limited.
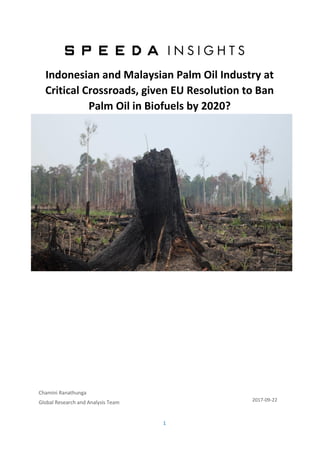
3. 3
Indonesian and Malaysian Palm Oil Industry at Critical Crossroads, given EU
Resolution to Ban Palm Oil in Biofuels by 2020
EU to Phase-Out Use of Palm Oil in Biofuels by 2020; EU amongst Largest Palm Oil Consumers
On 4 April 2017, the European Parliament (EP) approved a resolution to ban the use of palm oil in biofuels
with the intention of alleviating negative environmental impacts such as tropical deforestation and forest
degradation.
The key points adopted by the resolution include the following:
I. Taking measures to phase out the use of vegetable oils that drive deforestation, including palm oil, as a
component of biofuels by 2020;
II. Applying different customs duty schemes that more accurately reflect the real costs associated with the
environmental burden until a single certification scheme is applied;
III. Supporting the setting up of a peatland restoration agency for the purpose of restoring 2 million hectares
(around 18% of the Indonesia palm oil lands) of fire-hit peatland (a forest fire occurred in Indonesia as a
result of forest clearance for palm cultivation in 2015);
IV. Imposing a freeze on the area under oil palm cultivation, including the introduction of a moratorium on
new concessions; and
V. Working closely with other significant consumers of palm oil, such as China and India, and producing
countries, in order to raise their awareness and to explore common solutions to the problem of tropical
deforestation and forest degradation.
In addition to that, a new certification programme, the “International Palm Oil Free Certification
Accreditation Programme” (POFCAP), was launched in August 2017 to enable food producers to
demonstrate that their products are manufactured without the use of palm oil. The POFCAP trademark
will reflect that the products are cruelty-free, certified organic, vegan, and fair trade. The trademark has
already been approved by regulators in Australia and the UK. A further 14 EU countries (including France
and Italy) have applications pending for POFCAP certification.
Source: Statista; United States Department of Agriculture
Note: Latest data available is for 2015
As of 2015, with consumption at 61 million tonnes, palm oil contributed to the bulk of global oil and fats
consumption (share of 28%). Furthermore, as of 2015, India accounted for the bulk of world palm oil
consumption (share of 15.1%), followed by Indonesia (12.0%) and the EU-28 (11.8%). Moreover, currently,
4. 4
Indonesian and Malaysian Palm Oil Industry at Critical Crossroads, given EU
Resolution to Ban Palm Oil in Biofuels by 2020
the EU remains the world’s largest palm oil consumer of biofuels. In 2015, the biofuels and renewable
energy sector accounted for around 60% of the EU’s palm oil consumption. As such, the EU resolution to
ban palm oil on biofuels is likely to have a significant impact on palm oil producing economies.
Source: HIS Markit
Note: Latest data available is for 2015
Source: Greenpalm
Note: Latest data is available for 2015
5. 5
Indonesian and Malaysian Palm Oil Industry at Critical Crossroads, given EU
Resolution to Ban Palm Oil in Biofuels by 2020
Source: Malaysian Palm Oil Council
Note: Latest data available is for 2015
Indonesia and Malaysia Dominate Global Palm Oil Production
Presently, palm oil remains a significant contributor to the world market for vegetable oil. With palm oil
production at around 66 million tonnes, the industry accounted for around one-third of global oil and fats
production in 2016.
Source: Malaysian Palm Oil Board (MPOB)/Oil World
Indonesia and Malaysia continue to dominate the global palm oil market, accounting for more than three-
quarters of global production (as of 2016, Indonesia led the market with a production share of 55.0%,
followed by Malaysia with 30.0%). At present, palm oil remains an important asset for the major producing
countries. In 2015, the palm oil industry accounted for around 6-7% of Indonesia’s GDP (third largest
income generating source in Indonesia after oil & gas and industrial manufacturing) and around 3-4% of
Malaysia’s GDP (third largest income-generating natural commodity in Malaysia after petroleum oil and
timber).
6. 6
Indonesian and Malaysian Palm Oil Industry at Critical Crossroads, given EU
Resolution to Ban Palm Oil in Biofuels by 2020
Source: Malaysian Palm Oil Board (MPOB)
In addition, palm oil remains one of the major trading commodities in Indonesia and Malaysia. The two
countries together controlled around 90% of global palm oil exports in 2016. Moreover, the contribution
of palm oil export revenue to Indonesia’s and Malaysia’s total export revenue remained at 8.3% and 4.6%
respectively in 2016. In Malaysia, India dominated the export basket of palm oil, with a share of 18.9% in
2016, followed by the EU-27 (11.9%) and China (8.8%). Similarly, in Indonesia, India contributed nearly
one-fourth of palm oil export revenue, followed by the EU-27 (14.0%) and China (11.4%).
Source: UN Comtrade (HS: 1511)
Palm oil producers (such as Indonesia and Malaysia) have been criticised over the past years for failing to
prevent rising deforestation due to palm cultivation. Despite growing concerns, in order to meet rising
global palm oil demand (which grew at a CAGR of 3.6% over 2012-16), farmers have been increasing palm
oil harvesting lands (palm oil harvesting lands in Indonesia and Malaysia together increased 18.4% to 16.7
7. 7
Indonesian and Malaysian Palm Oil Industry at Critical Crossroads, given EU
Resolution to Ban Palm Oil in Biofuels by 2020
million hectares during 2011-16, respectively) by clearing biodiversity rich tropical rainforests. During
2000-12 (latest available), Malaysia recorded the world’s highest forest loss (14.4%), followed by Paraguay
(9.6%) and Indonesia (8.4%). This rising deforestation has also been leading to increasing carbon dioxide
emissions, causing immense environmental and health issues. This has been rallying green activists across
the world to fight against unsustainable palm oil cultivation.
Source: Google Forest Map/MONGABAY
Note: Latest data is available for 2012
Although major palm oil industry operators (such as Malaysian palm oil producer Felda Global Ventures)
have started producing palm oil in an environmentally friendly manner, most smallholders are unable to
implement sustainable practices due to a lack of awareness. In the major palm oil economies, around one-
third of palm oil production is derived from small farmers. As of 2015, around 3.7 million people (around
3% of the working population) were employed in the Indonesian palm oil industry, with around 34% of
palm oil production being generated by smallholders. Meanwhile, in Malaysia, 590,000 direct workers
(around 4% of the working population) engaged in palm oil cultivation in 2015, accounting for around 33%
of production derived from smallholders. As such, in Malaysia, sustainable oil palm plantations (oil palm
cultivation that focuses on reducing the impact on forests, farmers, and communities) accounted for only
4.1% (237,509 hectares) of total palm oil harvesting lands in June 2017.
8. 8
Indonesian and Malaysian Palm Oil Industry at Critical Crossroads, given EU
Resolution to Ban Palm Oil in Biofuels by 2020
Source: Indonesian Palm Oil Association (IPOA)/ Malaysian Palm Oil Council (MPOC)
Note: Latest data for Indonesia is available for 2015
Industry in Turmoil; Will Declining International Demand Shake Up Major Palm Oil Economies?
Economic Impact of Declining International Demand
Indonesia Malaysia
2016 2020F 2016 2020F
Scenario 1 Palm Oil Export Revenue
(USD billion)
14.4 11.2 9.1 6.8
Change of Export Revenue
(CARC) Over 2016-20F (%) 6.1% 6.9%
Balance of Trade (USD
billion)
-6.1 -9.3 22.3 20.0
Scenario 2 Palm Oil Export Revenue
(USD billion)
14.4 9.6 9.1 6
Change of Export Revenue
(CARC) Over 2016-20F (%) 9.5% 9.6%
Balance of Trade (USD
billion)
-6.1 -10.9 22.3 19.3
Scenario 3 Palm Oil Export Revenue
(USD billion)
14.4 9.6 9.1 6.0
Change of Export Revenue
(CARC) Over 2016-20F (%) 9.5% 9.6%
Balance of Trade (USD
billion)
-6.1 -10.9 22.3 19.3
Source: Projected by UZABASE based on UN Comtrade (HS 1511)/MPOB/MPOC/ and IPOA data
Note: Figures from 2016 onwards are forecasts
9. 9
Indonesian and Malaysian Palm Oil Industry at Critical Crossroads, given EU
Resolution to Ban Palm Oil in Biofuels by 2020
Our Forecasting Assumptions
Scenario 1 • EU to ban palm oil by 2020
Percentage change of export volume
(Import usage on biofuels: -40% YoY by 2018, -80% YoY by 2019, -100% YoY by 2020)
(Import usage on food: -40% YoY by 2018, -40% YoY by 2019, -40% YoY by 2020)
(Import usage on other products: -25% YoY by 2018, -25% YoY by 2019, -25% YoY by 2020)
• EU to discourage the use of palm oil in food and other products
• India’s demand for palm oil remains unchanged
• Domestic demand remains unchanged
• Other trading activities except palm exports remain unchanged
• The contribution of the palm oil industry to Indonesian and Malaysian GDP is expected to stay
constant at 6.5% and 3.2% respectively over 2012-16.
Scenario 2 • EU to ban palm oil by 2020
Percentage change of export volume
(Import usage on biofuels: -40% YoY by 2018, -80% YoY by 2019, -100% YoY by 2020)
(Import usage on food: -40% YoY by 2018, -40% YoY by 2019, -40% YoY by 2020)
(Import usage on other products: -25% YoY by 2018, -25% YoY by 2019, -25% YoY by 2020)
• EU to discourage the use of palm oil in food and other products
• India to discourage palm oil imports
Percentage change of export volume
(-30% YoY by 2018, -15% YoY by 2019, -15% YoY by 2020)
• Domestic demand remains unchanged
• Other trading activities except palm exports remain unchanged
• The contribution of the palm oil industry to Indonesian and Malaysian GDP is expected to stay
constant at 6.5% and 3.2% respectively over 2012-16.
Scenario 3 • EU to ban palm oil by 2020
Percentage change of export volume
(Import usage on biofuels: -40% YoY by 2018, -80% YoY by 2019, -100% YoY by 2020)
(Import usage on food: -40% YoY by 2018, -40% YoY by 2019, -40% YoY by 2020)
(Import usage on other products: -25% YoY by 2018, -25% YoY by 2019, -25% YoY by 2020)
• EU to discourage the use of palm oil in food and other products
• India to discourage palm oil imports
Percentage change of export volume
(-30% YoY by 2018, -15% YoY by 2019, -15% YoY by 2020)
• Malaysia and Indonesia to increase domestic palm oil consumption through biofuels
• Other trading activities except palm exports remain unchanged
• The contribution of the palm oil industry to Indonesian and Malaysian GDP is expected to stay
constant at 6.5% and 3.2% respectively over 2012-16
Source: by UZABASE
Scenario 1
All other things remaining constant, we estimate the decline in international demand on the back of the
EU ban to negatively impact export revenue in both Malaysia and Indonesia, given the significance of palm
oil as a major agricultural commodity export. This in turn is likely to adversely affect the two countries’
balance of trade. As such, we expect Indonesia’s export revenue from palm oil to decline at a CARC of
6.1% over 2016-20F and its trade deficit to widen to USD 9.3 billion by 2020F from USD 6.1 billion in 2016.
Similarly, we expect Malaysian export revenue from palm oil to decline at a CARC of 6.9% over 2016-20F
and its trade surplus to narrow to USD 20.0 billion by 2020F from USD 22.3 billion in 2016.
10. 10
Indonesian and Malaysian Palm Oil Industry at Critical Crossroads, given EU
Resolution to Ban Palm Oil in Biofuels by 2020
Scenario 2
The impact is likely to be aggravated by India’s renewed commitment to encouraging domestic vegetable
oil production by cutting palm oil imports. The world’s largest palm oil buyer, India doubled its import
duties on crude and refined edible oil imports in August 2017 with the aim of protecting local oilseed
farmers from cheaper vegetable imports.
India: Import Duties on Palm Oil
Product Category Import Duty (before August 2017) Import Duty (August 2017 onwards)
Crude Palm Oil 7.5% 15.0%
Refined Palm Oil 15.0% 25.0%
Source: Compiled by UZABASE based on various industry sources
The combined market share of India and the EU accounted for around one-third of Malaysian and
Indonesian palm oil exports in 2016. Therefore, the negative impact of declining exports to both India and
the EU should significantly impact the two countries’ balance of trade. Taking into account the combined
effect of the reduction of the EU and Indian palm oil exports, we expect Indonesian and Malaysian export
revenue from palm oil to fall at a CARC of around 9-10% over 2016-20F. As a result, we expect Indonesia’s
trade deficit to widen to USD 10.9 billion by 2020F from USD 6.1 billion in 2016. We expect the Malaysian
trade surplus to narrow to USD 19.3 billion by 2020F from USD 22.3 billion in 2016.
Malaysia and Indonesia to Increase Domestic Consumption to Counter Falling International
Demand
Scenario 3
In order to mitigate the negative impact of declining international demand, Malaysia and Indonesia are
focusing on increasing domestic palm oil consumption through biofuel mandates. Presently, Indonesia
and Malaysia follow the B10 biofuel mandate (blends of 90% petroleum diesel with 10% biofuel) in the
transportation sector. Indonesia and Malaysia hope to increase their biofuel mandates to B25 and B20
respectively by 2020F. However, the practicality of increasing domestic consumption through biofuels is
uncertain, as it takes considerable time and effort to execute the policies within a predefined time frame.
For instance, Malaysia’s current B10 policy was initially planned to be implemented by 2015; its actual roll
out took place in 1H2017. This was due to increasing concerns from vehicle suppliers on the alleged
adverse impact of biofuels on diesel engines. Moreover, in both countries, the contribution of palm oil
used in biofuels towards domestic palm oil production remains low (Indonesia: 10.7%; Malaysia: 2.0% in
2016). Therefore, the effectiveness of this strategy to counteract reducing palm oil demand is limited.
Indonesia
2012 2013 2014 2015 2016 2017F 2018F 2019F 2020F
Blend Rate 2.2% 3.5% 5.6% 3.2% 10.2% 10.2% 20.0% 20.0% 25.0%
Palm Oil Use in
Biofuel (1,000
MT)
2,024 2,576 2,760 1,086 3,363 3,363 6,726 6,726 8,243
Contribution to
Domestic
Production
7.6% 8.6% 8.8% 3.3% 10.7% 10.9% 21.3% 22.6% 27.3%
Source: Projected by UZABASE based on UN Comtrade (HS 1511)/MPOB/MPOC/ and IPOA data
11. 11
Indonesian and Malaysian Palm Oil Industry at Critical Crossroads, given EU
Resolution to Ban Palm Oil in Biofuels by 2020
Note: figures from 2016 onwards are forecasted
Malaysia
2012 2013 2014 2015 2016 2017F 2018F 2019F 2020F
Blend Rate 2.0% 2.7% 5.0% 7.0% 7.0% 10.0% 10.0% 10.0% 20.0%
Palm Oil Use in
Biofuel (1,000
MT)
103 329 263 361 341 379 379 379 758
Contribution to
Domestic
Production
0.5% 1.7% 1.3% 1.8% 2.0% 2.4% 2.6% 2.8% 5.6%
Source: Projected by UZABASE based on UN Comtrade (HS 1511)/MPOB/MPOC/ and IPOA data
Note: figures from 2016 onwards are forecasted
Annexure
1) Scenario 1
Indonesia
2012 2013 2014 2015 2016 2017F 2018F 2019F 2020F
Palm Oil
Industry as a %
of GDP
6.5% 6.5% 6.5% 6.5% 6.5% 6.2% 5.8% 5.4% 5.1%
Export Revenue
(USD billion)
17.6 15.8 17.5 15.4 14.4 13.9 12.9 11.8 11.2
Export Revenue
YoY Change
2.0% -10.0% 10.3% -11.9% -6.6% -3.0% -7.4% -8.2% -5.6%
Palm Oil Export
Revenue as a %
of Total Export
Revenue
9.3% 8.7% 9.9% 8.8% 8.3% 8.1% 7.5% 6.9% 6.6%
EU Contribution
to Palm Oil
Export Revenue
(%)
13.8% 16.4% 16.3% 14.0% 14.3% 12.4% 8.2% 3.2% 1.5%
Balance of Trade
(USD billion)
-1.9 -6.2 -3.0 -5.1 -6.1 -6.6 -7.6 -8.7 -9.3
Source: Projected by UZABASE based on UN Comtrade (HS 1511)/MPOB/MPOC/ and IPOA data
Note: figures from 2016 onwards are forecasted
12. 12
Indonesian and Malaysian Palm Oil Industry at Critical Crossroads, given EU
Resolution to Ban Palm Oil in Biofuels by 2020
Malaysia
2012 2013 2014 2015 2016 2017F 2018F 2019F 2020F
Palm Oil
Industry as a %
of GDP
3.2% 3.2% 3.2% 3.2% 3.2% 2.9% 2.6% 2.3% 2.1%
Export Revenue
(USD billion)
15.4 12.3 12.0 9.5 9.1 8.4 7.8 7.2 6.8
Export Revenue
YoY Change
-11.7% -20.3% -2.4% -20.8% -4.6% -7.5% -6.9% -7.6% -5.8%
Palm Oil Export
Revenue as a %
of Total Export
Revenue
6.8% 5.4% 5.1% 4.7% 4.5% 4.2% 3.9% 3.6% 3.4%
EU Contribution
to Palm Oil
Export Revenue
(%)
12.5% 12.0% 13.1% 13.7% 12.0% 9.8% 6.6% 2.9% 1.5%
Balance of Trade
(USD billion)
33.9 27.5 31.3 22.7 22.3 21.6 21.0 20.4 20.0
Source: Projected by UZABASE based on UN Comtrade (HS 1511)/MPOB/MPOC/ and IPOA data
Note: figures from 2016 onwards are forecasted
1) Scenario 2
Indonesia
2012 2013 2014 2015 2016 2017F 2018F 2019F 2020F
Palm Oil
Industry as a %
of GDP
6.5% 6.5% 6.5% 6.5% 6.5% 6.1% 5.4% 4.8% 4.3%
Export Revenue
(USD billion)
17.6 15.8 17.5 15.4 14.4 13.7 11.8 10.5 9.6
Export Revenue
YoY Change
2.0% -10.0% 10.3% -11.9% -6.6% -4.9% -13.8% -11.1% -8.0%
Palm Oil Export
Revenue as a %
of Total Export
Revenue
9.3% 8.7% 9.9% 8.8% 8.3% 7.9% 6.9% 6.2% 5.7%
India’s
Contribution to
Palm Oil Export
Revenue (%)
27.9% 27.4% 21.3% 21.7% 23.8% 22.8% 18.3% 17.3% 15.7%
Balance of Trade
(USD billion)
-1.9 -6.2 -3.0 -5.1 -6.1 -6.8 -8.7 -10.0 -10.9
Source: Projected by UZABASE based on UN Comtrade (HS 1511)/MPOB/MPOC/ and IPOA data
Note: figures from 2016 onwards are forecasted
13. 13
Indonesian and Malaysian Palm Oil Industry at Critical Crossroads, given EU
Resolution to Ban Palm Oil in Biofuels by 2020
Malaysia
2012 2013 2014 2015 2016 2017F 2018F 2019F 2020F
Palm Oil
Industry as a %
of GDP
3.2% 3.2% 3.2% 3.2% 3.2% 2.8% 2.4% 2.1% 1.9%
Export Revenue
(USD billion)
15.4 12.3 12.0 9.5 9.1 8.0 7.1 6.5 6.0
Export Revenue
YoY Change
-11.7% -20.3% -2.4% -20.8% -4.6% -11.3% -11.1% -9.1% -6.9%
Palm Oil Export
Revenue as a %
of Total Export
Revenue
6.8% 5.4% 5.1% 4.7% 4.5% 4.0% 3.6% 3.3% 3.1%
India’s
Contribution to
Palm Oil Export
Revenue (%)
16.2% 14.5% 20.2% 23.9% 20.2% 16.9% 13.2% 12.1% 10.9%
Balance of Trade
(USD billion)
33.9 27.5 31.3 22.7 22.3 21.3 20.4 19.7 19.3
Source: Projected by UZABASE based on UN Comtrade (HS 1511)/MPOB/MPOC/ and IPOA data
Note: figures from 2016 onwards are forecasted