Download to read offline
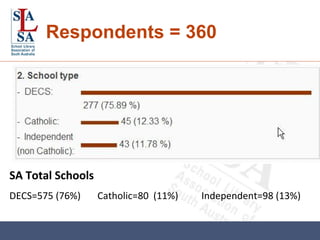
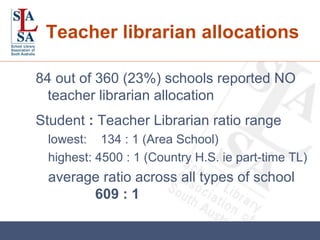
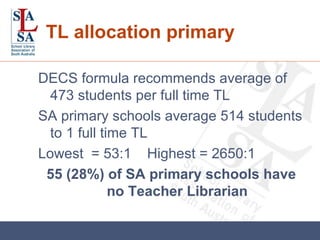
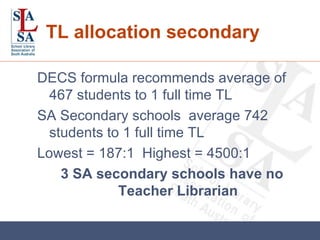
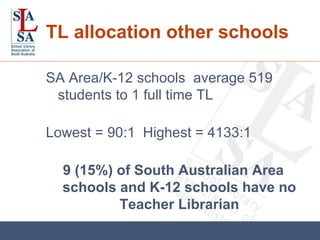
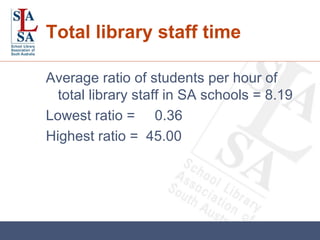

The South Australian school library survey conducted in Term 4 of 2008 assessed 360 schools, revealing a teacher librarian allocation in only 23% of responding schools. The average student-to-teacher librarian ratio was 609:1, with significant variations across different school types and regions. Moreover, 28% of primary schools and 15% of area/K-12 schools reported having no teacher librarian allocation at all.


