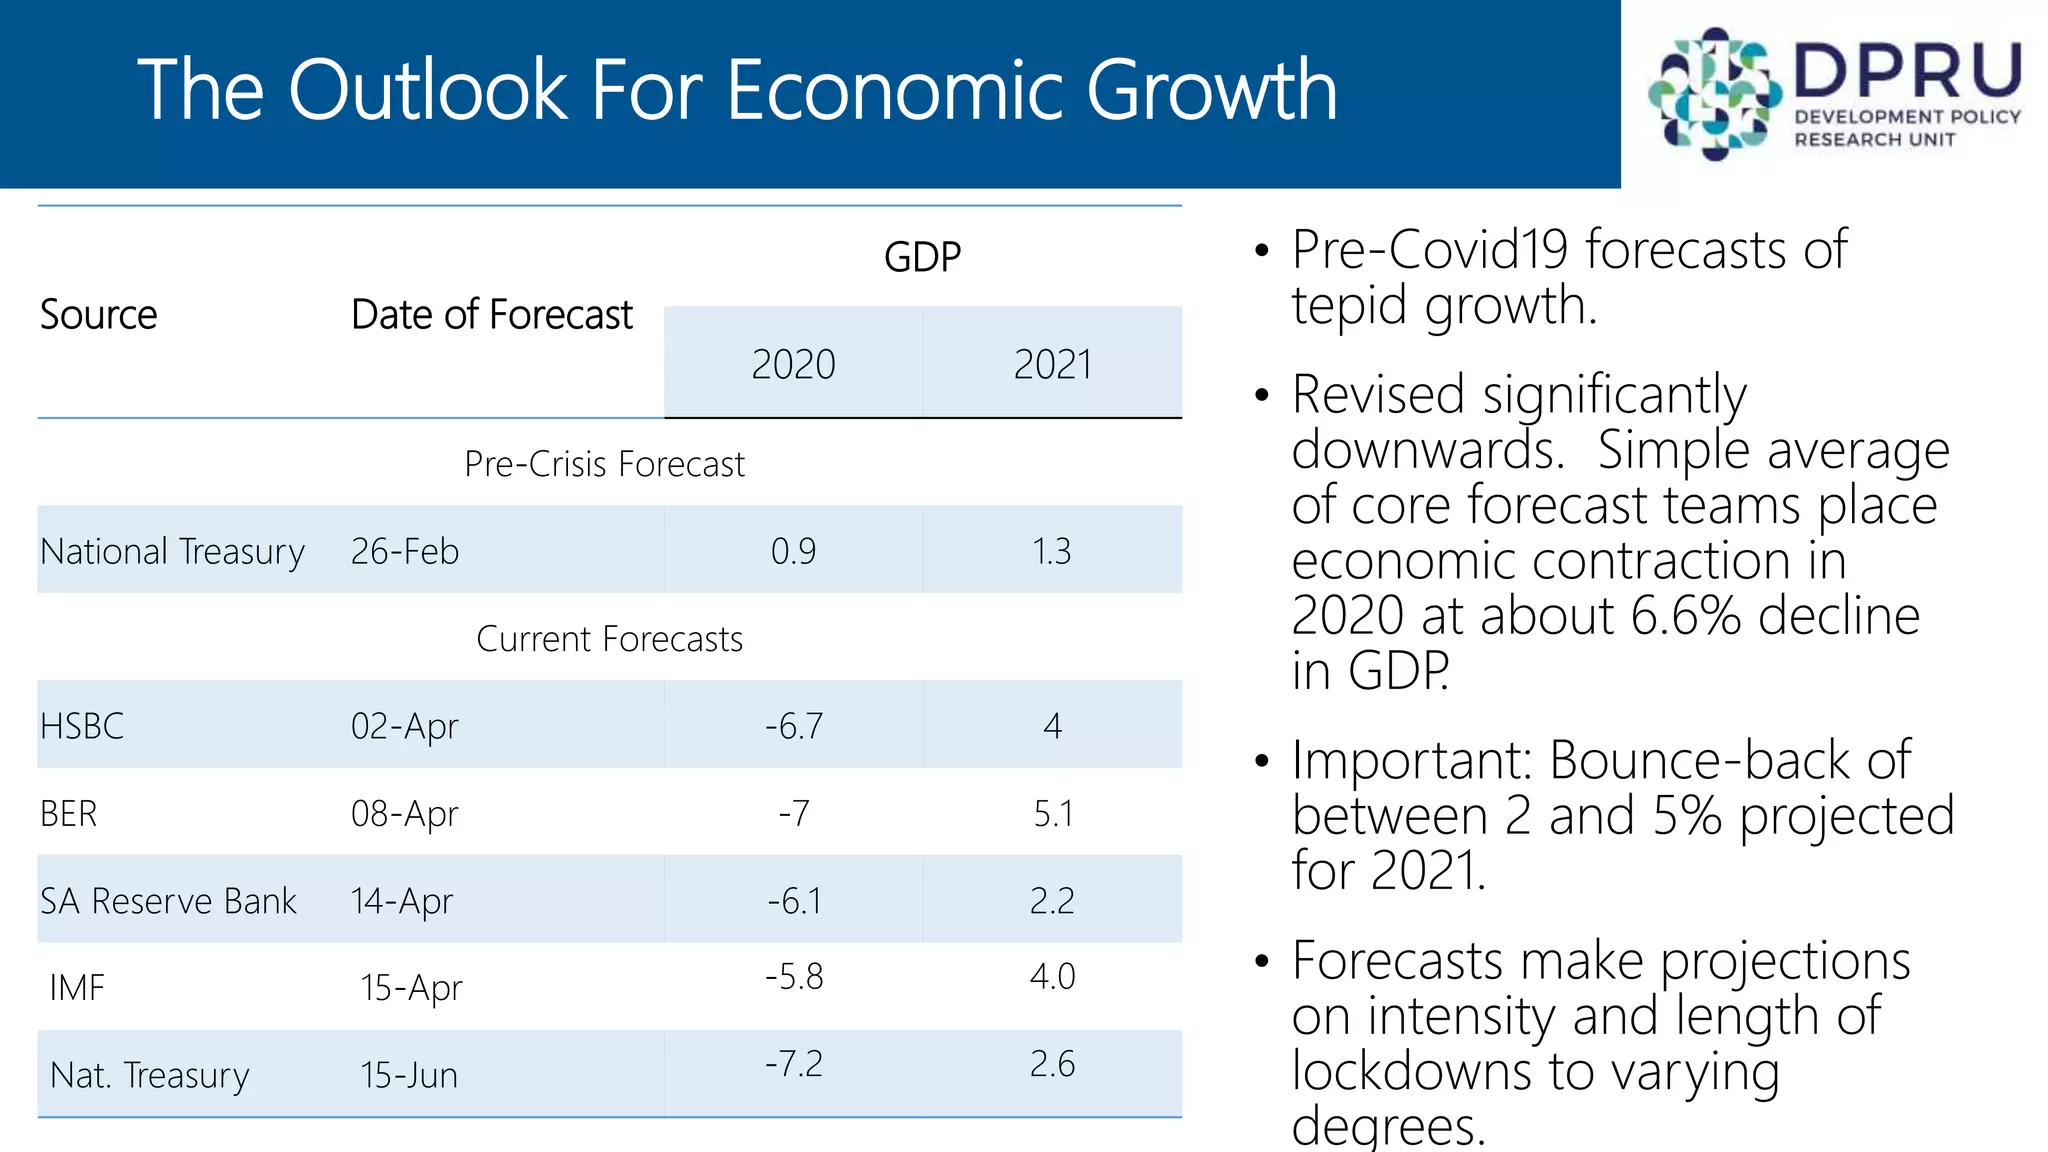
- The South African economy is projected to contract by around 6.6% in 2020 due to the COVID-19 pandemic, with growth rebounding to between 2-5% in 2021.
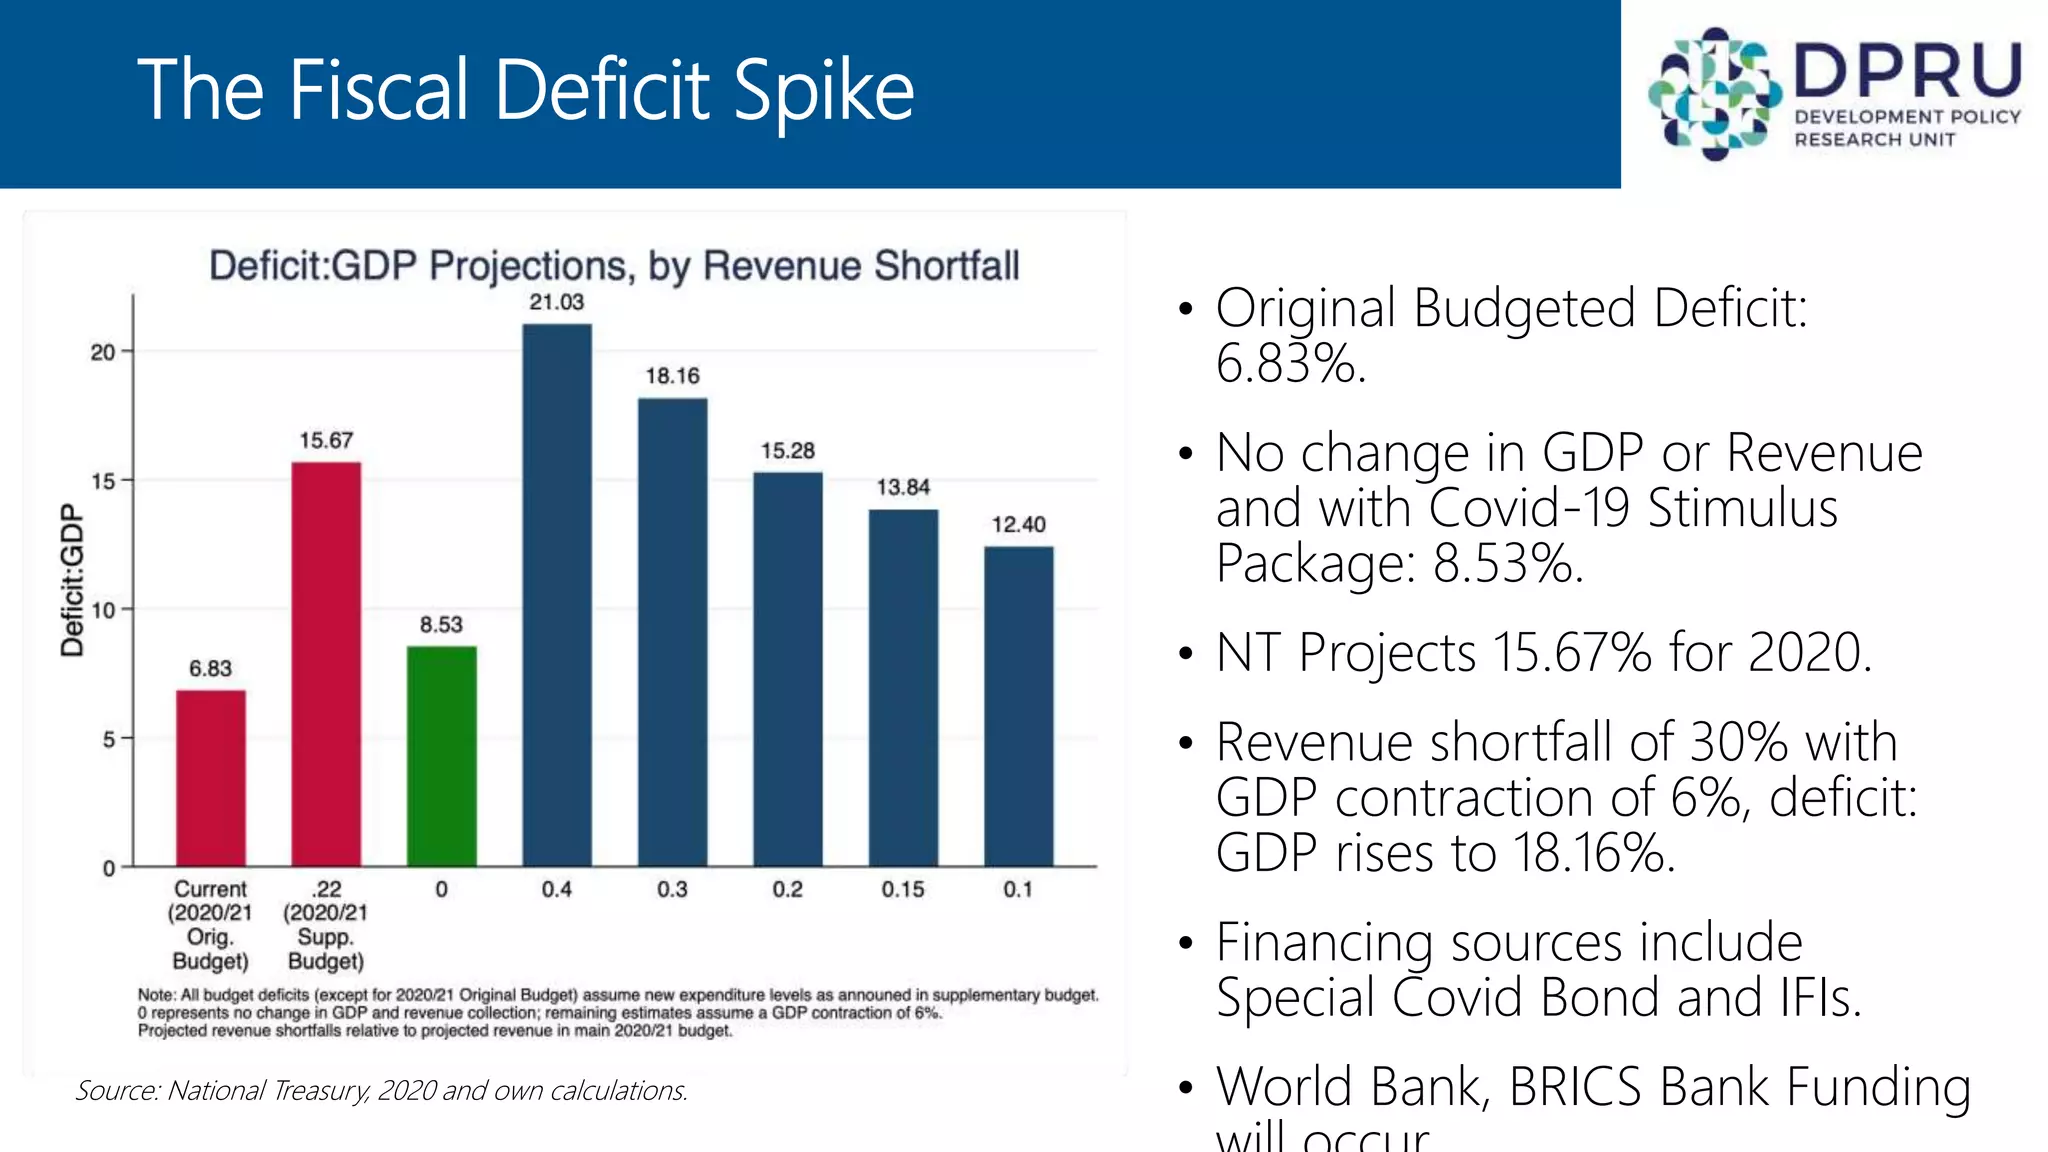
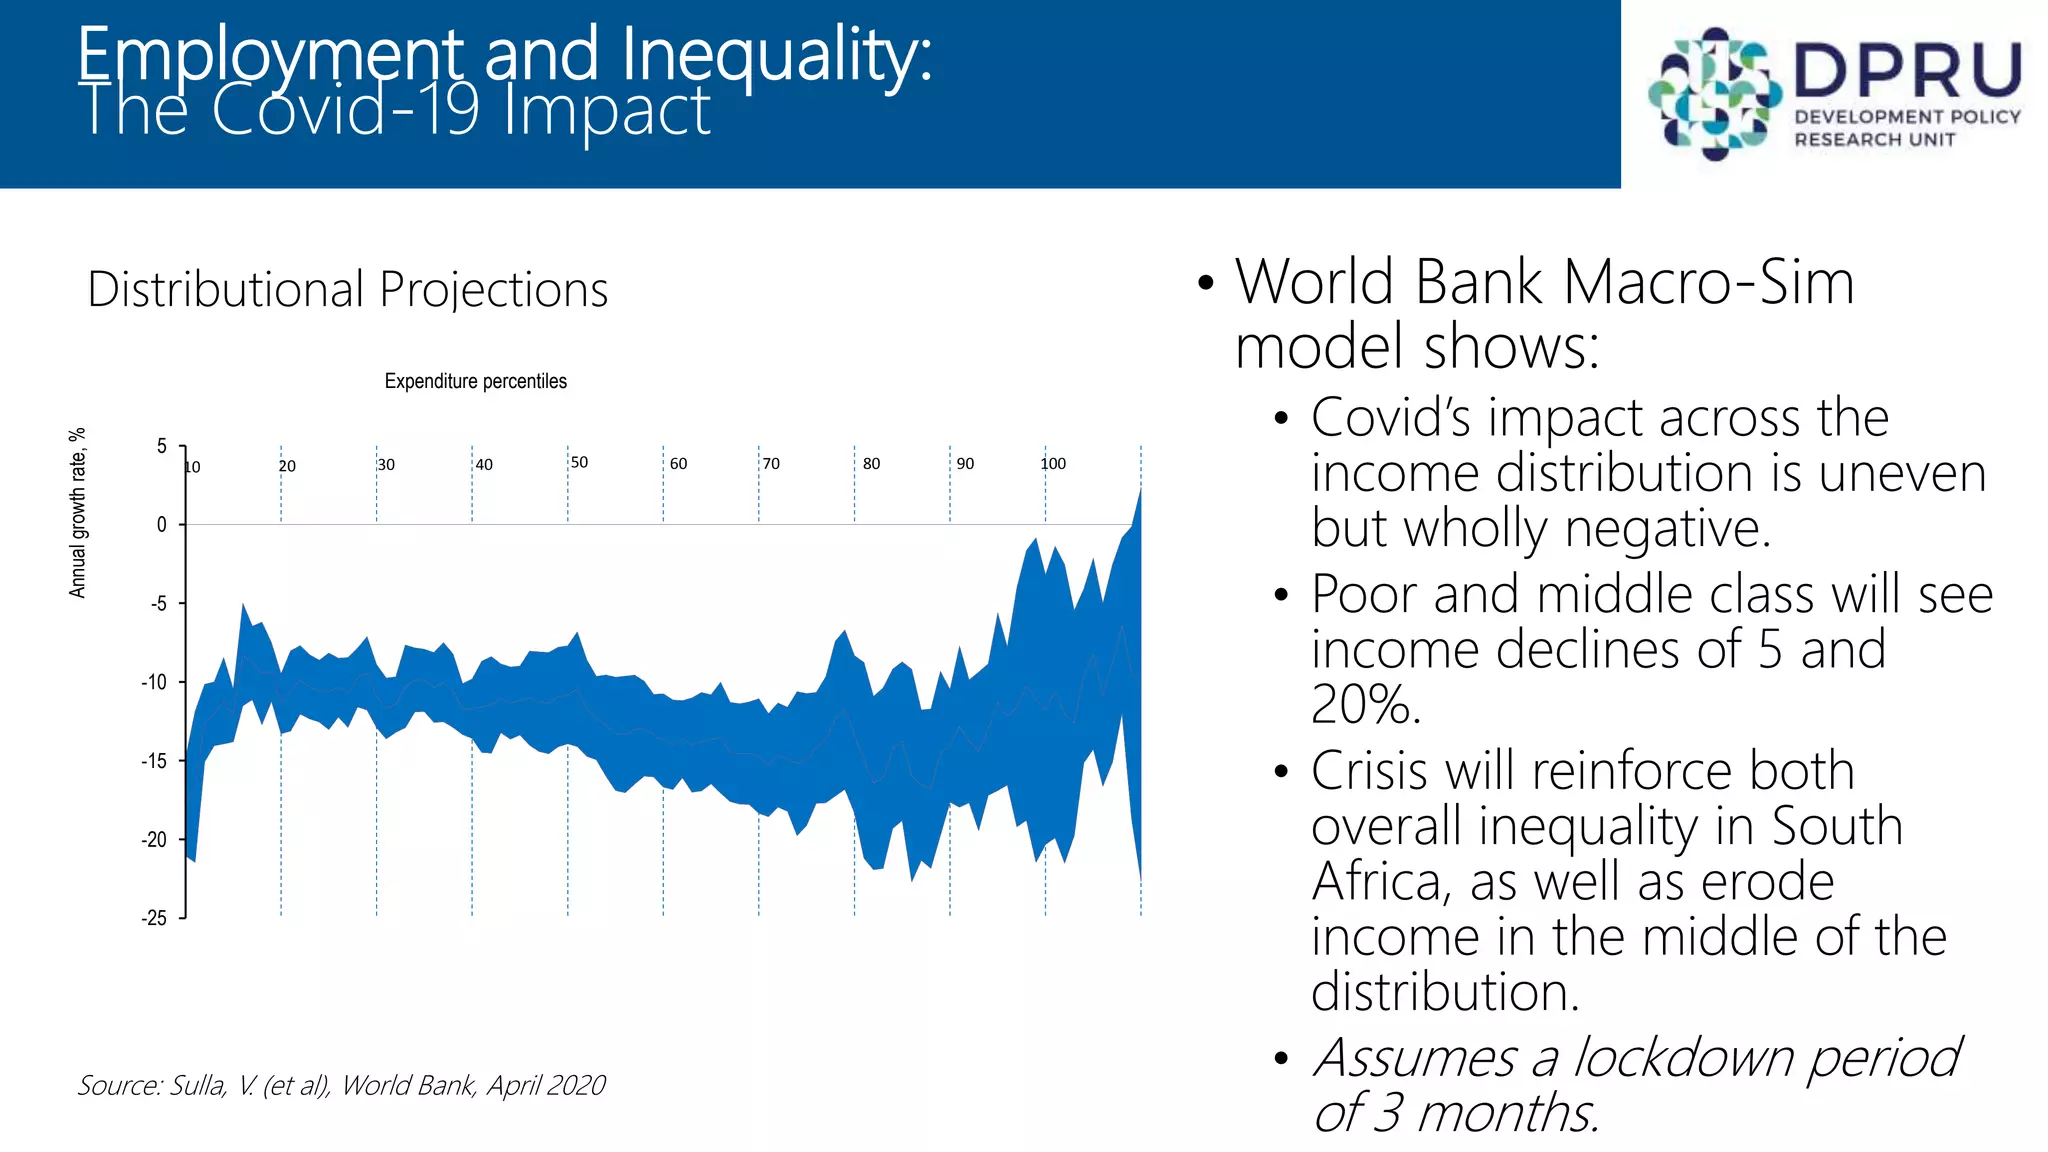
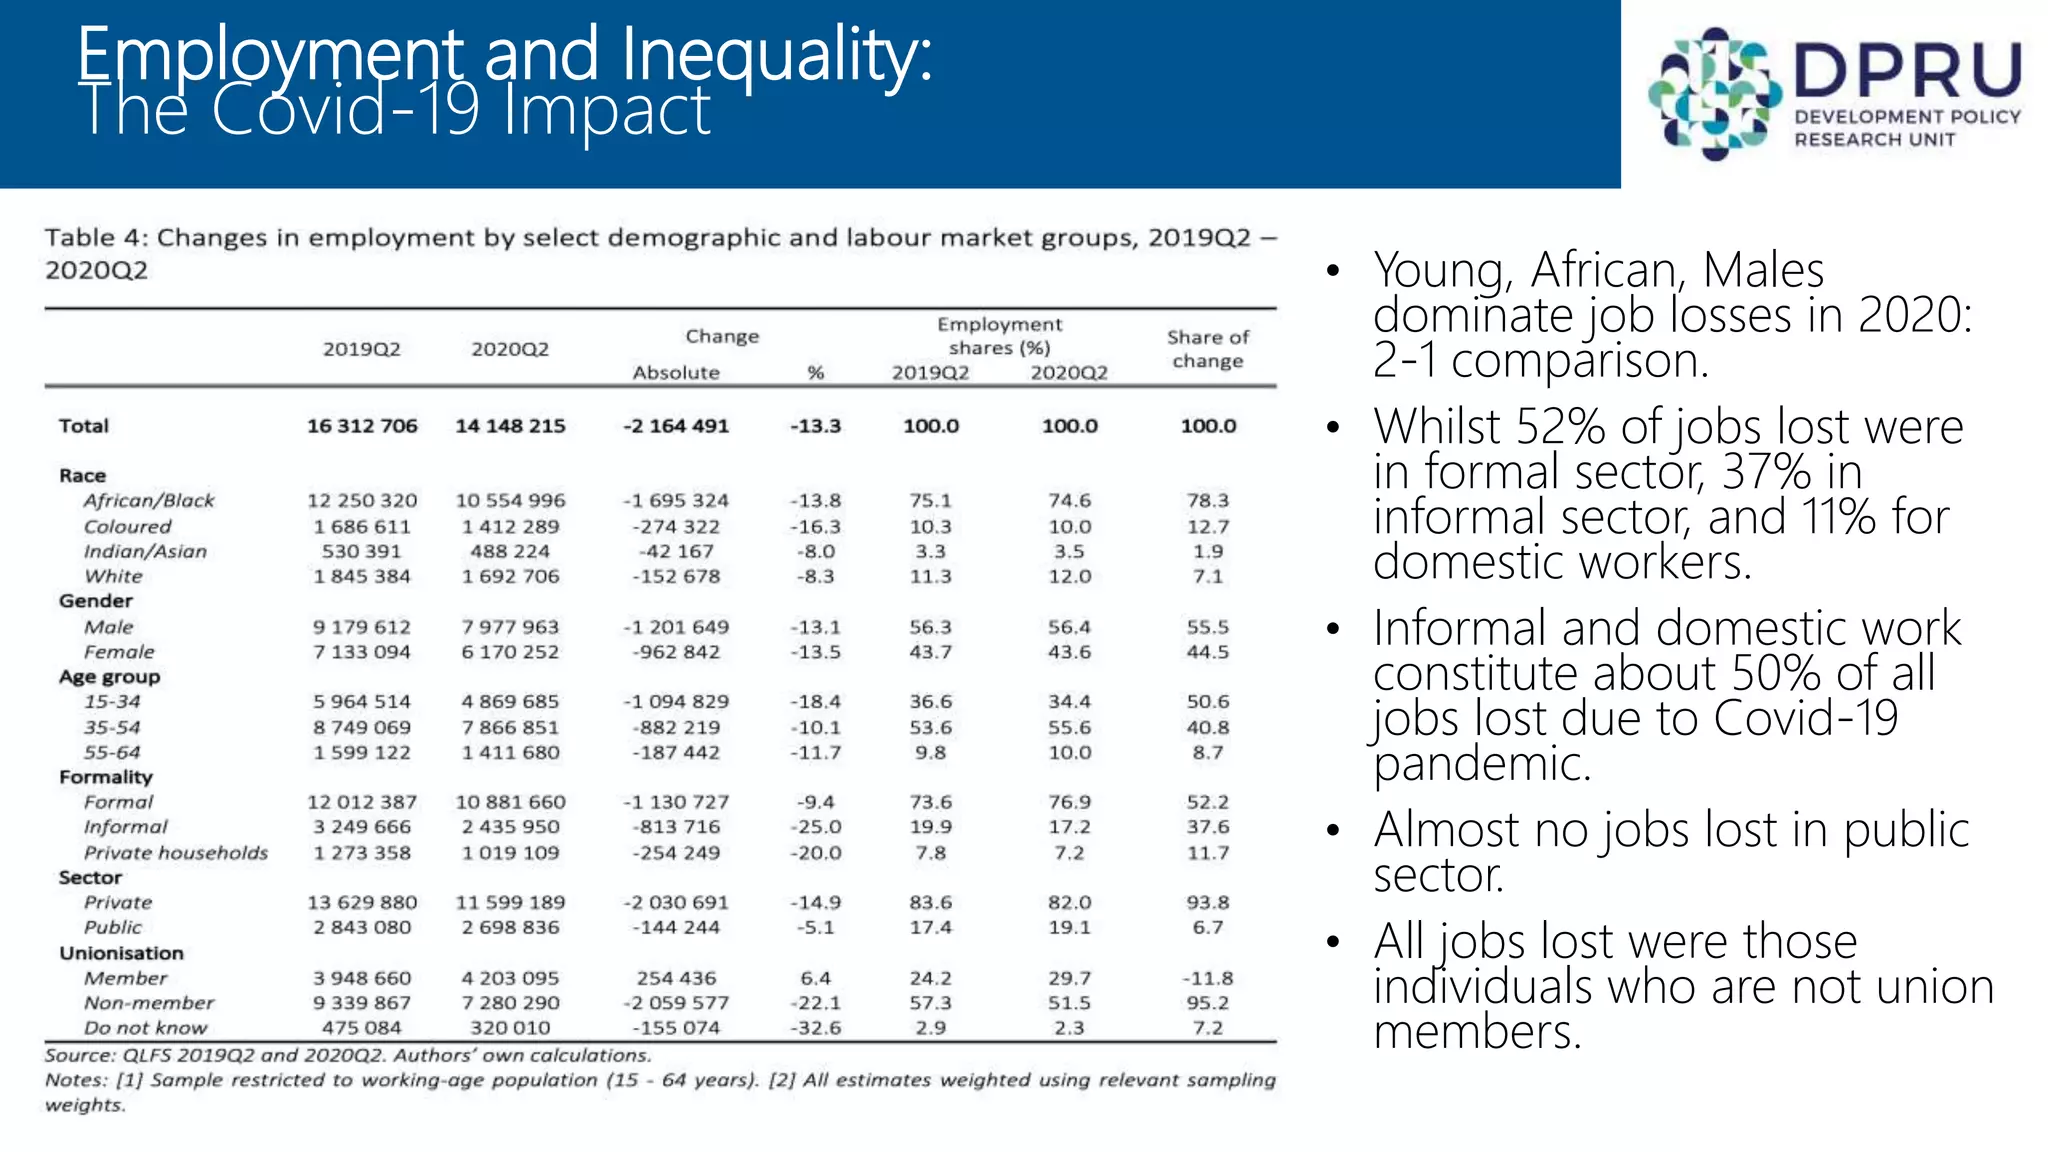
- The fiscal deficit is expected to spike from 6.83% to over 15% of GDP due to lost revenue and additional COVID-19 spending. Over 2 million jobs have already been lost, disproportionately impacting young, African, and male workers.
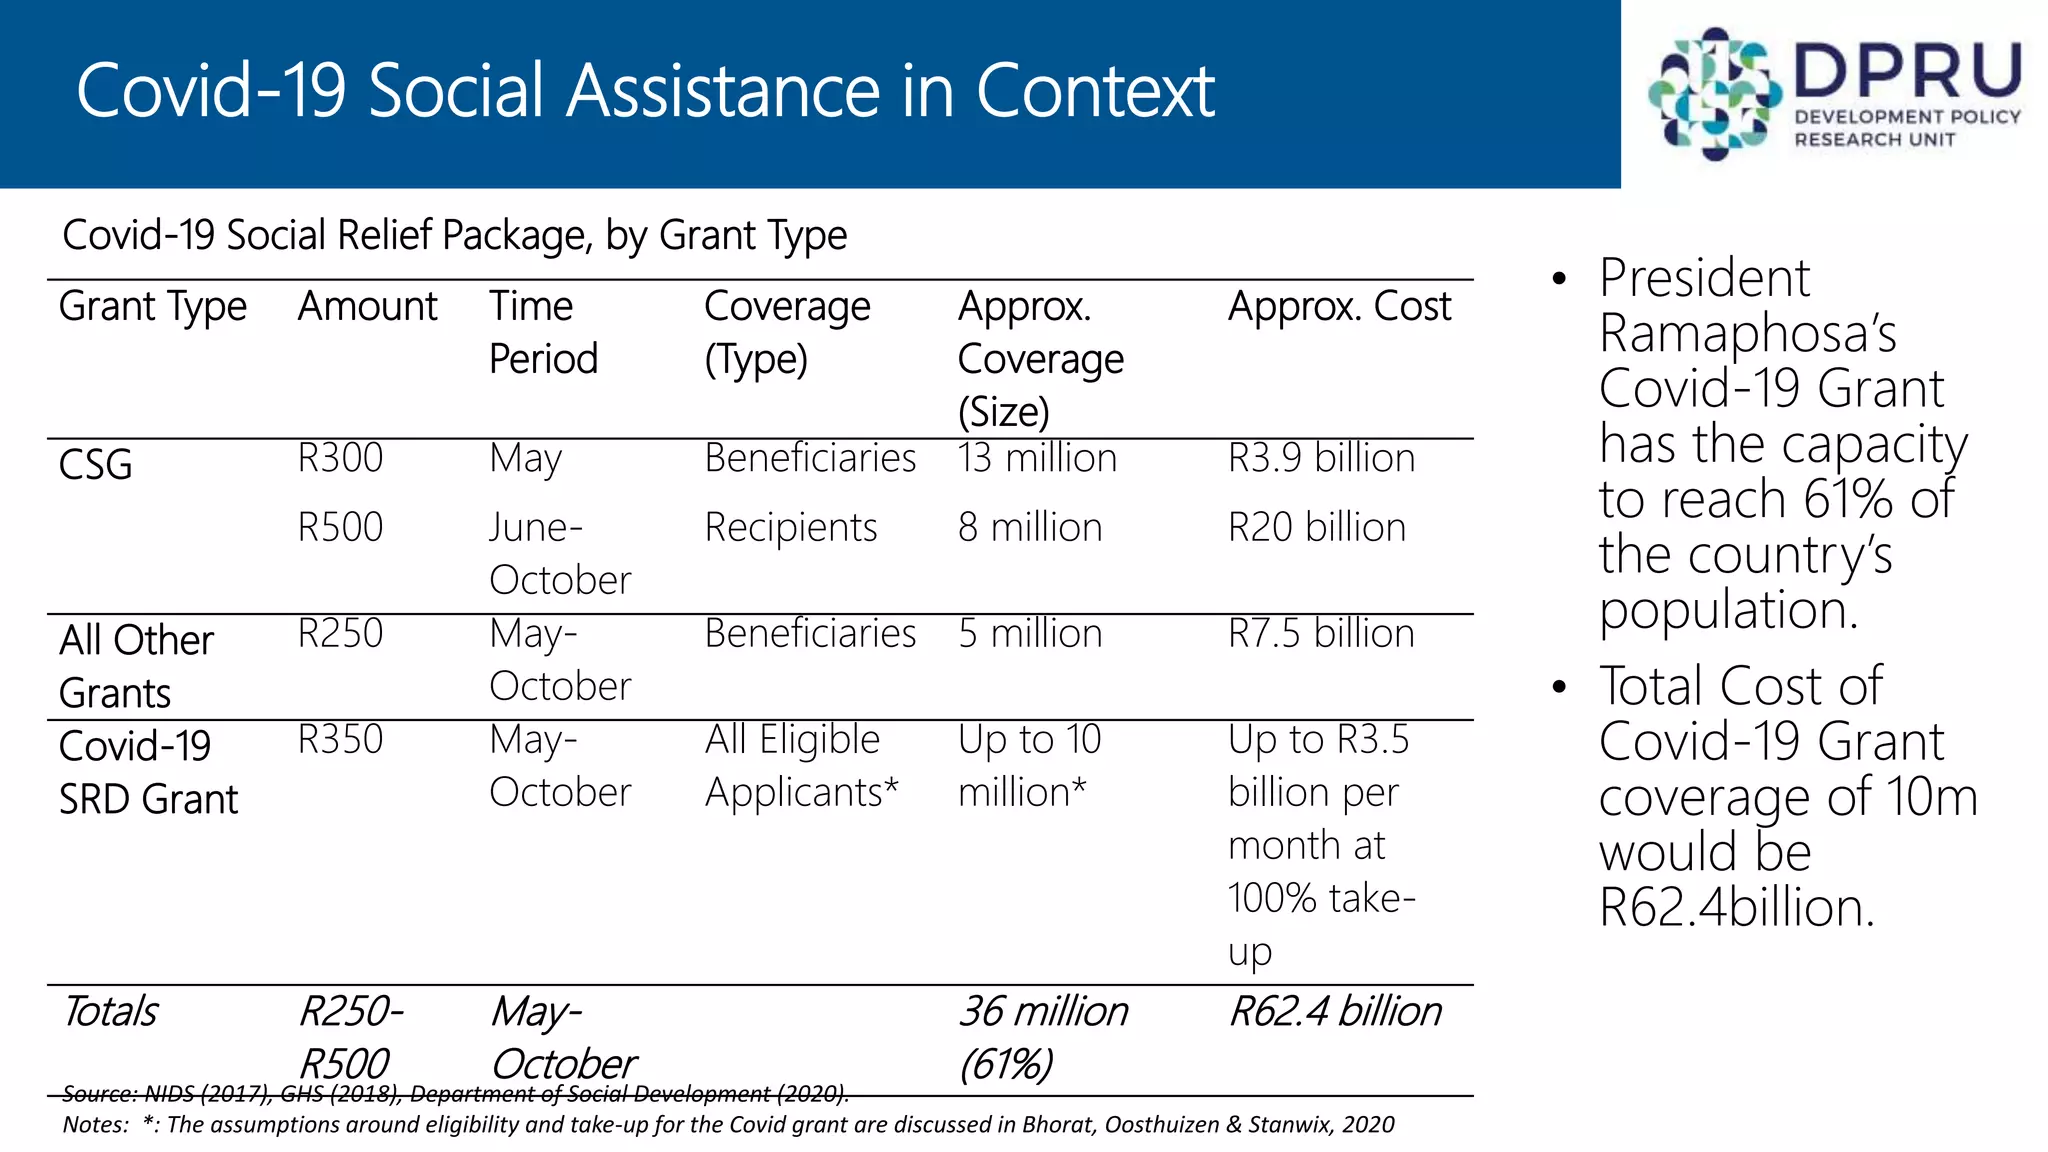
- The government unveiled a R500 billion COVID-19 support package, including health funding, wage protection, SMME support, tax relief, and loans. Social grants were expanded to reach up to 10 million people at a cost of R62.4 billion.