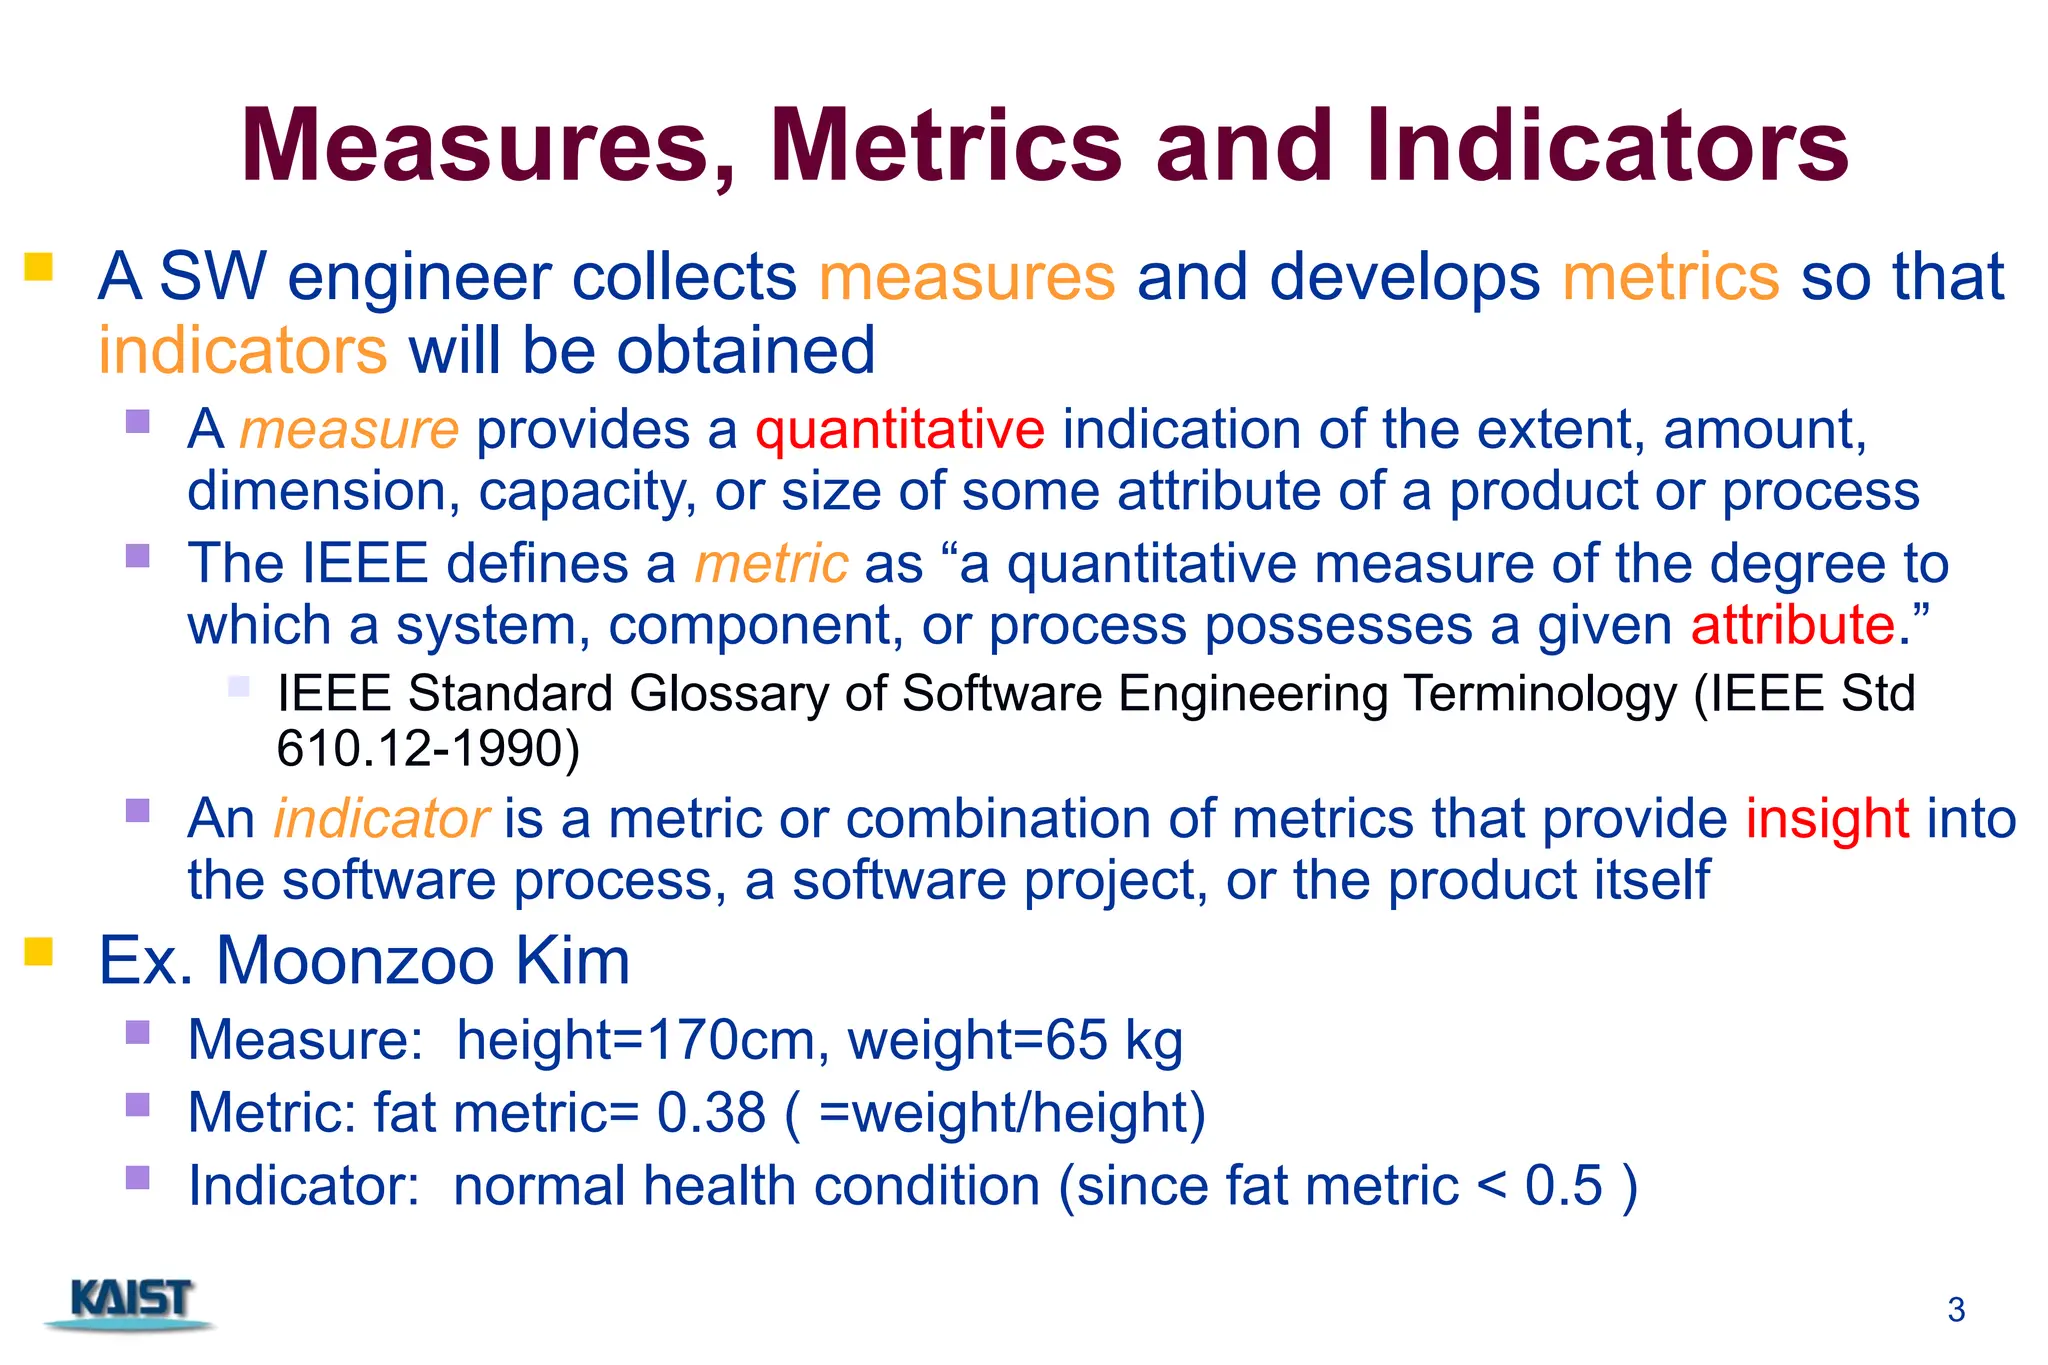
El documento aborda la importancia de las métricas de productos de software, definiendo conceptos clave como medidas, métricas e indicadores, e introduciendo principios de medición. Se discute el proceso de medición, que incluye la formulación, recolección, análisis, interpretación y retroalimentación, así como un enfoque orientado a objetivos para la medición del software. También se presentan diversas métricas aplicadas a diferentes modelos, incluyendo métricas para el diseño y análisis de software, así como métricas específicas para metodologías orientadas a objetos.

![12
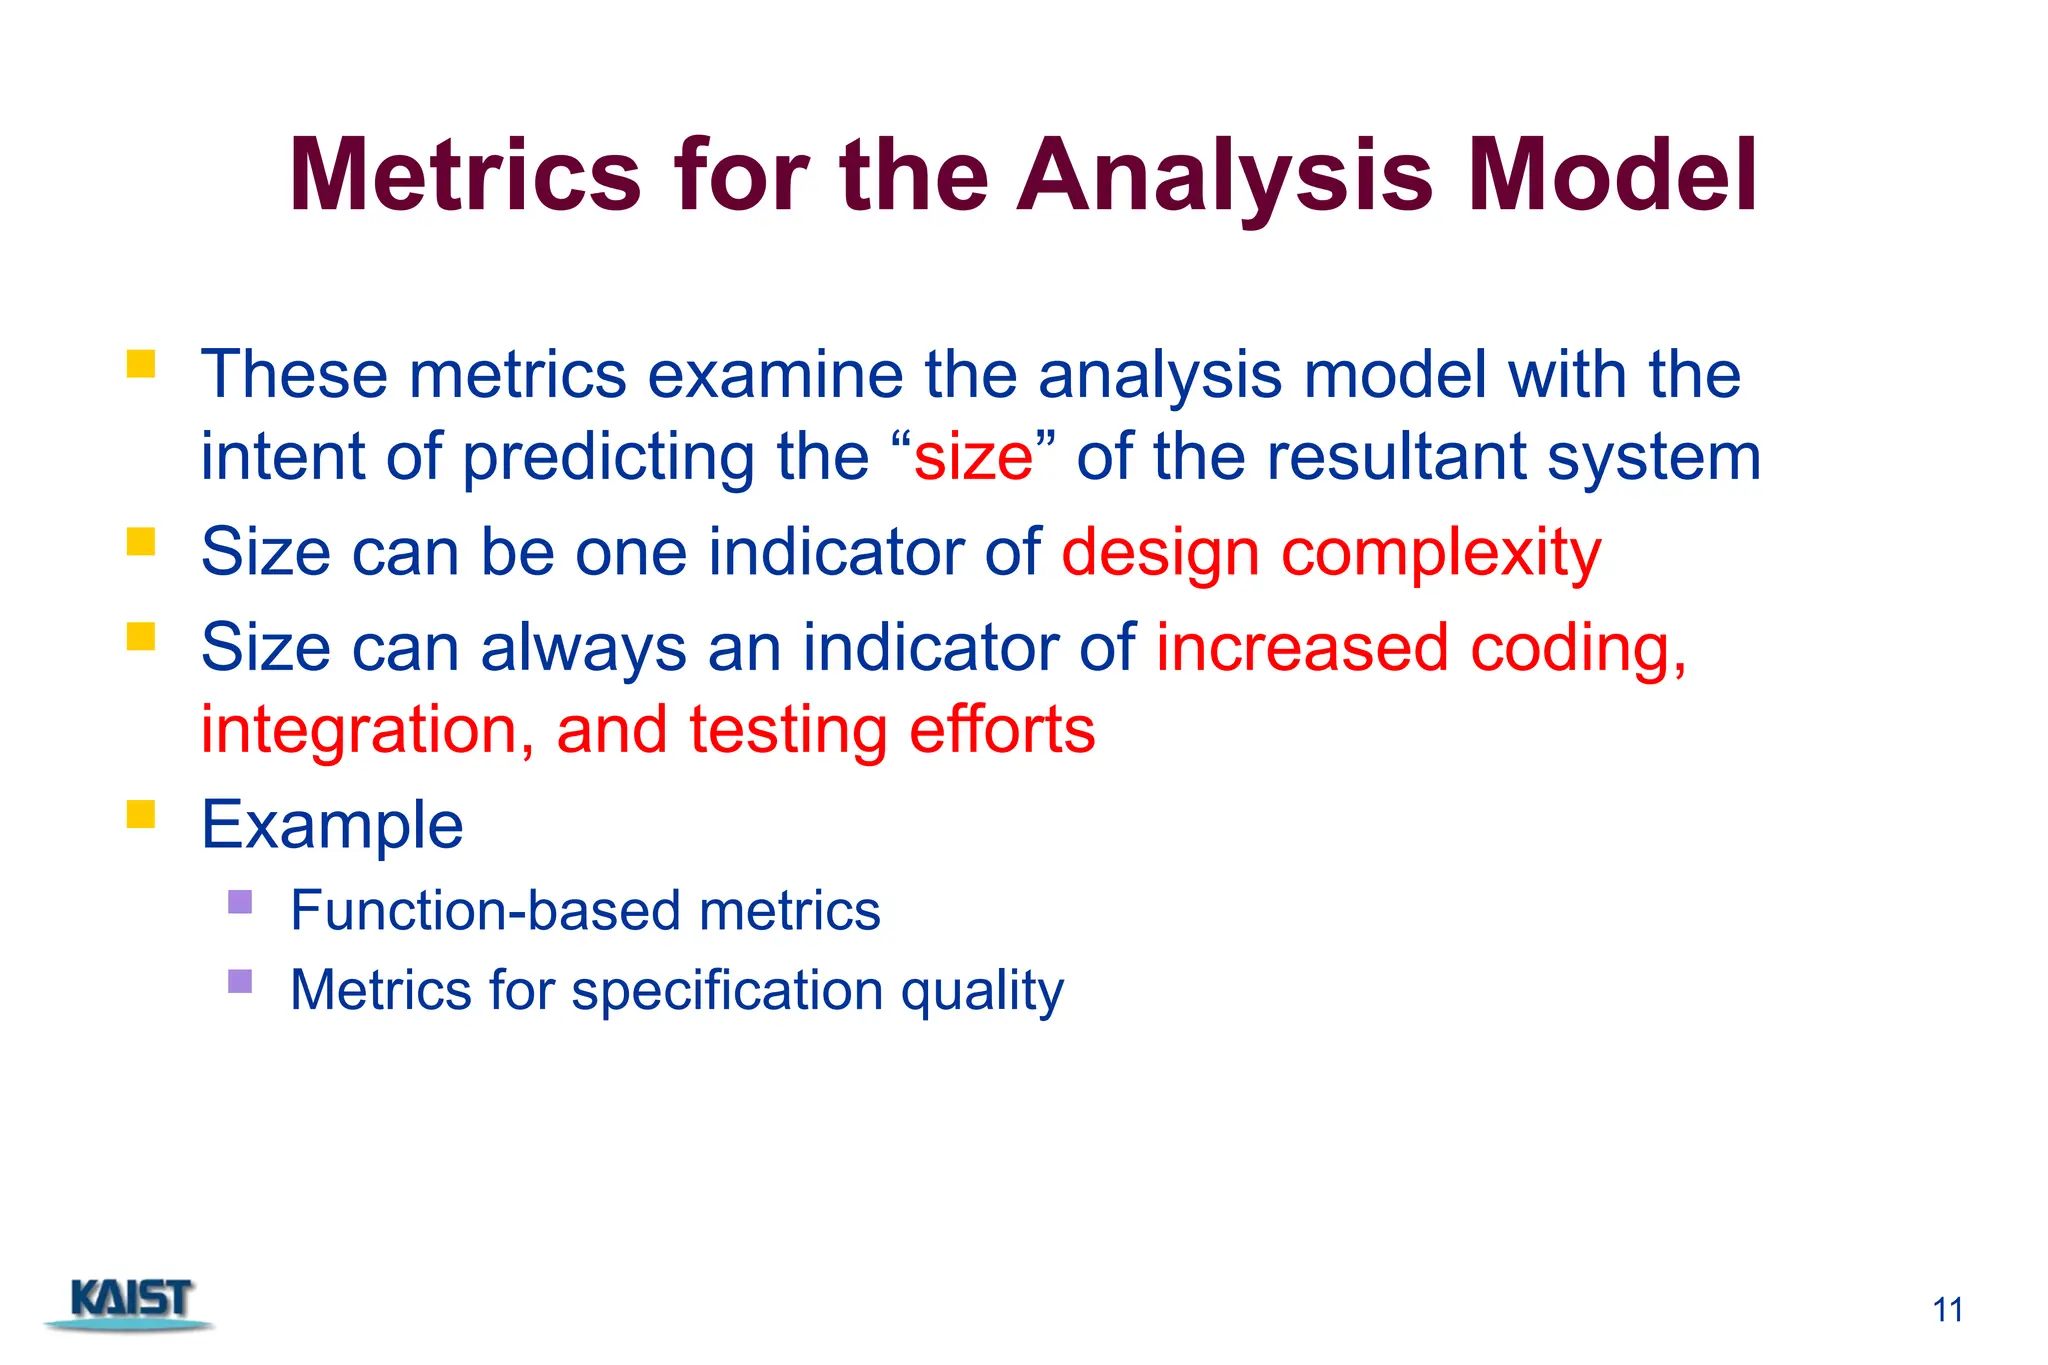
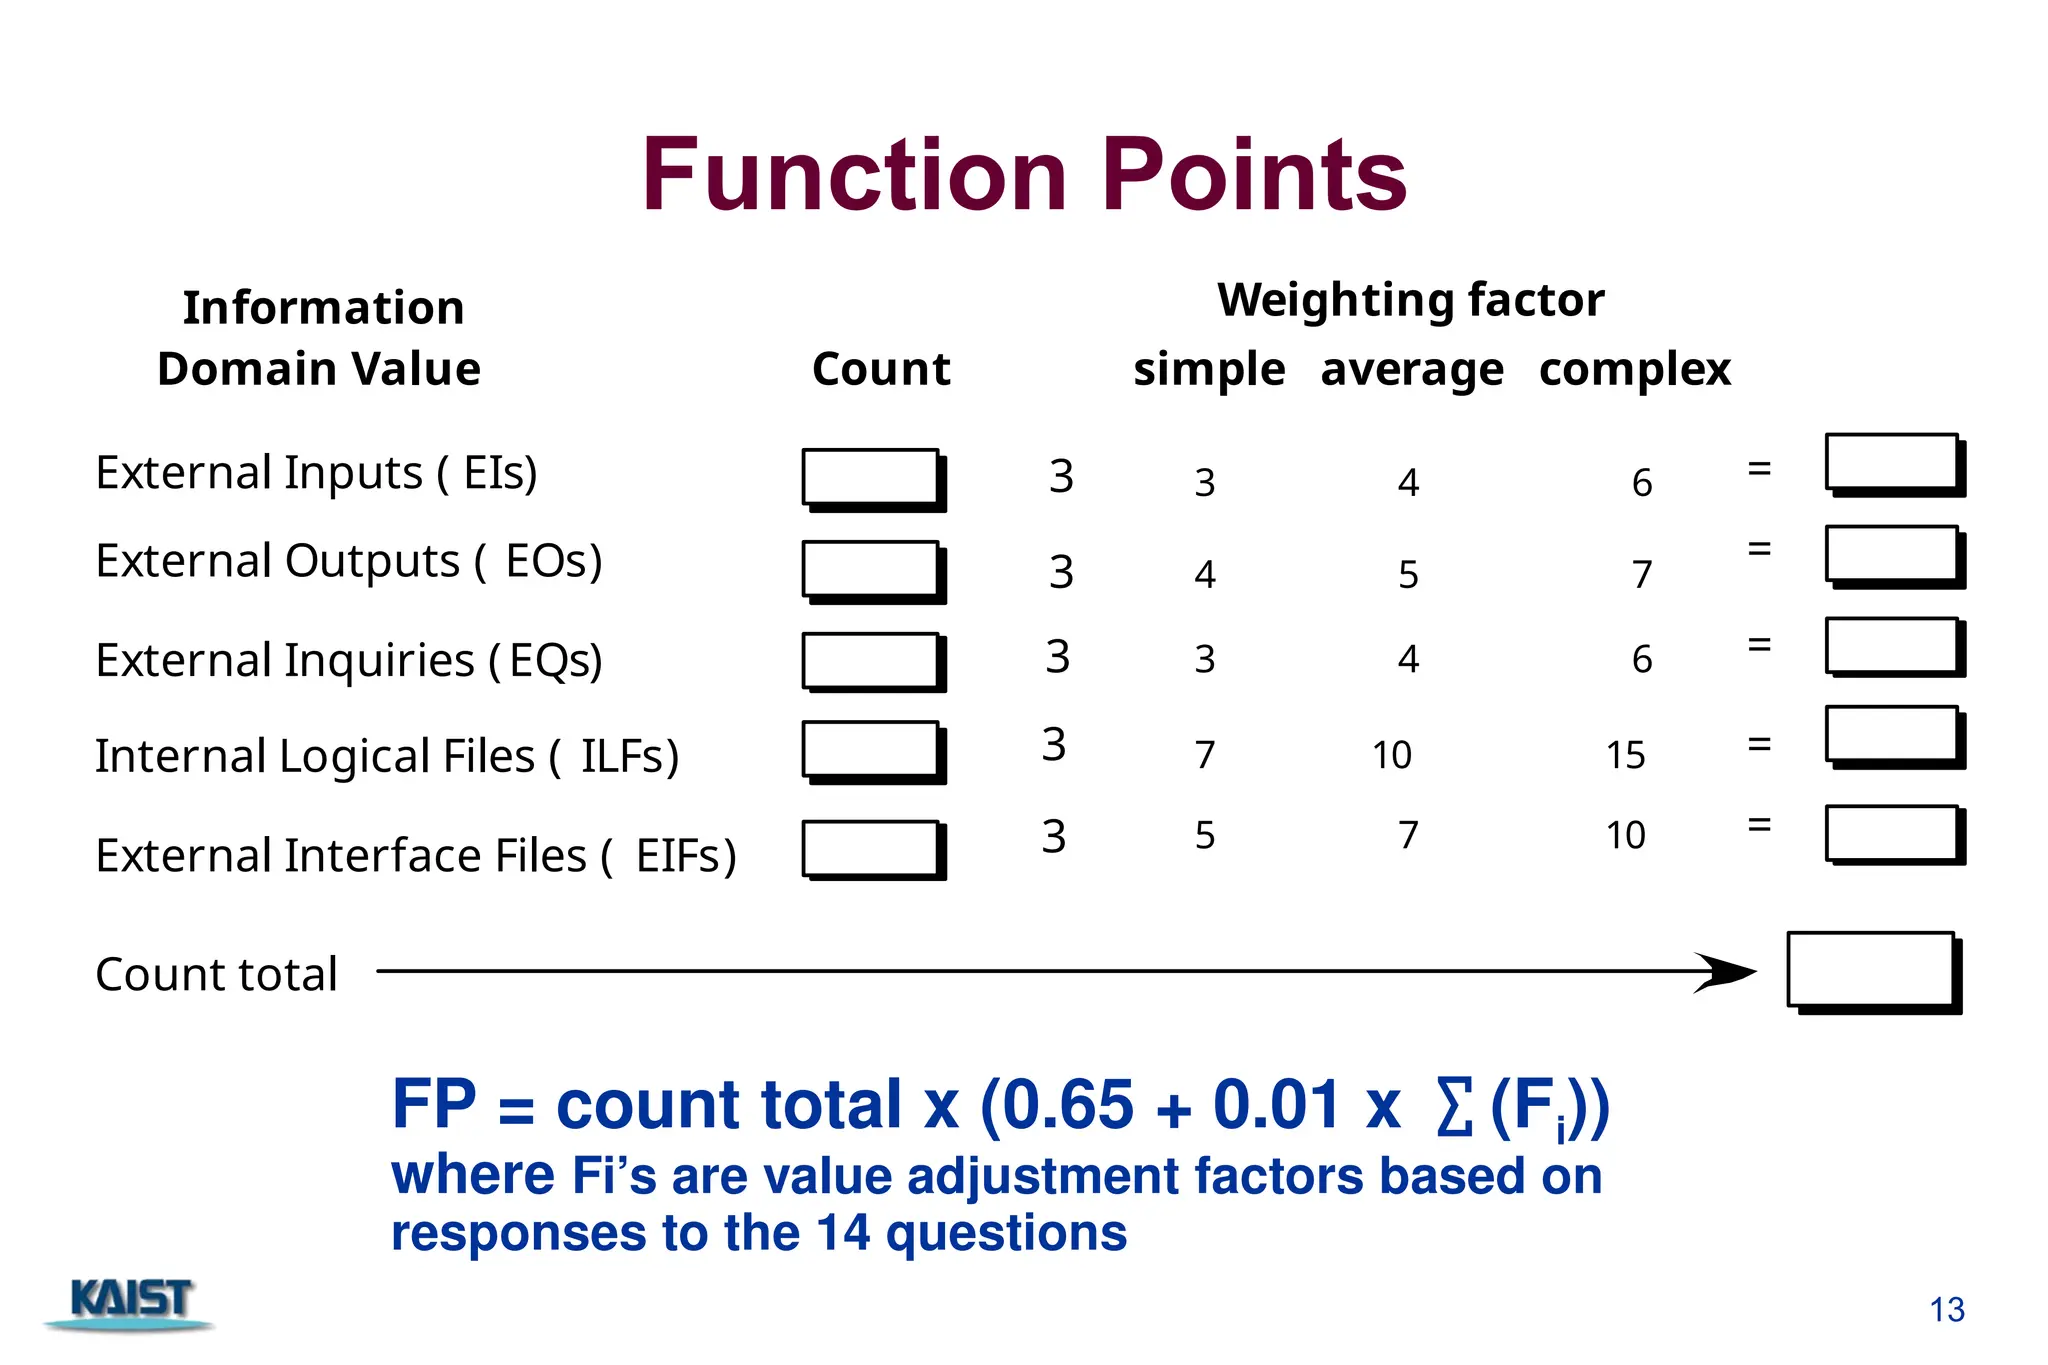
Function-Based Metrics
The function point metric (FP), first proposed by Albrecht [ALB79],
can be used effectively as a means for measuring the functionality
delivered by a system.
Function points are derived using an empirical relationship based on
countable (direct) measures of software's information domain and
assessments of software complexity
Information domain values are defined in the following manner:
number of external inputs (EIs)
often used to update internal logical files
number of external outputs (EOs)
number of external inquiries (EQs)
number of internal logical files (ILFs)
Number of external interface files (EIFs) (](https://image.slidesharecdn.com/lec16-ch30-241201144636-7e74f8ba/75/software-engineering-metrics-concpets-in-advanced-sotwrae-12-2048.jpg)
![16
Usage of Function Points
Assume that
past data indicates that one FP translates into 60 lines of code
12 FPs are produced for each person-month of effort
Past projects have found an average of 3 errors per FP during analysis and
design reviews
4 errors per FP during unit and integration testing
These data can help SW engineers assess the completeness of their review
and testing activities.
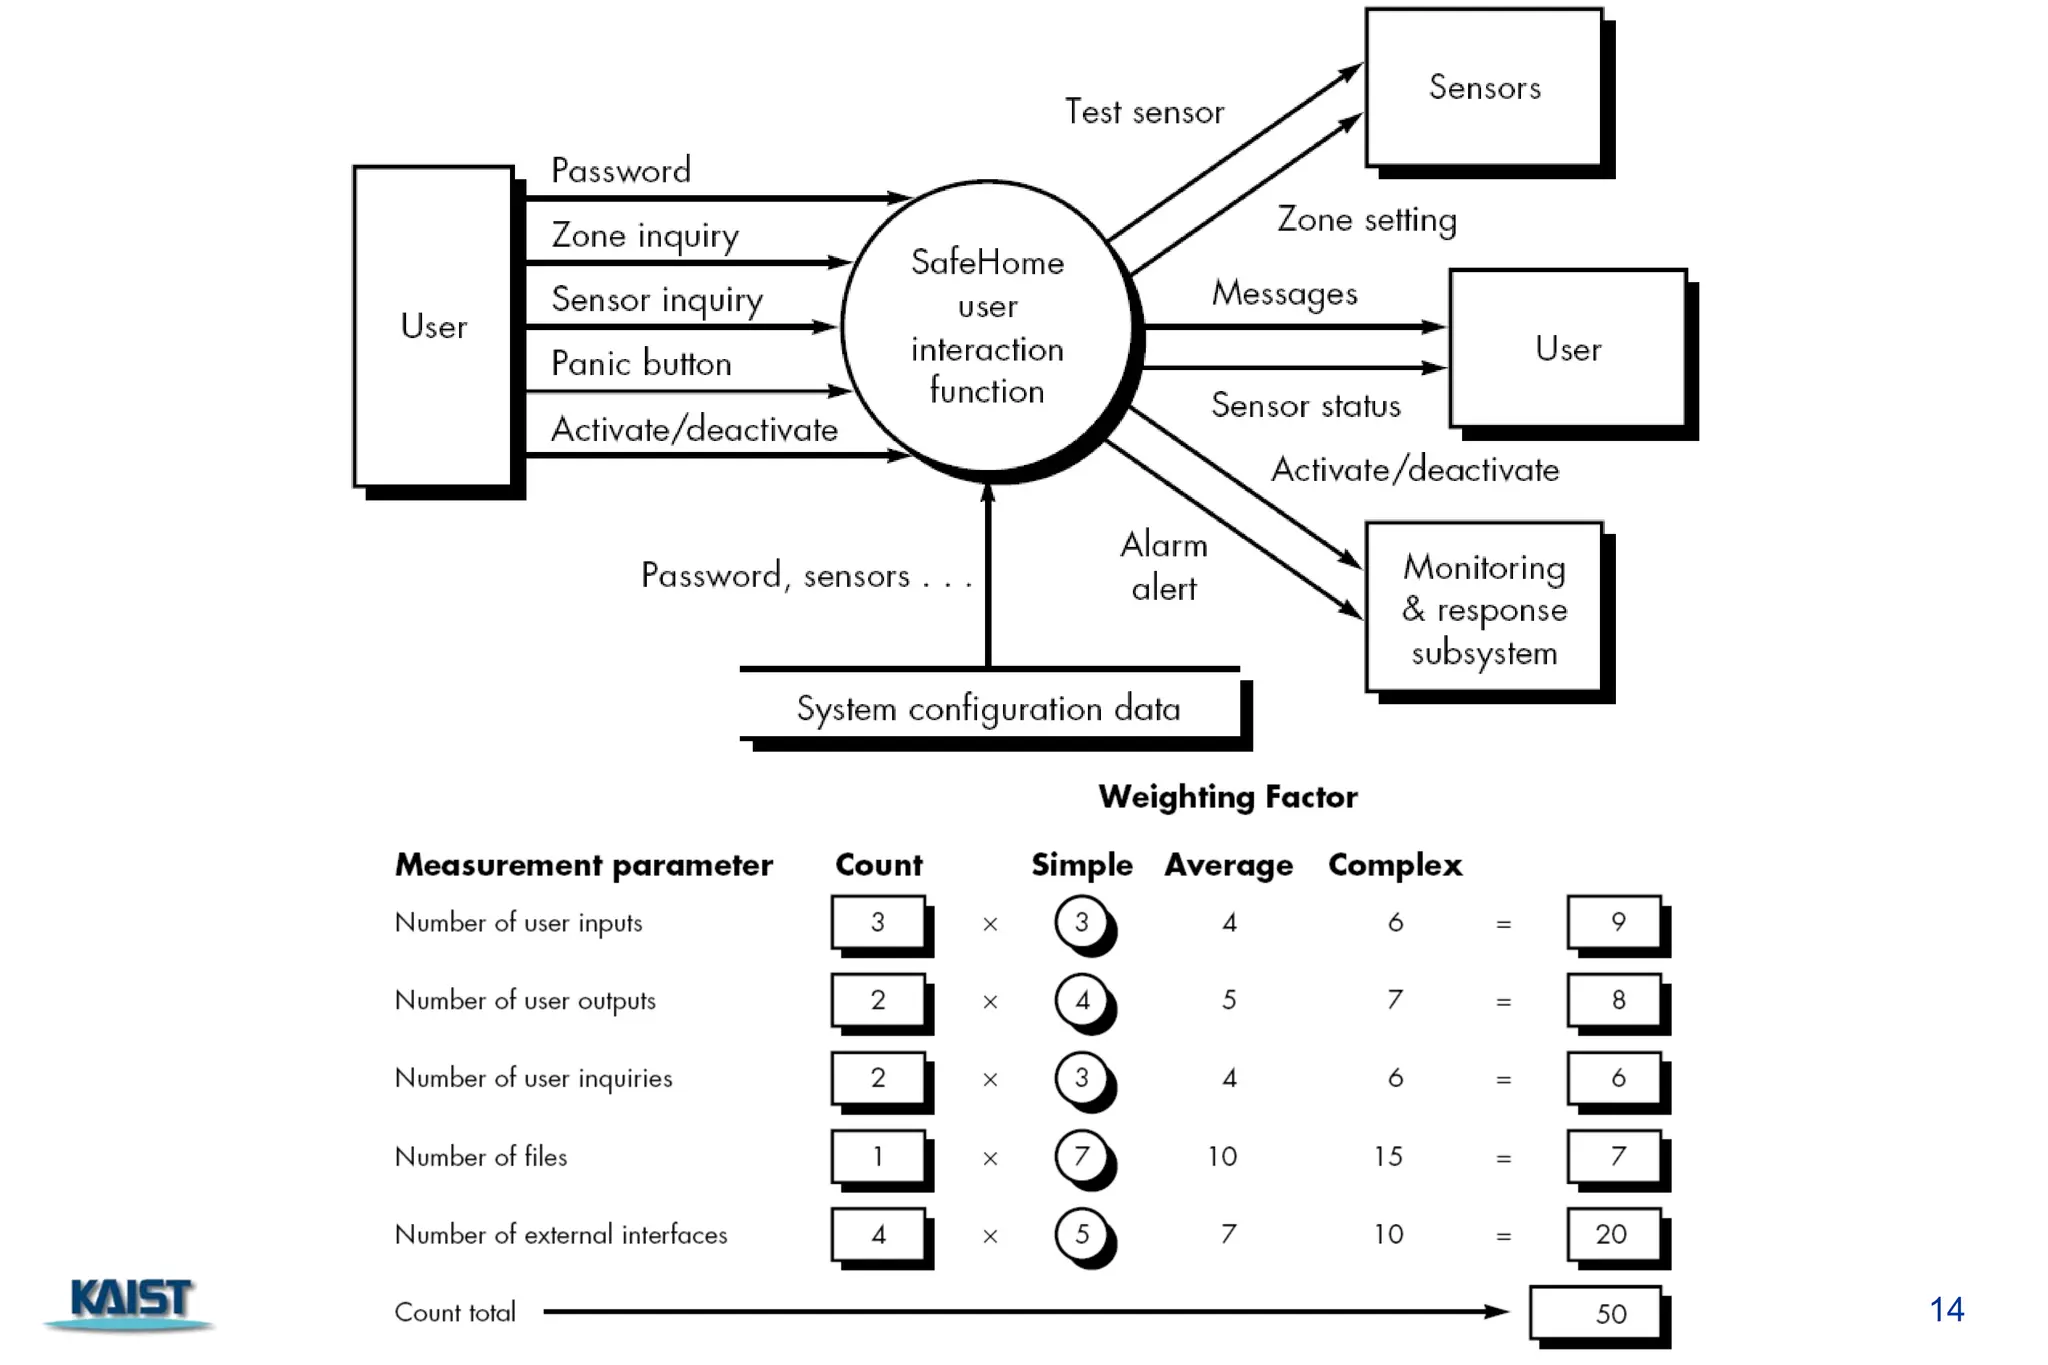
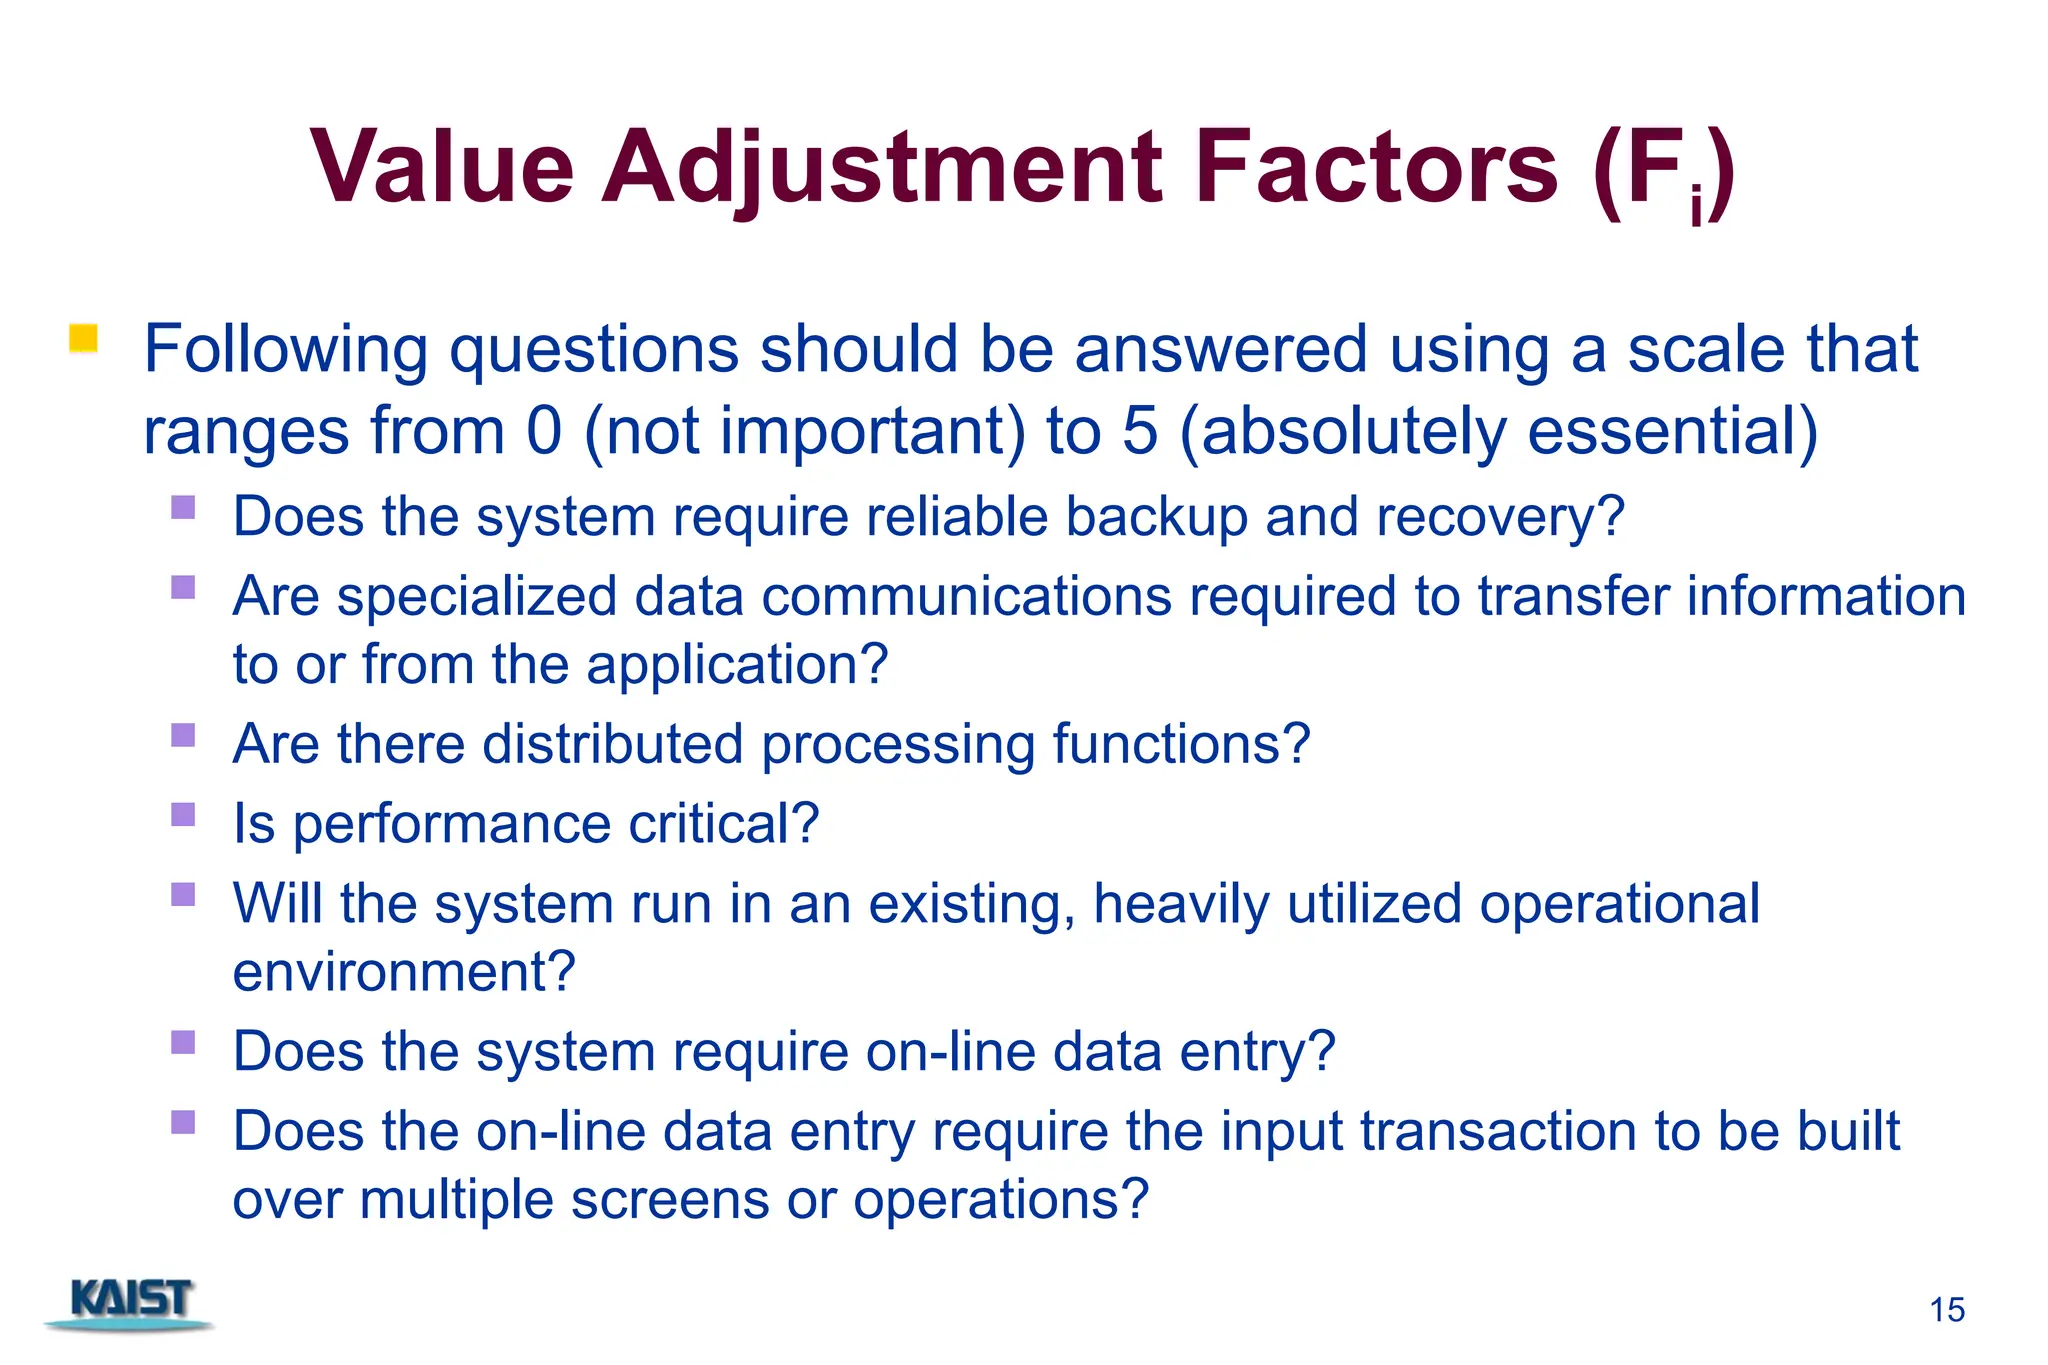
Suppose that Safehome has 56 FPs
56 =50 x [0.65 +0.01 x ∑(Fi) (= 46)]
Safehome will be
Expected size: 60 lines * 56 =3360 lines
Expected required man-month: 1/12 MM * 56 = 4.7 MM
Total analysis/design errors expected: 3 * 56 = 168 errors
Total testing errors expected: 4 * 56 = 224 errors](https://image.slidesharecdn.com/lec16-ch30-241201144636-7e74f8ba/75/software-engineering-metrics-concpets-in-advanced-sotwrae-16-2048.jpg)
![20
Metrics for OO Design-I
Whitmire [WHI97] describes nine distinct and measurable
characteristics of an OO design:
Size
Size is defined in terms of the following four views:
Population: a static count of OO entities such as classes
Volume: a dynamic count of OO entities such as objects
Length: a measure of a chain of interconnected design elements
Functionality: value delivered to the customer
Complexity
How classes of an OO design are interrelated to one another
Coupling
The physical connections between elements of the OO design
The # of collaborations between classes
Sufficiency
“the degree to which an abstraction possesses the features required of it, ...
from the point of view of the current application.”
Whether the abstraction (class) possesses the features required of it](https://image.slidesharecdn.com/lec16-ch30-241201144636-7e74f8ba/75/software-engineering-metrics-concpets-in-advanced-sotwrae-20-2048.jpg)
![22
Distinguishing Characteristics
Encapsulation
the packaging of data and processing
Information hiding
the way in which information about operational details is hidden by a
secure interface
Inheritance
the manner in which the responsibilities of one class are propagated to
another
Abstraction
the mechanism that allows a design to focus on essential details
Localization
the way in which information is concentrated in a program
Berard [BER95] argues that the following characteristics require
that special OO metrics be developed:](https://image.slidesharecdn.com/lec16-ch30-241201144636-7e74f8ba/75/software-engineering-metrics-concpets-in-advanced-sotwrae-22-2048.jpg)
![28
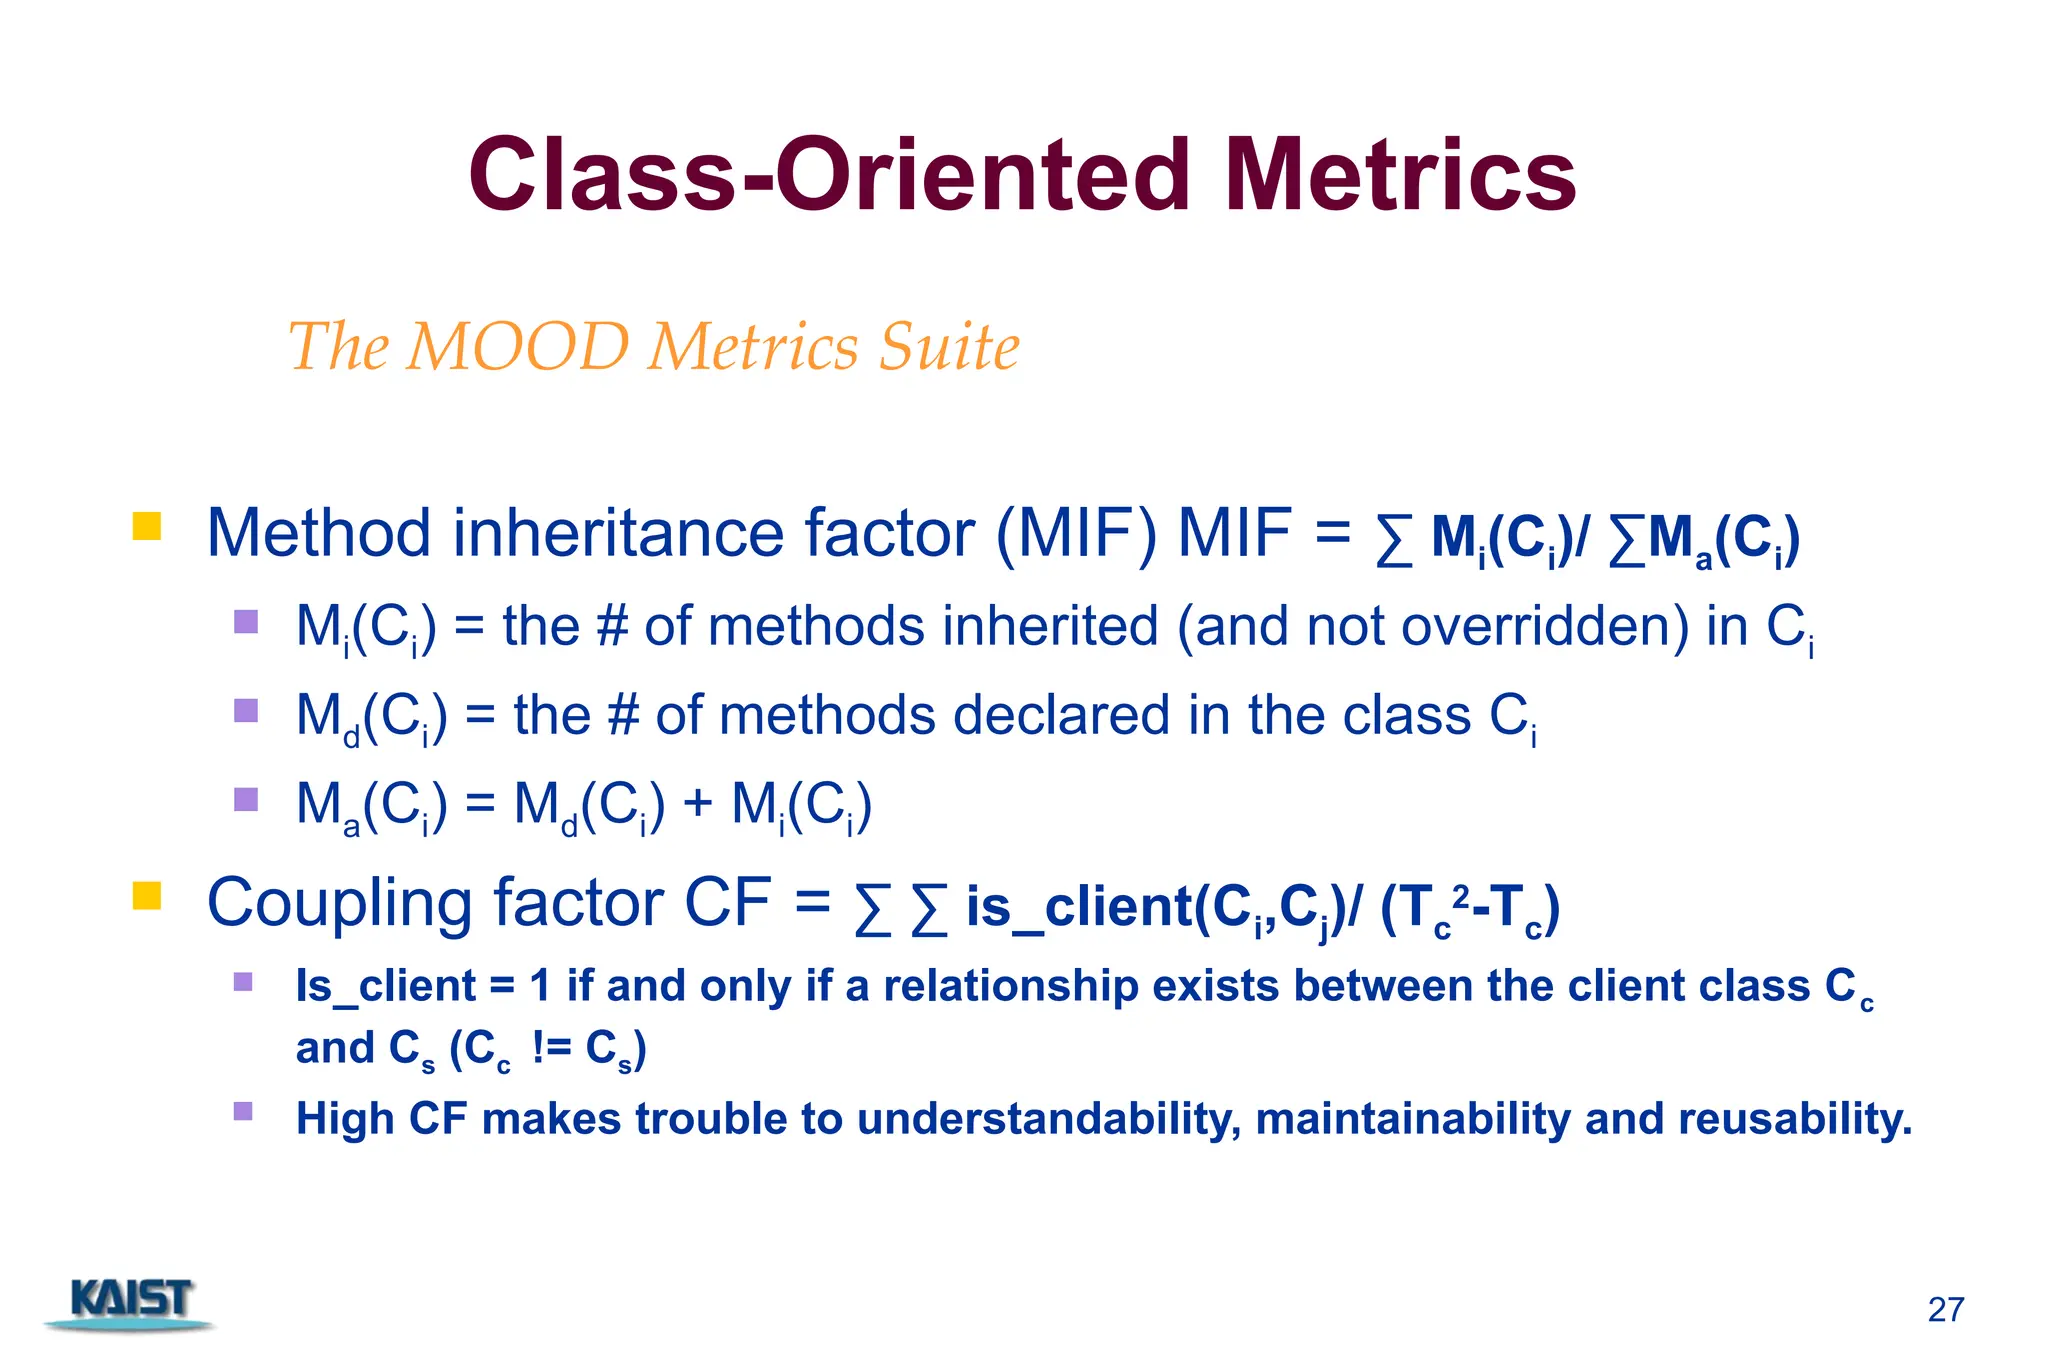
Class-Oriented Metrics
class size
number of operations overridden by a subclass
number of operations added by a subclass
Proposed by Lorenz and Kidd [LOR94]:](https://image.slidesharecdn.com/lec16-ch30-241201144636-7e74f8ba/75/software-engineering-metrics-concpets-in-advanced-sotwrae-28-2048.jpg)
![30
Operation-Oriented Metrics
average operation size
# of messages sent by the operation
operation complexity
average number of parameters per operation
Proposed by Lorenz and Kidd [LOR94]:](https://image.slidesharecdn.com/lec16-ch30-241201144636-7e74f8ba/75/software-engineering-metrics-concpets-in-advanced-sotwrae-30-2048.jpg)
![33
Metrics for Testing
Testing effort can also be estimated using metrics derived
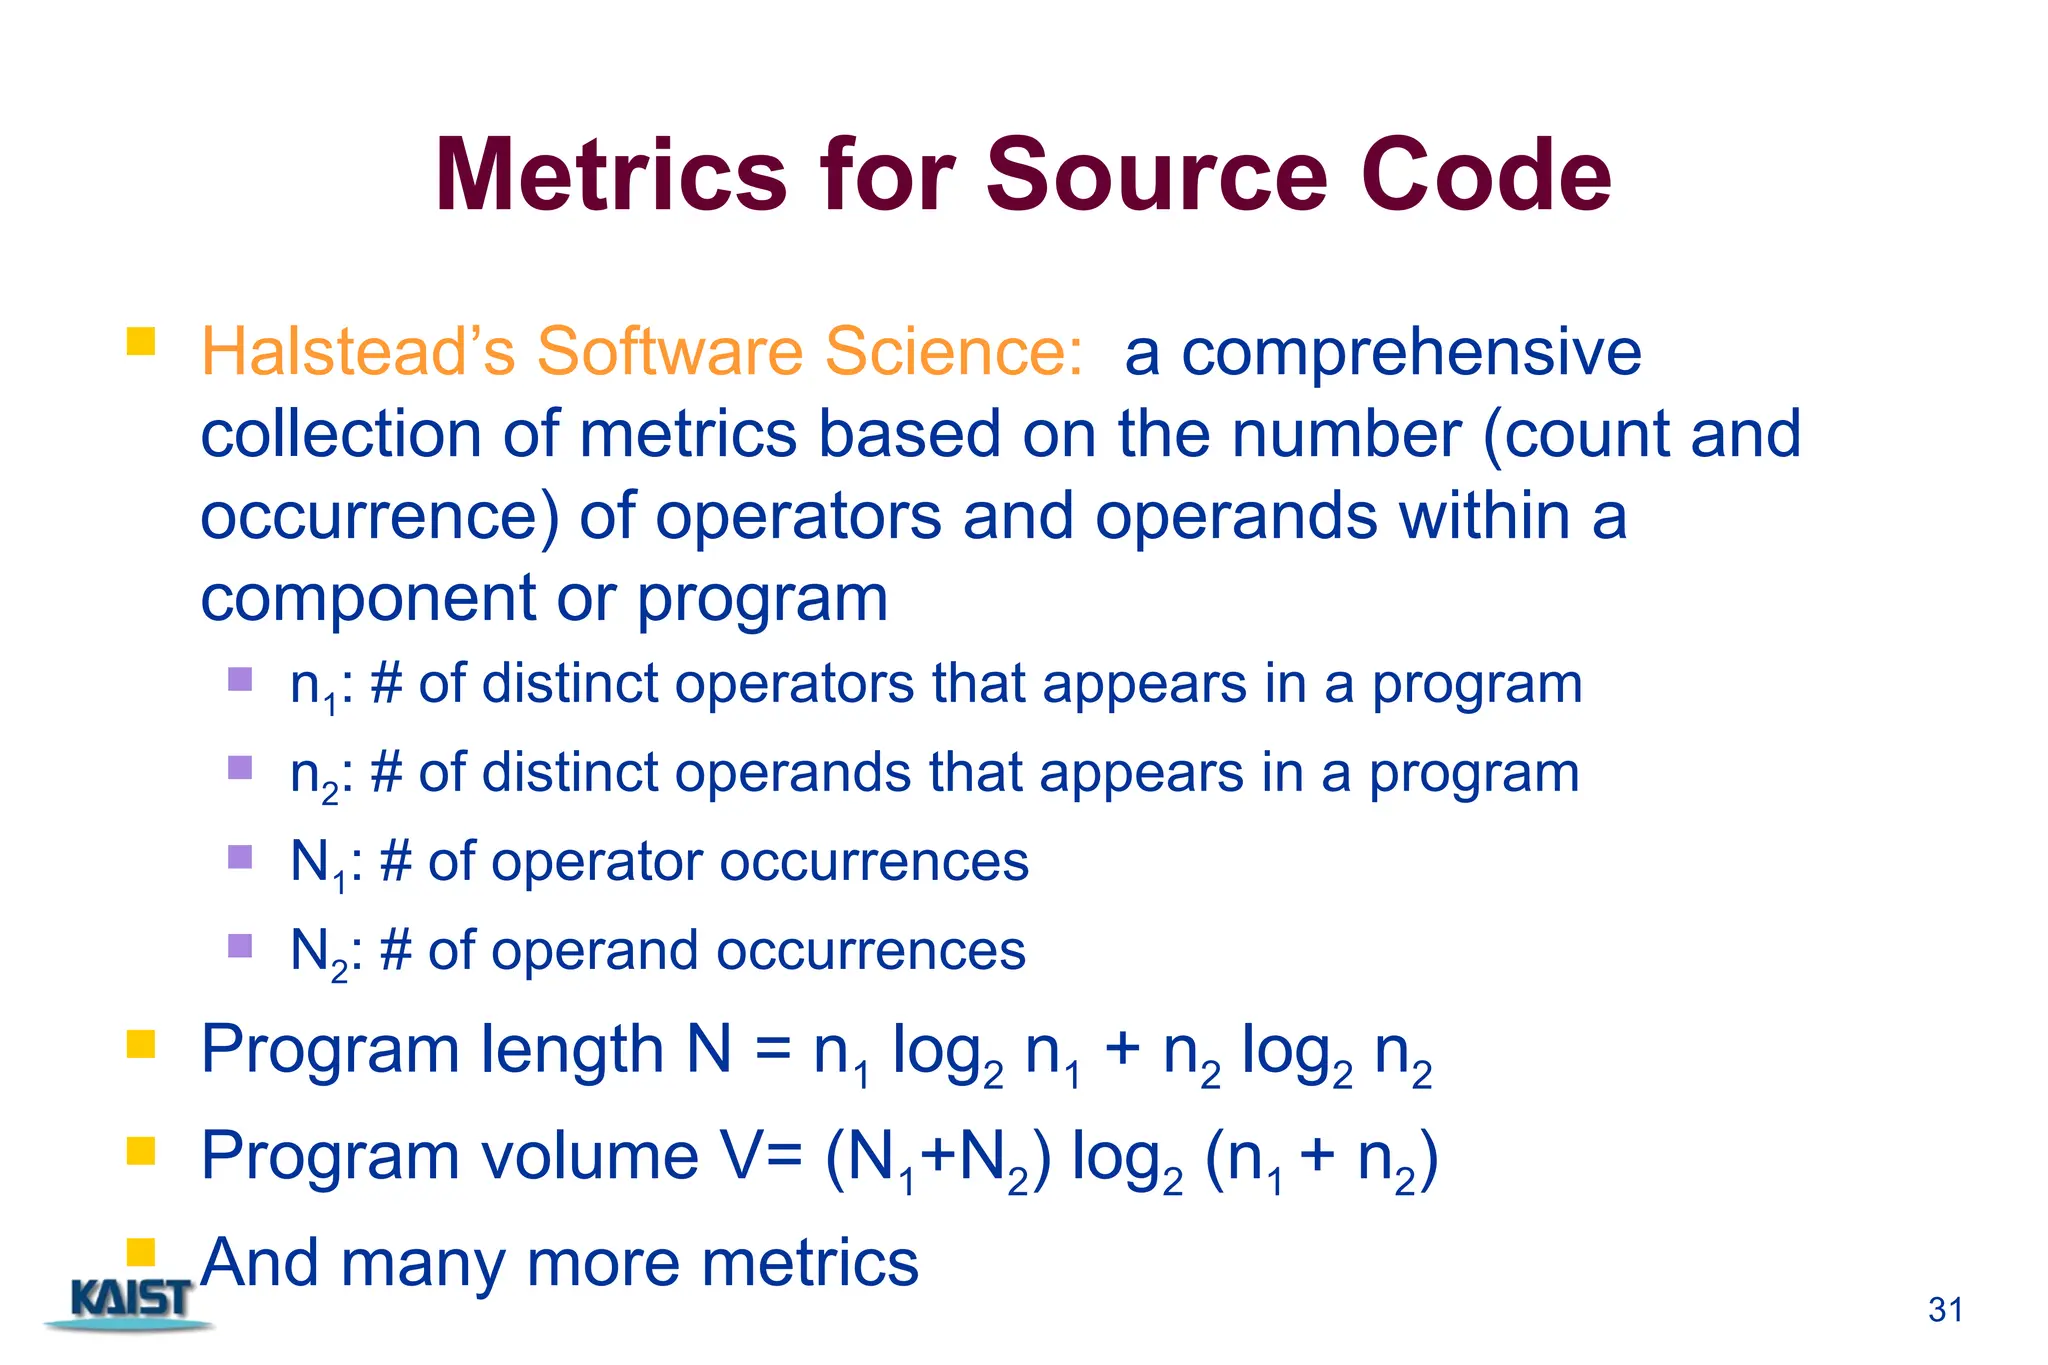
from Halstead measures
Binder [BIN94] suggests a broad array of design metrics
that have a direct influence on the “testability” of an OO
system.
Lack of cohesion in methods (LCOM).
Percent public and protected (PAP).
Public access to data members (PAD).
Number of root classes (NOR).
Fan-in (FIN).
Number of children (NOC) and depth of the inheritance tree (DIT).](https://image.slidesharecdn.com/lec16-ch30-241201144636-7e74f8ba/75/software-engineering-metrics-concpets-in-advanced-sotwrae-33-2048.jpg)
![34
Metrics for Maintenance
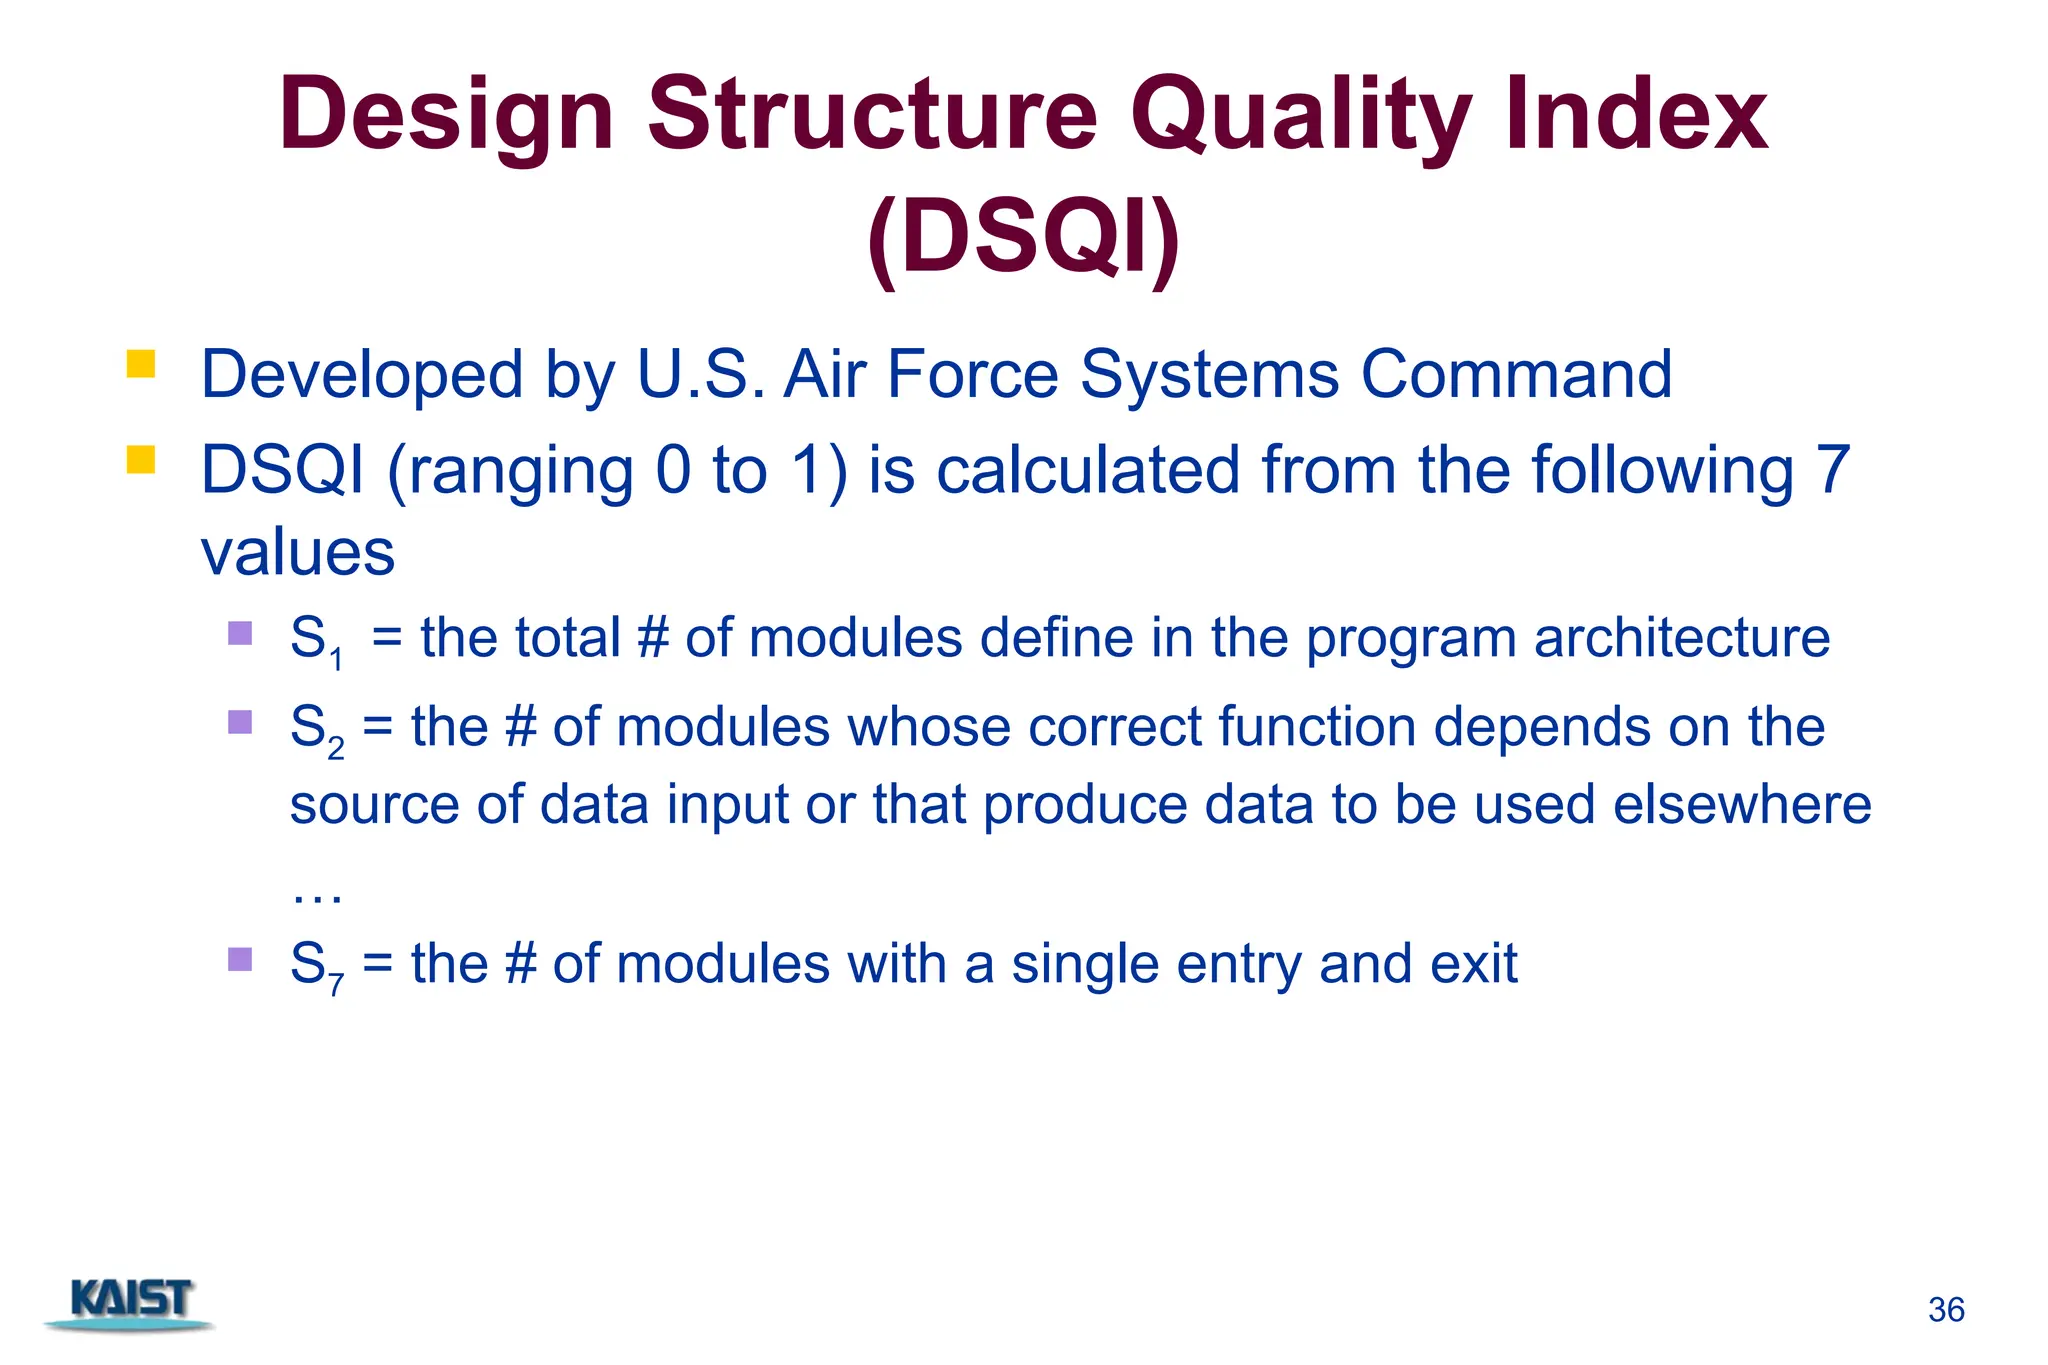
IEEE Std 982.1-1998 Software Maturity Index (SMI)
SMI = [Mt - (Fa + Fc + Fd)]/Mt
Mt = # of modules in the current release
Fc = # of modules in the current release that have been changed
Fa = # of modules in the current release that have been added
Fd = # of modules from the preceding release that were deleted
in the current release](https://image.slidesharecdn.com/lec16-ch30-241201144636-7e74f8ba/75/software-engineering-metrics-concpets-in-advanced-sotwrae-34-2048.jpg)