Download to read offline


![SAN DIEGO SOFTWARE DEVELOPMENT STUDY // 39
TECHEMPLOYMENT / ECOSYSTEM
METHODOLOGY
APPENDIX
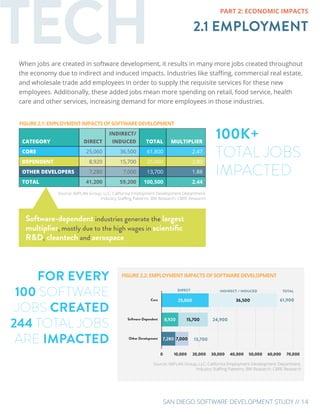
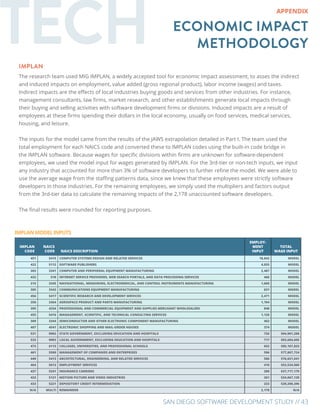
To define the software development ecosystem, the research team used a multi-layered methodology, starting with
occupation data from the Bureau of Labor Statistics and the California Employment Development Department. The
research team determined employment for software developers, web developers and computer programmers (all
referred to as software developers) as a base.
However, the goal of this research was to not only understand the number of developers, but determine where
these developers were working and how many total people in total work in the software development ecosystem.
To do this, the team used statewide Industry Staffing Patterns data developed by the California Employment
Development Department to determine which industries were most heavily concentrated with software developers.
The following diagram demonstrates this process.
DEFINING THE ECOSYSTEM
INDUSTRY
STAFFING
PATTERNS MATRIX
All 4-digit NAICS
SOFTWARE
DEVELOPERS
APPLICATIONS,
SYSTEMS, WEB
& COMPUTER
PROGRAMMERS
CORE,
DEPENDENT
& OTHER
DETERMINED
Select 4-digit NAICS
NON-SOFTWARE
REMOVED FROM
DEPENDENT
Dependent 4-digit
NAICS
FINAL COUNT
DETERMINED
Dependent 4-digit
NAICS
The team then determined which industries were most concentrated with developers,
based on their employment concentration within every 4-digit industry.
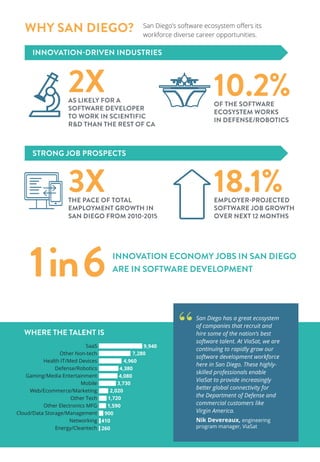
Research started with determining who the people are that develop software in the region.
We did this by looking through occupational definitions from the Bureau of Labor Statistics.
The following occupation codes were used: 15-1131, 15-1132, 15-1133 and 15-1134.
Clean breaks emerged and 20% concentration was determined to be a good threshold for
those industries that are in the core. All employment in these industries was used, since
we determined that software development was inextricable from the core, due to the high
presence of developers.
Dependent industries were those with more than 3% employment from software
developers, but below the 20% threshold. The remaining developers were considered
part of the ecosystem, but their industries were not heavily dependent on software
development. Nearly all of these leftover industries were non-technical.
We determined that dependent industries had a share of employment dedicated to
development beyond the software developers, but not all of it. We weighted employment
in these industries based the developer share of technical occupations, those in occupation
codes beginning with 11 to 27, which consists of scientists, managers, designers, engineers
and other technical occupations. Those beginning with 29 and higher were considered
supporting jobs.
For example, there were 34,771 people working in NAICS 5417 (scientific R&D services). We
know from staffing patterns that 2,158 were developers and 27,239 were other technical
positions like research scientists and lab technicians, for example. We took the developer
share of those positions [2,158 / (27,239 + 2,158) = 7.9%] and applied that share to the total
number of non-technical employees [7.9% * 4,979 = 395] to get the number of support
positions. See the table on the following page for all calculations.
Finally, we summed all core employment, the software share of dependent employment,
and the remaining developers not in core or dependent industries to get a final 41,260
number.](https://image.slidesharecdn.com/94db741b-507e-441b-8de1-a6b6c5bfabbc-160405152847/85/Software-Development-Full-Study-Final-44-320.jpg)


![BW Research Partnership
` SDREDC – Software
January 2016
Toplines (n=107)
`````````````````````````````````````````````````````````````````````````````````````````````````````````````````````````````````
Introduction:
Hello, my name is __________. May I speak to _________________ [IF NO NAME IS
DETERMINED USE] May I please speak to a manager or a decision maker who is involved in
planning, research or budgeting at [firm name]?
I am calling on behalf of BW Research, an independent research organization working on behalf
of the San Diego Regional Economic Development Corporation.
The survey will take a few minutes of your time and will help us better understand how to support
businesses in our region.
(If needed): This survey has been commissioned by the San Diego Regional Economic
Development Corporation, which is committed to supporting the businesses in the County.
(If needed): The survey is being conducted by BW Research, an independent research
organization, and should take approximately ten minutes of your time.
(If needed): Your individual responses will not be published; only aggregate information will be
used in the reporting of the survey results.
`````````````````````````````````````````````````````````````````````````````````````````````````````````````````````````````````
Screener Questions
A. Are you involved or leading the hiring, planning, or budgeting at your firm?
100.0% Yes [CONTINUE]
0.0% No [TERMINATE]
0.0% Not sure [TERMINATE]
B. How many business locations does your company or organization have in San Diego
County?
93.5% One business location
6.5% Two or more business locations
C. Is your company involved in any type of software or applications development or does your
firm employ, software developers, programmers or engineers?
53.3% Yes [CONTINUE ON LONG SURVEY]
46.7% No [CONTINUE ON SHORT SURVEY]
0.0% Not sure [TERMINATE]](https://image.slidesharecdn.com/94db741b-507e-441b-8de1-a6b6c5bfabbc-160405152847/85/Software-Development-Full-Study-Final-63-320.jpg)
![BW Research Partnership
[PART 1 – BUSINESS PROFILE AND CUSTOMER AND SUPPLIER CONNECTIONS]
1. How many years have you had at least one business location in San Diego County?
9.3% 0 to 2 years
14.0% More than 2 up to 5 years
17.8% More than 5 up to 10 years
36.4% More than 10 years up to 20 years
22.4% More than 20 years
Next I would like to ask about the industries that are most important to your firm.
2. What industry or industries best describes the work that your firm is involved in and
connected to? (DO NOT READ, ALLOW MORE THAN ONE RESPONSE)
26.2% Construction, architecture & engineering
11.2% Web design, web hosting & web marketing
10.3% Software
7.5% Biotech & life sciences
7.5% Manufacturing
6.5% Government
6.5% Healthcare & medical
5.6% Defense
4.7% Aerospace
2.8% Non-profit
2.8% Energy & environment
2.8% Finance & legal
2.8% Transportation
2.8% Agriculture
2.8% Electronics
1.9% Trade
1.9% Research & development
1.9% IT consulting & support
10.3% Other – no single category more than one response
0.0% DK/NA](https://image.slidesharecdn.com/94db741b-507e-441b-8de1-a6b6c5bfabbc-160405152847/85/Software-Development-Full-Study-Final-64-320.jpg)
![BW Research Partnership
3. Are your customers primarily local - within San Diego County, regional - within Southern
California, Statewide – within California, national – within the Country, or international -
outside the Country? [ALLOW MULTIPLE RESPONSES]
29.0% Local - San Diego County
21.5% Regional - Within Southern California
11.2% Statewide - Within California
43.9% National - Within the United States
27.1% International - Outside the United States
0.0% (DON'T READ) Don't know
4. Next, I would like to ask if your firm is primarily focused on serving customers in other
businesses, a b2b focus, or primarily focused on serving consumers directly or a combination
of both b2b and consumers?
68.2% Primarily businesses or B2B
5.6% Primarily consumers directly
23.4% A combination of both businesses and consumers
2.8% (DON'T READ) Don't know
5. What industry or industries are your customers primarily found in? (DO NOT READ, ALLOW
MORE THAN ONE RESPONSE)
18.7% Construction, architecture & engineering
15.0% Government
10.3% Trade
7.5% Biotech & life sciences
7.5% Manufacturing
7.5% Energy & environment
7.5% Finance & legal
6.5% Higher education
5.6% Defense
5.6% Healthcare & medical
3.7% Research & development
3.7% Aerospace
2.8% Web design, web hosting & web marketing
2.8% Electronics
1.9% Software
1.9% Transportation
1.9% Agriculture
12.1% Wide variety of industries
15.0% Other - no single category more than one response](https://image.slidesharecdn.com/94db741b-507e-441b-8de1-a6b6c5bfabbc-160405152847/85/Software-Development-Full-Study-Final-65-320.jpg)
![BW Research Partnership
[PART 2 – SOFTWARE PROFILE AND FUNDING]
For this survey, we will just be asking about the employees that work from or directly report to
your San Diego County location(s). [CONFIRM ZIP CODE OF THE CURRENT LOCATION/S]
6. Including all full-time and part-time employees, including permanent, contract and contingent
workers, how many work at or from your San Diego County location(s)? (n=57)
38.6% Less than 5
22.8% Between 5 and 9
19.3% Between 10 and 24
14.0% Between 25 and 49
3.5% Between 50 and 99
1.8% 100 or more
7. If you currently have [TAKE Q1 #] full-time and part-time employees, including permanent,
contract and contingent workers, how many more or less employees do you expect to have at
your San Diego County location(s) 12 months from now? (n=57)
Breakdown:
54.4% More
1.8% Fewer
36.8% Same number of employees
7.0% DK/NA
Expected Employment in 12 months
(Calculated by only examining businesses with both current and projected data)
Current 12 months
n 52 52
Mean 17.08 19.79
Median 5.00 7.00
Total Employees 888 1,029
Change 141
% Growth 15.9%
[If amount differs by 10% or more in either direction, ask: ]
Just to confirm, you currently have ____ employees and you expect to have _____ (more/less)
employees, for a total of ____ employees 12 months from now.](https://image.slidesharecdn.com/94db741b-507e-441b-8de1-a6b6c5bfabbc-160405152847/85/Software-Development-Full-Study-Final-66-320.jpg)
![BW Research Partnership
[IF Q1>1 THEN ASK Q8, OTHERWISE SKIP]
8. Over the last three years, has your company grown, declined or stayed about the same in
terms of permanent, contract and contingent employment at your San Diego County
location(s)? [If it has grown or declined, ask] By about how many people? (n=53)
Breakdown:
41.5% Grown
45.3% Stayed the same
13.2% Declined
0.0% DK/NA
Growth in Employment over last 36 months
(Calculated by only examining businesses with both current and past data)
36 months ago Current
n 50 50
Mean 15.20 17.40
Median 4.50 5.50
Total Employees 760 870
Change 110
% Growth 14.5%
Next I want you to think about the people at your work that are directly involved in developing
software or related applications, this could include software developers, programmers and
engineers as well as those individuals that are web developers and/or creating mobile
applications. [REMIND AND REPEAT SOFTWARE EMPLOYMENT DEFINITION AS NEEDED].
– CONFIRM DEFINITION
9. If you currently have [TAKE Q6 #] full-time and part-time permanent, contract & contingent
employees at your San Diego County location(s), how many of these employees are directly
engaged in developing software or related applications? (n=57)
35.1% Less than 3
56.1% Between 3 and 10
3.5% Between 11 and 24
3.5% Between 25 and 99
1.8% DK/NA](https://image.slidesharecdn.com/94db741b-507e-441b-8de1-a6b6c5bfabbc-160405152847/85/Software-Development-Full-Study-Final-67-320.jpg)
![BW Research Partnership
10. If you currently have [TAKE Q9 #] full-time and part-time permanent, contract & contingent
employees at your San Diego County location(s) who are directly engaged in developing
software or related applications, how many more or less software employees do you expect
to have at your location 12 months from now?
Breakdown:
43.9% More
1.8% Fewer
50.9% Same number of employees
3.5% DK/NA
Expected Software Employment in 12 months (outliers removed)
(Calculated by only examining businesses with both current and projected data)
Current 12 months
n 51 51
Mean 4.45 5.26
Median 3.00 4.00
Total Employees 227 268
Change 41
% Growth 18.1%
PART 3 - Location and Overall Rating for Economic Development
Next I want to ask about San Diego County as a place to do business for firms engaged in
software development
11. How would you rate San Diego County as a place to do business for firms that are engaged
in software development?
20.6% Excellent
47.7% Good
19.6% Fair
7.5% Poor
0.9% Very poor
3.7% (DON’T READ) DK/NA](https://image.slidesharecdn.com/94db741b-507e-441b-8de1-a6b6c5bfabbc-160405152847/85/Software-Development-Full-Study-Final-68-320.jpg)

![BW Research Partnership
Q12 w/ DK/NA removed
Very
satisfied
Somewhat
satisfied
Neither
satisfied
nor
dissatisfied
Somewhat
dissatisfied
Very
dissatisfied
A. Access to capital
(n=81)
28.4% 44.4% 13.6% 9.9% 3.7%
B. Access to clients
and customers
(n=94)
37.2% 40.4% 14.9% 5.3% 2.1%
C. Ability to recruit
experienced, high-
level software
developers (n=96)
22.9% 46.9% 12.5% 10.4% 7.3%
D. Ability to find
qualified entry to
mid-level software
developers (n=98)
26.5% 39.8% 9.2% 14.3% 10.2%
E. Access to relevant
vendors and
suppliers (n=99)
44.4% 43.4% 8.1% 2.0% 2.0%
F. Ability to retain
valued employees
over time (n=100)
44.0% 40.0% 9.0% 5.0% 2.0%
G. Access to other
firms you can
partner with that
provide similar
products or
services (n=96)
31.3% 45.8% 11.5% 7.3% 4.2%
H. Education and
training institutions
that help develop
software talent
(n=96)
35.4% 43.8% 8.3% 9.4% 3.1%
Next, I would like to ask you about financing or funding that your firm may have considered or
sought after.
13. Has your firm tried to get financing or funding in [IF NEEDED THIS COULD INCLUDE
TRADITIONAL BANK LOANS, VENTURE CAPITAL INVESTING AND/OR
CROWDFUNDING] the last five years [IF NEEDED FROM 2011 THROUGH 2015]? (n=57)
43.9% Yes
50.9% No
5.3% (DON'T READ) DK/NA](https://image.slidesharecdn.com/94db741b-507e-441b-8de1-a6b6c5bfabbc-160405152847/85/Software-Development-Full-Study-Final-70-320.jpg)
![BW Research Partnership
[IF Q13=”No” OR “Don’t know/ Refused” SKIP TO Q17 – ASK Q14 IF Q13 =1]
14. Over that 5 year time period, did your firm receive financing or funding? [IF NEEDED FROM
2010 THROUGH 2015]? (n=25)
96.0% Yes
4.0% No
0.0% Currently or still in the process of trying to get funding
0.0% (DON'T READ) DK/NA
[ASK Q15 IF Q14=”Yes”, “No” OR “Currently or still in the process of trying to get funding”]
15. What type of financing or funding did your firm receive (Q15=”Yes”) / try to get (Q15=”No” OR
“Currently or still in the process of trying to get funding”)? (n=25)
48.0% Traditional bank loan or small business loan
36.0% Angel investment
20.0% Grant funding, such as SBIR of STTR
16.0% Venture capital investment
8.0% (DON'T READ) Not sure
16. How much difficulty has (did) your firm had (have) getting financing? (n=25)
24.0% Little to no difficulty
64.0% Some difficulty
12.0% Great difficulty
0.0% (DON'T READ) DK/NA
PART 4 – Workforce Development & Skills Assessment
Now I would like to ask about your organization’s need for new employees.
17. Thinking about the positions related to software development you hire at your San Diego
County location(s), how much difficulty does your company have finding qualified applicants
who meet the organization’s hiring standards? (n=57)
24.6% Little to no difficulty
50.9% Some difficulty
21.1% Great difficulty
3.5% (DON'T READ) DK/NA](https://image.slidesharecdn.com/94db741b-507e-441b-8de1-a6b6c5bfabbc-160405152847/85/Software-Development-Full-Study-Final-71-320.jpg)


![BW Research Partnership
Software: San Diego County - EI page 2
I. Profile & General Information [FILL OUT IN ADVANCE AS INFORMATION IS AVAILABLE]
Let me begin by asking a few general questions about [NAME OF ORGANIZATION]
1. What is your title or position within the firm?
[Record title] ______________________________
2. How long have you been with the organization?
[Record years / months] ______________________________
3. What industry would you say your firm is in?
_______________________________________________________________________
_______________________________________________________________________
_______________________________________________________________________
4. What industry or industries are your customers primarily in?
__________________________________________________________________________
__________________________________________________________________________
_________________________________________________________________
5. What location(s) does your firm have in San Diego County?
_______________________________________________________________________
_______________________________________________________________________
_______________________________________________________________________
6. Does your firm have location(s) outside of San Diego County and is yes, where (where are
your Headquarters)?
_______________________________________________________________________
_______________________________________________________________________
_______________________________________________________________________
7. Over the next 12 months do you expect to be increasing, decreasing or maintaining about the
same number of employees in San Diego County?
[IF MORE OR LESS, ASSESS HOW MANY]
1 Increasing How many? _______________
2 Decreasing How many? _______________
3 Maintaining about the same number](https://image.slidesharecdn.com/94db741b-507e-441b-8de1-a6b6c5bfabbc-160405152847/85/Software-Development-Full-Study-Final-76-320.jpg)
![BW Research Partnership
Software: San Diego County - EI page 3
II. Access to Capital
I would like to ask you about financing or funding that your firm may have considered or sought
after.
8. Has your firm tried to get financing or funding, if yes, did you end up getting funded, how
(traditional loan, angel, VC, Grant funding…), and what was the funding for?
__________________________________________________________________________
__________________________________________________________________________
__________________________________________________________________________
9. [IF THEY RECEIVED FUNDING FOLLOW UP WITH] Was the firm that funded or financed
your organization in San Diego, if not what City, and what role does location play in getting
funded, if at all?
__________________________________________________________________________
__________________________________________________________________________
__________________________________________________________________________
10. Is getting funding a challenge or difficulty for firms like yours, and if it is why and what can be
done to improve the situation?
__________________________________________________________________________
__________________________________________________________________________
__________________________________________________________________________
Know I want to ask you about those positions related to software and software
development, this could include software engineers, developers, programmers and web
developers or any other position at your firm that requires programming or working
knowledge of software development (systems or applications).
III. Talent & Workforce
11. Over the next 12 months do you expect to be increasing, decreasing or maintaining about the
same number of software development employees in San Diego County?
[IF MORE OR LESS, ASSESS HOW MANY]
1 Increasing How many? _______________
2 Decreasing How many? _______________
3 Maintaining about the same number](https://image.slidesharecdn.com/94db741b-507e-441b-8de1-a6b6c5bfabbc-160405152847/85/Software-Development-Full-Study-Final-77-320.jpg)
![BW Research Partnership
Software: San Diego County - EI page 4
Next I want to briefly ask you about recruiting and evaluating new software and/or software
development employees.
12. What are the most immediate workforce or talent needs related to software develop at your
firm? [WAIT FOR INITIAL RESPONSE AND THEN PROBE ON – SHORT TERM NEEDS 6
to 24 MONTHS]
a. Key occupations
b. Skills and abilities
c. Deficiencies among current job applicants
d. Key areas of education & training
e. Key computer programming languages or software/hardware that is important
f. New emerging employment opportunities
13. What are the key characteristics and/or attributes you are looking for when hiring someone in
these positions? [WAIT FOR INITIAL RESPONSE AND THEN PROBE ON]
a. Nontechnical skills (attitude and attributes)
b. Technical skills (Certificates, programming languages, applications.,)
c. Academic background (Degree level and type)
14. What would you recommend to current High School or College students who want to work in
the software development in the next 3 to 5 years, in terms of skills, training and education
they should focus on? [WAIT FOR INITIAL RESPONSE AND THEN PROBE ON- LONG
TERM NEEDS 3 to 5 YEARS]
15. Are there any education, training, or degree/certificate programs that you would like to see
offered in the region to prepare workers who are engaged or moving into software
development?
PROBE 1 – Are there any programs that are already in existence that you think should be
copied or expanded?
__________________________________________________________________________
__________________________________________________________________________
PROBE 2 – Are there any technologies, applications or programming languages that you
think students and job-seekers should focus on if they want to work in software development?
__________________________________________________________________________
__________________________________________________________________________](https://image.slidesharecdn.com/94db741b-507e-441b-8de1-a6b6c5bfabbc-160405152847/85/Software-Development-Full-Study-Final-78-320.jpg)
![BW Research Partnership
Software: San Diego County - EI page 5
IV. Regional Assessment
16. What are the strengths or advantages and weaknesses or disadvantages of software
development in San Diego? [WAIT FOR INITIAL RESPONSE AND THEN PROBE ON]
a. Key resources or programs in San Diego County that are a strength in the region
in software development
b. Obstacles or challenges in San Diego County for firms engaged in software
development and/or creating new software products/applications.
17. Have you done any work in Software development outside of San Diego County?
a. Yes (continue to Q14)
b. No (Thank and Finish)
18. What do you see as the key regions for software development and how do they compare to
San Diego County? [WAIT FOR INITIAL RESPONSE AND THEN PROBE ON]
a. Key Strengths & Weaknesses in
i. Bay Area (Silicon Valley, San Francisco, Oakland)
ii. Seattle
iii. Boston
iv. Austin
v. North Carolina Research Triangle](https://image.slidesharecdn.com/94db741b-507e-441b-8de1-a6b6c5bfabbc-160405152847/85/Software-Development-Full-Study-Final-79-320.jpg)


This document analyzes San Diego's software ecosystem and its economic impact. It finds that software development has a $12.2 billion total economic impact and supports over 100,000 jobs in San Diego. San Diego ranks 10th among major US metro areas in a "software power index" that measures factors like the concentration of software developers and capital investment. The software industry is growing rapidly in San Diego, with an expected 18.1% growth in software jobs over the next year.


