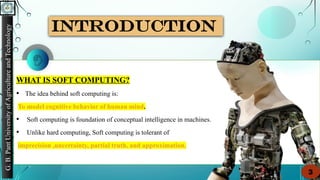
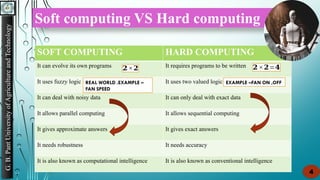
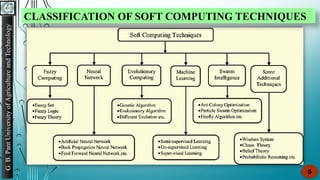
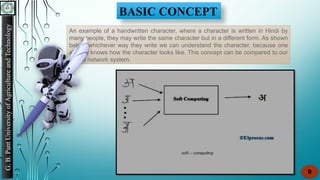
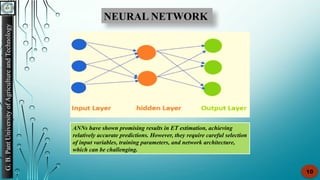
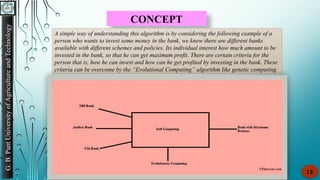
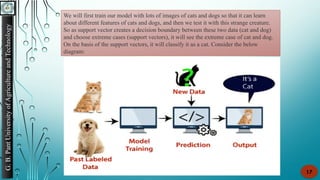
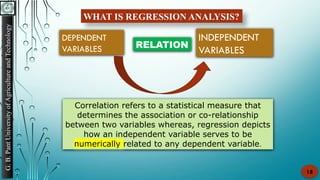
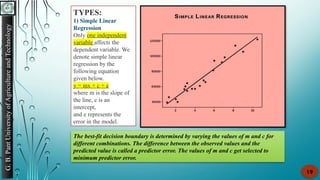
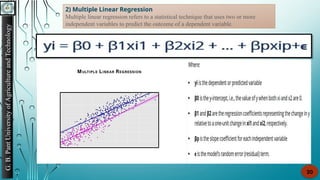
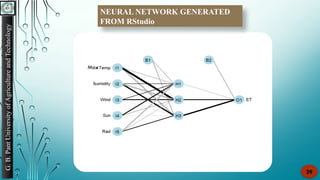
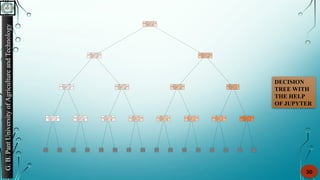
EVALUATION OF SOFT COMPUTING TECHNIQUES AND REGRESSION
BASED TECHNIQUES IN ESTIMATING EVAPOTRANSPIRATION
G. B. Pant University of Agriculture and Technology
SOUMYA POKHARIYA
Department of Agrometeorology
1
FLOW OF SEMINAR
G.
B.
Pant
University
of
Agriculture
and
Technology
Introduction
Soft Computing VS Hard Computing
Classification of Soft Computing techniques
Regression Analysis and its Types
Case Study 1
Case Study 2
Conclusion
2
WHAT IS SOFT COMPUTING?
• The idea behind soft computing is:
To model cognitive behavior of human mind.
• Soft computing is foundation of conceptual intelligence in machines.
• Unlike hard computing, Soft computing is tolerant of
imprecision ,uncertainty, partial truth, and approximation.
G.
B.
Pant
University
of
Agriculture
and
Technology
INTRODUCTION
3
Soft computing VS Hard computing
G.
B.
Pant
University
of
Agriculture
and
Technology
4
G.
B.
Pant
University
of
Agriculture
and
Technology
SOFT COMPUTING HARD COMPUTING
It can evolve its own programs It requires programs to be written
It uses fuzzy logic It uses two valued logic
It can deal with noisy data It can only deal with exact data
It allows parallel computing It allows sequential computing
It gives approximate answers It gives exact answers
It needs robustness It needs accuracy
It is also known as computational intelligence It is also known as conventional intelligence
REAL WORLD .EXAMPLE –
FAN SPEED
𝟐×𝟐 𝟐×𝟐=𝟒
EXAMPLE –FAN ON ,OFF
G.
B.
Pant
University
of
Agriculture
and
Technology
5
CLASSIFICATION OF SOFT COMPUTING TECHNIQUES
FUZZY LOGIC
G.
B.
Pant
University
of
Agriculture
and
Technology
6
• The word ‘fuzzy’ means things that are not pretty much clear or doubtful.
• Explains uncertainties and inaccuracies of the situation in a better way.
• Boolean logic0,1.
• Represent with Degree.
If we talk about the system value then we have 1 which is responsible for the true value, and on another
side, we have 0 which represents the absolute false value. But in the case of fuzzy logic, we do not have
such scenarios where the value is absolutely true or false, it provides us the flexibility where a value can
be partially true or partially false. In short, it provides us the intermediate value to represent this kind of
scenario.
MATHEMATICAL
LANGUAGE
RELATIONAL LOGIC BOOLEAN LOGIC PREDICATE LOGIC
DEALS WITH
FUZZY SETS AND
FUZZY ALGEBRA
Term By Lotfi Zadeh Of
University Of California
At Berkeley In 1965
G.
B.
Pant
University
of
Agriculture
and
Technology
7
FLSs have been successfully employed in ET estimation, especially in cases where data
is limited or uncertain. They can provide interpretable outputs and capture expert
knowledge effectively.
CURRENT LOCATION
DESTINATION
EXAMPLE
NEURAL NETWORK
G.
B.
Pant
University
of
Agriculture
and
Technology
8
They were first
introduced by
McCelloch et al. in
the mid-’40 s of the
last century.
G.
B.
Pant
University
of
Agriculture
and
Technology
9
An example of a handwritten character, where a character is written in Hindi by
many people, they may write the same character but in a different form. As shown
below, whichever way they write we can understand the character, because one
already knows how the character looks like. This concept can be compared to our
neural network system.
BASIC CONCEPT
G.
B.
Pant
University
of
Agriculture
and
Technology
10
NEURAL NETWORK
ANNs have shown promising results in ET estimation, achieving
relatively accurate predictions. However, they require careful selection
of input variables, training parameters, and network architecture,
which can be challenging.
G.
B.
Pant
University
of
Agriculture
and
Technology
11
EVOLUTIONARY ALGORITHMS
• Evolutionary algorithms are inspired by the process of natural evolution.
• They use a population of candidate solutions that evolve over generations through mechanisms like
selection, mutation, and crossover.
• Evolutionary algorithms are well-suited for optimization problems, especially when the solution space
is large and complex.
• Genetic Algorithm in Soft Computing
The genetic algorithm was introduced by Prof. John Holland in 1965. It is used to solve problems based on
principles of natural selection, that come under evolutionary algorithm. GAs are optimization techniques
that mimic the process of natural selection. They have been applied to calibrate ET models and optimize
model parameters. GAs can search large solution spaces efficiently and find optimal or near-optimal
solutions. When combined with other modeling techniques, GAs have shown improved performance in ET
estimation, enabling the identification of optimal model configurations and parameter values.
• Functions of the Genetic Algorithm
The genetic algorithm can solve the problems which cannot be solved in real-time also known as the NP-
Hard problem.
The complicated problems which cannot be solved mathematically can be easily solved by applying the
genetic algorithm. It is a heuristic search or randomized search method, which provides an initial set of
solutions and generate a solution to the problem efficiently and effectively.
G.
B.
Pant
University
of
Agriculture
and
Technology
12
CONCEPT
A simple way of understanding this algorithm is by considering the following example of a
person who wants to invest some money in the bank, we know there are different banks
available with different schemes and policies. Its individual interest how much amount to be
invested in the bank, so that he can get maximum profit. There are certain criteria for the
person that is, how he can invest and how can he get profited by investing in the bank. These
criteria can be overcome by the “Evolutional Computing” algorithm like genetic computing.
G.
B.
Pant
University
of
Agriculture
and
Technology
13
SWARM INTELLIGENCE
• Swarm Intelligence (S.I.) was introduced by Gerardo Beni and Jing Wang in the year 1989.
• “Swarm” means a group of objects (people, insects, etc.).
• Swarm intelligence is a branch of soft computing that draws inspiration from the collective
behavior of social insect colonies, such as ants, bees, and termites.
• It involves the study and emulation of the decentralized and self-organized behavior exhibited by
these swarms to solve complex problems.
• Swarm intelligence algorithms aim to harness the collective intelligence of a group of
simple individuals to achieve robustness, adaptability, and efficiency.
1.Particle Swarm Optimization (PSO): PSO is a population-based
optimization technique that is inspired by the behavior of social swarms, such
as flocks of birds or schools of fish. It involves a set of candidate solutions
(particles) that move through a search space to find the optimal solution. PSO
is often employed in optimization problems with continuous or discrete
variables.
2.Ant Colony Optimization (ACO): ACO is inspired by the behavior of ant
colonies in finding the shortest path between their nest and food sources. It is
particularly effective for solving combinatorial optimization problems, such as
the traveling salesman problem. ACO algorithms use pheromone-based
communication and probabilistic decision-making to iteratively improve
G.
B.
Pant
University
of
Agriculture
and
Technology
14
CONCEPT
Response from 10 people
Average:
(400 + 450 + 550 + 600 + 480 + 390 + 520 + 490 + 510 + 450) / 10
Average = 4840 / 10
= 484 (marbles in the jar)
Now from this, we can say that from the collective predictions from 10
different persons we have reached a more optimal answer that is 484 marbles in
the jar. We are very close to the actual result of 500 marbles in the jar, here in
this case the difference (error) reduces to only 16 marbles as compared to the
previous error which was 100. So that is the main idea behind swarm
intelligence, that is to use the collective knowledge of objects.
500 MARBLES
400 MARBLES
ERROR OF
100
G.
B.
Pant
University
of
Agriculture
and
Technology
15
SVM(SUPPORT VECTOR MACHINE)
MACHINE LEARNING • SUPERVISED LEARNING
• UNSUPERVISED LEARNING
• REINFORCEMENT LEARNING
LABELED DATA
MODEL
TRAINING
PREDICTION NEW DATA
OUTPUT
• SVM is used for
classification and
regression tasks.
• Developed at
AT&T Bell Laborato
ries
by Vladimir Vapnik
with colleagues
(Boser et al., 1992,
Guyon et al., 1993,
Cortes and Vapnik,
1995, Vapnik et al.,
1997)
G.
B.
Pant
University
of
Agriculture
and
Technology
16
SVM chooses the extreme points/vectors that help in creating the hyperplane. These extreme cases are called
as support vectors, and hence algorithm is termed as Support Vector Machine. Consider the below diagram
in which there are two different categories that are classified using a decision boundary or hyperplane:
G.
B.
Pant
University
of
Agriculture
and
Technology
17
We will first train our model with lots of images of cats and dogs so that it can learn
about different features of cats and dogs, and then we test it with this strange creature.
So as support vector creates a decision boundary between these two data (cat and dog)
and choose extreme cases (support vectors), it will see the extreme case of cat and dog.
On the basis of the support vectors, it will classify it as a cat. Consider the below
diagram:
G.
B.
Pant
University
of
Agriculture
and
Technology
18
WHAT IS REGRESSION ANALYSIS?
DEPENDENT
VARIABLES
INDEPENDENT
VARIABLES
RELATION
Correlation refers to a statistical measure that
determines the association or co-relationship
between two variables whereas, regression depicts
how an independent variable serves to be
numerically related to any dependent variable.
G.
B.
Pant
University
of
Agriculture
and
Technology
19
The best-fit decision boundary is determined by varying the values of m and c for
different combinations. The difference between the observed values and the
predicted value is called a predictor error. The values of m and c get selected to
minimum predictor error.
TYPES:
1) Simple Linear
Regression
Only one independent
variable affects the
dependent variable. We
denote simple linear
regression by the
following equation
given below.
y = mx + c + e
where m is the slope of
the line, c is an
intercept,
and e represents the
error in the model.
G.
B.
Pant
University
of
Agriculture
and
Technology
20
2) Multiple Linear Regression
Multiple linear regression refers to a statistical technique that uses two or more
independent variables to predict the outcome of a dependent variable.
G.
B.
Pant
University
of
Agriculture
and
Technology
21
3) Polynomial Regression
In a polynomial regression, the power of the independent variable is more than 1.
The equation below represents a polynomial equation:
y = a + bx2
In this regression technique, the best fit line is not a straight line. It is rather a
curve that fits into the data points.
G.
B.
Pant
University
of
Agriculture
and
Technology
22
4) Logistic Regression
Logistic regression is a type of regression technique when the dependent variable is
discrete. Example: 0 or 1, true or false, etc. This means the target variable can have only two
values, and a sigmoid function shows the relation between the target variable and the
independent variable.
The logistic function is used in Logistic Regression to create a relation between the target
variable and independent variables. The below equation denotes the logistic regression.
here p is the probability of occurrence of the feature.
G.
B.
Pant
University
of
Agriculture
and
Technology
23
5) Ridge Regression
G.
B.
Pant
University
of
Agriculture
and
Technology
24
6) Lasso Regression
G.
B.
Pant
University
of
Agriculture
and
Technology
25
8) Decision Tree Regression
Decision tree builds regression or classification models in the form of a
tree structure. It breaks down a dataset into smaller and smaller subsets
while at the same time an associated decision tree is incrementally
developed. The final result is a tree with decision nodes and leaf nodes. A
decision node (e.g., Outlook) has two or more branches (e.g., Sunny,
Overcast and Rainy), each representing values for the attribute tested.
Leaf node (e.g., Hours Played) represents a decision on the numerical
target. The topmost decision node in a tree which corresponds to the best
predictor called root node.
G.
B.
Pant
University
of
Agriculture
and
Technology
26
9) Random Forest Regression
"Random Forest is a classifier that contains a number of decision trees on various subsets of
the given dataset and takes the average to improve the predictive accuracy of that
dataset." Instead of relying on one decision tree, the random forest takes the prediction
from each tree and based on the majority votes of predictions, and it predicts the final
output.
The greater number of trees in the forest leads to higher accuracy and prevents the
problem of overfitting.
G.
B.
Pant
University
of
Agriculture
and
Technology
27
EXAMPLES OF MODELS GENERATED USING THESE TECHNIQUES
FUZZY
EVAPOTRANSPIRATION
MODEL
The control rules for estimating ET were based on
known relationships between RS, RH, and ET.
These were expressed in linguistic terms by IF–THEN
statements. For example:
Rule 1:1 If RS is VERY LOW and RH is MEDIUM,
then ET is VERY LOW,
Rule 1:2 If RS is MEDIUM and RH is MEDIUM, then
ET is LOW,
Rule 1:3 If RS is HIGH and RH is LOW, then ET is
HIGH, etc.
The IF part of the rule statement is referred to as the
antecedent, and the THEN part is referred to as the
consequent.
G.
B.
Pant
University
of
Agriculture
and
Technology
28
REGRESSION ANALYSIS OF ACTUAL EVAPOTRANSPIRATION AS OUTPUT
WHEN Minimum temperature (°C), ,Maximum temperature (°C), wind speed(kmph),
Average relative humidity(%) , Solar radiation (MJ/m²/day), Sunshine hours (hrs.)
and rainfall(mm/day).
G.
B.
Pant
University
of
Agriculture
and
Technology
29
NEURAL NETWORK GENERATED
FROM RStudio
Max
h
DECISION
TREE WITH
THE HELP
OF JUPYTER
G.
B.
Pant
University
of
Agriculture
and
Technology
30
Thank You
EVERY
ENDING IS
JUST A NEW
BEGINNING !!!
G.
B.
Pant
University
of
Agriculture
and
Technology
52

Soft computing techniques and regression techniques

  • 1.
    EVALUATION OF SOFTCOMPUTING TECHNIQUES AND REGRESSION BASED TECHNIQUES IN ESTIMATING EVAPOTRANSPIRATION G. B. Pant University of Agriculture and Technology SOUMYA POKHARIYA Department of Agrometeorology 1
  • 2.
    FLOW OF SEMINAR G. B. Pant University of Agriculture and Technology Introduction SoftComputing VS Hard Computing Classification of Soft Computing techniques Regression Analysis and its Types Case Study 1 Case Study 2 Conclusion 2
  • 3.
    WHAT IS SOFTCOMPUTING? • The idea behind soft computing is: To model cognitive behavior of human mind. • Soft computing is foundation of conceptual intelligence in machines. • Unlike hard computing, Soft computing is tolerant of imprecision ,uncertainty, partial truth, and approximation. G. B. Pant University of Agriculture and Technology INTRODUCTION 3
  • 4.
    Soft computing VSHard computing G. B. Pant University of Agriculture and Technology 4 G. B. Pant University of Agriculture and Technology SOFT COMPUTING HARD COMPUTING It can evolve its own programs It requires programs to be written It uses fuzzy logic It uses two valued logic It can deal with noisy data It can only deal with exact data It allows parallel computing It allows sequential computing It gives approximate answers It gives exact answers It needs robustness It needs accuracy It is also known as computational intelligence It is also known as conventional intelligence REAL WORLD .EXAMPLE – FAN SPEED 𝟐×𝟐 𝟐×𝟐=𝟒 EXAMPLE –FAN ON ,OFF
  • 5.
  • 6.
    FUZZY LOGIC G. B. Pant University of Agriculture and Technology 6 • Theword ‘fuzzy’ means things that are not pretty much clear or doubtful. • Explains uncertainties and inaccuracies of the situation in a better way. • Boolean logic0,1. • Represent with Degree. If we talk about the system value then we have 1 which is responsible for the true value, and on another side, we have 0 which represents the absolute false value. But in the case of fuzzy logic, we do not have such scenarios where the value is absolutely true or false, it provides us the flexibility where a value can be partially true or partially false. In short, it provides us the intermediate value to represent this kind of scenario. MATHEMATICAL LANGUAGE RELATIONAL LOGIC BOOLEAN LOGIC PREDICATE LOGIC DEALS WITH FUZZY SETS AND FUZZY ALGEBRA Term By Lotfi Zadeh Of University Of California At Berkeley In 1965
  • 7.
    G. B. Pant University of Agriculture and Technology 7 FLSs have beensuccessfully employed in ET estimation, especially in cases where data is limited or uncertain. They can provide interpretable outputs and capture expert knowledge effectively. CURRENT LOCATION DESTINATION EXAMPLE
  • 8.
    NEURAL NETWORK G. B. Pant University of Agriculture and Technology 8 They werefirst introduced by McCelloch et al. in the mid-’40 s of the last century.
  • 9.
    G. B. Pant University of Agriculture and Technology 9 An example ofa handwritten character, where a character is written in Hindi by many people, they may write the same character but in a different form. As shown below, whichever way they write we can understand the character, because one already knows how the character looks like. This concept can be compared to our neural network system. BASIC CONCEPT
  • 10.
    G. B. Pant University of Agriculture and Technology 10 NEURAL NETWORK ANNs haveshown promising results in ET estimation, achieving relatively accurate predictions. However, they require careful selection of input variables, training parameters, and network architecture, which can be challenging.
  • 11.
    G. B. Pant University of Agriculture and Technology 11 EVOLUTIONARY ALGORITHMS • Evolutionaryalgorithms are inspired by the process of natural evolution. • They use a population of candidate solutions that evolve over generations through mechanisms like selection, mutation, and crossover. • Evolutionary algorithms are well-suited for optimization problems, especially when the solution space is large and complex. • Genetic Algorithm in Soft Computing The genetic algorithm was introduced by Prof. John Holland in 1965. It is used to solve problems based on principles of natural selection, that come under evolutionary algorithm. GAs are optimization techniques that mimic the process of natural selection. They have been applied to calibrate ET models and optimize model parameters. GAs can search large solution spaces efficiently and find optimal or near-optimal solutions. When combined with other modeling techniques, GAs have shown improved performance in ET estimation, enabling the identification of optimal model configurations and parameter values. • Functions of the Genetic Algorithm The genetic algorithm can solve the problems which cannot be solved in real-time also known as the NP- Hard problem. The complicated problems which cannot be solved mathematically can be easily solved by applying the genetic algorithm. It is a heuristic search or randomized search method, which provides an initial set of solutions and generate a solution to the problem efficiently and effectively.
  • 12.
    G. B. Pant University of Agriculture and Technology 12 CONCEPT A simple wayof understanding this algorithm is by considering the following example of a person who wants to invest some money in the bank, we know there are different banks available with different schemes and policies. Its individual interest how much amount to be invested in the bank, so that he can get maximum profit. There are certain criteria for the person that is, how he can invest and how can he get profited by investing in the bank. These criteria can be overcome by the “Evolutional Computing” algorithm like genetic computing.
  • 13.
    G. B. Pant University of Agriculture and Technology 13 SWARM INTELLIGENCE • SwarmIntelligence (S.I.) was introduced by Gerardo Beni and Jing Wang in the year 1989. • “Swarm” means a group of objects (people, insects, etc.). • Swarm intelligence is a branch of soft computing that draws inspiration from the collective behavior of social insect colonies, such as ants, bees, and termites. • It involves the study and emulation of the decentralized and self-organized behavior exhibited by these swarms to solve complex problems. • Swarm intelligence algorithms aim to harness the collective intelligence of a group of simple individuals to achieve robustness, adaptability, and efficiency. 1.Particle Swarm Optimization (PSO): PSO is a population-based optimization technique that is inspired by the behavior of social swarms, such as flocks of birds or schools of fish. It involves a set of candidate solutions (particles) that move through a search space to find the optimal solution. PSO is often employed in optimization problems with continuous or discrete variables. 2.Ant Colony Optimization (ACO): ACO is inspired by the behavior of ant colonies in finding the shortest path between their nest and food sources. It is particularly effective for solving combinatorial optimization problems, such as the traveling salesman problem. ACO algorithms use pheromone-based communication and probabilistic decision-making to iteratively improve
  • 14.
    G. B. Pant University of Agriculture and Technology 14 CONCEPT Response from 10people Average: (400 + 450 + 550 + 600 + 480 + 390 + 520 + 490 + 510 + 450) / 10 Average = 4840 / 10 = 484 (marbles in the jar) Now from this, we can say that from the collective predictions from 10 different persons we have reached a more optimal answer that is 484 marbles in the jar. We are very close to the actual result of 500 marbles in the jar, here in this case the difference (error) reduces to only 16 marbles as compared to the previous error which was 100. So that is the main idea behind swarm intelligence, that is to use the collective knowledge of objects. 500 MARBLES 400 MARBLES ERROR OF 100
  • 15.
    G. B. Pant University of Agriculture and Technology 15 SVM(SUPPORT VECTOR MACHINE) MACHINELEARNING • SUPERVISED LEARNING • UNSUPERVISED LEARNING • REINFORCEMENT LEARNING LABELED DATA MODEL TRAINING PREDICTION NEW DATA OUTPUT • SVM is used for classification and regression tasks. • Developed at AT&T Bell Laborato ries by Vladimir Vapnik with colleagues (Boser et al., 1992, Guyon et al., 1993, Cortes and Vapnik, 1995, Vapnik et al., 1997)
  • 16.
    G. B. Pant University of Agriculture and Technology 16 SVM chooses theextreme points/vectors that help in creating the hyperplane. These extreme cases are called as support vectors, and hence algorithm is termed as Support Vector Machine. Consider the below diagram in which there are two different categories that are classified using a decision boundary or hyperplane:
  • 17.
    G. B. Pant University of Agriculture and Technology 17 We will firsttrain our model with lots of images of cats and dogs so that it can learn about different features of cats and dogs, and then we test it with this strange creature. So as support vector creates a decision boundary between these two data (cat and dog) and choose extreme cases (support vectors), it will see the extreme case of cat and dog. On the basis of the support vectors, it will classify it as a cat. Consider the below diagram:
  • 18.
    G. B. Pant University of Agriculture and Technology 18 WHAT IS REGRESSIONANALYSIS? DEPENDENT VARIABLES INDEPENDENT VARIABLES RELATION Correlation refers to a statistical measure that determines the association or co-relationship between two variables whereas, regression depicts how an independent variable serves to be numerically related to any dependent variable.
  • 19.
    G. B. Pant University of Agriculture and Technology 19 The best-fit decisionboundary is determined by varying the values of m and c for different combinations. The difference between the observed values and the predicted value is called a predictor error. The values of m and c get selected to minimum predictor error. TYPES: 1) Simple Linear Regression Only one independent variable affects the dependent variable. We denote simple linear regression by the following equation given below. y = mx + c + e where m is the slope of the line, c is an intercept, and e represents the error in the model.
  • 20.
    G. B. Pant University of Agriculture and Technology 20 2) Multiple LinearRegression Multiple linear regression refers to a statistical technique that uses two or more independent variables to predict the outcome of a dependent variable.
  • 21.
    G. B. Pant University of Agriculture and Technology 21 3) Polynomial Regression Ina polynomial regression, the power of the independent variable is more than 1. The equation below represents a polynomial equation: y = a + bx2 In this regression technique, the best fit line is not a straight line. It is rather a curve that fits into the data points.
  • 22.
    G. B. Pant University of Agriculture and Technology 22 4) Logistic Regression Logisticregression is a type of regression technique when the dependent variable is discrete. Example: 0 or 1, true or false, etc. This means the target variable can have only two values, and a sigmoid function shows the relation between the target variable and the independent variable. The logistic function is used in Logistic Regression to create a relation between the target variable and independent variables. The below equation denotes the logistic regression. here p is the probability of occurrence of the feature.
  • 23.
  • 24.
  • 25.
    G. B. Pant University of Agriculture and Technology 25 8) Decision TreeRegression Decision tree builds regression or classification models in the form of a tree structure. It breaks down a dataset into smaller and smaller subsets while at the same time an associated decision tree is incrementally developed. The final result is a tree with decision nodes and leaf nodes. A decision node (e.g., Outlook) has two or more branches (e.g., Sunny, Overcast and Rainy), each representing values for the attribute tested. Leaf node (e.g., Hours Played) represents a decision on the numerical target. The topmost decision node in a tree which corresponds to the best predictor called root node.
  • 26.
    G. B. Pant University of Agriculture and Technology 26 9) Random ForestRegression "Random Forest is a classifier that contains a number of decision trees on various subsets of the given dataset and takes the average to improve the predictive accuracy of that dataset." Instead of relying on one decision tree, the random forest takes the prediction from each tree and based on the majority votes of predictions, and it predicts the final output. The greater number of trees in the forest leads to higher accuracy and prevents the problem of overfitting.
  • 27.
    G. B. Pant University of Agriculture and Technology 27 EXAMPLES OF MODELSGENERATED USING THESE TECHNIQUES FUZZY EVAPOTRANSPIRATION MODEL The control rules for estimating ET were based on known relationships between RS, RH, and ET. These were expressed in linguistic terms by IF–THEN statements. For example: Rule 1:1 If RS is VERY LOW and RH is MEDIUM, then ET is VERY LOW, Rule 1:2 If RS is MEDIUM and RH is MEDIUM, then ET is LOW, Rule 1:3 If RS is HIGH and RH is LOW, then ET is HIGH, etc. The IF part of the rule statement is referred to as the antecedent, and the THEN part is referred to as the consequent.
  • 28.
    G. B. Pant University of Agriculture and Technology 28 REGRESSION ANALYSIS OFACTUAL EVAPOTRANSPIRATION AS OUTPUT WHEN Minimum temperature (°C), ,Maximum temperature (°C), wind speed(kmph), Average relative humidity(%) , Solar radiation (MJ/m²/day), Sunshine hours (hrs.) and rainfall(mm/day).
  • 29.
  • 30.
    DECISION TREE WITH THE HELP OFJUPYTER G. B. Pant University of Agriculture and Technology 30
  • 31.
    Thank You EVERY ENDING IS JUSTA NEW BEGINNING !!! G. B. Pant University of Agriculture and Technology 52

Editor's Notes

  • #3 <a href="https://www.freepik.com/free-vector/blue-abstract-technology-background_4666670.htm#query=background%20future&position=10&from_view=search&track=sph">Image by pikisuperstar</a> on Freepik
  • #31 <a href="https://www.freepik.com/free-vector/futuristic-artificial-intelligence-face-technology-background_4402943.htm#query=ai&position=45&from_view=search&track=sph">Image by starline</a> on Freepik