1. The H. John Heinz III Center for
Science, Economics and the Environment
WildlifeFocus On
The State of The Nation’s Ecosystems 2008
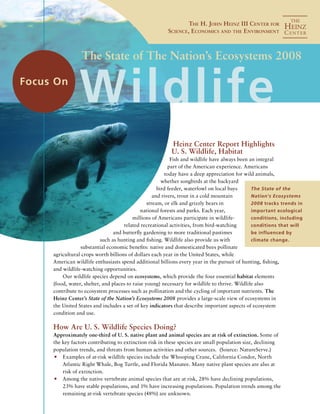
Heinz Center Report Highlights
U. S. Wildlife, Habitat
Fish and wildlife have always been an integral
part of the American experience. Americans
today have a deep appreciation for wild animals,
whether songbirds at the backyard
bird feeder, waterfowl on local bays
and rivers, trout in a cold mountain
stream, or elk and grizzly bears in
national forests and parks. Each year,
millions of Americans participate in wildlife-
related recreational activities, from bird-watching
and butterfly gardening to more traditional pastimes
such as hunting and fishing. Wildlife also provide us with
substantial economic benefits: native and domesticated bees pollinate
agricultural crops worth billions of dollars each year in the United States, while
American wildlife enthusiasts spend additional billions every year in the pursuit of hunting, fishing,
and wildlife-watching opportunities.
Our wildlife species depend on ecosystems, which provide the four essential habitat elements
(food, water, shelter, and places to raise young) necessary for wildlife to thrive. Wildlife also
contribute to ecosystem processes such as pollination and the cycling of important nutrients. The
Heinz Center’s State of the Nation’s Ecosystems 2008 provides a large-scale view of ecosystems in
the United States and includes a set of key indicators that describe important aspects of ecosystem
condition and use.
How Are U. S. Wildlife Species Doing?
Approximately one-third of U. S. native plant and animal species are at risk of extinction. Some of
the key factors contributing to extinction risk in these species are small population size, declining
population trends, and threats from human activities and other sources. (Source: NatureServe.)
Examples of at-risk wildlife species include the Whooping Crane, California Condor, North•
Atlantic Right Whale, Bog Turtle, and Florida Manatee. Many native plant species are also at
risk of extinction.
Among the native vertebrate animal species that are at risk, 28% have declining populations,•
23% have stable populations, and 1% have increasing populations. Population trends among the
remaining at-risk vertebrate species (48%) are unknown.
The State of the
Nation’s Ecosystems
2008 tracks trends in
important ecological
conditions, including
conditions that will
be influenced by
climate change.
2. The percentage of at-risk native animals is higher in•
fresh waters (37%) than in forests (19%) or grasslands
and shrublands (18%). In all three ecosystem types,
a large majority of at-risk vertebrate animal species
with known population trends have populations that
are either stable or declining, and 3% or fewer have
populations that are increasing.
How are U. S. Wildlife Habitats Faring?
The State of the Nation’s Ecosystems 2008 reports on trends
in the extent of major ecosystem types. Key findings include:
W e t l a n d s , R i p a r i a n A r e a s , a n d A q u a t i c
H a b i t a t s : D E C L I N E S E V I D E N T
Since the mid-1950s, the• acreage of coastal wetlands
on the Atlantic and Gulf coasts has declined by about
9% (to about 4.6 million acres). (Source: U. S. Fish and
Wildlife Service, or FWS.)
The• area of freshwater wetlands in the United States has decreased by 9% since 1955. In 2004,
there were 96 million acres of wetlands (not including ponds) in the lower 48 states, or about
6% of total land area. (Source: FWS.)
The• area of ponds has increased steadily since 1955, reaching 6.2 million acres in 2004, an
increase of almost three-quarters of a million
acres since 1998. (Source: FWS.)
About• 62% of the freshwater plant
communities in wetland and riparian areas are
considered to be at risk. (Source: NatureServe.)
Twenty percent of the riparian (streamside•
or riverside) habitat in the United States has
been altered to agricultural land or urban
development. (Source: Multi-Resolution Land
Characterization Consortium, USGS, EPA.)
Bottom-dwelling animal communities in 28%•
of wadeable streams in the lower 48 states are
considered to be in “natural” condition; 42%
of streams have communities in “degraded”
condition; and 25% have communities in
“moderate” condition. (Source: EPA.)
The H. John Heinz III Center for Science, Economics and the Environment
The State of The Nation’s Ecosystems 2008 Focus On Wildlife
At-Risk Native Species, by Risk Category (2006)
Partial Indicator Data: Native Terrestrial and
Freshwater Plant and Animal Species
%ofNativePlantand
AnimalSpecies
0
20
40
60
80
100
2006
Extinct
Critically Imperiled
Imperiled
Vulnerable
Total At-Risk
Data source: NatureServe and its Natural Heritage member programs.
Coverage: all 50 states. Technical details: The degree of risk for any
particular species varies considerably, from those species that are relatively
secure, to those that are in imminent danger of extinction. The data cover
many of the best-known groups of terrestrial and freshwater native plants
and animals, totaling about 22,600 native species. Species are assessed based
on such factors as the number and condition of individuals and populations,
population trends, the area occupied by the species, and known threats. In
all cases, a wide variety of factors contribute to overall ratings.
U.S. Land Cover and Ocean Depth
Land Cover Ocean Depth
Water
Urban and Suburban
Bare Lands
Forests
Grasslands and
Shrublands
Croplands
Wetlands
0 to 800 ft.
800 to 3000 ft.
3000 to 10,000 ft.
10,000 to 16,000 ft.
More than 16,000 ft.
Data source: lower 48 states: Multi-Resolution Land Characterization (MRLC)
Consortium; bathymetry data: NOAA; analysis by USGS EROS data center.
3. F o r e s t s : C O M P O S I T I O N C H A N G I N G ,
T O T A L A R E A N O T C H A N G I N G
Since 1953,• total forest area in the United
States has not changed significantly. In 2006,
forests covered 36% of the land area of the
lower 48 states, or about 621 million acres.
(Source: USDA Forest Service.)
The composition of U. S. forests is changing.•
Since 1963, certain forest types, such as
ponderosa pine and elm–ash–cottonwood, have
declined in area, while other forest types such
as fir–spruce and maple–beech–birch, have
increased. Over half of U. S. timberland is less than 60 years old; 12% is more than 100 years
old; less than 1% is of uneven age (trees of different ages). (Source: USDA Forest Service.)
In 2006,• fire affected almost 10 million acres of forest, grasslands, and shrublands in the
United States; insect damage (defoliation and tree mortality) affected 13 million acres of forest.
(Source: USDA Forest Service.)
G r a s s l a n d s a n d S h r u b l a n d s : U P S A N D D O W N S
Grasslands and shrublands• occupied about 40% of the land area of the lower 48 states in 2001,
or nearly 700 million acres (excluding pasturelands and haylands). This represents a decline of
about 170 million acres from the extent prior to European settlement. More recent trends are
not available. (Source: Muti-Resolution Land Characterization Consortium, EPA, U.S. Forest
Service.)
About 70% of invasive and 80% of non-invasive• grassland and shrubland bird species had
increasing populations for the most recent time period (2001–2005). Since 1966–1970, there
has been no clear trend in the percentage of invasive or non-invasive grassland and shrubland
bird species that have increasing populations. (Source: Breeding Bird Survey, Patuxent Wildlife
Research Center, U. S. Geological Survey.)
Fish and Fisheries
D i d y o u k n o w …
Between 2003 and 2005, Americans went•
freshwater fishing 1.4 billion times per year
and saltwater fishing 300 million times per
year. (Source: USDA Forest Service.)
In 2005, 4.6 million tons of fish and shellfish•
were landed in U. S. waters, an increase of
almost 90% since 1950. Since 1990, Alaskan
waters have provided the bulk of U. S.
commercial landings. Alaska is the only region
where landings have increased since 1978.
From 1978 to 2005, landings have decreased in
the West Coast and Hawaii, the Gulf of Mexico,
and the North/Mid-Atlantic and South Atlantic.
(Source: National Oceanic and Atmospheric
Administration)
Thirty-seven percent of native freshwater•
aquatic animal species are currently considered
at risk for extinction, and, of these, 4% may
already be extinct. This includes fish as well
as mussels and small aquatic invertebrates
that are sensitive to changes in water quality.
(Source: NatureServe.)
Spotlight
On
4. Challenges for Wildlife and Habitats
Indicators in The State of the Nation’s Ecosystems 2008 can be used to measure or track many of the
changes in ecosystems that are caused by human activities and natural processes. The following major
threats and stressors to wildlife and ecosystems have been documented by the International Union for
the Conservation of Nature (IUCN) and the Conservation Measures Partnership, a consortium of major
conservation organizations.
U r b a n a n d S u b u r b a n D e v e l o p m e n t Urban and suburban growth can displace many
species of wildlife. Conversely, these areas create habitats for select wildlife species, such as white-
tailed deer.
Urban and suburban landscapes covered about 45 million acres in the lower 48 states in 2001•
(about 2.6% of the total). USDA’s Economic Research Service estimated that the land area
covered by urban development has quadrupled between
1945–2002. (Source: USDA Economic Research Service,
Multi-Resolution Land Characterization (MRLC)
Consortium.)
N o n - n a t i v e S p e c i e s Non-native plants and animals
are frequently introduced into the United States through
human activities; examples include zebra mussels,
snakehead fish, kudzu, and purple loosestrife. These
species compete with native wildlife for food or habitat,
act as predators or parasites of native species, cause or
transmit disease, and alter essential habitat features.
Tracking systems for non-native species are inadequate•
for reporting either the proportion of established non-
native species or the ecological effects of those species at a national scale.
Data that are available suggest that invasives are a significant problem: for example, 58% of U.S.•
watersheds have more than 10 established non-native fish species. (Source: U.S. Geological Survey.)
W a t e r P o l l u t i o n Water pollution from human activities poses a threat to both aquatic and
terrestrial wildlife species. The State of the Nation’s Ecosystems 2008 contains indicators that
describe chemical contamination of aquatic systems. [Data from the Environmental Protection
Agency (EPA) and U. S. Geological Survey (USGS).]
Virtually all streams tested had one or more contaminants• at detectable levels; about half of
streams had one or more contaminants at levels exceeding benchmarks for the protection of
aquatic life.
About• 80% of freshwater fish tested had at least one contaminant at detectable levels; more
than 40% had at least 5 detectable contaminants. One third of fish tested had at least one
contaminant at levels that exceeded less stringent wildlife benchmarks; an additional 43%
exceeded higher benchmarks. Of 26 tested chemicals, PCBs and DDT were most commonly
found above benchmarks (testing was not conducted for mercury).
Nearly all saltwater fish tested had at least five contaminants• at detectable levels. Aquatic life
benchmarks are not available for saltwater fish.
www.heinzctr.org/ecosystems
Urban–Suburban Landscapes As a
Percentage of Total Land Area, 2001
% of Regional Land Area
0 2 4 6
Northeast/
Mid-Atlantic
Southeast
Midwest
Southwest
Rocky
Mountain
West Coast
Lower
48 States
Data source: Multi-Resolution Land Characterization (MRLC) Consortium;
analysis by U.S. Forest Service and EPA.
5. F i r e Catastrophic wildfire can significantly disrupt
ecosystems and wildlife populations. Severe fire can leave
soils exposed to erosion, increase sedimentation in streams
and open up new areas to invasion by non-native plants.
Conversely, certain ecosystem types, like longleaf pine and
pitch pine barrens, are dependent on periodic fire.
Fires burned almost 10 million acres of forests and•
grasslands–shrublands in 2006. Since 1916, there has
been a significant decline in the number of forest and
grassland–shrubland acres burned due to wildfires.
However, in recent years this trend has reversed, with
a slight but significant increase in the area disturbed
by fire between 1979 and 2006.
C l i m a t e C h a n g e Many of the ecosystem changes
that are thought to be associated with climate change can
be tracked through The State of the Nation’s Ecosystems 2008, including increases in sea surface
temperature and rising atmospheric concentrations of carbon dioxide and methane. See also our
separate fact sheet on Climate Change.
From 1985 to 2006, sea surface temperature increased significantly in near-coastal waters•
in three U. S. regions: Gulf of Alaska, Gulf of Mexico, and South Atlantic. Over the same
period, there was no clear increase or decrease in surface temperature in near-coastal waters
in the North and Mid-Atlantic1
, Southern California, Bering Sea, Pacific Northwest, or Hawaii
regions. (Source: National Oceanic and Atmospheric Administration and NASA.)
As of 2006, atmospheric carbon dioxide had increased by 35% and methane concentrations had•
increased by more than 150% over pre-industrial levels. Atmospheric carbon dioxide and methane
have both increased steadily since 1950. (Source: State of the Nation’s Ecosystems 2008, based on
data from the IPCC Working Group I Report, 2007.)
Opportunities for Conservation
Americans have been leaders in wildlife conservation, beginning with efforts to conserve the
American bison in the 19th century and campaigns to protect shorebirds and egrets from excessive
hunting in the early 20th century. More recent activities have focused on the management of game
species and fisheries, as well as on imperiled species under the Endangered Species Act. Notable
successes include the recovery of bald eagle populations and the successful reintroduction of white-
tailed deer, elk, and American bison into portions of their former ranges.
Americans have also been at the forefront in protecting wildlife habitat, through federal, state,
and private land conservation efforts. Although data are not available for all ecosystem types, partial
data presented in The State of the Nation’s Ecosystems 2008 indicate that approximately 10% of
forests in the United States have been set aside as national parks, wilderness, and similar areas.
Beginning in 2003, state wildlife agencies began preparation of State Wildlife Action Plans (also
known as Comprehensive Wildlife Conservation Strategies), to address challenges facing all species
of wildlife. These documents focus on “keeping common species common,” targeting those species
and habitats most in need of conservation to prevent them from becoming endangered. The Heinz
Center is working in close partnership with states and wildlife experts to develop management
indicators for these plans (http://www.heinzctr.org/wildlife).
Wildfire Acreage (Forests and Grasslands/Shrublands)
MillionAcres
0
10
20
30
40
50
60
202020102000199019801970196019501940193019201910
Data source: USDA Forest Service, National Forest System (1916–1959) and
the National Interagency Fire Center (1960–2006). Coverage: all 50 states.
Note that these data include all wildland fires (forests, grasslands and
shrublands).
1
Longer term records exist for some locations, such as the northeast, where temperatures rose more than 1°F during the
20th century.
6. The H. John Heinz III Center for
Science, Economics and the Environment
Better Information Is Needed To Improve Wildlife Conservation
To manage wildlife and their habitats more effectively, conservationists and wildlife professionals
need better information about wildlife populations and key threats and stressors that affect wildlife.
The State of the Nation’s Ecosystems 2008 highlights some important data gaps for wildlife:
Information is needed on wildlife status and trends.• Monitoring programs in the United States
have tended to focus on more popular species (such as game species, migratory waterfowl,
and breeding birds), or on species that are in danger of extinction. Even for at-risk species,
monitoring programs are incomplete. Population trend information is available for only about
half of the at-risk mammals, birds, reptiles, amphibians, and fish in the United States and is
lacking for most at-risk invertebrates and plants.
Information is needed on the number and distribution of non-native species and their effects•
on wildlife and ecosystems. Data on the proportion of established non-native species and their
ecological effects are not adequate for reporting at a national level. Although many counties,
states, and regions track certain non-native species, differences in methods for collecting data
make it impossible to track non-native species comprehensively at the national level.
The State of the Nation’s Ecosystems 2008
This fact sheet presents materials from The State of the Nation’s Ecosystems 2008: Measuring the
Lands, Waters, and Living Resources of the United States (available from Island Press www.islandpress.
com). The report was produced by The Heinz Center and hundreds of collaborators from businesses,
environmental organizations, universities, and federal, state, and local government agencies.
The State of the Nation’s Ecosystems 2008 is based on the premise that Americans should have
access to high-quality, nonpartisan, science-based information on the condition and use of our lands,
waters, and living resources. The report presents information through a series of indicators—specific,
well-defined measures of key ecosystem properties—selected and refined by representatives from
businesses, environmental organizations, universities, and federal, state, and local governments. The
report does not make value judgments about data and does not make specific policy recommendations.
900 17th Street NW, Suite 700, Washington, D. C. 20006 U. S. A.
202.737.6307 phone • 202.737.6410 fax • www.heinzctr.org
At the crossroads of science and environmental policy, The Heinz Center brings leaders together
from business, government, academia, and environmental groups to brainstorm solutions that are
both scientifically and economically sound. Founded in 1995 in honor of Senator H. John Heinz III,
the Center’s guiding philosophy is that only by working together can we solve today’s environmental
challenges and leave the world a better place for generations to come.
This Focus on WILDLIFE fact sheet was printed on Accent Opaque Cover 65, White, Smooth, made by International
Paper’s Ticonderoga mill within New York’s Adirondack Park. International Paper is certified to both the Sustainable
Forestry Initiative® Chain-of-Custody standard (BV-SFICOC-209908-B) and The Forest Stewardship Council® Chain-of-
Custody standard (BV-COC-080209).