This document discusses strategic analysis and choice as important components of strategic management implementation. It provides an overview of strategic analysis, which involves evaluating internal strengths and external environmental factors. Key techniques for strategic analysis mentioned include ETOP (Environmental Threat and Opportunity Profile) analysis and Porter's Five Forces model. The document then covers strategic choice, which involves understanding stakeholder expectations, identifying strategic options, and selecting the optimal choice. Factors considered in strategic analysis and choice include both internal capabilities and external political, economic, technological, and competitive landscapes. Overall, the document outlines frameworks and techniques used to conduct strategic analysis that informs strategic choice and implementation.
![Saraswathi S. Asst Professor, JSS College for Women, Kollegal 4
✓ Computer Information Systems
✓ Research and Development
Key External Factors
✓ Political/Governmental/Legal
✓ Economy
✓ Technological
✓ Social/Demographic/Cultural/Environmental
✓ Competitive
✓ Techniques Used in Strategic Analysis
THE FOLLOWING DEVICES OR TECHNIQUES ARE USED IN THE PROCEDURE OF
STRATEGIC ANALYSIS & CHOICE, THEY ARE –
Strategic analysis and choice of strategies are done with the help of a number of techniques. If the
appropriate strategy is chosen, a company would become more efficient to establish sustainability in
competitive advantage and maximize firm valuation.
They are -
ENVIRONMENTAL THREAT AND OPPORTUNITY PROFILE [ETOP]
There are many techniques available for environmental appraisal (assessment), one such technique
suggested by Glueck is ETOP the preparation of ETOP involves dividing the environment into different
sectors & then analyzing the impact of each sector on the organization. The preparation of an ETOP provides
a clear picture to the strategists about which sectors & the different factors in each sector have a favorable
impact on the organization.
By the means of an ETOP, the organization knows where it ne stands with respect to its environment.
Obviously, such an understanding can be of a great help to an organizations in formulating strategies to take
advantage of the opportunities & counter the threats in its environment.
MEANING
ETOP is a device that considers environmental information & determines the relative impact of threats
& opportunities for the systematic evaluation of environmental scanning.
ETOP is an environmental analysis results in a mass of information expectations. Structuring of
environmental issues is necessary to make them meaning full of strategy related to forces in the environment.
They deal with events, trends, issues & formulation. In short, it is a technique to structure environmental
issues.
It is the process by which organizations monitor their relevant environment to identify opportunities &
threats affecting their business for p purpose of taking strategic decision.
WHY ETOP?
✓ Helps organization to identify O-T
✓ To consolidate and strengthen organization’s position
✓ Provides the strategists of which sectors have a favorable impact on the organization.
✓ Helps organization knows where its stands with respect to its environment.
✓ Helps in formulating appropriate strategy.
✓ Helps in formulating SWOT analysis.
PREPARING ETOP
✓ Dividing the environment in different sector.](https://image.slidesharecdn.com/s-221124172756-7e1947d4/85/S-Mgt-unit-2-pdf-4-320.jpg)
![Saraswathi S. Asst Professor, JSS College for Women, Kollegal 5
✓ Analyzing the impact of each sector on the organization.
✓ Subdividing each environmental sector into sub factor.
✓ Impact of each sub sector on organization in form of a statement.
ETOP, PROFILE INVOLVES:-
The profile is a technique of environment analysis was organizations make of profile of their external
environment. ETOP analysis provides information about environment threats & opportunities & their impact
on strategic opportunities for the company. The profile contains mainly 3 issues, they are-
1] Forecasting:-
Forecasting means predicting the future events & analyzing their impact on present plans business
organizations analyze the environment but applying various techniques to forecast government is used to
formulate business plans & strategies.
2] Verbal Written information:-
Verbal information is collected but hearing & written information is collected by reading articles,
journals, newspaper, newsletters etc.., common sources of information are radio, television, workforce,
outsiders. It informs changes in the environment & prepares business organization to incorporate than in their
business plans & strategies.
3] Management Information System [MIS]:-
It is a formal method of making available to management to management the accurate & timely
information necessary to facilitate the decision making proceeds & enable the organization planning, control
& operational functions to be carried out effectively. It helps in making decisions based on future
environment.
The profile involves,- Environment, Threats & Opportunities Profile
A] ENVIRONMENTAL FACTORS
It presents the impact of each environmental factor like economic, political & social on the
organization. The important factors are as follows,-
1] Economic factors:
✓ General economic condition.
✓ Rate of inflation.
✓ Interest rate/Exchange rate
2] Technological factors:
✓ Source of technology.
✓ Technological development.
✓ Impact of technology
3] Socio cultural factors:
✓ Demographic characteristics.
✓ Social attitudes.
✓ Education level, awareness, and
consciousness of rights.
4] Environmental factors:
✓ Weather change
✓ Climatic change.
✓ Demand related factors.
✓ Suppliers related factors.
5] Political factors:
✓ Political system.
✓ Political structure, its goals and stability.
✓ Government policies , degree of intervention
6] Legal factors:
✓ Policies related to licensing , monopolies.
✓ Policies related to export and import.
✓ Policies related to distribution and pricing.](https://image.slidesharecdn.com/s-221124172756-7e1947d4/85/S-Mgt-unit-2-pdf-5-320.jpg)
![Saraswathi S. Asst Professor, JSS College for Women, Kollegal 6
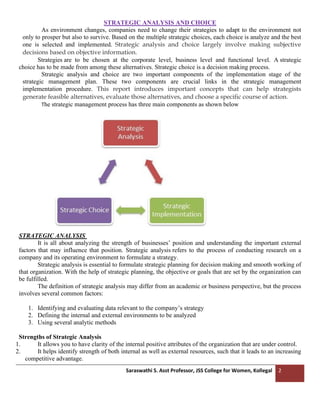
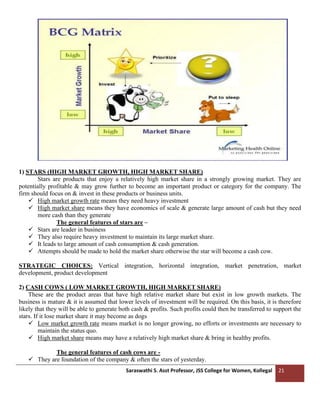
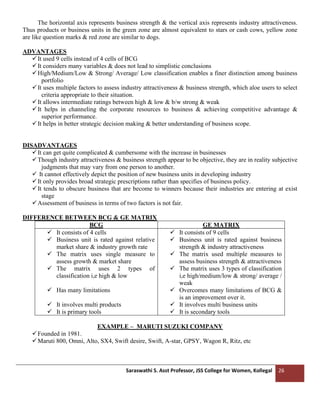
Sl.No FACTORS COULD INVLOVE
1 Political international trade taxation policy
2 Economic interest rates, exchange rates, national income, inflation, unemployment, Stock
Market
3 Social ageing population, attitudes to work,
income distribution
4 Technological innovation, new product development, rate of technological obsolescence
5 Environmental global warming, environmental issues
6 Legal competition law, health and safety, employment law
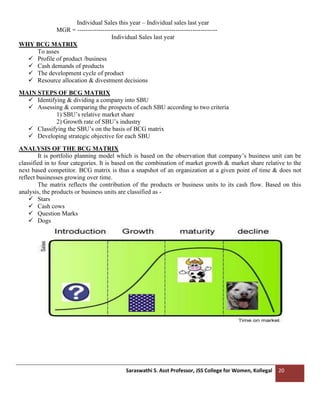
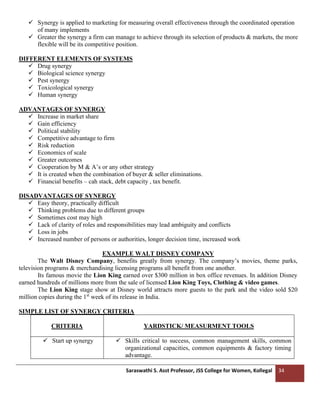
B] THREAT MATRIX
The threats restrain them from entering into new business lines.
C] OPPURINITY MATRIX
The opportunity of the firm indicates new lines of the business.
HIGH
LOW
HIGH
LOW
ATTRACTIVENESS
PROBABILITY OF OCCURRENCE
ATTRACTIVENESS
HIGH
HIGH
LOW
LOW
PROBABILITY OF OCCURRENCE](https://image.slidesharecdn.com/s-221124172756-7e1947d4/85/S-Mgt-unit-2-pdf-6-320.jpg)
![Saraswathi S. Asst Professor, JSS College for Women, Kollegal 7
ETOP: PROS AND CONS or ADVANTAGES / DISADVANTAGES
Pros
✓ Help to determine the key factor of threats and opportunities.
✓ Good tool to qualify the factors related to company’s strategy.
✓ Can consider many factors for each special case.
✓ It provides a clear of which sector & subsectors have favorable impact on the organization.
✓ It helps to interpret the result of environmental analysis.
✓ The organization can assess its competitive position.
✓ Appropriate strategies can be formulated to take advantage of opportunities & counter the threat.
Cons
✓ It doesn’t show the interaction between the factors.
✓ It can’t reflect the dynamic environment.
✓ It’s a subjective analysis tool
EXAMPLE : MILLIPORE COMPANY LTD, India
ABOUT MILLIPORE
Millipore is a multinational company, high technology, Bioscience Company that provides technologies,
tools and services for the development and production of new therapeutic drugs. The company, headquartered
in Bedford, England. It serves the worldwide life science research, biotechnology and pharmaceutical
industries. In India its subsidiary company was located in Bangalore.
MILLIPORE PRODUCT LINE
Life science, Drug discovery, Sample preparations, Lab water, Process development, Bio production, &
Process monitoring.
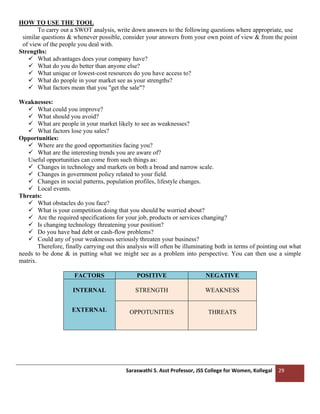
ETOP – Profile of the company
A] Environmental factor
Sl.no Factors Nature of
Impact
Impact of each sector
1 Economic •Fluctuation in exchange rate
•Increasing rate of inflation
•Worsening economic conditions
2 Technological •Market Leaders
Strong R&D program
•Better solution providers
•New “ Intergral”-2008
3 Political No significant change.
4 Legal Following FCPA (Foreign corrupt practices act).
Strict IPR laws – No poaching
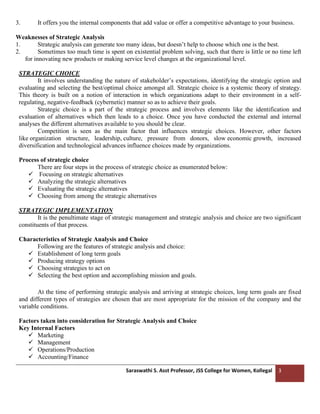
5 Socio cultural No significance change](https://image.slidesharecdn.com/s-221124172756-7e1947d4/85/S-Mgt-unit-2-pdf-7-320.jpg)
![Saraswathi S. Asst Professor, JSS College for Women, Kollegal 8
6 Competitive Competition particularly from low priced products.
7 Demand related Downfall in demand due to low priced products.
Containment of rising healthcare cost.
8 Governmental policies No excise duty, only vat for product manufactured in
India
- up arrows indicate favorable impact
- horizontal arrows indicate a neutral impact
- Down arrows indicate unfavorable impacts
B] Threat Matrix
1} Competition particularly from low priced
products.
2} Concentration majorly on big Fishes.
1} IPR laws are not so strong in INDIA.
2} Switching over form process patent to product
patent
3} Patent law not well defined
1} Expensive products.
2} Bad rapport with customers (unsatisfied
customer).
1} Lack of geographical division (remote areas).
2} Poor dealer network.
3} Low investment in marketing.
C] Opportunity Matrix
1} Market leaders – brand value and brand
awareness.
2} Special offers with OEM’s. (Agilent).
1} Provide customized protocol support.
2} Dedicated service team. (Toll Free numbers).
1} Large installation base.
2} New low budget product lines.
1} Saturation point of market is far away
2} New markets are opening
ORGANIZATIONAL CAPABILITY PROFILE [OCP]
Organizational capacity is the inherent capacity or potential of an organization to use its strength and
overcome its weakness in order to exploit opportunities and face threats its external environment. It is a
potential or capacity to perform better without capabilities resources are of no value.
Organizational capacity factors are strategic strengths and weaknesses existing in different functional
areas within an organization, which are of crucial importance to strategy formulation and implementation.
Any advantage a company has over its competitor - it can do something which they cannot or can do
better Opportunity for an organization to capitalize - low cost, Superior Quality, R&D skills etc](https://image.slidesharecdn.com/s-221124172756-7e1947d4/85/S-Mgt-unit-2-pdf-8-320.jpg)
![Saraswathi S. Asst Professor, JSS College for Women, Kollegal 10
1] Financial capacity:
The factors relate to the availability, usages & management of funds & all allied aspects that have a
bearing on an organization’s capacity to implement its strategies.
(a) Sources of funds
(b) Usage of funds
(c) Management of funds
Some of important factors which influence the financial capacity of any organization are as follow:
✓ Factors related to usage of funds capital structure, procurement of capital, controllership, financing and
relationship with leaders, bankers and financial institutions.
✓ Factors related to management of funds financial, accounting and budgeting systems; management
control system, state of financial health, cash, inflation, credit, return and risk management; cost
reduction and control and tax planning and advantages
2] Marketing capacity
Marketing capability factors relate to the pricing, promotion and distribution of products or services,
and all the allied aspects that have a bearing on an organization's capacity and ability to implement its
strategies.
(a) Product related
(b) Price related
(c) Promotion related
(d) Integrative & Systematic
Some of the important factors which influence the marketing capacity of any organization are as follows.
✓ Product related factors: Variety, lit differentiation, mix quality, positioning, advantages, etc..
✓ Price related factors: pricing objective, policies, changes, protection, advantages, etc..
✓ Place related factors: distribution, transportation ad logistics, marketing channels , marketing
intermediaries, etc..
✓ Promotion related factors: Promotional tools, sales promotion, advertising public relations, etc.
✓ Integrative and systemic factors: marketing mix, market standing, company image, marketing
organization, marketing system, marketing management information system etc..
3] Operation capacity:
Operations capacity factors relate to the production of products or services, use of material resources
and all allied aspects that have a bearing on an organization's capacity and ability to implement its strategies.
(a) Production system
(b) Operation & Control system
(c) R&D system
Some of the important factors which influence the operations capacity of an organization are as follows:
✓ Production system: capacity, location, layout product or service design, work systems, degree of
automation, extent of vertical integration, etc..
✓ Operations and control system: aggregate production planning, material supply, inventory, cost and
quality control, maintenance systems and procedures etc..
4] Personal capacity:
Personal capacity factors relate to the existence and use of human resources and skill, and all
organization’s capacity and ability to implement its strategies.
(a) Personnel system
(b) Organization & employee characteristics](https://image.slidesharecdn.com/s-221124172756-7e1947d4/85/S-Mgt-unit-2-pdf-10-320.jpg)
![Saraswathi S. Asst Professor, JSS College for Women, Kollegal 11
(c) Industrial Relations
Some of the important factors which influence the personal capacity of any organization are as follows.
✓ The personal system: systems for manpower planning, selection, development, compensation,
communication and appraisal, position of the personnel department within the organization, procedures
and standards etc..
✓ Organizational and employees characteristics: Corporate image, quality of managers, staff and
workers perception about and image of the organization as an employer, availability of developmental
opportunities for employees, working conditions, etc..
✓ Industrial relations: union management relationship, collective bargaining, safety, welfare and
security, employee satisfaction and morale, etc..
5] Information management capacity:
Information management capacity factor relate to the design and management of the flow of
information from outside into, and within an organization for the purpose of decision-making and all allied
aspects that have a hearing on an organizations capacity and ability to compliment its strategies.
(a) General Management Systems
(b) External Relations
(c) Organization climate
Some of the important factors which influence the Information management capacity of any organization are
as follows.
✓ Acquisition and retention of information
✓ Processing and synthesis of information
✓ Retrieval and usage of information
✓ Transmission and dissemination
6] General Management capacity:
General management capacity relates to the integration, coordination and direction of the functional
capabilities towards common goals and all allied aspects that have a bearing on an organization capacity and
ability to implement its strategies.
Some of the important factors which influence the general management capacity of any organization are as
follows.
✓ General management system
✓ General managers
✓ External relationship
PROFILE OF OCP
The OCP is drawn in the form of a chart, the strategists are required to systematically assess the
various functional areas & subjectively assign values to different functional capacity factored & sub factor as
long a scale ranging from values of -5 to +5.
You to draft the profile, 1st
identify the capability that are important to your customer & that
differentiates you from competitors & then incorporate them in a presentation or document.
1] Customer focus:-
Your capability profile must incorporate the information customers & prospects need, when
they are evaluating your company as a potential supplier or business partnered customers need to know about
your current capability current capability & your future direction. They want to know that you have the
technical expertise & market understanding to supply quality products that meet their performance
requirement.](https://image.slidesharecdn.com/s-221124172756-7e1947d4/85/S-Mgt-unit-2-pdf-11-320.jpg)
![Saraswathi S. Asst Professor, JSS College for Women, Kollegal 12
2] People:-
The skills & knowledge of your people represent an important part of your organizational
capability. Describe the qualifications & experience of key staff, together with any outstanding achievement
such as awards for innovation, involvement with industry associations or leadership in a particular discipline,
the skills of your business partners also contribute to your capability.
3] Resources:-
Many other assets contribute to your organizational capability, including patents, products
manufacturing facilities, information systems & distribution network. Those assets differentiate you from
competitors, particularly if they are hard to match, customize the assets to your customers needs a customer
with sites in a number of different countries.
4] Stability:-
Stability is an important aspect of organizational capacity, you can build confidence in your
customers by demonstrating that you have a stable management team capable of managing your business
effectively.
METHODS & TECHNIQUES
Inclusive, long term:
✓ Financial Analysis - Ratio Analysis, EVA, ABC
✓ Key factor rating - Rating of different factors through different questions
✓ Value chain analysis
✓ VRIO framework
✓ BCG, GE Matrix , PIMS, McKinsey7S
✓ Balanced Scorecard
✓ Competitive Advantage Profile
✓ Strategic Advantage profile
✓ Internal Factor Analysis Summary
[A] FINANCIAL ANALYSIS
✓ Ratio Analysis
✓ Economic value added[ EVA]
o NOPAT (Net Operating Profit After Tax)
o WACC (Weighted Average Cost Of Capital )
✓ Activity Based Costing[ABC]
o activity in Value chain
o specific activities
[B] VRIO FRAMEWORK
A resource is an asset, skill, competency or knowledge controlled by the corporation. A resource is
strength if it provides competitive advantage e.g. patents, brand name, economies of scale, idea-driven,
standardized mass production. It is an analytical technique brilliant for the evaluation of company’s resources &
thus the competitive advantage.
e.g. patents, brand name,
✓ Value: Does it provide competitive advantage?
✓ Rarity: Do other competitors possess it?
✓ Imitability: Is it costly for others to reproduce?
✓ Organization: Is the firm organized to exploit the resource?](https://image.slidesharecdn.com/s-221124172756-7e1947d4/85/S-Mgt-unit-2-pdf-12-320.jpg)
![Saraswathi S. Asst Professor, JSS College for Women, Kollegal 13
VRIO - STEPS
1. Identify: firms resources- S&W.
2. Combine: firm’s strength into specific capabilities.
3. Appraise- profit potential, sustainable competitive advantage, ability to convert it to a profitable
proposition
4. Select strategy - firm’s resources& capability relative to external opportunity.
5. Identify: resource gaps and invest in upgrading weaknesses
[C] PIMS {BCG, GE Matrix, McKinsey7S – Refer below}
The Profit Impact of Market Strategies (PIMS) is a comprehensive, long-term study of the performance
of strategic business units (SBUs) in thousands of companies in all major industries.
The PIMS project began at General Electric in the mid-1960s. It was continued at Harvard University in
the early 1970s, and then was taken over by the Strategic Planning Institute (SPI) in 1975. Since then, SPI
researchers and consultants have continued working on the development and application of PIMS data.
According to the SPI, the PIMS database is- "a collection of statistically documented experiences drawn
from thousands of businesses, designed to help understand what kinds of strategies (e.g. quality, pricing,
vertical integration, innovation, advertising) work best in what kinds of business environments.
The data constitute a key resource for such critical management tasks as evaluating business
performance, analyzing new business opportunities, evaluating and reality testing new strategies, and screening
business portfolios.”
The main function of PIMS is to highlight the relationship between a business's key strategic decisions
and its results.
Analyzed correctly, the data can help managers gain a better understanding of their business
environment, identify critical factors in improving the position of their company, and develop strategies that
will enable them to create a sustainable advantage.
PIMS principles are taught in business schools, and the data are widely used in academic research. As a
result, PIMS has influenced business strategy in companies around the world
TOWS Matrix or Analysis
A TOWS analysis involves the same basic process of listing strengths, weaknesses, opportunities and
threats as a SWOT analysis, but with a TOWS analysis, threats and opportunities are examined first and
weaknesses and strengths are examined last. After creating a list of threats, opportunistic, weaknesses and
strengths, managers examine ways the company can take advantage of opportunities and minimize threats by
exploiting strengths and overcoming weaknesses.
[D] BALANCED SCORECARD
It has been proposed & popularized by Robert. S. Kaplan & David. P. Norton. It is a performance tool
which “provides executives with a comprehensive framework that translates a company’s strategic objectives
into a coherent set of performance measures”
The scorecard consists of 4 different perspective performance measures such as,-
✓ Financial perspective
✓ Customer perspective
✓ Internal business perspective
✓ Innovation & learning perspective](https://image.slidesharecdn.com/s-221124172756-7e1947d4/85/S-Mgt-unit-2-pdf-13-320.jpg)
![Saraswathi S. Asst Professor, JSS College for Women, Kollegal 14
(1) Financial perspective
✓ Return on capital employed
✓ Cash flow
✓ Project profitability
✓ Profit forecast reliability
✓ Sales backlog
(2) Customer perspective
✓ Pricing index
✓ Customer satisfaction index
✓ Customer ranking survey
✓ Market share
(3) Internal business perspective
✓ Hours with customers on tender
success rate
✓ Rework
✓ Safety incident index
✓ Project performance index
✓ Project close out cycle
(4) Innovation & learning perspective
✓ % revenue from new services
✓ Rate of improvement index
✓ Staff attitude survey
✓ Employee suggestions
✓ Revenue per employee
PROBLEMS OF BALANCED SCORE CARD SOLVES
✓ Unclarified vision & strategy
✓ Non – alignment of long term & short term goals
✓ Measurement issues
✓ Communication gap
✓ Excessive focus on financial parameters
✓ Non availability of feedback
[E] COMPETITIVE ADVANTAGE PROFILE
The competitive profile matrix is a strategic analysis that allows you to compare your company to your
competitors, in such a way as to reveal your relative strengths & weaknesses. Inform your strategic decision
making. It compares a company & its rivals. The matrix reveals strengths & weaknesses for each company, &
critical success factors show areas of success or areas for improvement.
A superiority gained by an organization when it can provide the same value as its competitors but at a
lower price, or can charge higher prices by providing greater value through differentiation. Competitive
advantage results from matching core competencies to the opportunities. It is the reason behind loyalty, & why
you prefer one product or service over another.
There are 3 different types of competitive advantages that companies can actually use.
✓ Cost differentiation
✓ Product/Service differentiation
✓ Niche strategies
Advantages Disadvantages
✓ Forces organization to look ahead
✓ Improved fit with the environment
✓ Better use of resources
✓ Provides a direction/ vision
✓ Helps monitor progress
✓ Ensures goal congruence
✓ It can be time consuming & expensive
✓ It may be difficult in rapidly changing
markets
✓ It can become a straight jacket
✓ Some unplanned for opportunities
maybe missed
✓ It can become bureaucratic
✓ It is less relevant in a crisis.
[F] STRATEGIC ADVANTAGE PROFILE {Refer below}](https://image.slidesharecdn.com/s-221124172756-7e1947d4/85/S-Mgt-unit-2-pdf-14-320.jpg)
![Saraswathi S. Asst Professor, JSS College for Women, Kollegal 15
[G] INTERNAL FACTOR ANALYSIS SUMMARY
It means Internal Factor Evaluation matrix, is a popular strategic management tool for auditing or
evaluating major internal strengths & internal weaknesses in functional areas of an organization or a business. It
also provides a basis for identifying or evaluating relationships among those areas.
An internal analysis is an exploration of your organizations competency, cost position & competitive viability in
the market place. Conducting an internal analysis often incorporates measures that provide useful information
about your organizations a SWOT analysis.
EXAMPLES OF ORGANIZATIONAL CAPABILITY PROFILE
1] Financial Capability
Bajaj - Cash Management
LIC - Centralized payment, decentralized collection
Reliance - high investor confidence
Escorts - Amicable relation with FIS (world's top-ranked technology provider to the banking industry)
2] Marketing Capability
Hindustan Lever - Distribution Channel
IDBI/ICICI Bank -Wide variety of products
Tata - Company / Product Image
3] Operations Capability
Lakshmi machine works - absorb imported technology
Balmer & Lawrie - R&D - New specialty chemicals
4] Personnel Capability
Apollo tyres - Industrial relations problem
5] General management capability
Malayalam Manaroma - largest selling newspaper
Unchallenged leadership - Unified, stable Best edited & most professionally produced
STRATEGIC ADVANTAGE PROFILE [SAP]
It is also known as SAP. It shows strength & weaknesses of an organization. Preparation of SAP is
very similar process to the ETOP.
SAP is a summary statement which provides an overview of the advantages & disadvantages in key
areas likely to affect future operations of a firm. It is a total for making systematic evaluation of strategic
advantage factors which are significant for the company in its environment.
SAP is the technique of analyzing the internal factor of the organization by preparing a critical picture
of different capacity factors. It is a relative strength of the company over its competitors.
Every firm has strategic advantage and disadvantages for,
Example
Large firm have financial strength but they tent to move slowly, compared to smaller firms, and often
cannot react to change quickly. No firm is equally strong in all its functions. In other words, every firm has
strength as well as weakness.
The strategists must be aware of the strategic advantages or strengths of the firm to be able to choose
of the best opportunity for the firm. On the other hand they must regularly analyze their strategic
disadvantages or weaknesses in order to face environmental threats effectively.
Example](https://image.slidesharecdn.com/s-221124172756-7e1947d4/85/S-Mgt-unit-2-pdf-15-320.jpg)
![Saraswathi S. Asst Professor, JSS College for Women, Kollegal 16
The strategist should look to see if the firm is stronger in these factors than its competitors. When a
firm is strong in the market, it has a strategic advantage in launching new products or services & increasing
market share of present products & services.
There are generally 5 functional areas in most of the organizations. These areas are:-
✓ Marketing and Distribution
✓ R & D and Engineering
✓ Production and Operations management
✓ Corporate resources and personnel
✓ Finance and Accounting
1] Strategic advantage factors: Marketing and Distribution
1. Efficient and effective market research system
2. The product service mix: quality of product and service and service
3. Strong new - product and new- service leadership
4. Patent protection (or equivalent legal protection for life)
5. Positive feeling about the firm and its products and services on the part of the ultimate consumer
6. Efficient and effective packaging of products (or the equivalent for service)
7. Effective pricing strategy for products and services
8. Efficient and effective marketing promotion activities other than advertising
9. Efficient and effective service after purchase
10. Efficient and effective channel of distribution and geographical coverage, including internal efforts.
2] Strategic advantage factors: R & D and Engineering
1. Basic research capabilities within the firm
2. Excellence in product design
3. Excellence in process design and improvement
4. Superior packaging development being created
5. Improvement in the use of old or new materials
6. Ability to meet design goals and customer requirements
7. Trained and experienced technicians and scientists
8. Work environment suited to creativity and innovation
9. Well – equipped laboratories and testing facilities
3] Production and Operations management
4] Corporate resources and personnel [ 3, 4 & 5 refer OCP]
5] Finance and Accounting
DIFFERENT APPROACHES
The different approaches are there to develop as competitive advantage. In each of these approaches
the principal point is to avoid doing the same thing as the competition on the same bottle ground. So the
analyst needs to decide which of these approaches might be pursued to develop a sustainable distinctive
competence.
1] Key Success Factors (KFS):-
It is to compete based on existing strengths. The form can gain strategic advantage if it focuses
resources on one crucial point.](https://image.slidesharecdn.com/s-221124172756-7e1947d4/85/S-Mgt-unit-2-pdf-16-320.jpg)
![Saraswathi S. Asst Professor, JSS College for Women, Kollegal 17
2] Avoids head – on competition:-
The 2nd
approach is still based on existing strengths but avoids head on competition. The firm
must look at its own strength which are different or superior to that of the competition & exploit this relative
superiority to the fullest.
Ex- makes use of the technology; sales network & so on of those of its products which are not directly
competing with the products of competitors.
3] Unconventional Approach:-
To compute directly with a competitor, it is used for well established, stagnant industry. It may
be needed to upset the key factors for success that the competitor has used to build on advantage. The starting
point is to challenge accepted assumption about the way business is done & gain a novel advantage by
creating new success factors.
4] Means of Innovations:-
It can obtain by means of innovation which open new markets or result in new products. This
approach avoids head on competition but requires the firm to find new & creative strengths. Innovation often
involves market segmentation & finding new ways of satisfying the customer’s utility function.
PROFILE OF SAP
It shows in way of chart of each organizations strength & weaknesses on the basis of its different
factors. Here we prepare a profile about hoe our company is superior in comparison to other companies. Here
we are looking at the environmental aspects & preparing the strategy which can relate our strengths to our
opportunities. It enables us to focus on our competencies (strengths) & how to use them.
FUNCTIONAL AREA CORE FACTORS ( + ) or ( - )
Production & operation Good production facilities
Old plant & machinery
( + )
( - )
Personal factors Young & motivated force
Poor union relation
( + )
( - )
Finance & Accounting Tax holiday
Costly finance
( + )
( - )
Marketing operations Effective communication mix
Costly employees
Rich experiences in market
( + )
( - )
( + )
R & D & Engineering No design protection
Well developed laboratory
Highly qualified research staff
( - )
( + )
( + )
Organization system High tech MIS
Effective delegation & decentralization
No. MBE
( + )
( + )
( - )
EXAMPLE OF SAP
A picture of the more critical areas which can have a relationship of the strategic posture of the firm in
future of TATA DOCOMO
CAPABILITY
FACTORS
NATURE OF
IMPACT
COMPETITIVE STRENGTH / WEAKNESS
Marketing 1st
to launch 1paise/per second & applicable for both postpaid
& prepaid. Leveraging Tata indicom’s distribution channels.
Launched popular advertisement campaign “Keep it Simple
Silly” & hired Ranbir Kapoor as brand mascot.](https://image.slidesharecdn.com/s-221124172756-7e1947d4/85/S-Mgt-unit-2-pdf-17-320.jpg)
![Saraswathi S. Asst Professor, JSS College for Women, Kollegal 19
BALANCING THE PORTFOLIO
Balancing the portfolio means that he different products or businesses in the portfolio have to be
balanced with respect to 4 basic aspects-
✓ Profitability
✓ Cash flow
✓ Growth
✓ Risk
This analysis can be done by any of the following technologies, they are –
1] BCG MATRIX
2] GE 9 CELL MATRIX
[A] BCG MATRIX [BOSTON CONSULTING GROUP]
BCG means Boston Consulting Group, Matrix is developed by Bruce Henderson of the Boston
Consulting Group in the early 1970’s. It is also called as the “Growth Share Matrix”. This is the most popular &
simplest matrix to describe the corporation’s portfolio of businesses or products.
According to this technique, business or products are classified as low or high performance depending
upon their market growth rate & relative market share.
The BCG matrix helps to determine priorities in a portfolio in a product portfolio. Its basic purpose is to
invest where there is growth from which the firm can benefit, & divest those businesses that have low market &
low growth prospects.
✓ Enhances multi-divisional firm in formulating strategies
✓ Autonomous divisions = business portfolio
✓ Divisions may compete in different industries
✓ Focus on market-share position & industry growth rate
To understand the Boston Matrix you need to understand how market share & market growth
interrelated. Each of the products or business units is plotted on a two dimensional matrix consisting of -
✓ Relative Market Share (RMS)
✓ Market Growth Rate (MGR)
1] Market Share
Market share is the percentage of the total market that is being serviced by your company measured
either in the revenue terms or unit volume terms. It is ratio of the market share of the concerned product or
business unit in the industry divided by the share of the market leader. The higher your market share, the higher
proportion of the market you control.
Business Unit Sales this year
RMS = --------------------------------------
Leading rival sales this year
2] Market Growth Rate
Market Growth is used as a measure of a market’s attractiveness. It is the percentage of market growth,
by which sales of a particular product or business unit has increased. Markets experiencing high growth are
ones where the total market share available is expanding & there is plenty of opportunity for everyone to make
money.](https://image.slidesharecdn.com/s-221124172756-7e1947d4/85/S-Mgt-unit-2-pdf-19-320.jpg)
![Saraswathi S. Asst Professor, JSS College for Women, Kollegal 24
[B] GE 9 CELL MODEL
GE means General Electric nine cell matrix. This matrix was developed in 1970’s by General Electric
Company with the assistance of the consulting firm, Mckinsey & Co, USA. This is also called GE
multifactor portfolio matrix or Directional policy matrix. The GE matrix has been developed to overcome the
obvious limitations of BCG matrix.
It is a tool used in brand marketing & product management to decide what products to add to the
portfolio. It identifies the optimum business portfolio as one that fits perfectly to the company’s strengths &
helps to explore the most attractive industry sectors or markets.
It identifies the optimum business portfolio as one that fits perfectly to the company’s strengths &
helps to explore the most attractive industry sectors or markets. The objective of the analysis is to position
each SBU on the chart depending on the SBU’s strength & the attractiveness of the industry sector or market
on which it is focused.
This matrix consists of nine cells [3*3] matrix used to perform business portfolio analysis as a step in
the strategic planning process & is based on 2 key variables:
✓ Business strength
✓ Industry attractiveness
1] Business strength:-
It is a competitive strength replaces market share as the dimension by which the competitive position
of each SBU is assessed.
The business strength is measured by considering such factors as:
Relative market share, Profit margins, Ability to compete on price & quality, Knowledge of customer
& market, Competitive strengths & weaknesses, Technological capacity, Caliber of management, Brand
image, Corporate image, Production capacity, R&D performance, Promotional effectiveness etc.,
2] Industry attractiveness:-
It replaces market growth as the dimension of industry attractiveness & includes a boarder range of
factor other than just the market growth rate.
The business strength is measured by considering such factors as:
Market size & growth rate, Industry profit margin, Competitive intensity, Economics of scale,
Technology, Social, environment, legal & human aspects, Current size of market, Market structure & market
rivalry, Demand variability, Global opportunities etc.,
SPOTLIGHT STRATEGY
The 9 cells of the GE matrix represent various degrees of industry attractiveness (high, medium & low)
& business strength (strong, average & weak). After plotting each product line or business unit on the nine cell
matrix, strategic choices are made depending on their position in the matrix.
GE matrix is also called “Spotlight” strategy matrix because the 3 zones are like Green, Yellow & red
of Traffic lights.](https://image.slidesharecdn.com/s-221124172756-7e1947d4/85/S-Mgt-unit-2-pdf-24-320.jpg)
![Saraswathi S. Asst Professor, JSS College for Women, Kollegal 25
1] Green – Grow
It indicates invest / expand. If the product falls in green zone, the business strength is strong & industry
is at least medium in attractiveness, the strategic decision should be to expand, to invest & to grow.
2] Yellow – Hold
It indicates select / earn. If the product falls in yellow zone, the business strength is low but industry
attractiveness is high, it needs caution & managerial discretion for making the strategic choice.
3] Red – Harvest
It indicates divest / harvest. If the product falls in the red zone, the business strength is average or weak
& attractiveness is also low or medium, the appropriate strategy should be divestment.
High Medium Low
LEADER TRY HARDER DOUBLE OR
QUIT
GROWTH PROCEED
WITH CARE
PHASED
WITHDRAWAL
CASH
GENERATOR
PHASED
WITHDRAWAL
DIVESTMENT
BUSINESS STRENGTH](https://image.slidesharecdn.com/s-221124172756-7e1947d4/85/S-Mgt-unit-2-pdf-25-320.jpg)
![Saraswathi S. Asst Professor, JSS College for Women, Kollegal 27
MARKET ATTRACTIVENESS
HIGH MEDIUM LOW
COMPETITIVE
STRENGTH
HIGH
MEDIUM
LOW
SWIFT
OMNI
BALENO
A - STAR
ALTO
SWIFT
DEZIRE
WAGAN
R
VERSA
SX4
MARKET ATTRACTIVENESS BUSINESS STRENGTH
✓ Size
✓ Growth
✓ Competitive rivalry
✓ Profit levels
✓ Ability to differentiate
✓ Cyclicality
✓ Market diversity
✓ Structure
✓ Market share
✓ Size/ scale
✓ Quality
✓ Technology
✓ Cost base
✓ Brand strength
✓ Customer loyalty
✓ Image, people
SWOT ANALYSIS
INTRODUCTION
A scan of the internal & external environment is an important part of strategic planning process.
Environmental factors internal to the firm usually can be classified as strengths [S] or weakness [W] & those
external to the firm can be classified as opportunities [O] or threats [T]. Such analysis of the strategic
environment is referred to as a SWOT analysis.
It involves the collection & portrayal of information about internal & external factors which have or may
be have, an impact on business.
MEANING
SWOT analysis is a strategic planning method used to evaluate the Strengths, Weaknesses,
Opportunities, and Threats involved in a business. It involves specifying the objective of the business and
identifying the internal and external factors that are favorable and unfavorable to achieve that objective.](https://image.slidesharecdn.com/s-221124172756-7e1947d4/85/S-Mgt-unit-2-pdf-27-320.jpg)
![Saraswathi S. Asst Professor, JSS College for Women, Kollegal 28
Technique is credited to Albert Humphrey, who lends a research project at Stanford University in 1960’s &
1970’s.
It is a non-financial planning tool. It links the analysis in terms of advantages and disadvantages; and the
internal and external business environment (in a matrix format). The Strengths and Weaknesses are defined by
measures such as market share, loyal customers, level of customer satisfaction and product quality.
Opportunities are new potential areas for business in the future, such as new markets, or new conditions in
existing markets. Threats describe how the competition, new technology, or other factors in the business
environment may affect the business's development.
A technique that enables a group or individual to move from everyday problems and traditional
strategies to a fresh prospective. SWOT analysis looks at your strengths and weaknesses, and the opportunities
and threats your business faces.
The SWOT Analysis framework is a very important and useful tool to use in marketing Management
and other business applications. As a basic tool its mastery is a fundamental requirement for the marketer,
entrepreneur or business person. A clear understanding of SWOT is required for business majors.
It is used as framework for organizing & using data & information gained from situation analysis of
internal & external environment.
AIM OF SWOT ANALYSIS
✓ To help decision makers share & compare ideas
✓ To bring a clearer common purpose & understanding of factors for success
✓ To organize important factors linked to success & failure in the business world
✓ To provide linearity to decision making process allowing complex ideas to be presented systematically.
WHO NEEDS SWOT ANALYSIS?
They are -
1] JOB HOLDER
✓ When supervisor has issues with work output
✓ Assigned to a new job
✓ New financial year – fresh targets
✓ Job holder seeks to improve performance on the job
2] BUSINESS
✓ When the team has not met its targets
✓ Customer service can be better
✓ Launching a new business unit to pursue a new business
✓ New team leader is appointed
3] COMPANY
✓ When revenue, cost & expense targets are not being achieved
✓ Market share is declining
✓ Industry conditions are unfavorable
✓ Launching a new business venture
THREE STAGES OF A SWOT ANALYSIS
1. Identify.
2. Draw conclusions.
3. Translate into strategic action.](https://image.slidesharecdn.com/s-221124172756-7e1947d4/85/S-Mgt-unit-2-pdf-28-320.jpg)
![Saraswathi S. Asst Professor, JSS College for Women, Kollegal 30
SWOT MATRIX
1] STRENGTH
The factors that give an edge for the company over it’s competition. It may contribute includes the
availability of resources & their performance ability. It maintenance of persistent market growth & the ability to
produce or enter new markets.
2] WEAKNESSES
The factors that can be harmful if used against the firm by its competitors. The organization weaknesses
are established through failures, losses & the incapability to respond to market changes. Analysis of weaknesses
will determine the management strategy to develop & implement the remedial measures.
3] OPPORTUNITIES
The favorable situations which an bring a competitive advantage opportunities are normally ample.
However, a plan needs to be developed to use these opportunities efficiently & at the appropriate time.
4] THREATS
The unfavorable situations which can negatively affect the business. The threats occur from economic,
social, political or technological reasons. Technological advancements may render the organization technology
as obsolete.
The SWOT matrix identifies the Strength, Weaknesses, Threats & Opportunities of a business firm. This
formation can be used by the company in many ways in evolving its options for the future. In genral, the
company should attempt to:-
✓ Build its strength
✓ Reverse its weaknesses](https://image.slidesharecdn.com/s-221124172756-7e1947d4/85/S-Mgt-unit-2-pdf-30-320.jpg)
![Saraswathi S. Asst Professor, JSS College for Women, Kollegal 32
EXTERNAL
✓ Innovation
OPPOTUNITIES
✓ Stock investments
✓ Jobs moving up
THREATS
✓ Copy cat products
✓ Market share – PC’s
✓ Too board
✓ Steve jobs health
SYNERGY AND DYSERGY
SYNERGISTIC EFFECTS
Synergistic effects may be negative or positive we can say it either synergy or dysergy based on its
effect an idea that is greater or lesser or lesser than that sum common parts. It helps to develop competencies.
Synergistic effects – 2+ 2 = 5 (or 3?)
2 or more strengths –Synergy
2 or more weaknesses – Dysergy
Ex:
Samsung mobiles – good product range, reasonable price, good promotion & good distribution
Ambassador – poor product range & substandard promotion.
SYNERGY [ 2 + 2 = 5 ]
According to American Heritage Dictionary, the Term “Synergy” is derived from the Greek word
“SUNERGOS”, meaning “Working together” or “joint work”
Synergy is the creation of a greater than simple than simple sum of its parts. A dynamic state in which
combined action is formed over the difference of individual component actions. It also called as “positive
synergy”.
Synergy means behavior of whole system unpredicted by the behavior of heir parts taken separately”. It
is a concept that the whole is greater than the sum of the parts.
Synergy is the interaction of multiple elements in a system to produce an effect different from or greater
than the sum of their individual’s effects.
Synergy definition:
Interaction of elements that when combined produce a total effect that is greater than the sum of the
individual elements This equation is showing us that if you combine something with another factor the final
outcome will be much bigger & more significant.
EX:
Working together
Combined action + Operation
= Greater advantage
This assumes that the collective advantage to be gained by joining forces is greater than the separate
existence of each organization.
The basic concept of synergy can be explained through this mathematical formula; 2+2=5
The 2+2=5 effect means that operating independently; each subsystem can produce only 2 units of
output. However, by combining their efforts & working together effectively, the 2 subsystems can produce 5
units of output.](https://image.slidesharecdn.com/s-221124172756-7e1947d4/85/S-Mgt-unit-2-pdf-32-320.jpg)
![Saraswathi S. Asst Professor, JSS College for Women, Kollegal 35
✓ Operating synergy ✓ Potential for new joint products.
DYSERGY [ 2 + 2 = 3]
It is also called as negative synergy & it is opposite of synergy. These are the combined negative attitude
or results. These are the combined negative attitude or results. The idea that combined parts have properties that
are more or less than the sum of the parts it is called called as dysergy, learning synergy to mean only beneficial
effects.
2+2=3 (two plus two is equal to three) less than the sum of the parts, the negative sum of version &
leaving synergy to mean only beneficial effects.
Not all synergy is positive. The combined negative attitudes & argue over small things of dissatisfied
group members can add up to greater trouble than any of the members could have caused individually in any
organizations. Mostly sick companies suffer from this negative synergy.
Negative synergy
It means the combination of efforts results in less output; it can result from due to following reasons,
✓ Inefficient committees
✓ Business units that lack strategic fit &
✓ From other poorly functioning joint efforts.
Negative synergy occurs in groups, committees, & other joint efforts for a number of reasons. Groups
commonly experience negative synergy because group decisions are often reached more than individual
decisions. Negative synergy can also occur in group decisions if an individual is allowed to dominate &
control the group decision.
The combination of people or business does not necessarily that it will lead to better outcomes,
it can also resulting lack of harmony or coordination which can lead to negative synergy. Downsizing &
the divestment / cutback of businesses are the part of negative synergy.
GAP ANALYSIS
The evaluation of the difference between a desired outcome and an actual outcome, this difference is
called a gap. In the management literature “GAP Analysis is the comparison of actual performance with
potential performance”. Thus it identifies gap b/w the optimized allocation & integration of the inputs
(resources) & the current allocation level.
GAP analysis in a formal study of what a business is doing currently and where it wants to go in the
future. This reveals areas that can be improved. Gap analysis involves determining, documenting &
approving the variance b/w business requirements & current capabilities. It is a technique of determining the
steps taken to move from the current state to desired future state.
Strategic gap analysis attempts to determine what a company should do differently to achieve a
particular goal by looking at the time frame, management, budget and other factors to determine where
shortcomings lay. After conducting this analysis, the company should develop an implementation plan to
eliminate the gaps.
GAP analysis provides foundation for measuring investment of time, money and Human resources
required to achieve particular outcome. Gap analysis naturally flow from Benchmarking & form other
assessment.
Once the general expectation of performance in the industry in understand it is possible to compare
that expectation with the company’s current level of performance. This comparison becomes the gap
analysis. Such analysis can be performed at strategic or operational level of an organization.](https://image.slidesharecdn.com/s-221124172756-7e1947d4/85/S-Mgt-unit-2-pdf-35-320.jpg)
![Saraswathi S. Asst Professor, JSS College for Women, Kollegal 36
Gap Analysis has also been used as means of classifying how well a product or solution meets a
targeted need or set of requirements. In this case, “GAP” can be used as a ranking of “Good”, “Average” &
“Poor”.
GAP Analysis. Good, Average & Poor
GAP analysis can identify gaps in the market. Thus comparing forecast to desired profits to reveals the
planning Gap. This represents a goal for new activities in general & new products in particular.
The planning Gap can be divided into 3 main elements-
1] Usage Gap:
It is the gap b/w the total potential for the market & actual current usage by all consumer in the market.
It is most important for brand leaders.
2]Existing Usage:
It makes up the total current market from which market shares, for examples are calculated. It usually
derives from marketing research most accurately from panel research, but also from adhoc work.
Usage Gap = Market potential – Existing usage.
3]Product Gap:
It also called as segment or positioning gap. It is the part of the market a particular origination is
excluded from because of the product or service characteristics. This may be because the market is
segmented & the organization does not have offerings in some segments, in a way that effectively excludes
certain potential consumer because competitive offerings are much better placed for these consumers.
The product gap may be the main element of the planning gap where an organization can be
product inputs hence the emphasis on the importance of correct positioning.](https://image.slidesharecdn.com/s-221124172756-7e1947d4/85/S-Mgt-unit-2-pdf-36-320.jpg)
![Saraswathi S. Asst Professor, JSS College for Women, Kollegal 38
9th Step: Accept the feedback of the GAP analysis process. As, this helps in proper reviewing of additional
GAP’s if any.
10th Step: Monitor and report the progress achieved.
ADVANTAGES
✓It is a diagnostic tool, to improve the performance of the organization.
✓This can also be used to compare the results of the past and future states.
DISADVANTAGES
✓The desired state becomes unrealistic at certain times.
✓The external environment is overlooked.
DIFFERENT METHODS TO CONDUCT GAP ANALYSIS
There are mainly 4 types, they are:-
✓ SERVQUAL
✓ ISO 9001:2000
✓ SAGA(Self Assessment Gap Analysis)
✓ Two Dimensional Analysis
1] SERVQUAL
This Method of GAP Analysis consists of set of Questions Divided in Five categories.
WHAT DO WE DO WITH THIS SURVEY?
Administer the survey to customer and the company. The results will show difference in perceptions between
✓Customers
✓Employees
✓Management
Assurance
Empathy](https://image.slidesharecdn.com/s-221124172756-7e1947d4/85/S-Mgt-unit-2-pdf-38-320.jpg)
![Saraswathi S. Asst Professor, JSS College for Women, Kollegal 39
2] ISO 9001:2000
ISO (International Organization for Standardization) is the world's largest developer and publisher of
International Standards. Identifying the GAPS with reference to the Standards provided by ISO and
Finding out solutions To Fill them. The ISO 9000 family of standards relate to quality management systems.
3] SAGA(Self Assessment Gap Analysis)
Rather than sending out a survey as in SERVQUAL, SAGA is a process used to take a close look at an
organization’s operations. In SAGA a Company/Process/Approach is Analysed using the Baldrige criteria
and the Gaps are found out.
What is Baldrige Criteria?
Recipients are selected based on achievement & improvement in 7 areas, known as the Baldrige
criteria for performance excellence. Leadership: how upper management leads the organisation, & how the
organization leads within the community.
4] Two Dimensional Gap Analysis
The maintenance of biodiversity requires a wise combination of protection, management, and
restoration of habitats at several scales. The solution lies in integration of natural and social sciences in the
form of two-dimensional gap analysis, as an efficient tool for biodiversity policies.
APPLICATIONS WHERE THE GAP ANALYSIS ARE USED
It is used in many areas such as.,
✓Production Industry
✓Sales Forecast
✓Fiscal policies
✓Performance of an individual & HRM
✓Quality assurance & Cost control
✓Financial performance
✓Market competitiveness & Management skills
EXAMPLE FOR GAP ANALYSIS
A] If a small mom and pop restaurant wanted to become a top tourist destination but currently only
served locals, a strategic gap analysis would look at the changes required for the restaurant to meet its goals.
These changes might include relocating to an area with more tourists, altering the menu to appeal to out-of-
town visitors, hiring more staff so the restaurant's hours become more convenient for travelers, and so on.
The analysis would also determine how to make these changes happen. If a business doesn't know where it
stands in relation to its goals, it is not likely to achieve them.
B] A telecom company performs a gap analysis to understand why a number of orders have been
delivered late to customers. They map out the current process and identify manual steps, redundant work,
overly complex dependences, bottlenecks, technology pain points and process risk and document them as
gaps, The Gap analysis also produces an optimized target state process that cuts days from order
provisioning time, reduces cost and mitigates risks.](https://image.slidesharecdn.com/s-221124172756-7e1947d4/85/S-Mgt-unit-2-pdf-39-320.jpg)
![Saraswathi S. Asst Professor, JSS College for Women, Kollegal 40
PORTER'S FIVE FORCES MODEL OF COMPETITION
Michael E. Porter. Born in 1947. He is the Professors in Harvard Business School. Porter's introduced
the 5 Forces Model. He has Written 18 books & over 125 Articles. He is called as “Guru of modern day
business strategy”.
The Five Forces model of Porter is an outside-in business unit strategy tool that is used to make an
analysis of the attractiveness (value...) of an industry structure. It captures the key elements of industry
competition. It is one of the most recognized frameworks for the analysis of business strategy. It is used as
theoretical framework derived from Industrial Organization [IO] economics to derive five forces which
determine the competitive intensity & therefore attractiveness of a market.
This theoretical framework is based on 5 forces, describes the attributes of an attractive industry &
thus suggests when opportunities will be greater & threats are less, in these of industries.
✓ Attractiveness in this context refers to overall industry profitability & also reflects upon the
profitability of the firm under analysis.
✓ An “Unattractive” industry is one where the combination of forces acts to drive down overall
profitability.
✓ A “Very Unattractive” industry would be one approaching “pure competition”, from the perspective of
pure industrial economics theory.
Porter’s model is based on the insight that a corporate strategy should meet the opportunities & threats
in the organizations external environment. This model supports analysis of the driving forces in an industry.
It helps to decide how to influence or to exploit particular characteristics of their industry.
IMPORTANCE OF 5 FORCES
✓ What strategy to use?
✓ Basic knowledge of business strategy & forces that influence the decision making
✓ Industry analysis [Industry relevance, Industry players, Industry structure, Future changes]
✓ Strategize [Competitive advantage, Cost advantage, Market dominance, New product development,
Contraction / Diversification, Price leadership, Global, Re-engineering, Downsizing, De-layering,
Restructuring.
✓ Measure and monitor strategy effectiveness
The purpose of Five-Forces Analysis
The five forces are environmental forces that impact on a company’s ability to compete in a
given market.
The purpose of five-force analysis is to diagnose the principal competitive pressures in a
market and assess how strong and important each one is.](https://image.slidesharecdn.com/s-221124172756-7e1947d4/85/S-Mgt-unit-2-pdf-40-320.jpg)
![Saraswathi S. Asst Professor, JSS College for Women, Kollegal 41
[1] Threat of New Entrants
This force determines how easy it is to enter a particular industry. If an industry it is a profitable are
few barriers to enter, rivalry soon intensifies. When more organization compete for same market shares, profit
start to fall. It is essential existing organization to create high barriers to enter to deter new entrants.
The easier it is for new companies to enter the industry, the more cutthroat competition there will be.
Factors that can limit the threat of new entrants are:
✓ Economies of Scale
✓ Product Differentiation
✓ Capital Requirements
✓ Customer Switching Costs
✓ Access to Distribution Channels
✓ Government Policy
✓ Expected Retaliation
[2] Bargaining Power of Suppliers
The term suppliers comprise all sources for inputs that are needed in order to provide goods &
services. The bargaining power of supplier is also described as the market of inputs. Suppliers of raw material,
components, labor, and services to the firm can be a source of power over the firm when there are few
substitutes. If you’re making biscuits and there is only one person who sells flour, you have no alternative but
to buy it from them. Supplier may refuse to work with the firm or charge excessively high prices for unique
resources. Suppliers are likely to be powerful if:
✓ Supplier industry is dominated by a few firms
✓ Suppliers’ products have few substitutes
✓ Buyer is not an important customer to supplier
✓ Suppliers’ product is an important input to buyers’ product
✓ Suppliers’ products are differentiated
✓ Suppliers’ products have high switching costs](https://image.slidesharecdn.com/s-221124172756-7e1947d4/85/S-Mgt-unit-2-pdf-41-320.jpg)
![Saraswathi S. Asst Professor, JSS College for Women, Kollegal 42
[3] Bargaining Power of Buyers
The bargaining power of customers determines how much customers can impose pressure on margins
& volumes. The bargaining power of customer of is also described as the market of outputs. The ability of
customer to put them firm under pressure, which also affects the customer’s sensitivity to price changes. Firms
can take to measures to reduce buyer power, such as implementing a loyalty program. The buyer power is high
if the buyer has many alternatives. The buyer power is low if they act independently. Their power is likely to
be high. Buyer groups are likely to be powerful if:
✓ Buyers are concentrated Purchase accounts for a significant fraction of supplier’s sales
✓ Products are undifferentiated
✓ Buyers face few switching costs
✓ Buyer presents a credible threat of backward integration
✓ Buyer has full information
[4] Threat of Substitute Products
Threats of Substitute in the Porter’s theory actually mean goods and services that do similar functions.
When there is one product successful, it also leads to the creation of other products that can perform the
same functions as the product of the same industry. The existence of product outside of the realm of the
common product boundaries increase the propensity of customer to switch to attractiveness.
✓ Keys to evaluate substitute products:
✓ Products with improving
✓ price/performance tradeoffs
✓ relative to present industry products
[5] Rivalry Among Existing Competitors
For most industries the intensity of competitive rivalry is the major determinant of the competitiveness
of the industry. Intense rivalry often plays out in the following ways:
✓ Using price competition
✓ Staging advertising battles
✓ Making new product introductions
✓ Increasing consumer warranties or service
Occurs when a firm is pressured or sees an opportunity
✓ Price competition often leaves the entire industry worse off
✓ Advertising battles may increase total industry demand, but may be costly to smaller competitors
ADVANTAGES
✓ To create a defendable position in an industry, in order to cope successfully with competitive
forces.
✓ It provides as Cost leadership (low cost advantage)
✓ It creates differentiation in market or product
✓ The model is strong tool for competitive analysis at industry level.
✓ It provides useful input for performing a SWOT analysis.
DISADVANTAGES
✓ Inside-out strategy is ignored (core competence)
✓ It does not cope with synergies and interdependencies of large corporations](https://image.slidesharecdn.com/s-221124172756-7e1947d4/85/S-Mgt-unit-2-pdf-42-320.jpg)
![Saraswathi S. Asst Professor, JSS College for Women, Kollegal 43
✓ The environments which are characterized by rapid, it requires more flexible, dynamic or emergent
approaches
✓ Sometimes it may be possible to create completely new markets instead of selecting from existing
ones (blue ocean strategy) [blue ocean strategy: - it refers to a market for a product where there is
no competition or very less competition.
EXAMPLE COCO COLA
[1] New entrants: New “look-a-like” manufacturers
[2] Substitute products: Fashionable new drinks, milk drinks, coffee, beer, .
[3] Suppliers: Price and availability of ingredients on world market, Quality speed safety, traceability,
flexibility of supply chain.
[4] Buyers/consumers: High as a result of intense competition both among branded and unbranded
products. Combined purchase power of shops, bars, supermarkets, soda shop, vending machine,
restaurants & food stores, convenience store.
[5] Traditional competition: Prices of Pepsi, local brands, Market share, Promotional actions of
competition
MC KINSEY'S 7’S FRAMEWORK
It was first mentioned in “The Art of Japanese Management” by Richard Pascal & Anthony Athos in
1981. They have been investigating how Japanese Industry has been so successful. At around the same time
that Tom Peters & Robert Waterman were exploring what made a company excellent. The 7s model was born
at a meeting of these four authors. It was introduced in Mckinsey’s company
HOW TO USE THE MODEL
✓ You can use the 7S model to help analyze the current situation (Point A), a proposed future
situation (Point B) and to identify gaps and inconsistencies between them.
✓ It's then a question of adjusting and tuning the elements of the 7S model to ensure that your
organization works effectively and well once you reach the desired endpoint.
The 7-s framework of McKinney’s is the value based management model that describes 7 factors to
organize a company in a holistic and effective way. Together these factors determine the way in which the
corporation operates. Large or small, the strategies are all interdependent, so if you fail to pay proper
attention to one of them, this may affect all others as well.
The most common uses of the frame work are:
✓ To facilitate organizational framework
✓ Examine the likely effects of structure of future changes within a company
✓ To identify how each area may change in future
✓ To facilitate the merger of an organisation.
✓ Organizational Analysis Tool
✓ Monitor Changes in the Internal Situation of the Organization
✓ It’s a management model that describes 7 factors to organize a company in an holistic & effective way.
✓ Together these factors determine the way in which a corporation operates.](https://image.slidesharecdn.com/s-221124172756-7e1947d4/85/S-Mgt-unit-2-pdf-43-320.jpg)
![Saraswathi S. Asst Professor, JSS College for Women, Kollegal 44
✓ Managers should take into account all 7 of these factors, to be sure of successful implementation of a
strategy.
✓ It is used b/w each of the S’s one can identify strengths & weaknesses of an organisation.
REASONS WHY TO USE
THE 7S FRAMEWORK
The model is most often used as a tool to assess and monitor changes in the internal situation of an
organization.
THE 7S ELEMENTS
The seven interdependent factors are categorized as either "hard" or "soft" elements.
A] Hard Elements:
"Hard" elements are easier to define or identify Management can directly influence them.
These are,-
✓ Strategy
✓ Structure &
✓ Systems
B] Soft Elements:
"Soft" elements, on the other hand, can be more difficult to describe. They are less tangible and more
influenced by culture. These soft elements are as important as the hard elements if the organization is going to
be successful.
These are,-
✓ Shared Values,
✓ Skills,
✓ Style &
✓ Staff](https://image.slidesharecdn.com/s-221124172756-7e1947d4/85/S-Mgt-unit-2-pdf-44-320.jpg)
![Saraswathi S. Asst Professor, JSS College for Women, Kollegal 45
[1] Strategy:
Purpose of the business and the way the organization seeks to enhance its competitive advantage. The
plan devised to maintain and build competitive advantage over the competition.
[2] Systems:
The daily activities and procedures that staff members engage in to get the job done.
[3] Structure:
The way the organization is structured and its units related to each other and who reports to whom.
[4] Shared Values:
These are also called as "super ordinate goals" when the model was first developed. These are the core
values of the company that are evidenced in the corporate culture and the general work ethic. Values and
beliefs of the company what an organization wants to achieve, what its purpose, vision, mission, central
beliefs & attitude.
[5] Skills:
The actual skills and competencies of the employees working for the company
[6] Style:
The style of leadership adopted.
[7] Staff:
The company's people resources and how they are developed, trained and motivated
OBJECTIVES / ADVANTAGES
✓ Improve the performance of A company
✓ Examine the likely effects of future changes within A company](https://image.slidesharecdn.com/s-221124172756-7e1947d4/85/S-Mgt-unit-2-pdf-45-320.jpg)
![Saraswathi S. Asst Professor, JSS College for Women, Kollegal 46
✓ Align departments and processes during A merger or acquisition
✓ Determine how best to implement A proposed strategy
DISADVANTAGES
✓ What type of analysis is this? Or what is the action triggered after putting your organization into this
drill?
✓ Does this give you real guidelines as to how to proceed further, after the analysis is completed?
✓ Do we treat this as a guideline or checklist and proceed with using other techniques to formulate
further steps?
✓ There are been other techniques in vogue which have to be used arrive at actionable points.
✓ The above seems abstract list of generic elements in any organization, to improve the each business
process, such as marketing, finance, manufacturing etc.
EXAMPLE : INFOSYS
It Was Co-founded In 1981. It is an Indian Multinational Corporation that provides Business
Consulting, information Technology, software Engineering and Outsourcing Services. It is the Third Largest
India Based It Services Company By 2014 Revenues and The Fifth Largest Employer. The Market
Capitalization Is $31.11 Billion Making It India’s Fifth Largest Publicly Traded Company.
The 7’s elements are:-
[1] STRATEGY:
✓ What is the strategy?
✓ How to intend to achieve the objectives?
✓ How to deal with competitive pressure?
✓ How are changes in customer demands dealt with?
✓ How is strategy adjusted for environmental issues?
STRATEGY FOLLOWED BY INFOSYS:
✓ Client focused strategy to achieve growth
✓ Increase business from existing and new clients
✓ Expand geographically
✓ Enhance solution set
✓ Develop deep industry knowledge
✓ Enhance brand visibility
✓ Pursue alliances and strategic acquisitions
[2] ORGANISATION STRUCTURE:
✓ How is the company/team divided?
✓ What is the hierarchy?
✓ How do various departments coordinate activities?
✓ How do the team members organize and align themselves?
✓ Is decision making and controlling centralized or decentralized?
ORGANISATION STRUCTURE AT INFOSYS:
✓ Adopted a free organization devoid of hierarchies.
✓ Everyone is known as associates of his position in the company.
✓ Software development is undertaken through teams and the constitution of teams is based on the
principle of flexibility.](https://image.slidesharecdn.com/s-221124172756-7e1947d4/85/S-Mgt-unit-2-pdf-46-320.jpg)
![Saraswathi S. Asst Professor, JSS College for Women, Kollegal 47
[3] STAFF:
“Staff” refers to the number and type of personnel within the organization and how companies develop
employees and shape basic values.
✓ Vast human capital, 1,65,000 + employees.
✓ Emphasis on selecting the right candidate.
✓ Spends about 2.65% of its revenue on up gradation of employees skills.
✓ Build a fulfilling career in consulting, technology & outsourcing.
[4] SYSTEMS:
Defines the flow of activities involved in the daily operation of business, including its core processes
and its support systems.
[5] SHARED VALUES:
Shared Values are the commonly held beliefs, mind-sets and assumptions that shape how an
organisation behaves, also known as the “Corporate Culture”.
[6] STYLE:
Cultural style and behavior of organization.
✓ How participative is the management style?
✓ How effective is the leadership?
✓ Do employees tend to be cooperative or competitive?
✓ Are there real teams functioning within the organization or are they just nominal groups?
[7] SKILLS:
✓ Dominant attributes that exist in the organization.
✓ What are the strongest skills represented within the company?
✓ Are there any skills gaps?
✓ What is the company known for doing well?
✓ Do the current employees have the ability to do the job?
DISTINCTIVE COMPETITIVENESS
It is a set of unique capabilities that certain firms process allowing them to make inroads into desired
markets & to gain advantage over the competition; generally, it is an activity that a firm performs better than
its competition. To define a firm’s distinctive competitiveness, management must complete an assessment of
both internal & external corporate environments. When management finds an internal strength & both meets
market needs & gives the firm a comparative advantage in the market place, that strength is the firm’s
Distinctive competence. Defining & building distinctive competence,- to define a company’s distinctive
competence, managers often follow a particular process.
✓They identify the strengths & weaknesses in the given market place
✓They analysis specific market needs & look for comparative advantages that they have over the
competition.
Distinctive competencies are the combination of the best practices and technical skills that increase the
competitiveness of an organization. The idea of core competencies is to create unique and creative product that
will be impossible for competitors to copy. Moreover, theoretically, distinctive competencies should partially
bring benefits to the consumer. Distinctive competence is a list of characteristics that sets a business apart from
others. It may include a number of areas including marketing, technology, manufacturing and so on.](https://image.slidesharecdn.com/s-221124172756-7e1947d4/85/S-Mgt-unit-2-pdf-47-320.jpg)
![Saraswathi S. Asst Professor, JSS College for Women, Kollegal 48
Distinctive competencies give your organization an edge over others so it’s worth developing certain
characteristics that competitors will find difficult to implement. To develop a particular distinctive competence,
companies must conduct a thorough external and internal review of their corporate environment.
Advantages of Distinctive Competence
Developing effective distinctive competencies is crucial for the survival of any organization. It’s worth
noting that these capabilities might change as the market, welcomes new trends. Because of this, companies
must conduct a thorough analysis to ensure its distinctive competencies meet the new market requirements.
Some advantages of distinctive competence include:
1] Increased competitive advantage
Developing the most effective distinctive competencies often leads to efficient business strategies
that would benefit the company as a whole. This also contributes to increased competitive advantage.
2] Beneficial for long-term goals
Distinctive competencies offer a sustainable advantage that is beneficial for the company in the long
run. It allows the company to divert its attention into solving new problems as they come instead on resolving
the same ones over and over again.
3] Better learning opportunities
One of the key advantages of distinctive competencies is that promotes new learning opportunities.
This enables companies to devise new strategies and develop new ideas to get ahead of competitors.
Why Core Competencies?
1. Effective Human Resource Management – Act, according to the needs of your organization and ask,
“what we need?”
2. Training Programs – Programs that aim to meet the needs of the future are highly constructive.
3. SWOT Analysis – Defining the strengths, threats, weaknesses and opportunities of an organization are
essential for the business planning progress.
4. Outsourcing Options – Due to business functions interacting, unplanned consequences of distinctive
competencies might occur.
5. The Vision of the Company – Core competencies give opportunities to whether we’re good at something
or not. Moreover, precisely knowing our strong and weak sides will help to fully understand and exploit
our advantages.
6. Innovation is Essential – Distinctive competence identifies behaviors that are important and suitable for
strategy planning.
EXAMPLES OF CORE COMPETENCIES
Toyota’s Core Competencies –
It’s a bit unusual, but it’s essential for you to know that operating without a distinctive
competency is also possible.
Toyota operates under two ideals: continuous improvement and respect for people.
Google Inc. Core Competencies –](https://image.slidesharecdn.com/s-221124172756-7e1947d4/85/S-Mgt-unit-2-pdf-48-320.jpg)
![Saraswathi S. Asst Professor, JSS College for Women, Kollegal 49
Google’s goal is to educate the society, help them achieve their goals and care for the
environment/culture.
People come to Google with innovative and out-of-this-world strategies.
Apple Inc. Core Competencies –
Apple’s distinctive competencies encompass innovation, marketing, quality, strong customer
service, simplicity and a strong financial performance.
SELECTION OF MATRIX
Each matrix has its own S & W. it is not wise to restrict the analysis to one type of portfolio matrix.
Therefore, it would be better to construct all the eight matrices, provided, adequate data is available. T will
help to assess the company’s portfolio from different perspectives. This process enables to achieve the
analytical objective. The analytical objective is to understand:
✓The portfolio’s mix of industries
✓The strategic position each business has in its industry
✓The portfolio’s performance potential
✓The kind of financial & resource allocation considerations that have to be dealt with.
1] Comparing Industry Attractiveness:-
Judging the attractiveness of the industries in which the business is the central issue in evaluating a
diversified company’s strategy. Industry attractiveness can be judged from 3 perspectives:
✓ The attractiveness of each industry represented in the portfolio. The important consideration is
that, “Is this a good industry for the company to have its business in?”
✓ Each of industry attractiveness is relative to the others. The company should find itself. “Which
industries in the portfolio are the most attractive and which are the least attractive?”
✓ The attractiveness’ of all industries as a group. The company should find, “how appealing is the
mix of industries?”
Following are the attractive factors; all company should adopt it –
✓ Market size & projected growth rate.
✓ The intensity of competition
✓ Technological & production skills requires
✓ Capital requirements
✓ Seasonal & cyclical factors
2] Comparing Business Unit Strength:-
Appraising each business unit’s strengths & competitive position in its industry helps managers to
judge a business unit’s chance for success in its industry. Assessment of how a company’s business
compares in compares in competitive strength should be based on the following factors -
✓ Relative market share
✓ Ability to compete on price &/or quality
✓ Technology & innovation capabilities
✓ How well the business units’ skill and competences match industry key success factors
✓ Profitability relative to competitors
✓ Other factors include
Shareholders’ interests are normally served better, by concentrating company resources on business
that can contend for market leadership in their industry.](https://image.slidesharecdn.com/s-221124172756-7e1947d4/85/S-Mgt-unit-2-pdf-49-320.jpg)
![Saraswathi S. Asst Professor, JSS College for Women, Kollegal 50
3] Comparing Business Unit Performance:-
After the businesses have been rated based on the industry attractiveness & competitive strength, the
business should be evaluated to know their performance prospects ranging from the best to the worst. The
factors that should be considered in this respect are –
✓ Sales growth
✓ Profit growth
✓ Contribution to corporate earnings
✓ Rate of return on the capital employed
✓ Cash flow generation etc.
4] Strategic Fit Analysis:-
The strategic fit analysis studies, how well each business unit fits into the company’s overall portfolio
of business. This can be analyzed from 2 angles:
✓ Whether a business unit has valuable strategic fit with other businesses the firms has diversified
into.
✓ Whether a business unit meshes well with corporate strategy or adds a beneficial dimension to
the corporate portfolio.
The best strategic fit business in the overall corporate portfolio makes valuable financial contributions.
It also contributes to the achievement of corporate objectives.
5] Formulating a Corporate Strategy:-
Strategist should, move to formulate a strategy to improve the performance of a diversified company.
This is based on the overall mix of businesses in the portfolio. Key consideration in this regard include -
✓ Does the portfolio contain enough business in attractive industries?
✓ How many businesses are question marks?
✓ What is the proportion of mature businesses in the portfolio?
✓ Does the portfolio contain enough cash cows to finance the stars & emerging winners?
✓ Does the core business of the company earn enough profits?
✓ Seasonality & cyclical factors
✓ Are there too many weak portfolios
✓ Does the new corporate strategy improve the overall performance of the company?
The strategist should evaluate the company in terms of performance objectives with its current line of
business in order to know the financial viability of the strategy.
END](https://image.slidesharecdn.com/s-221124172756-7e1947d4/85/S-Mgt-unit-2-pdf-50-320.jpg)