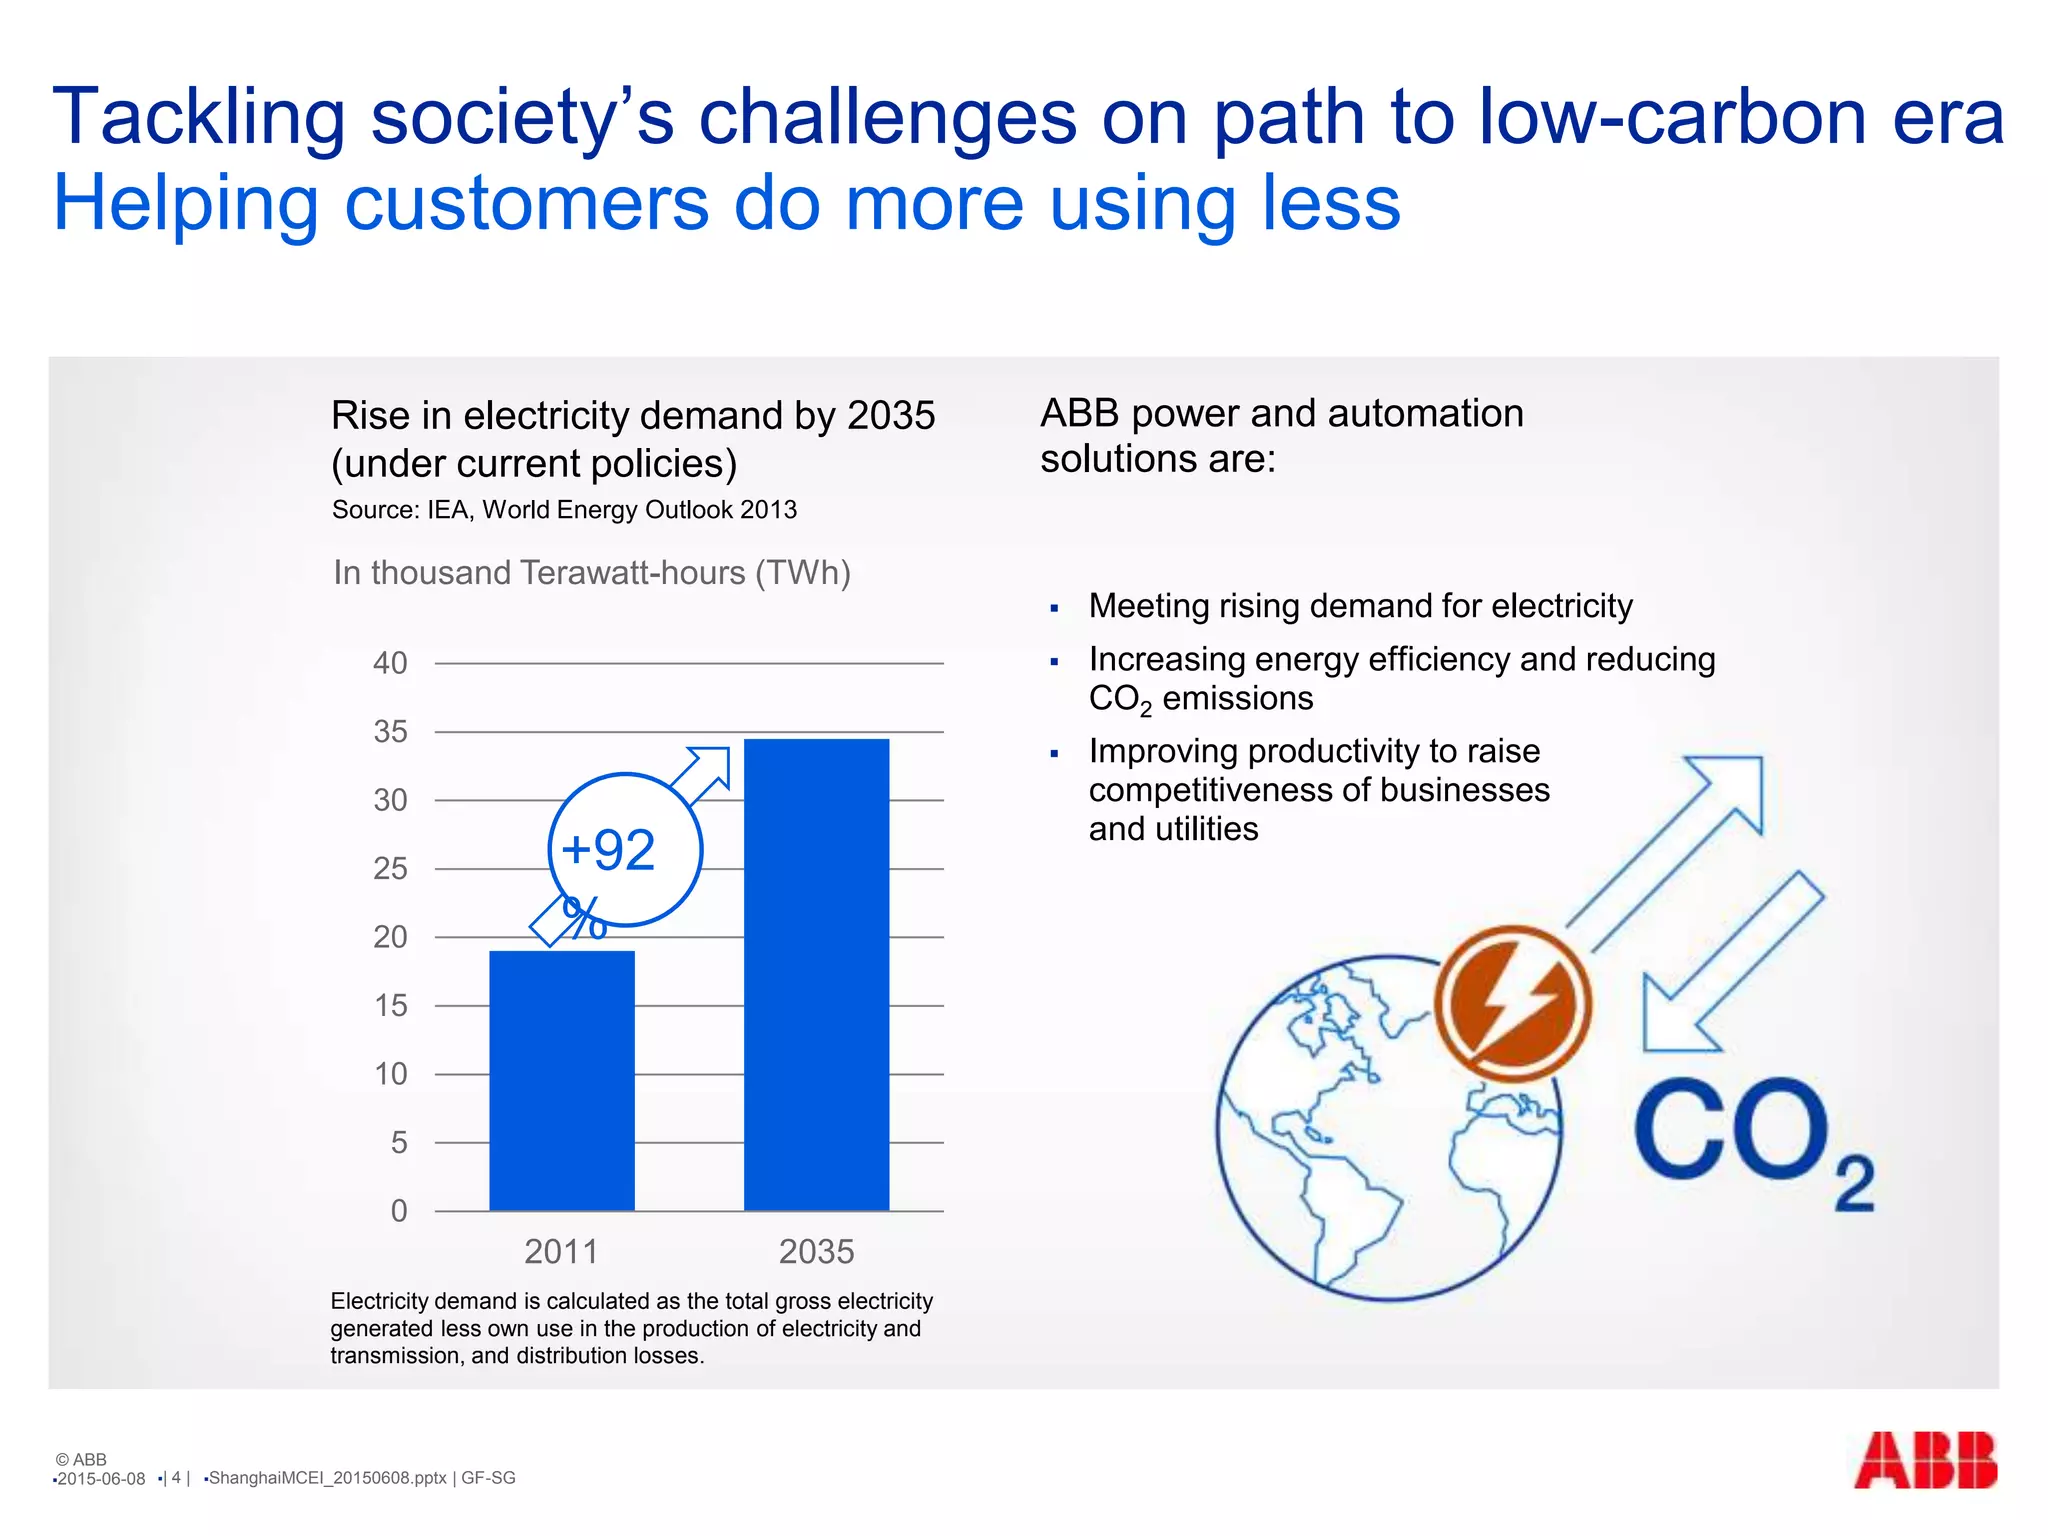
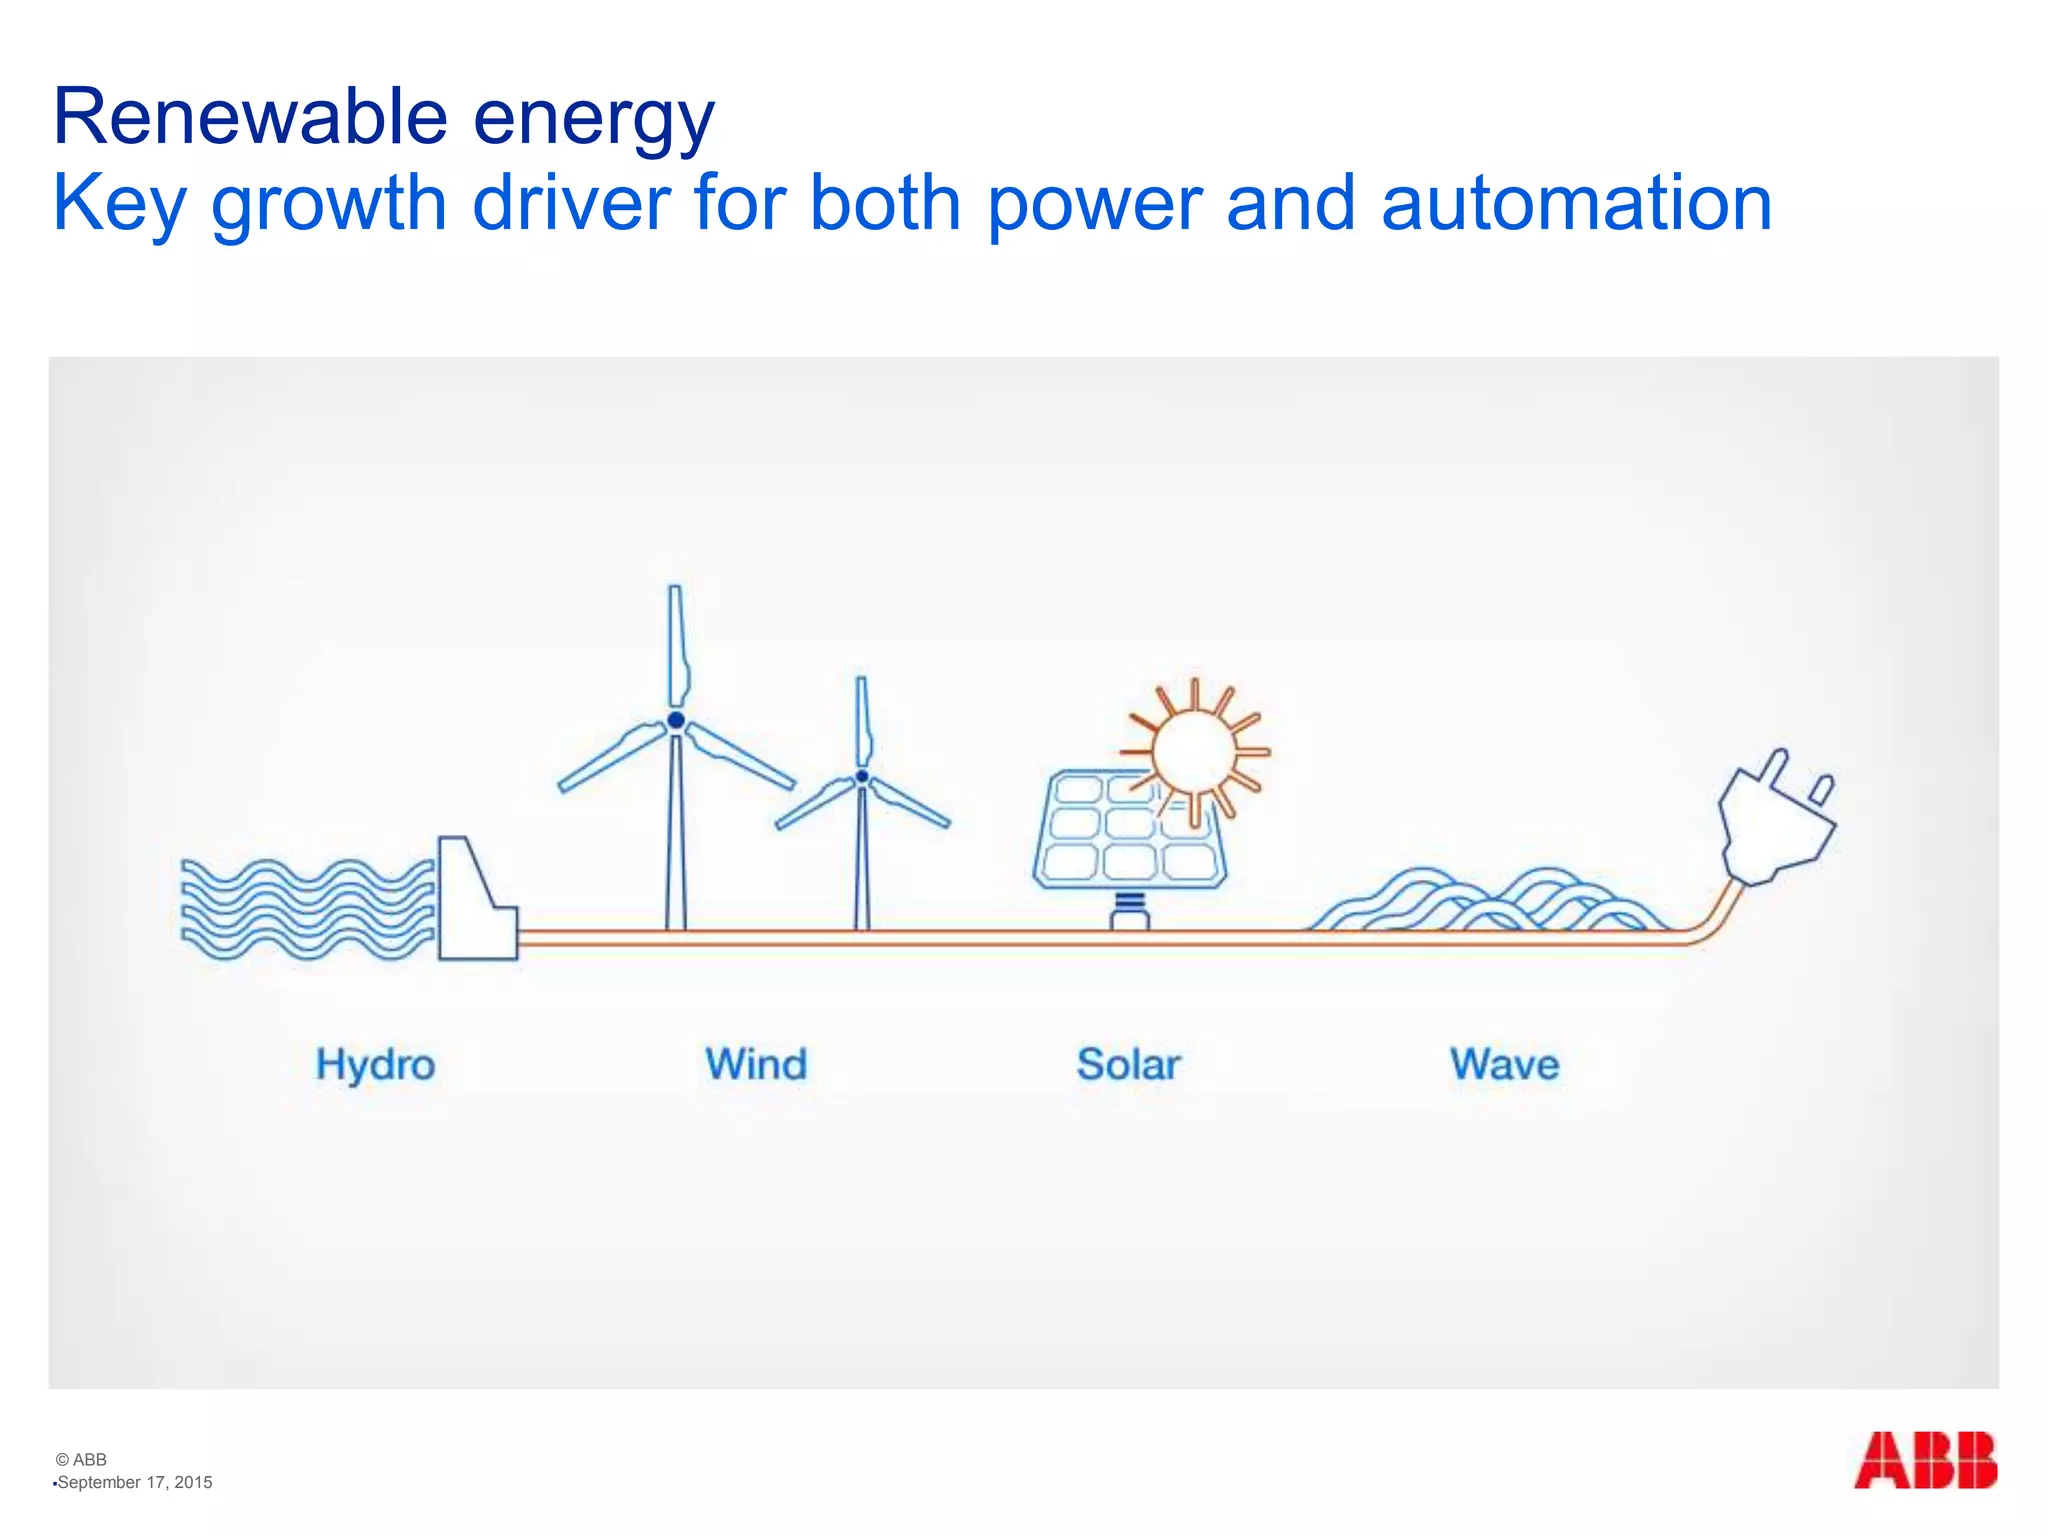
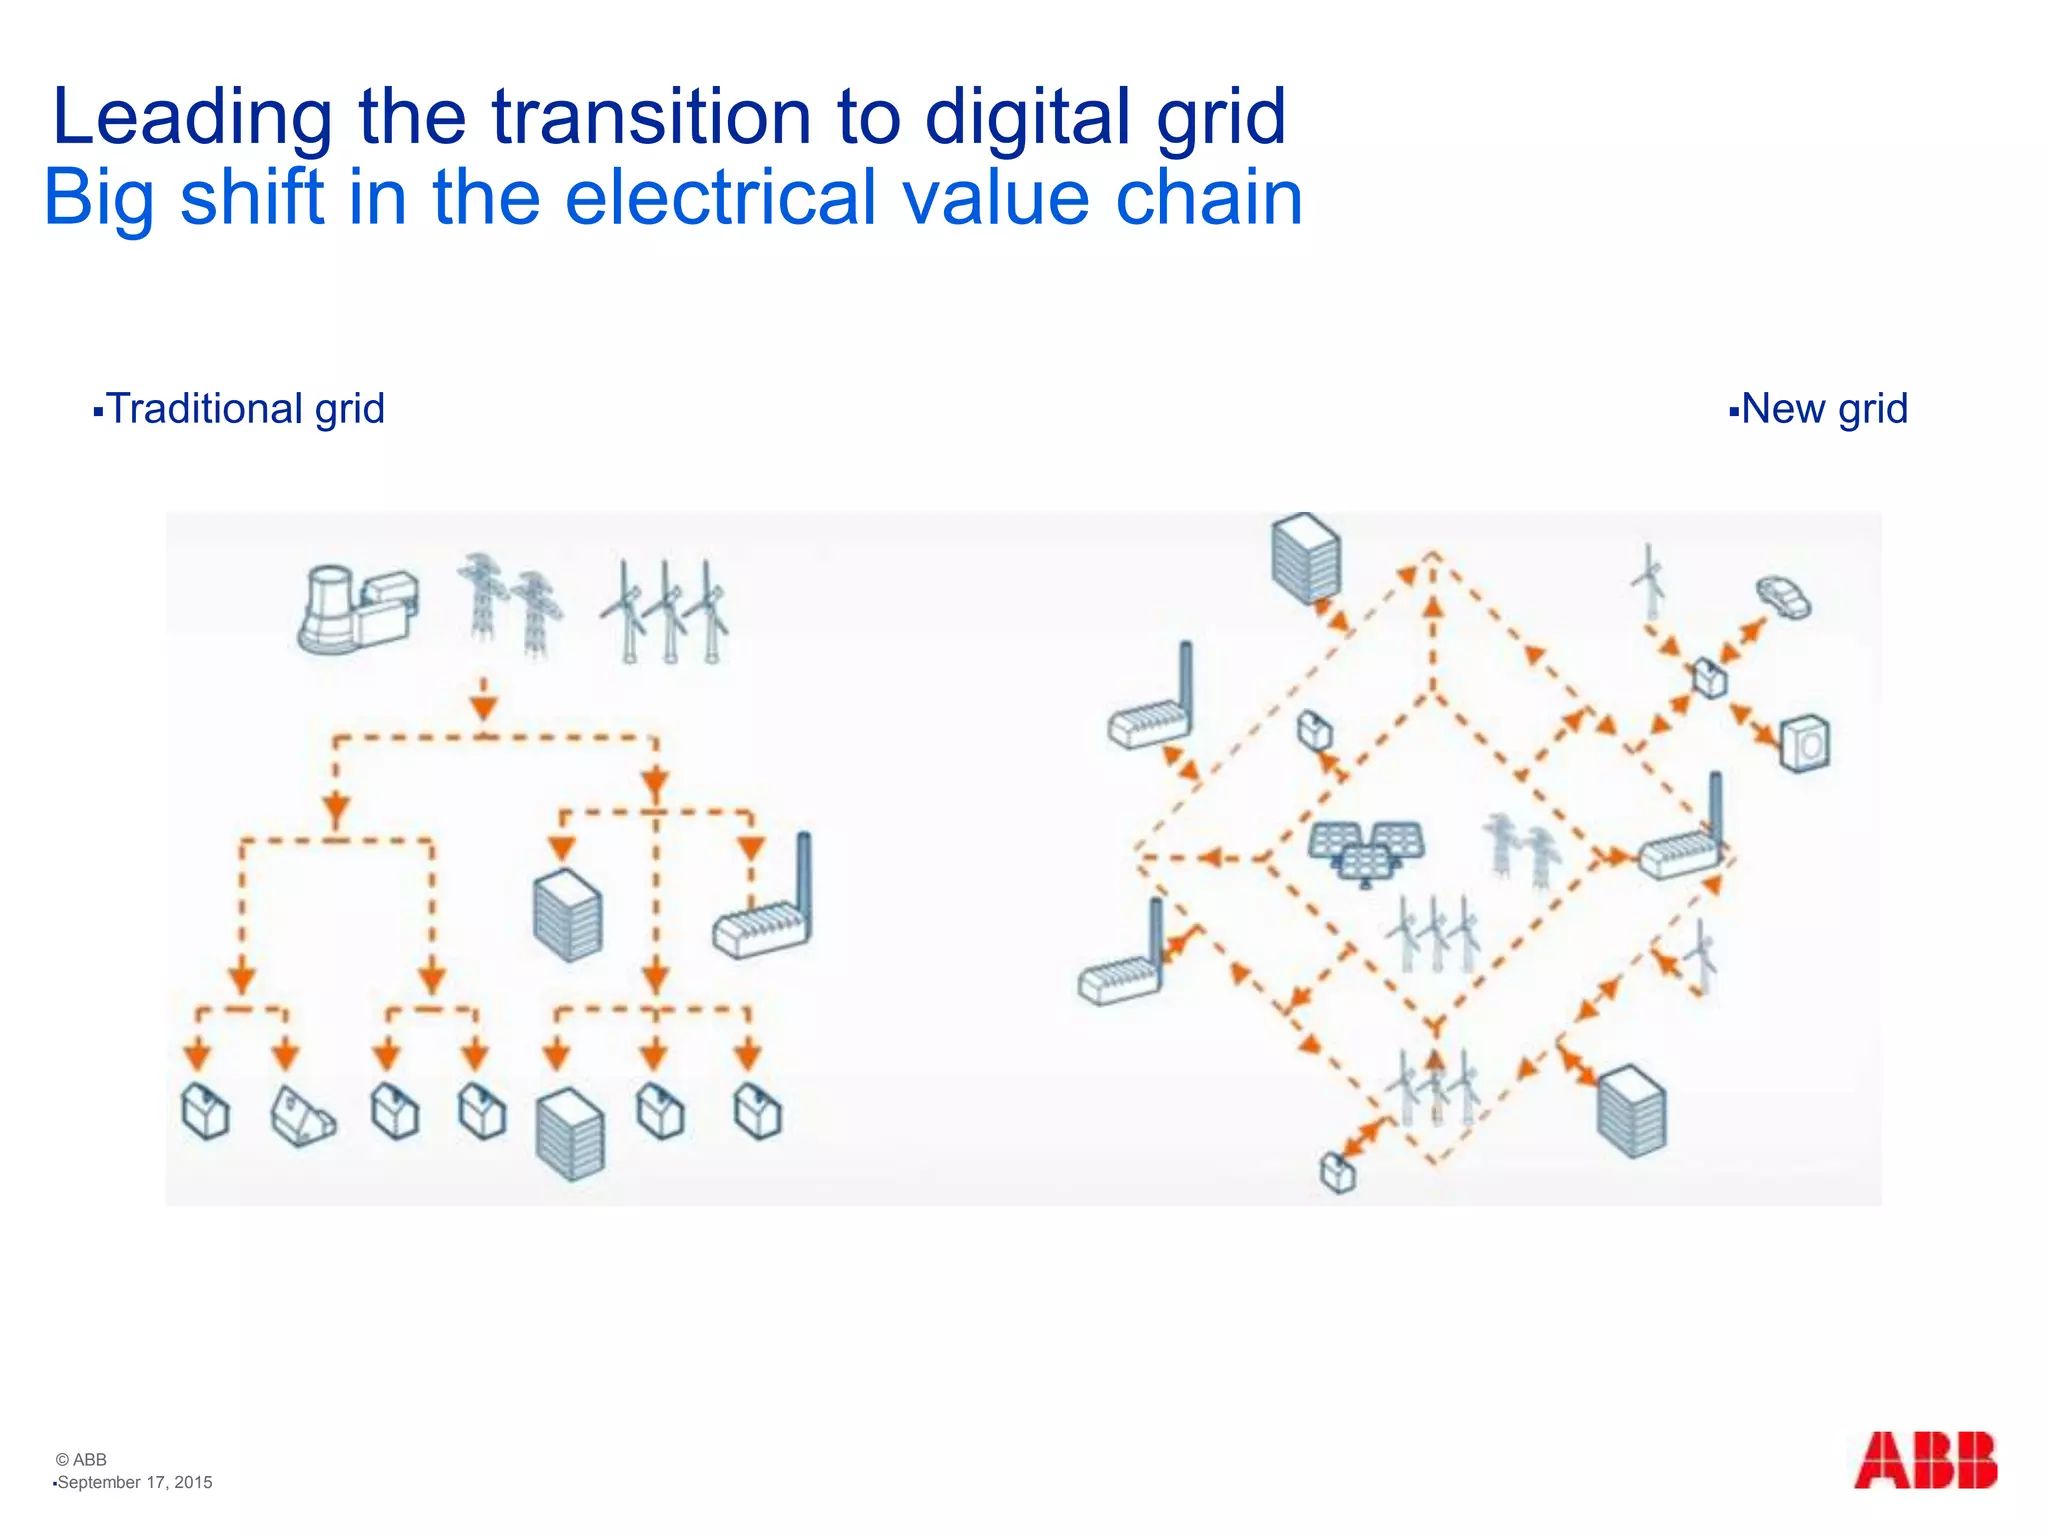
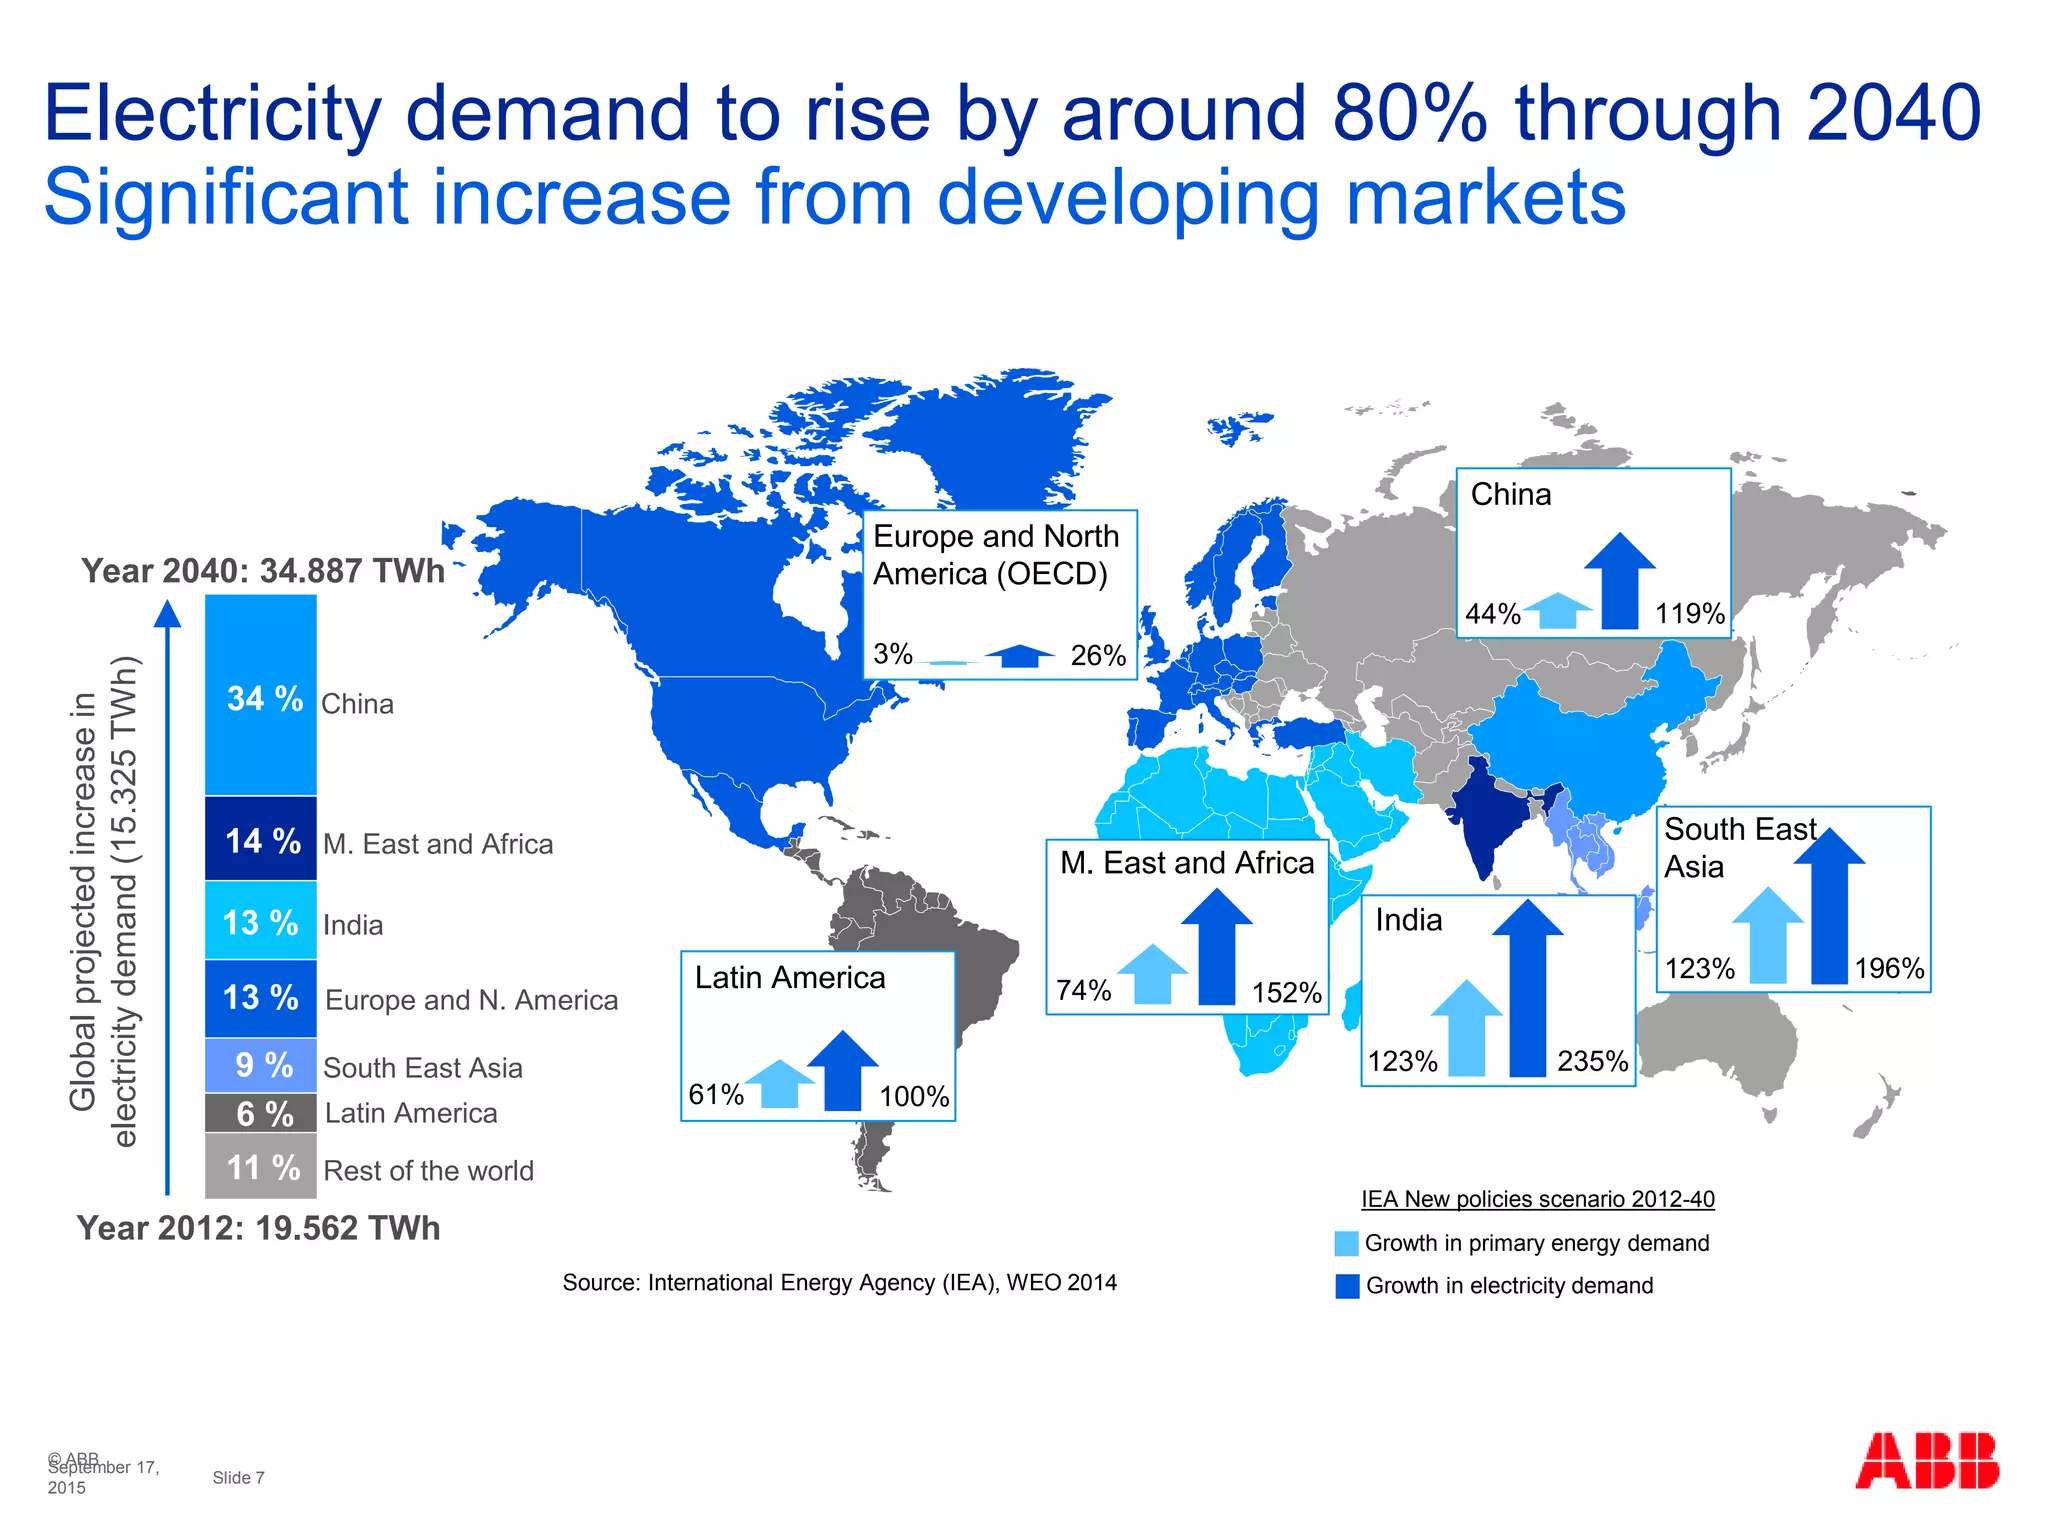
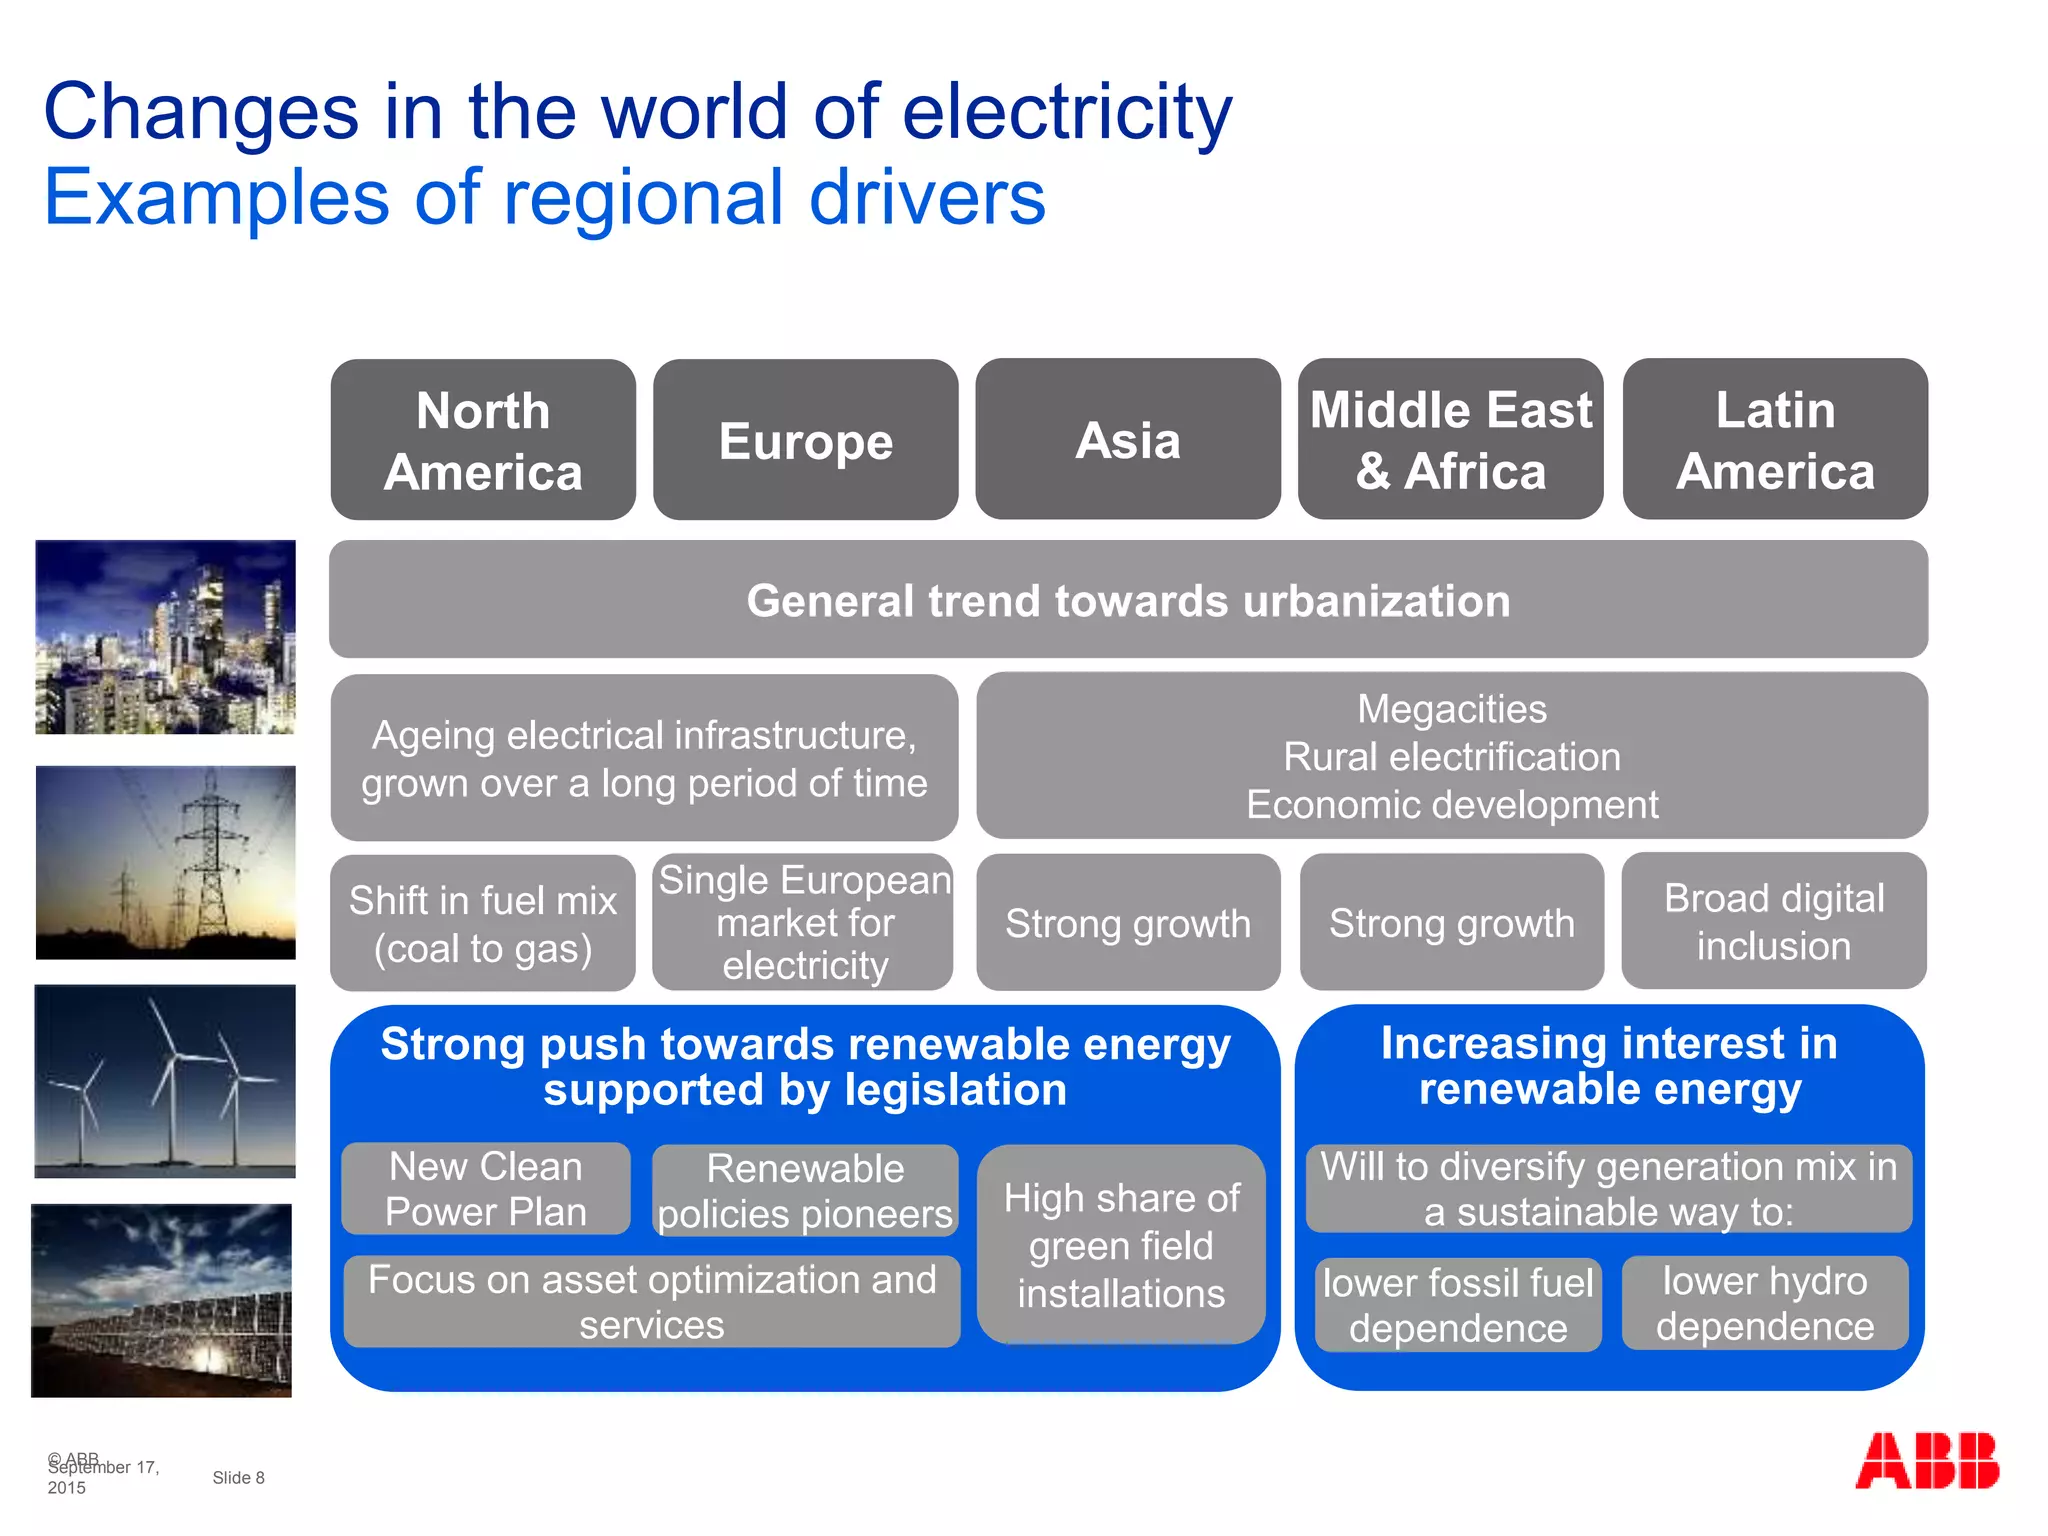
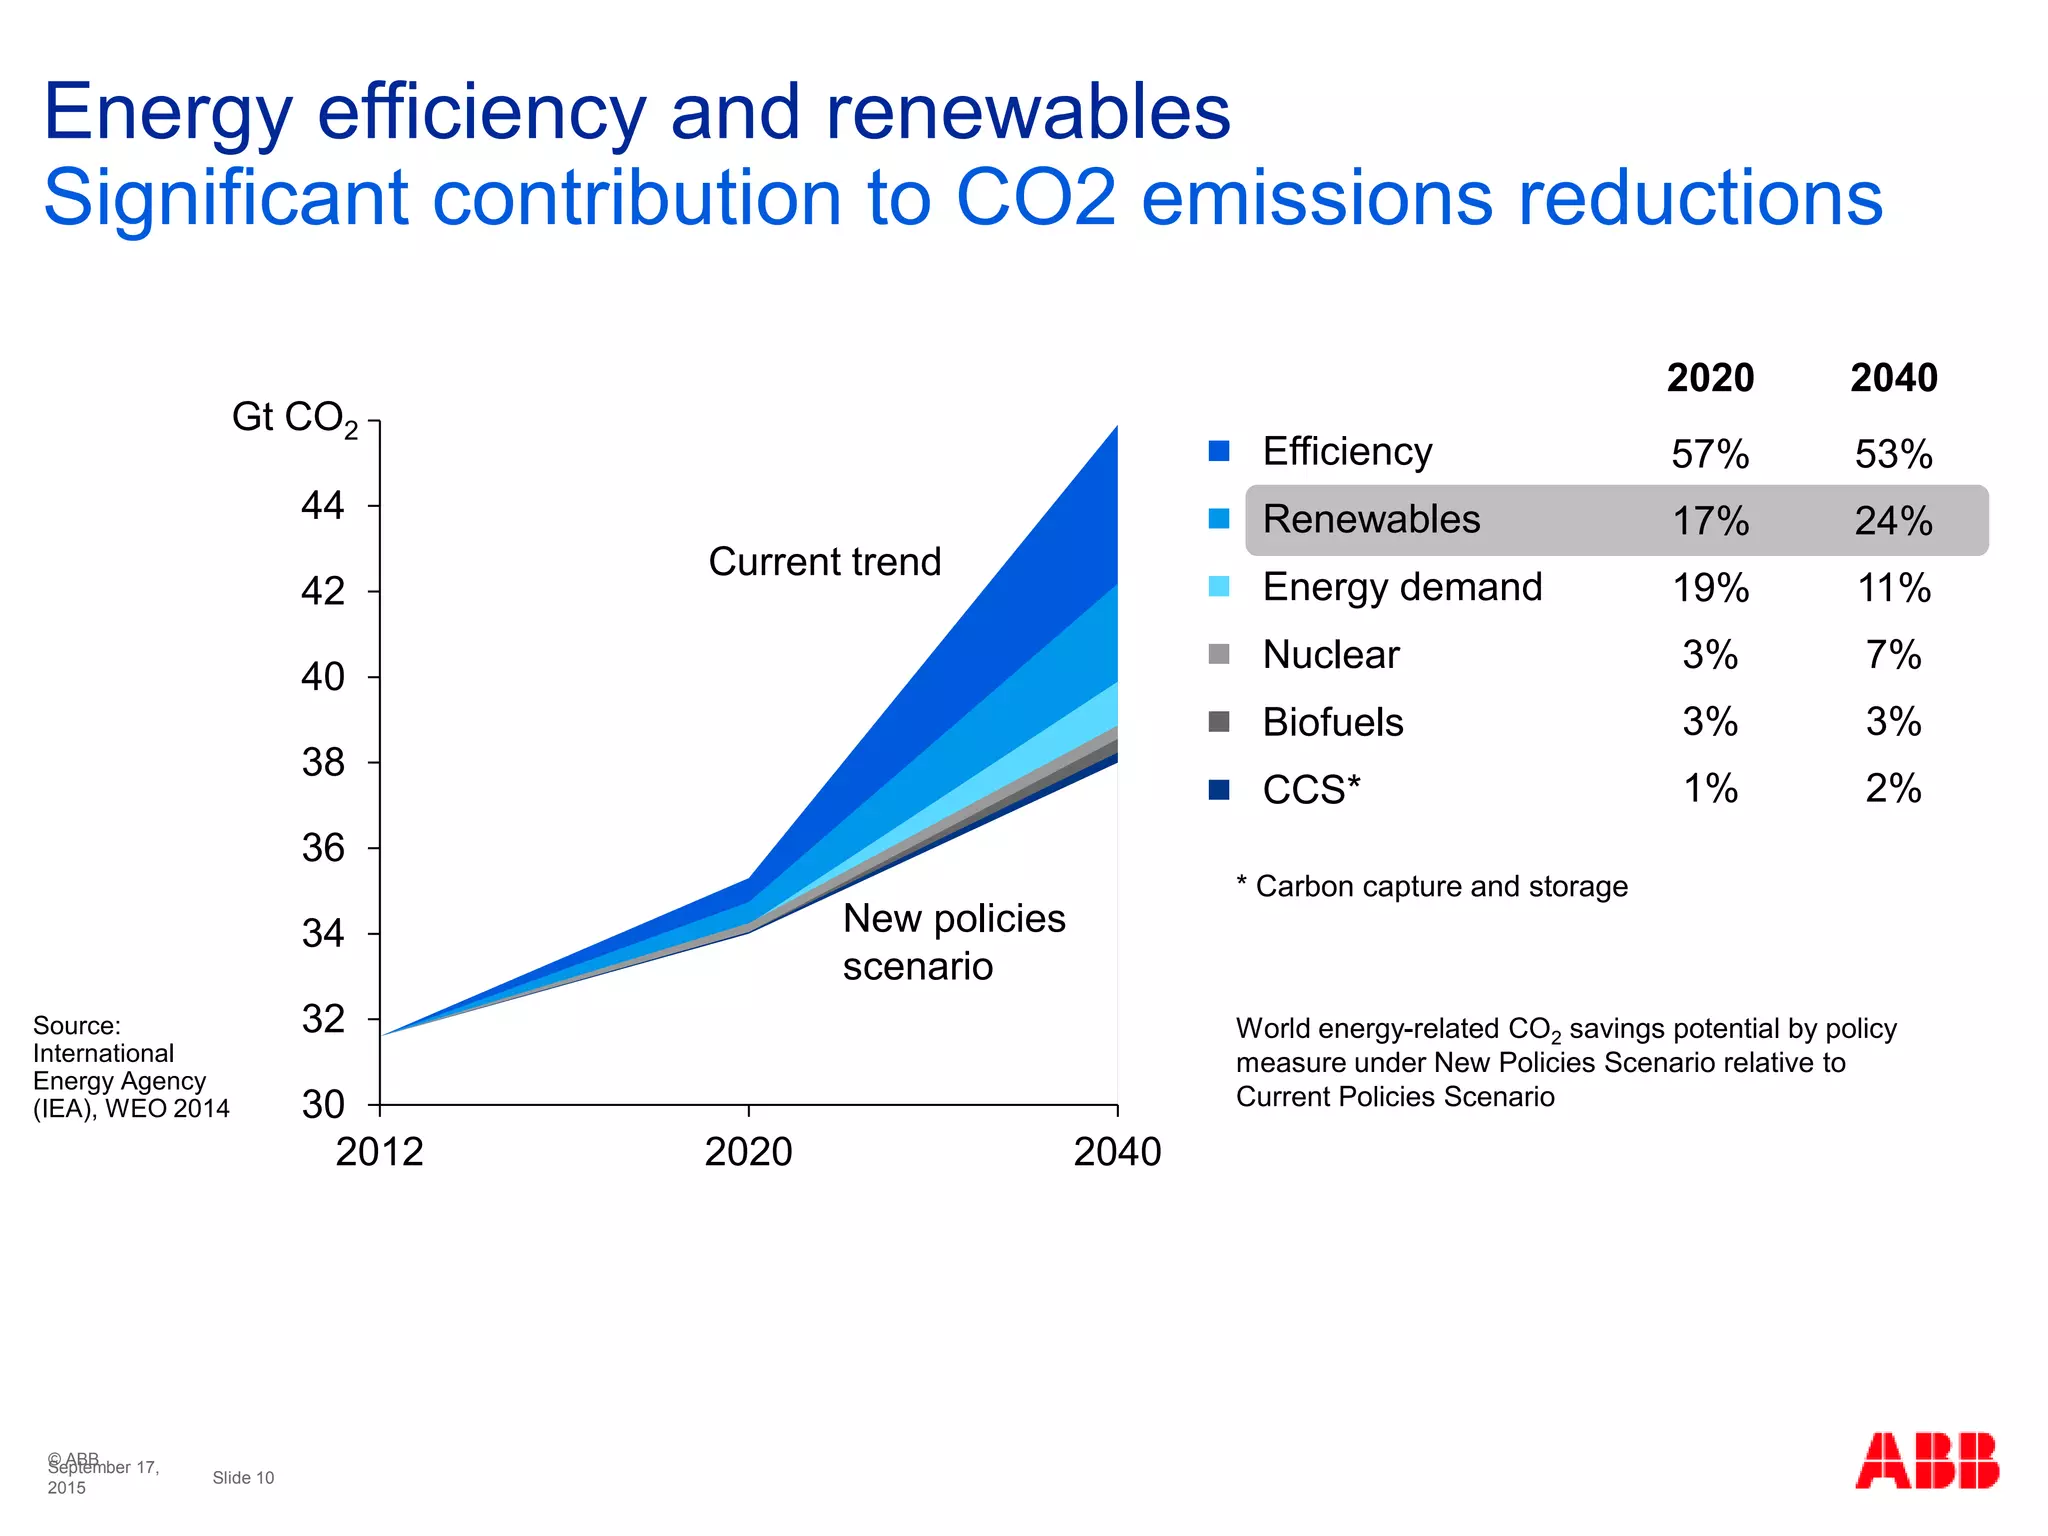
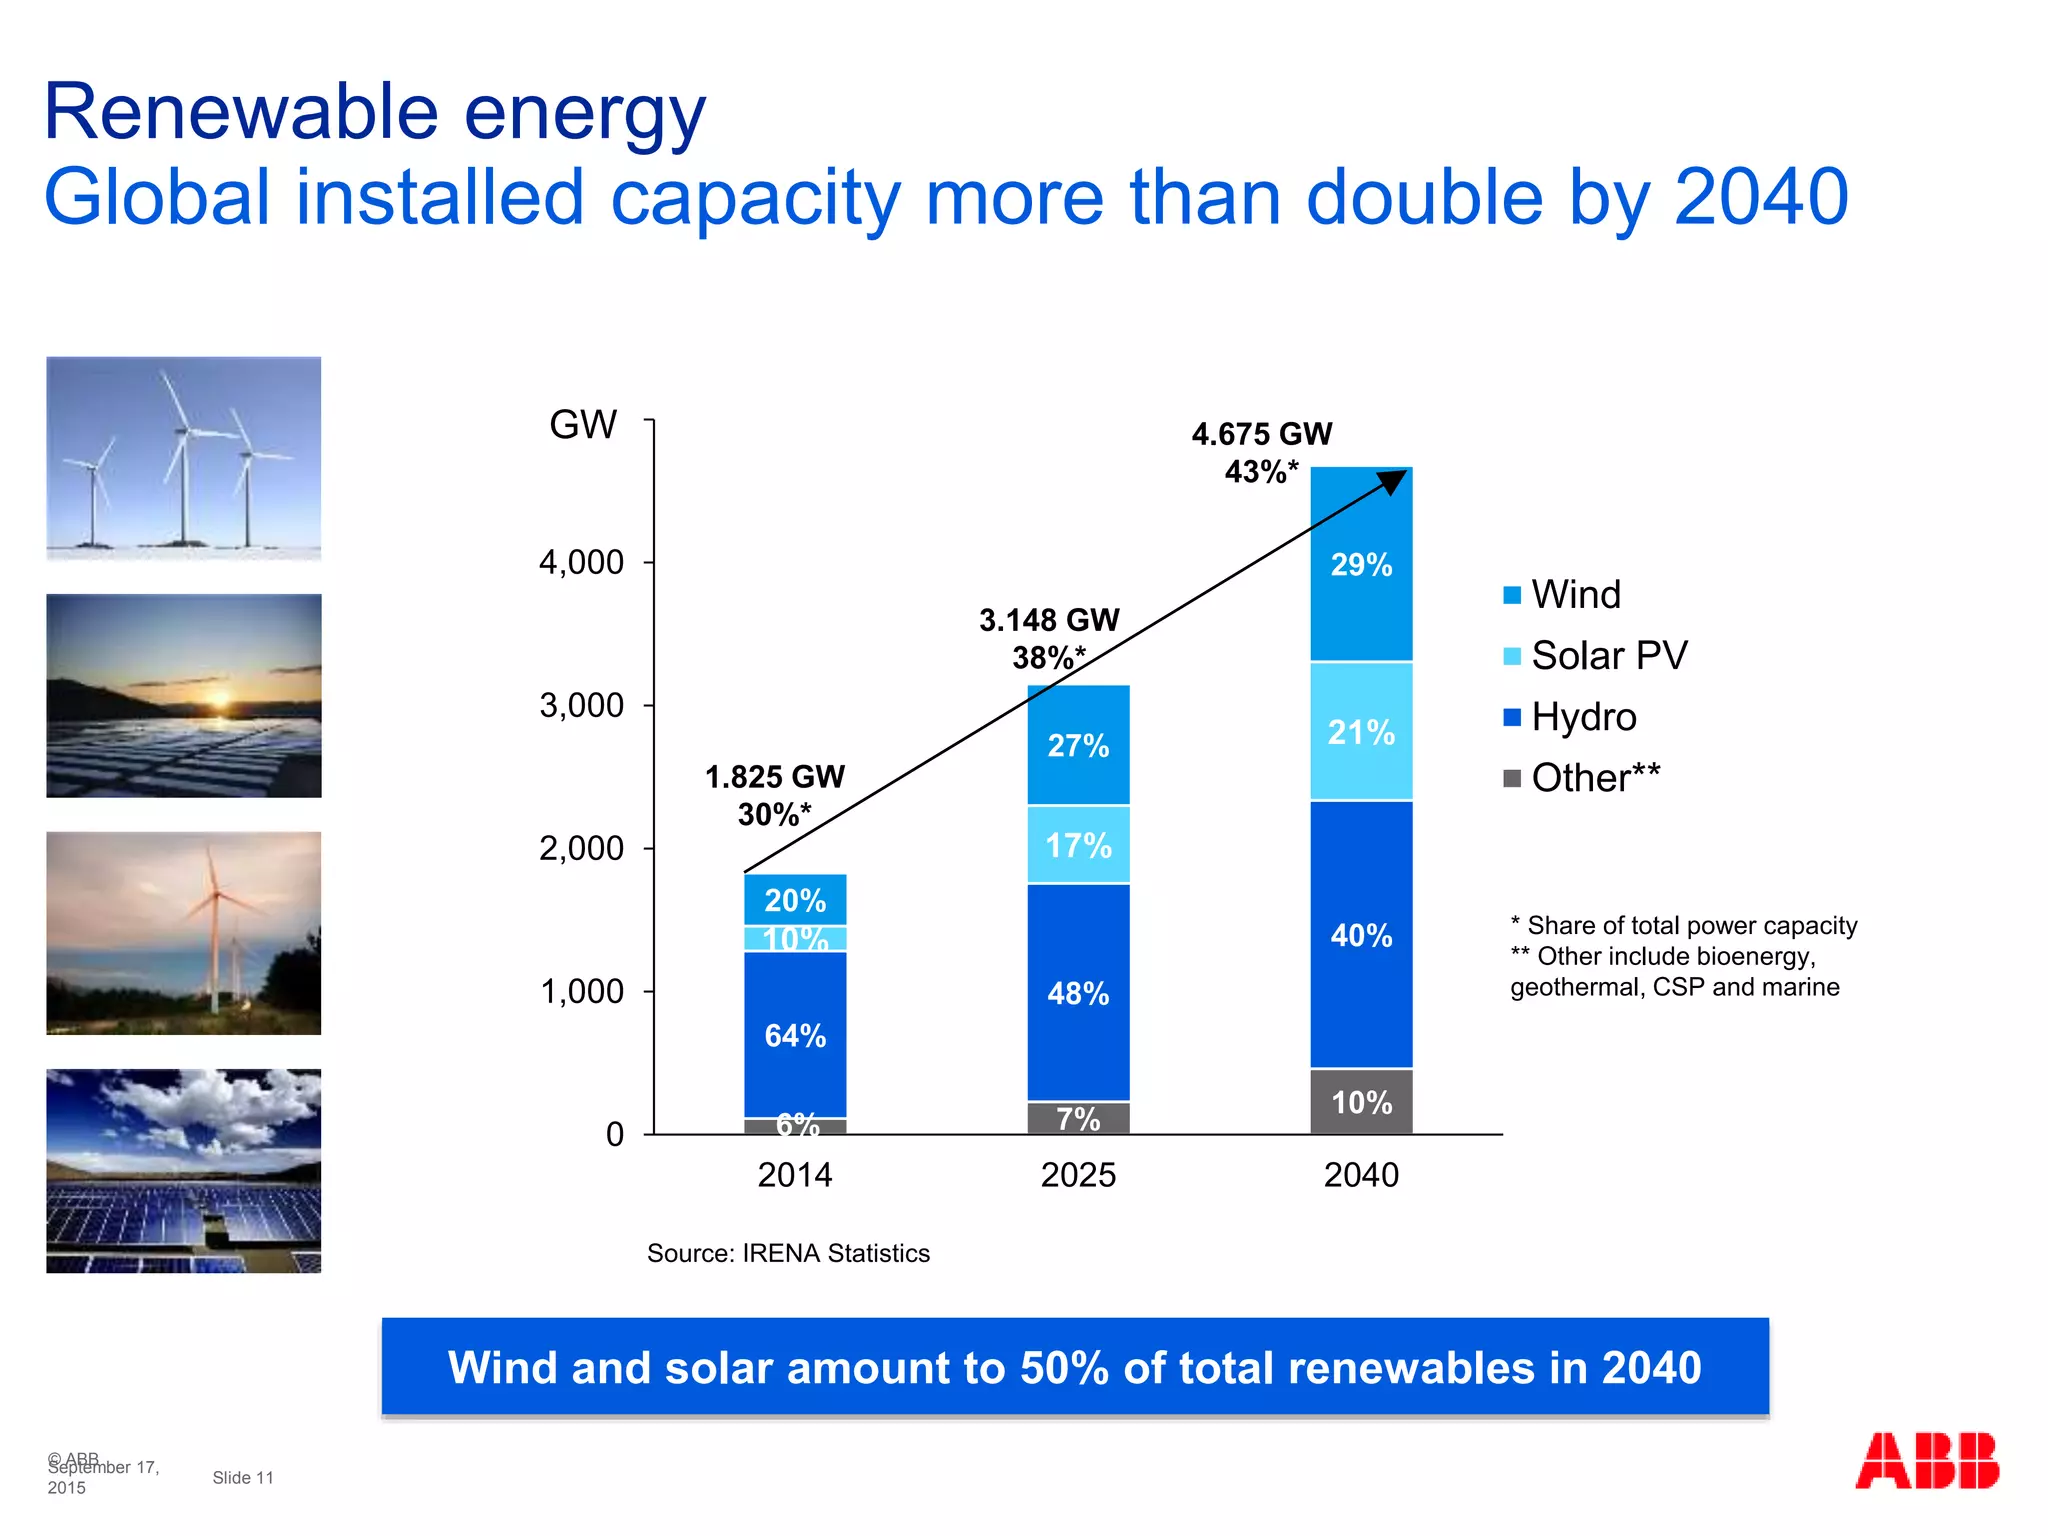
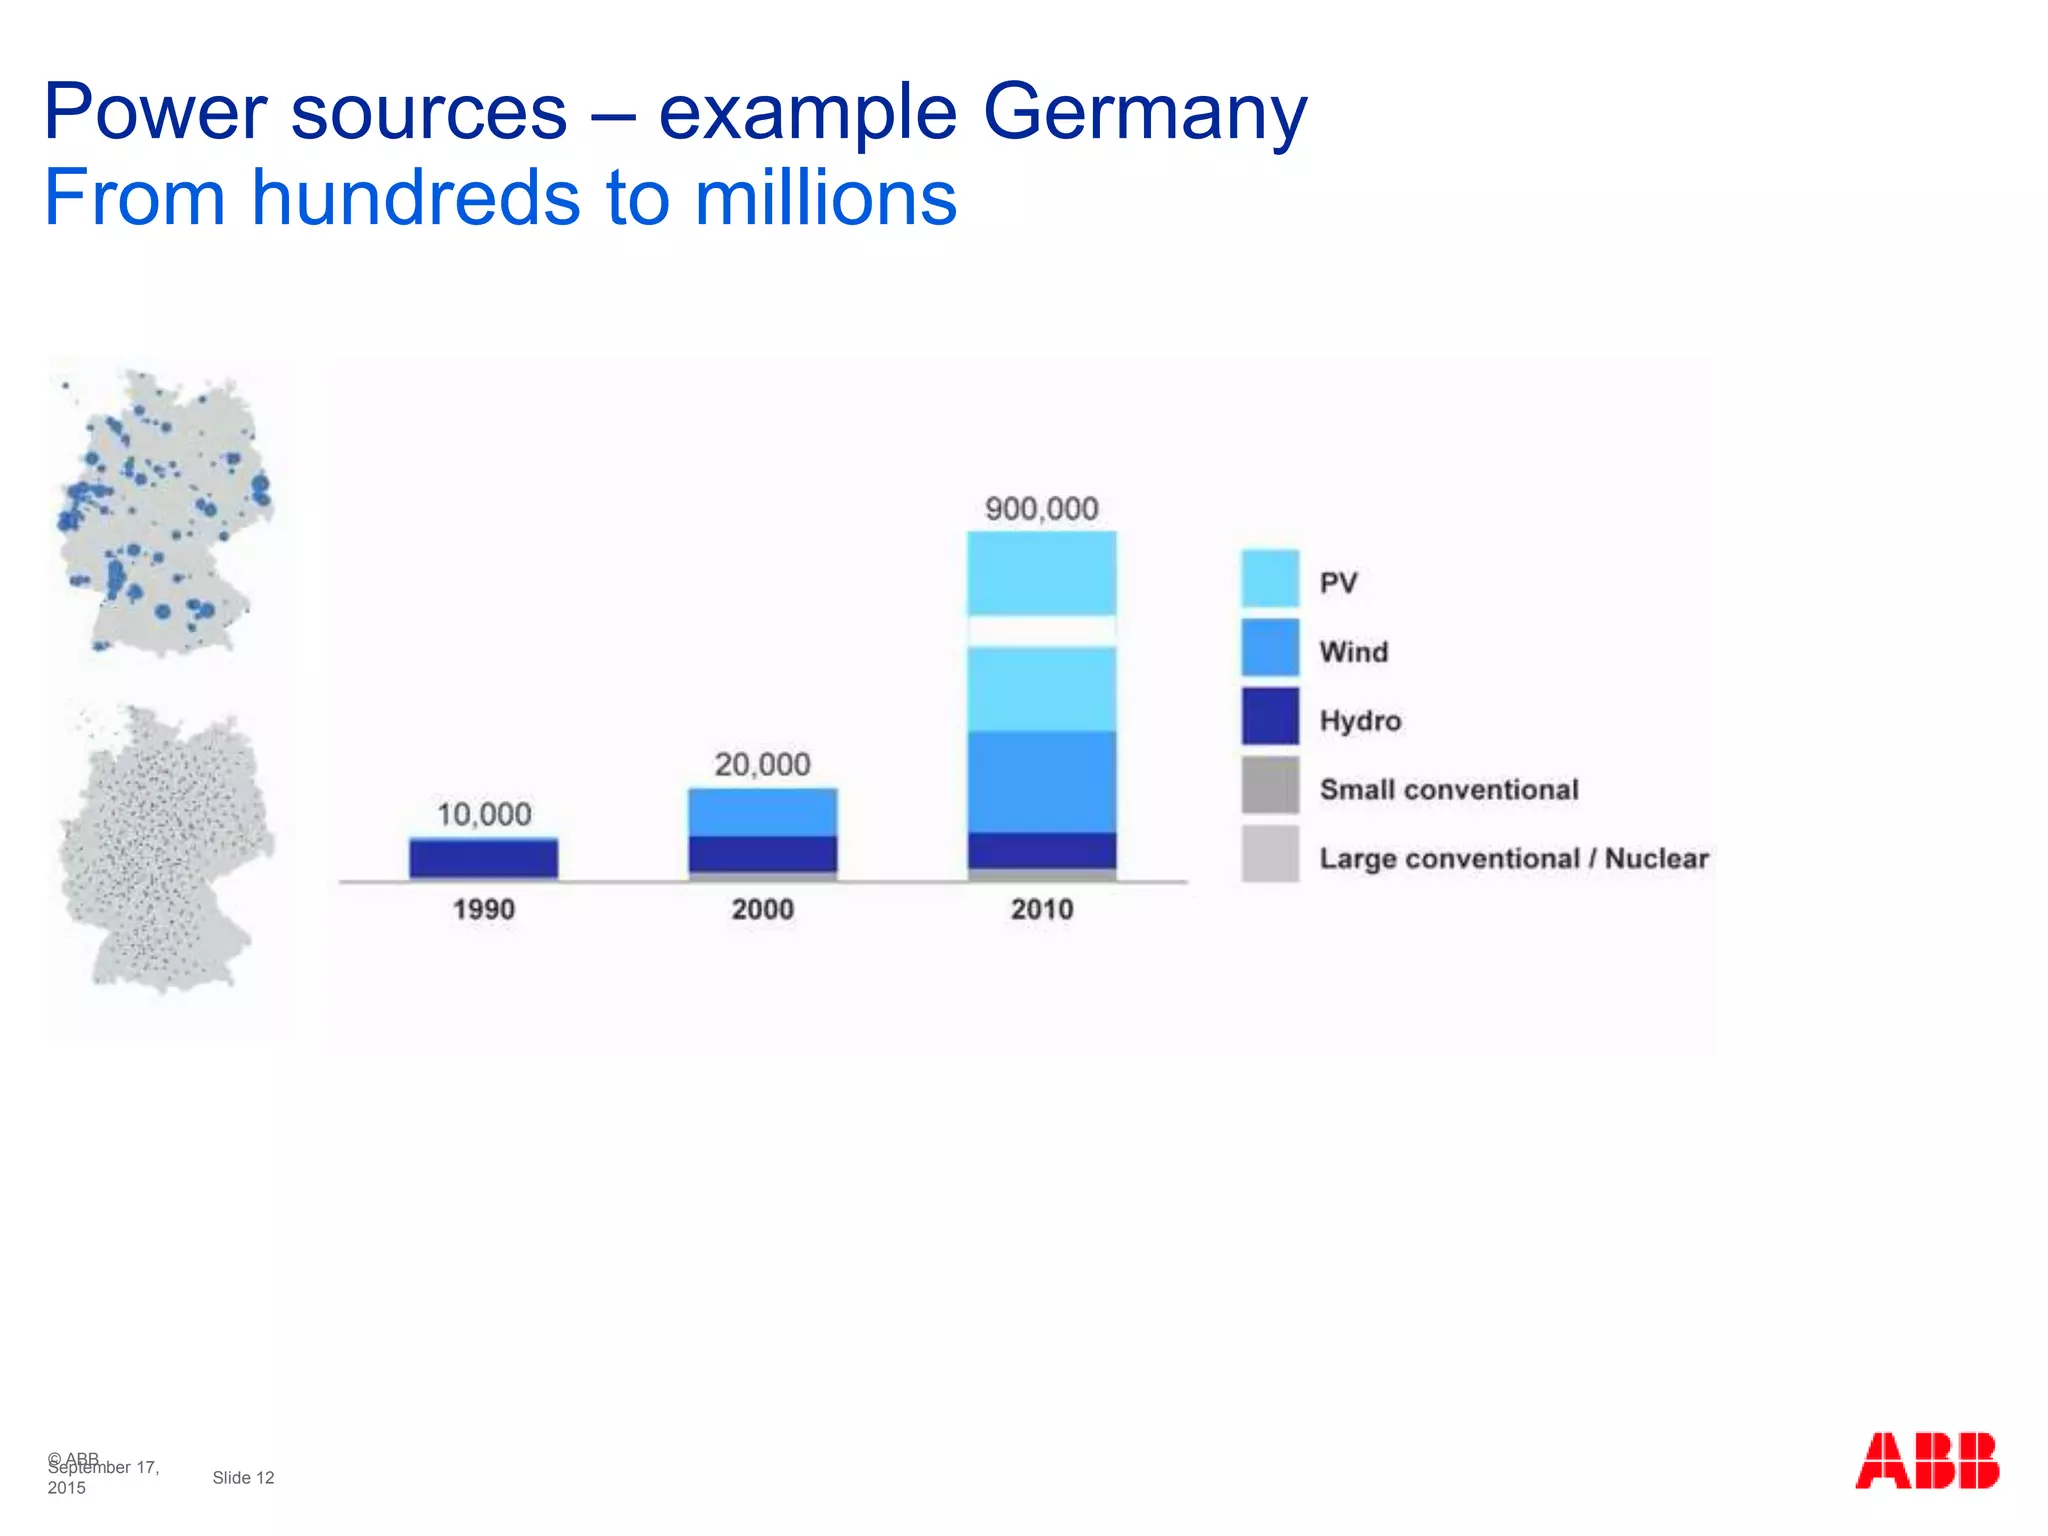
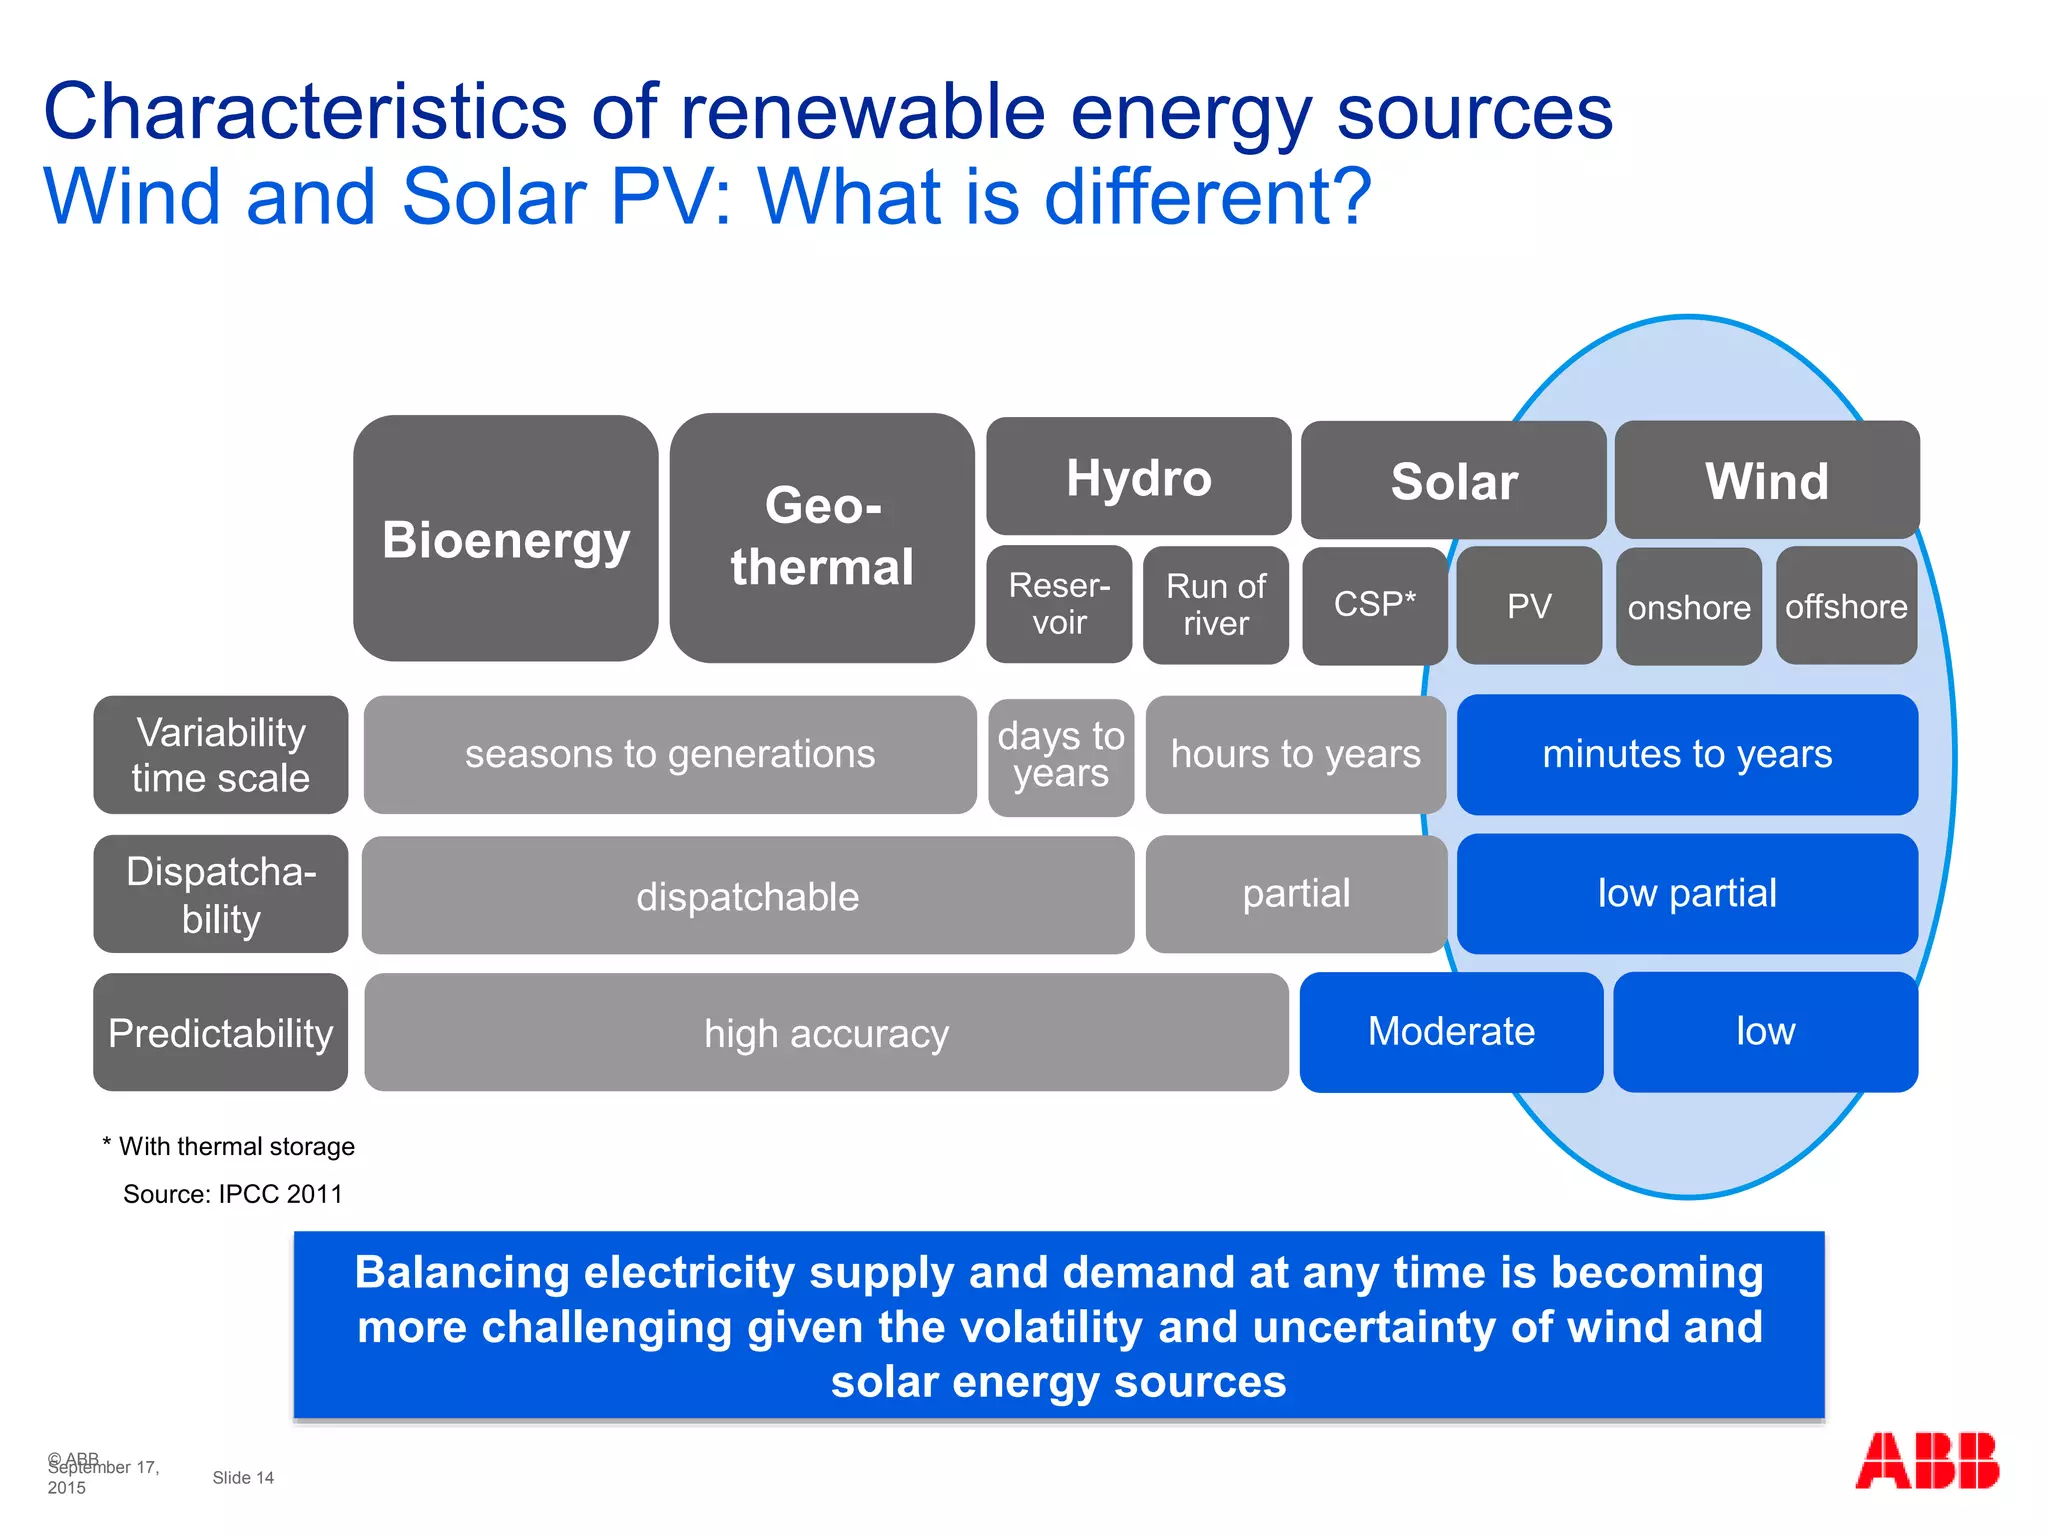
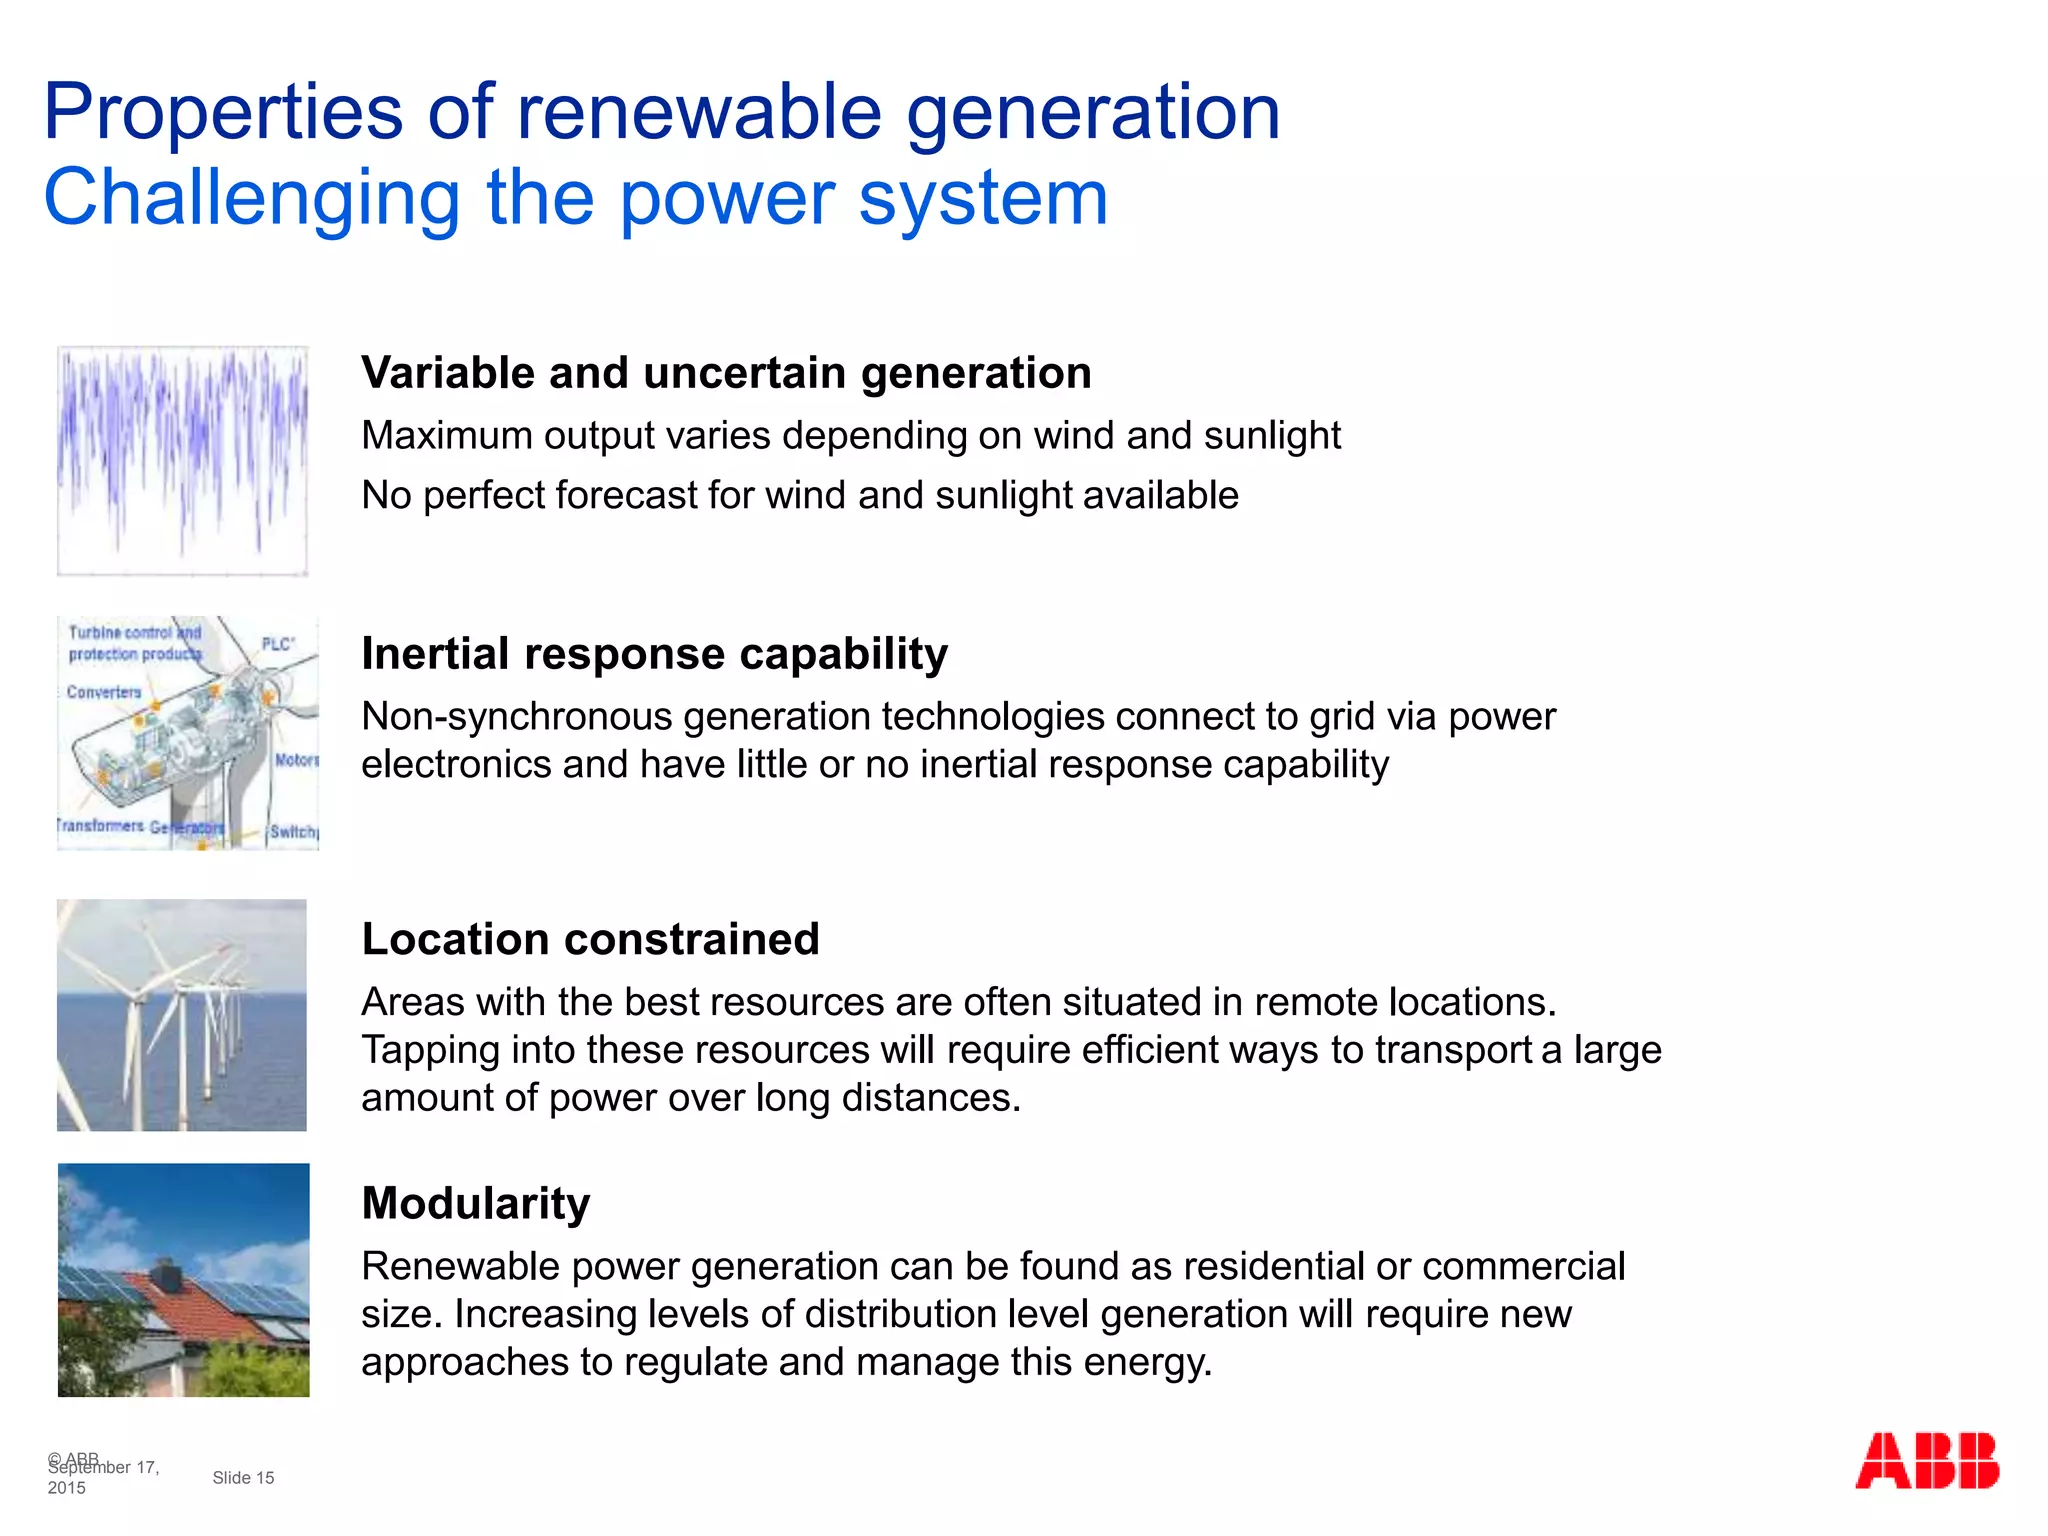
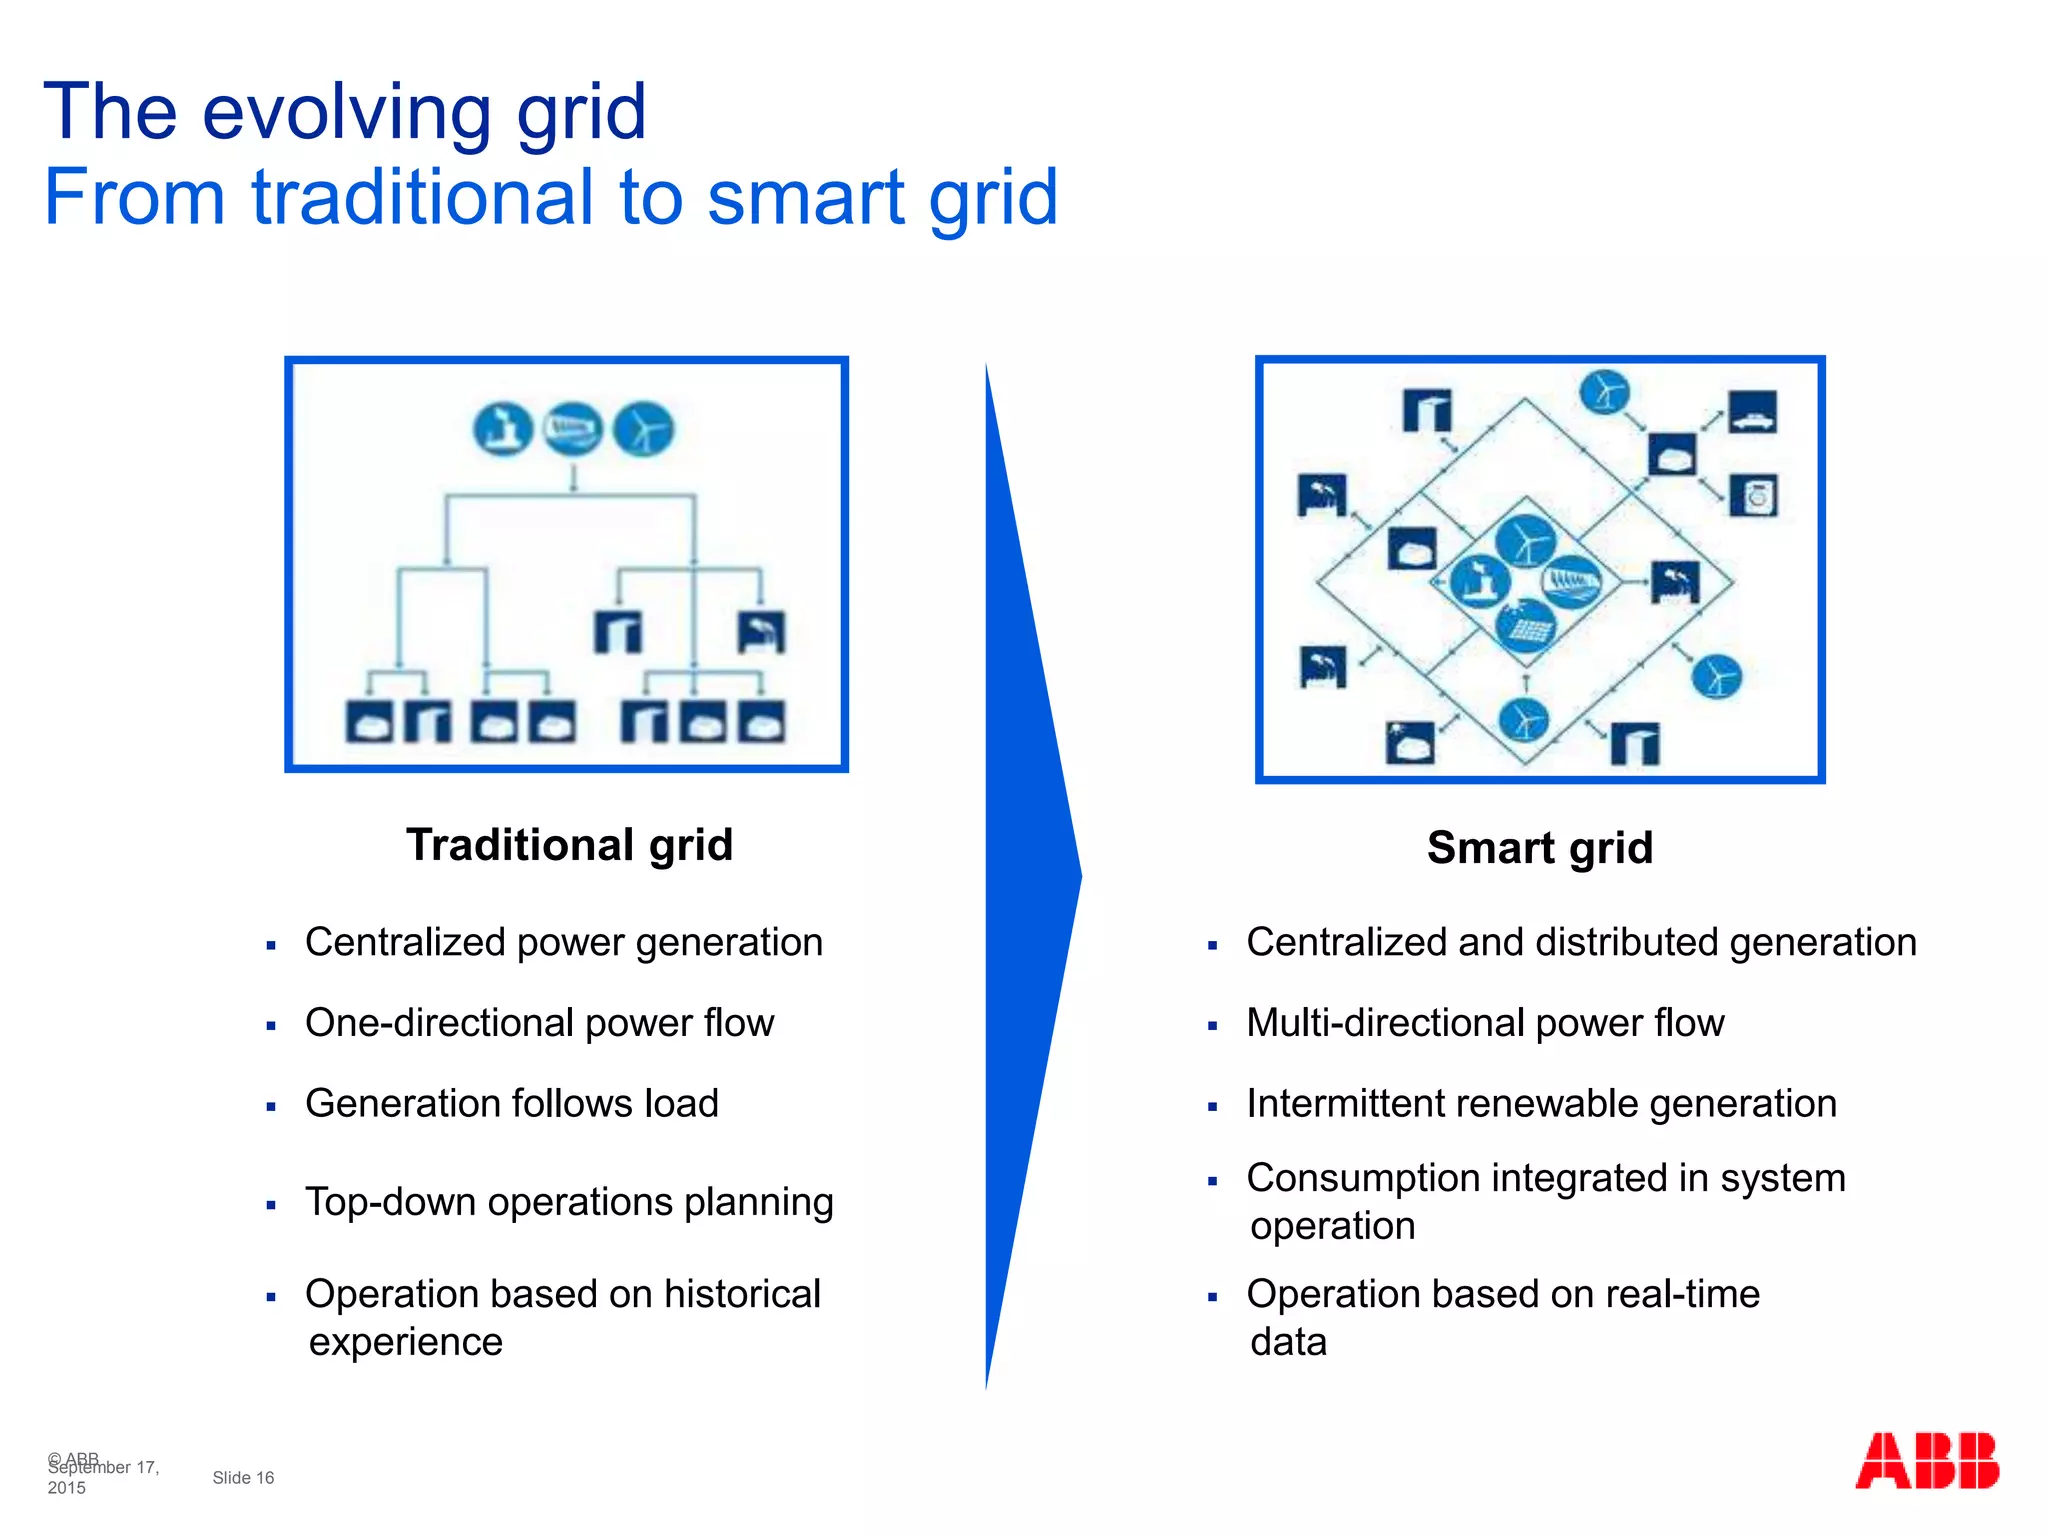
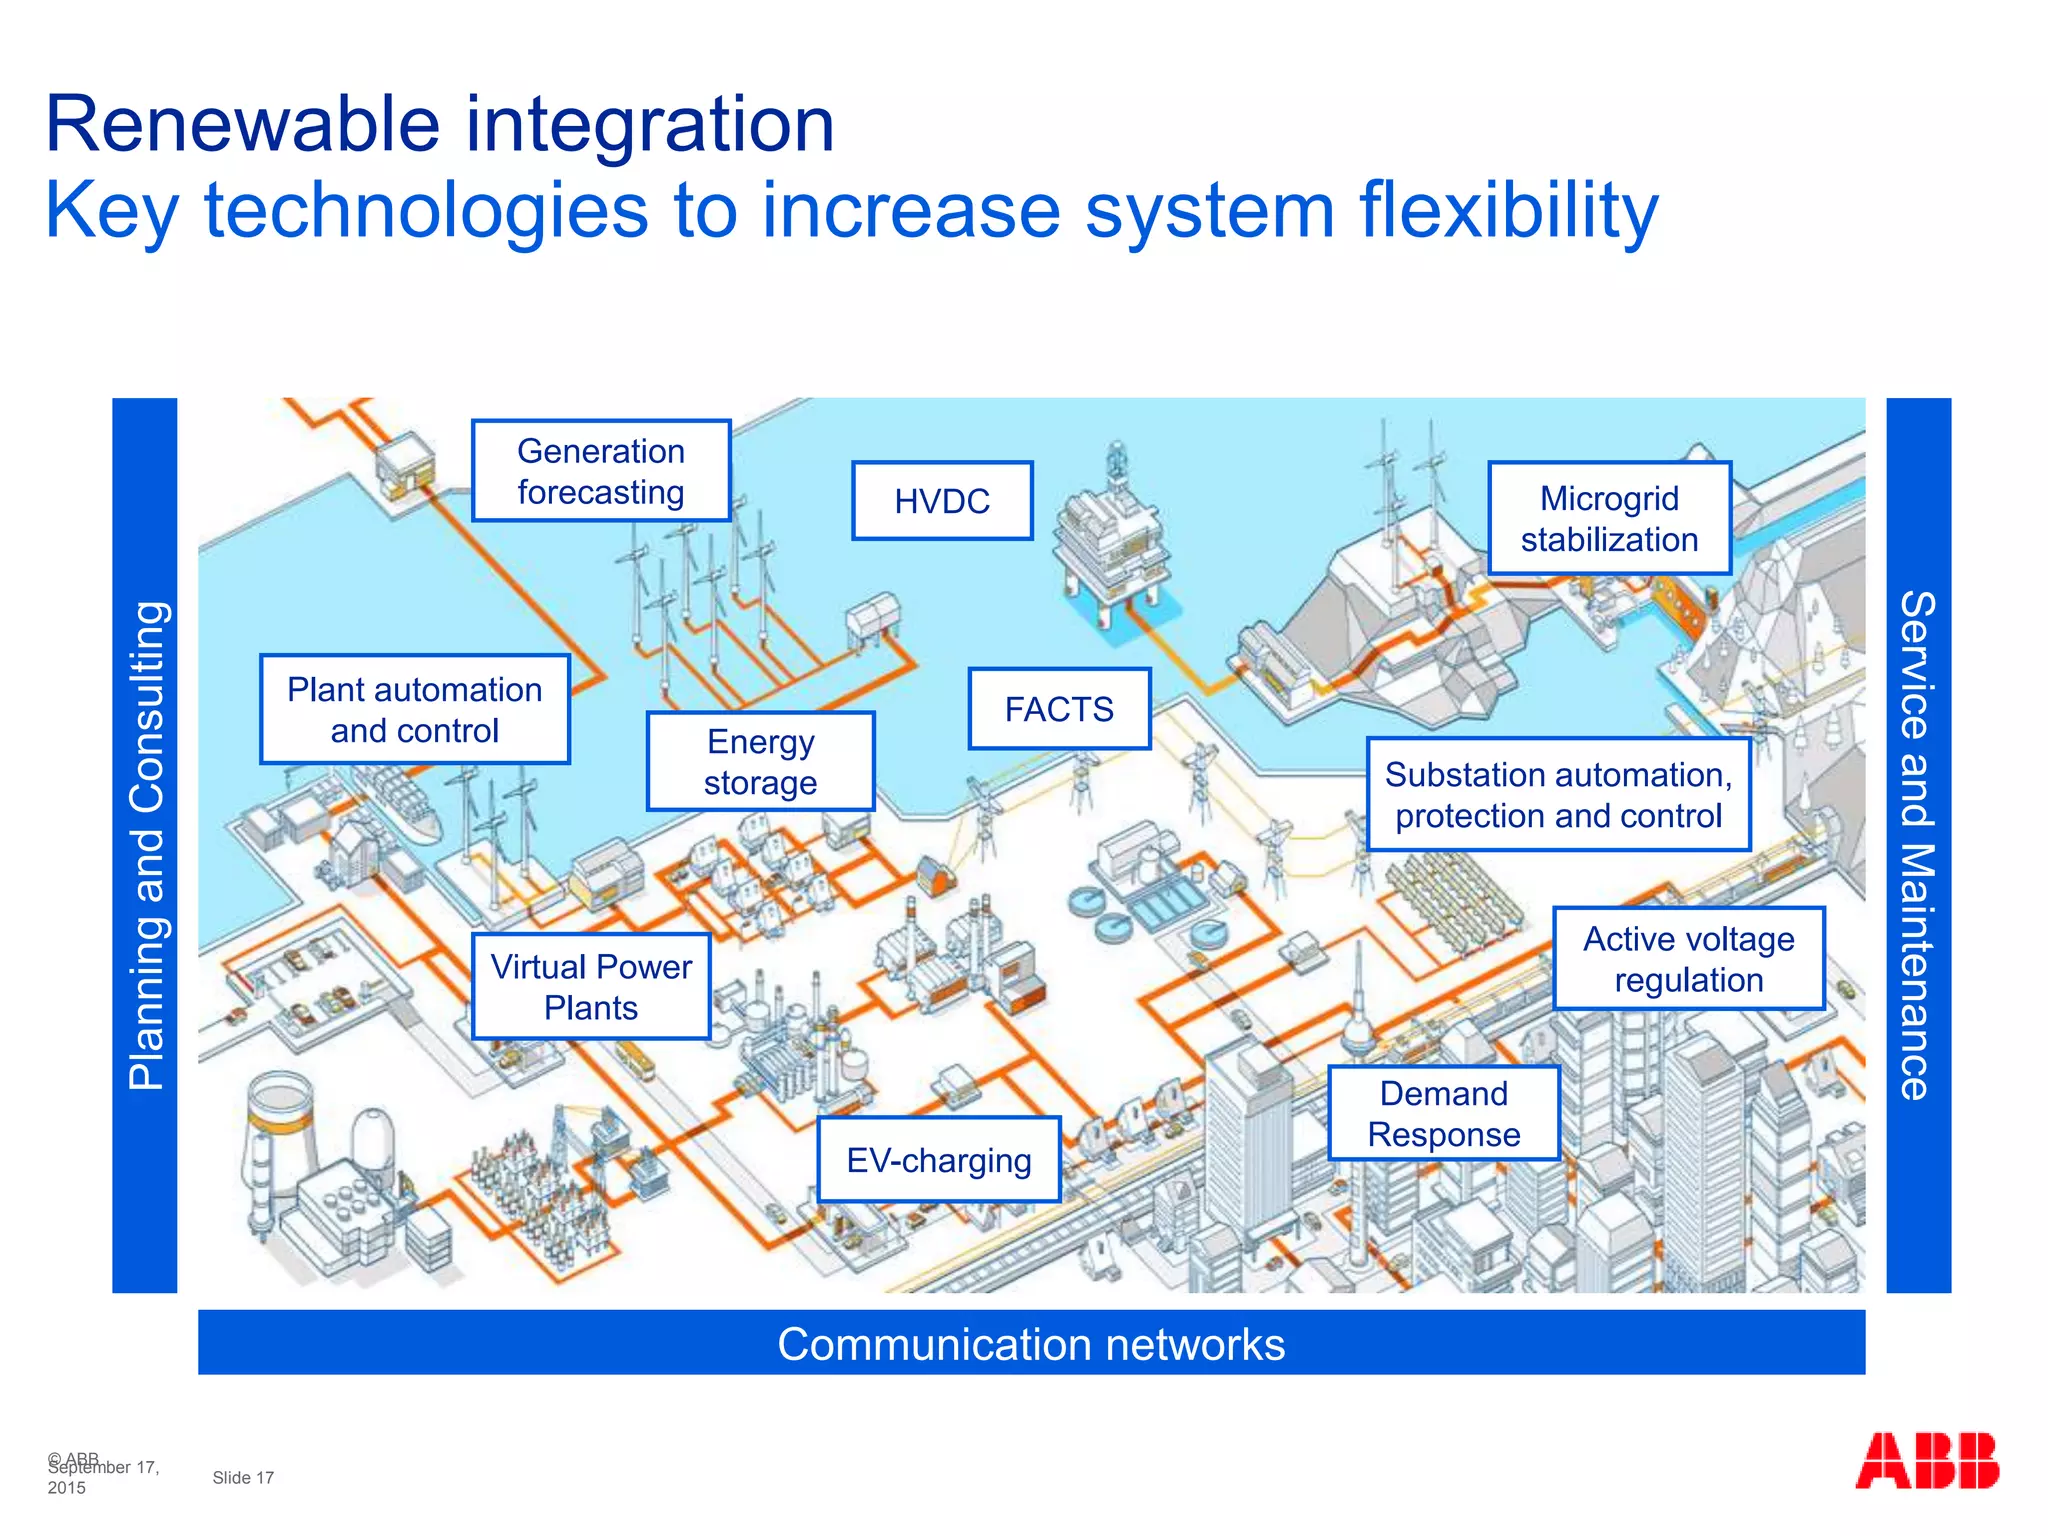
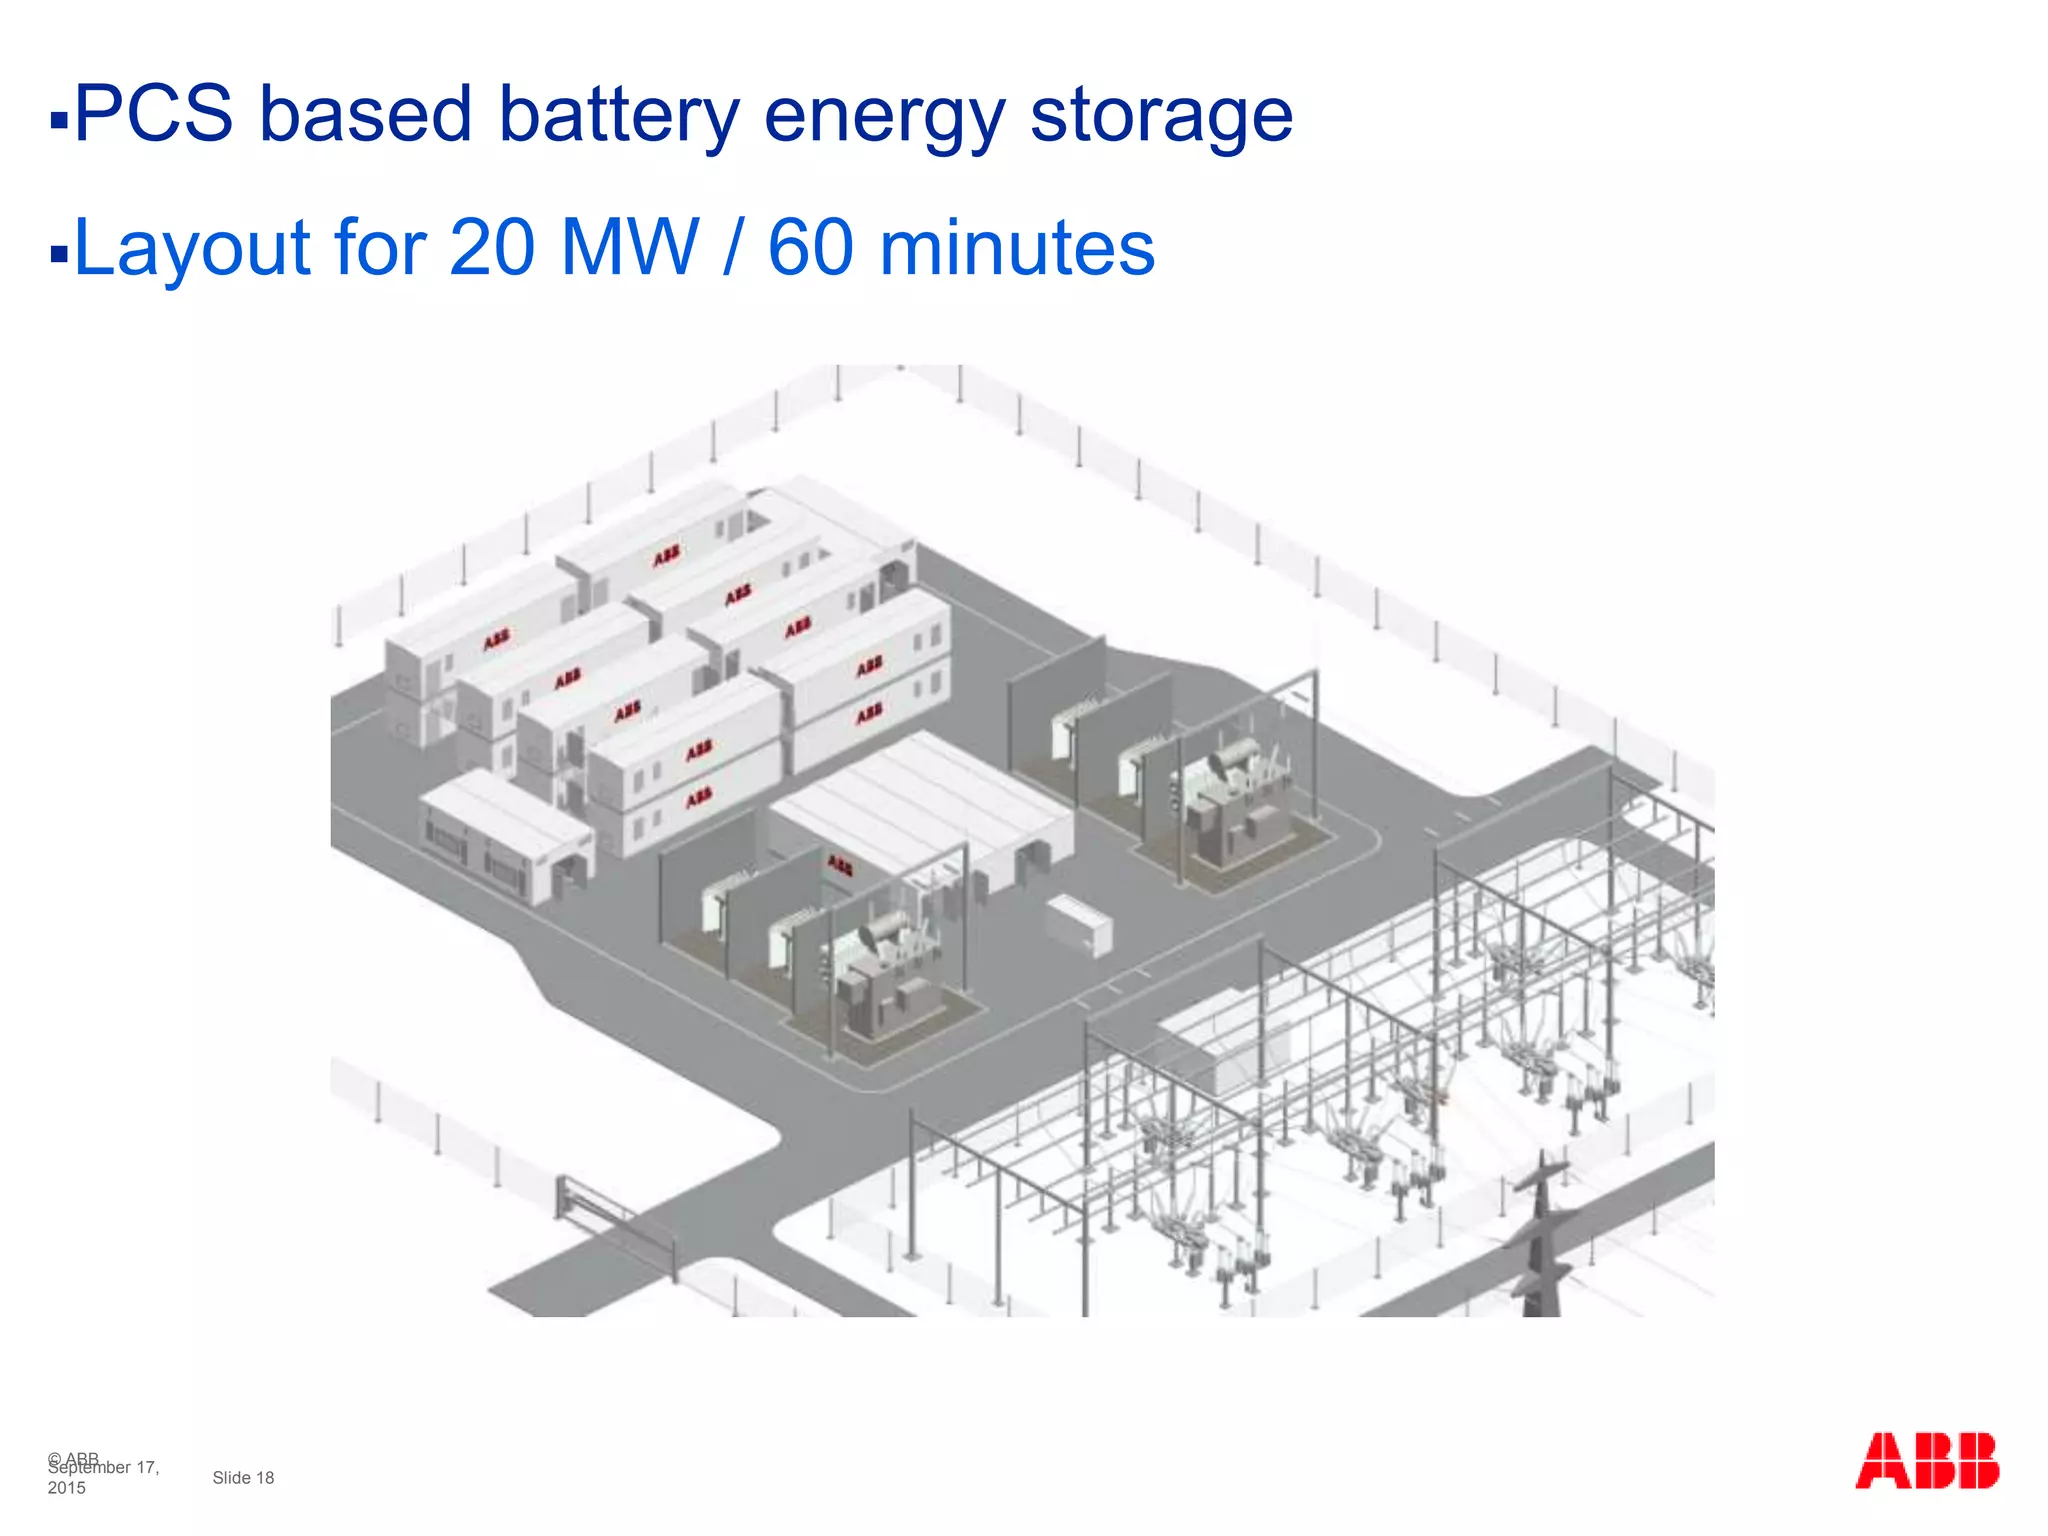
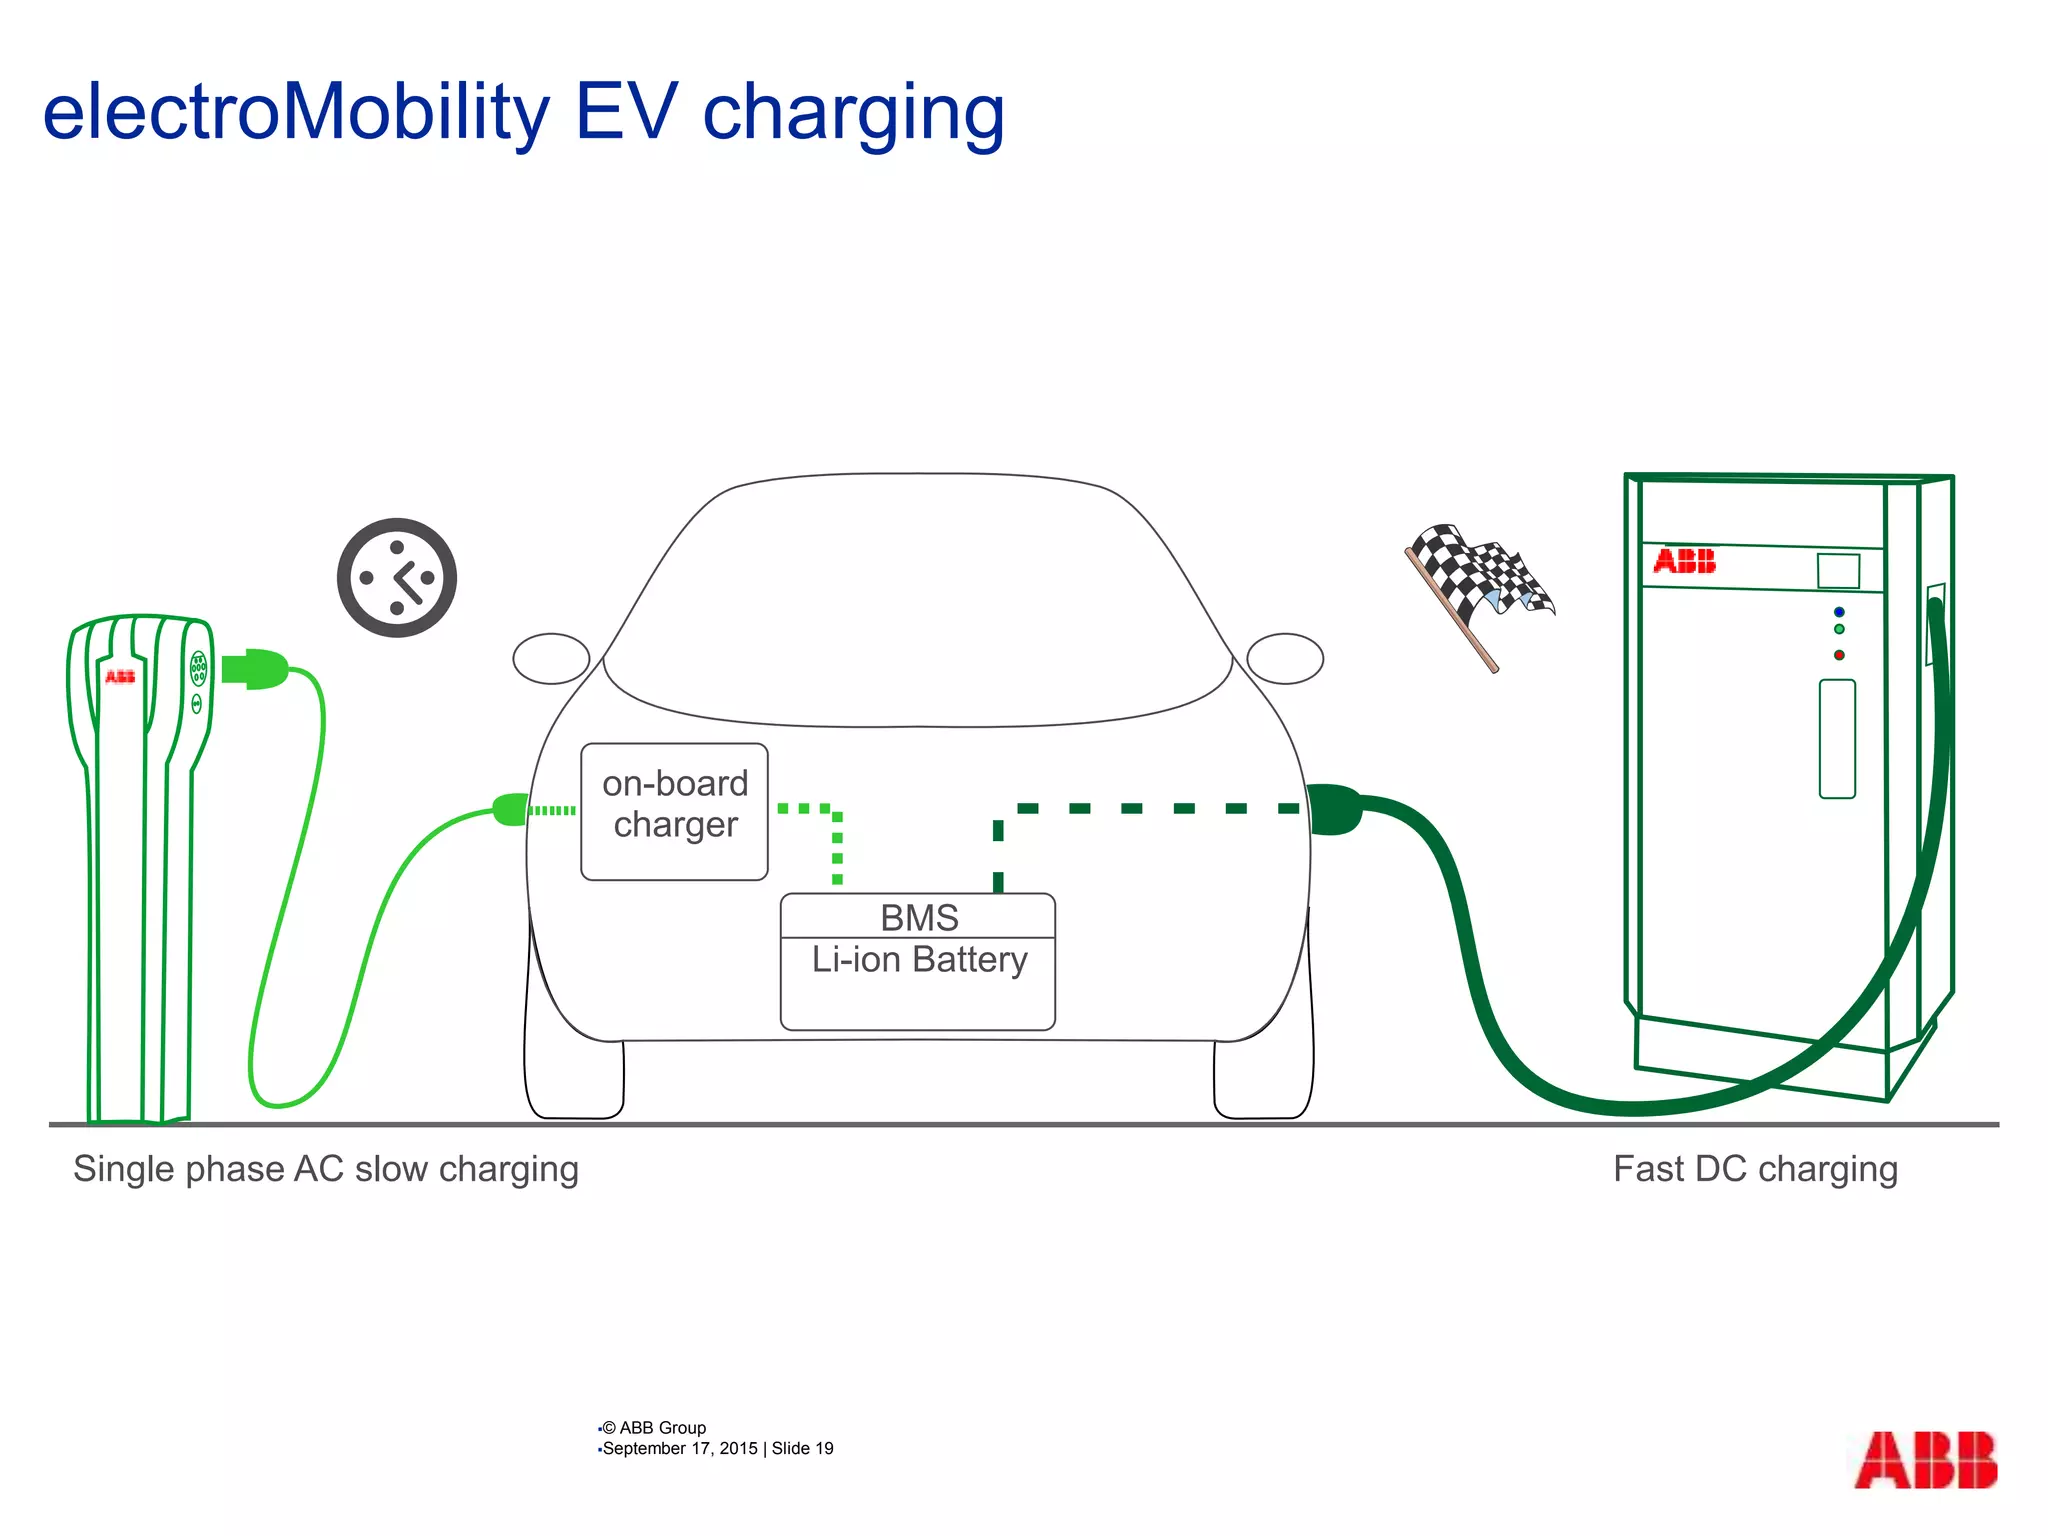
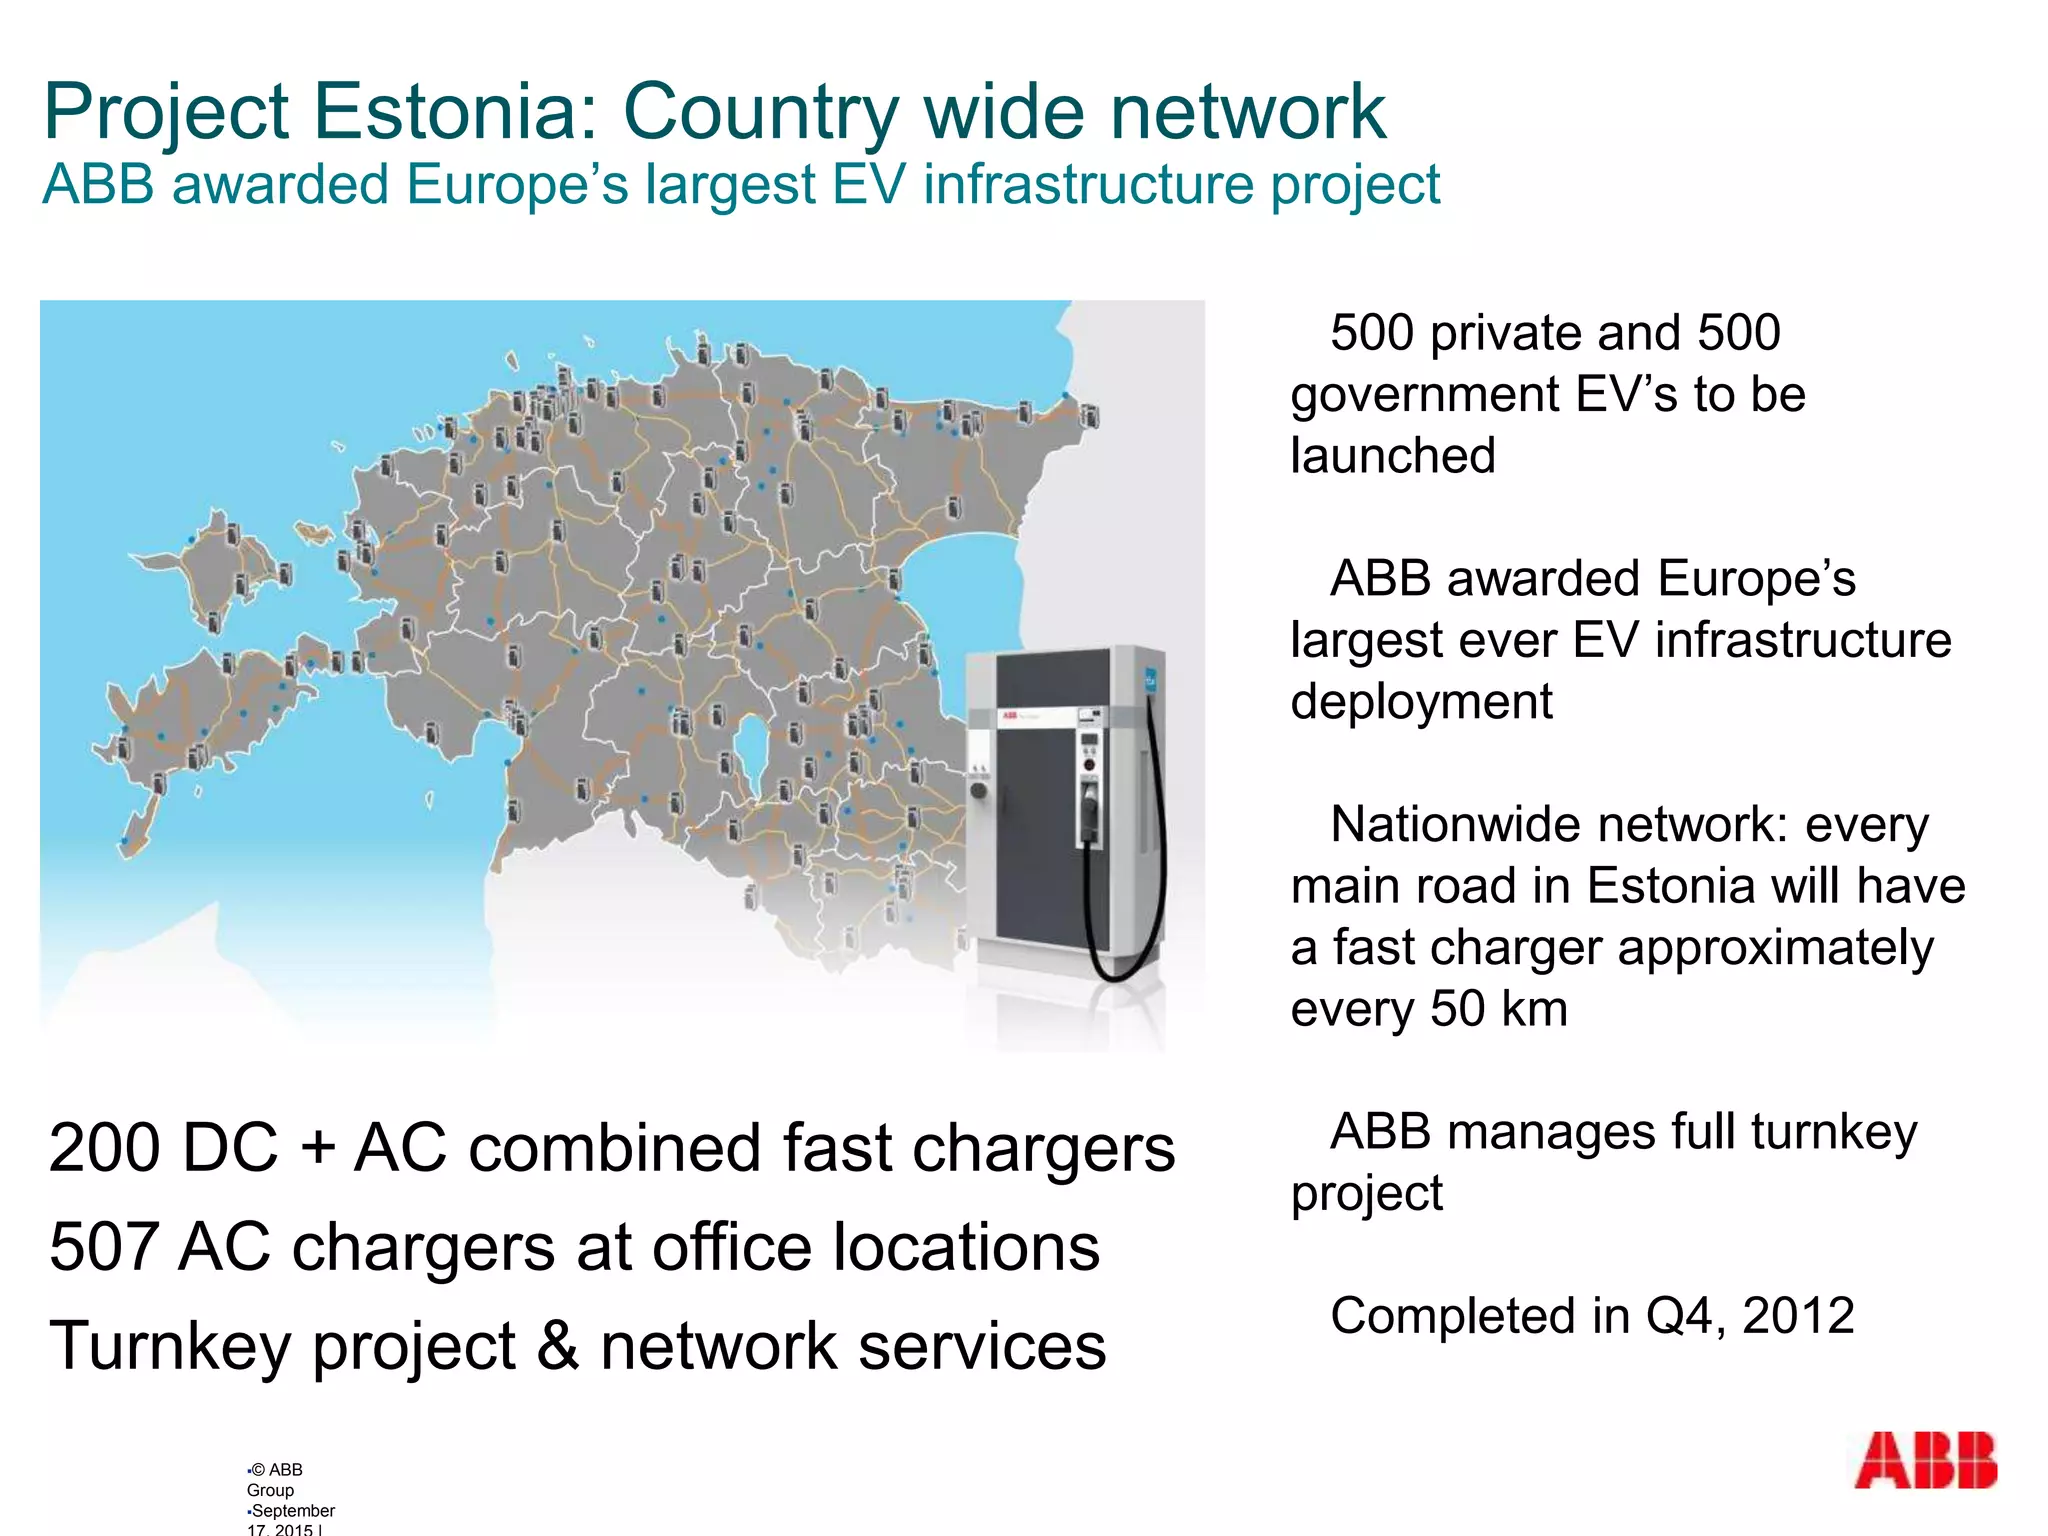
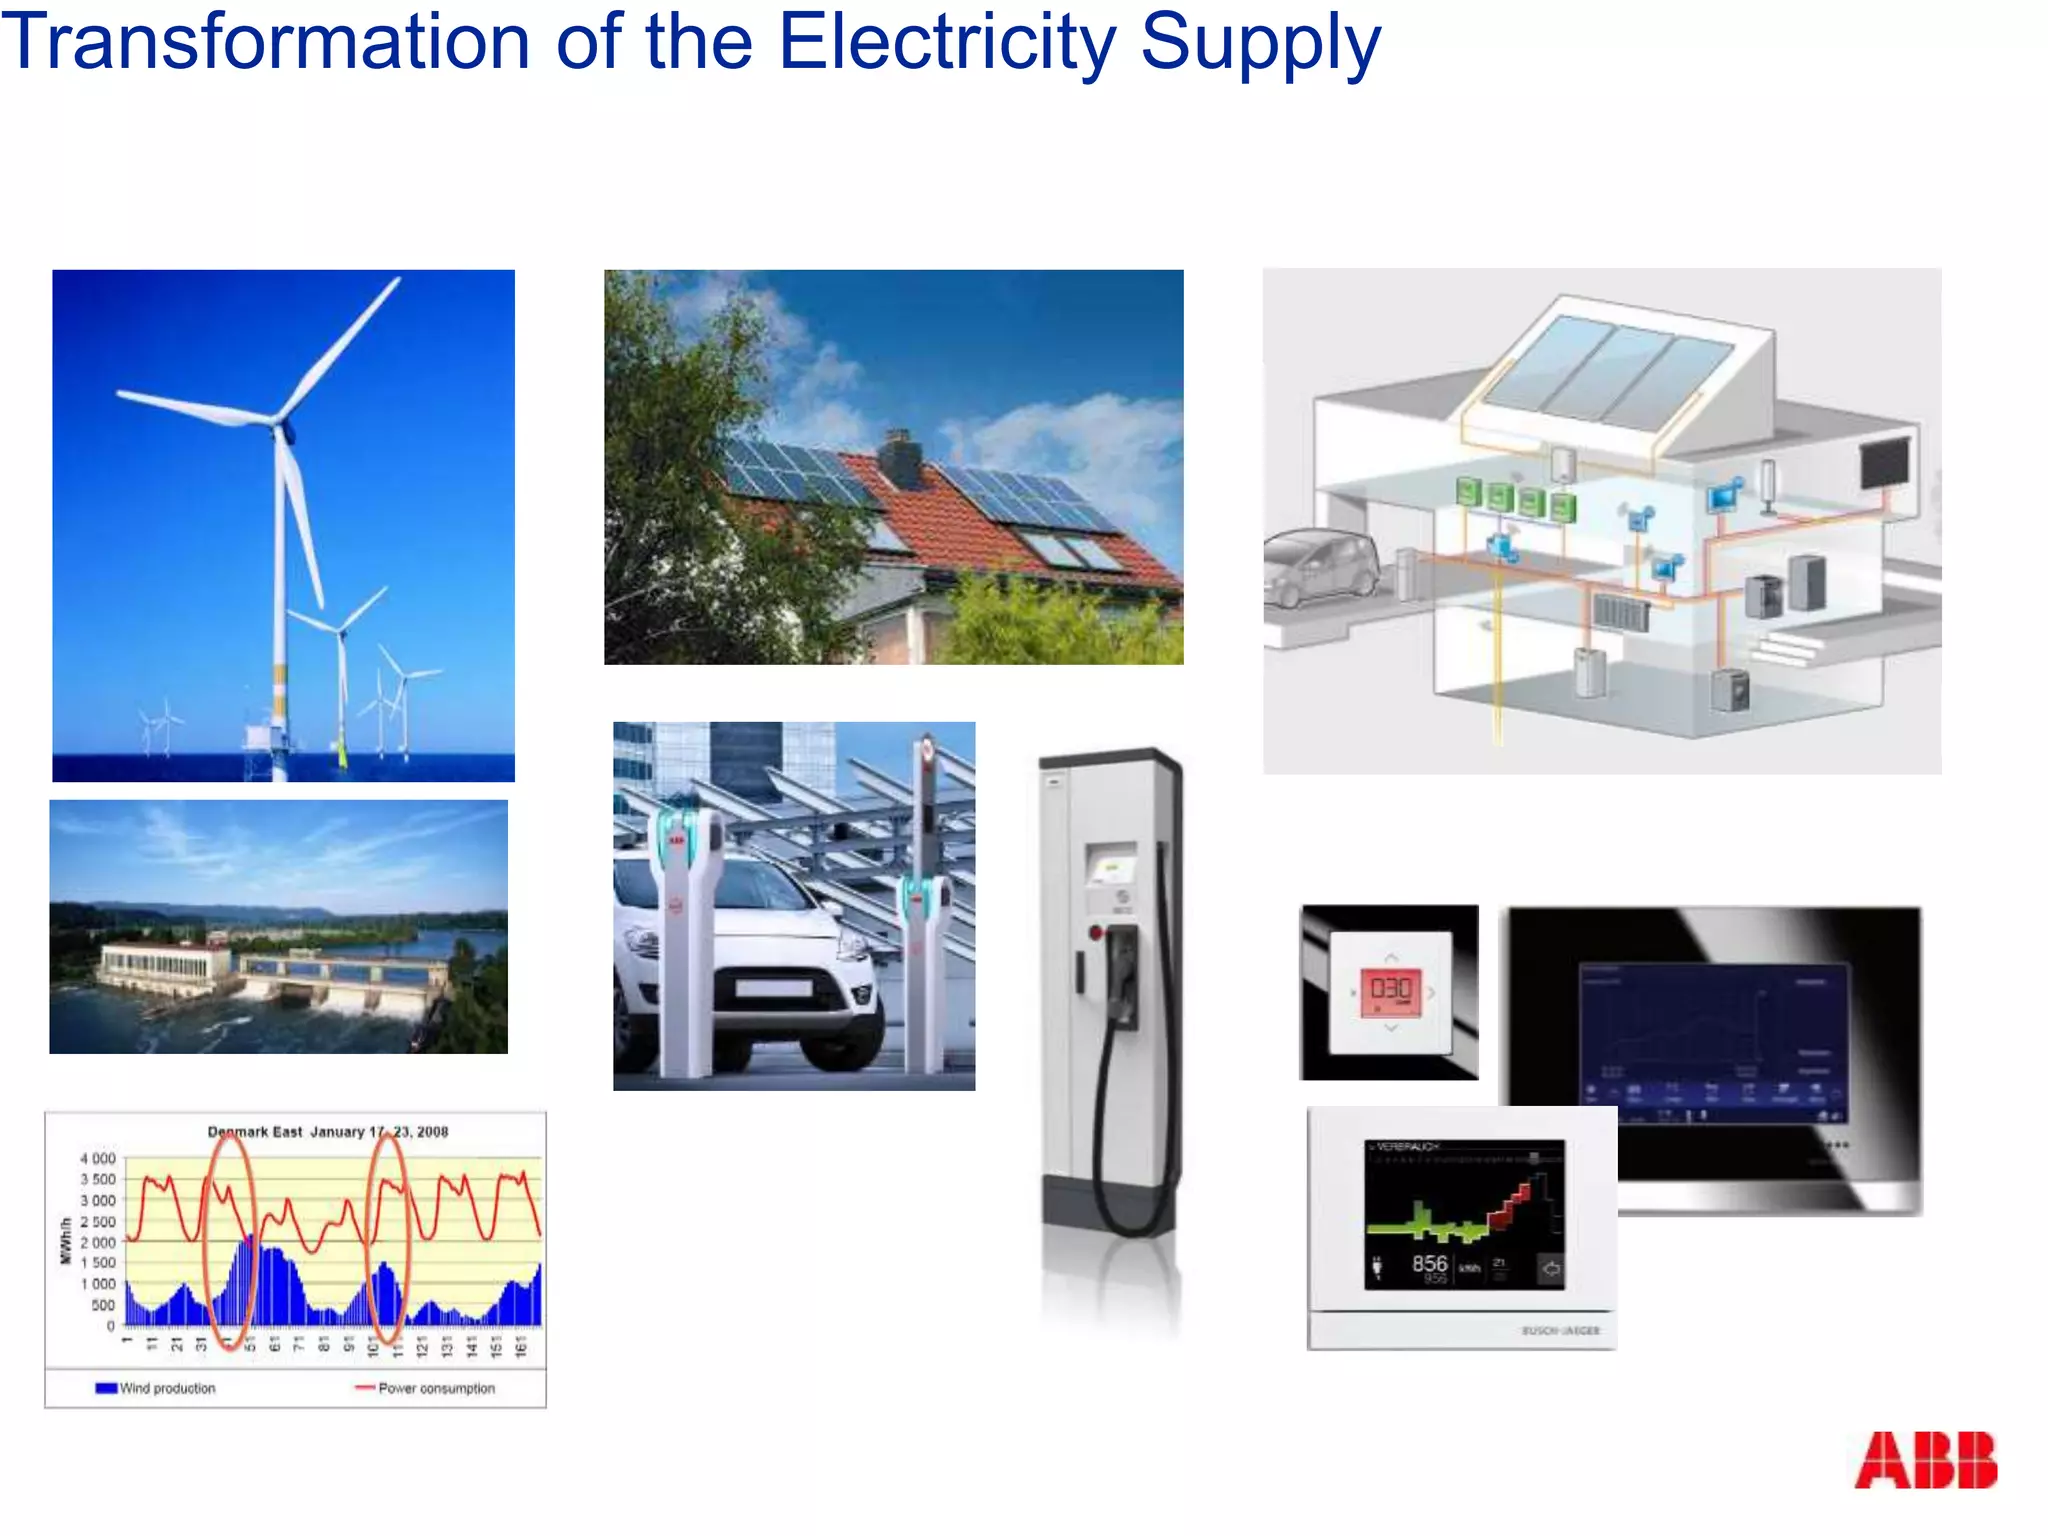
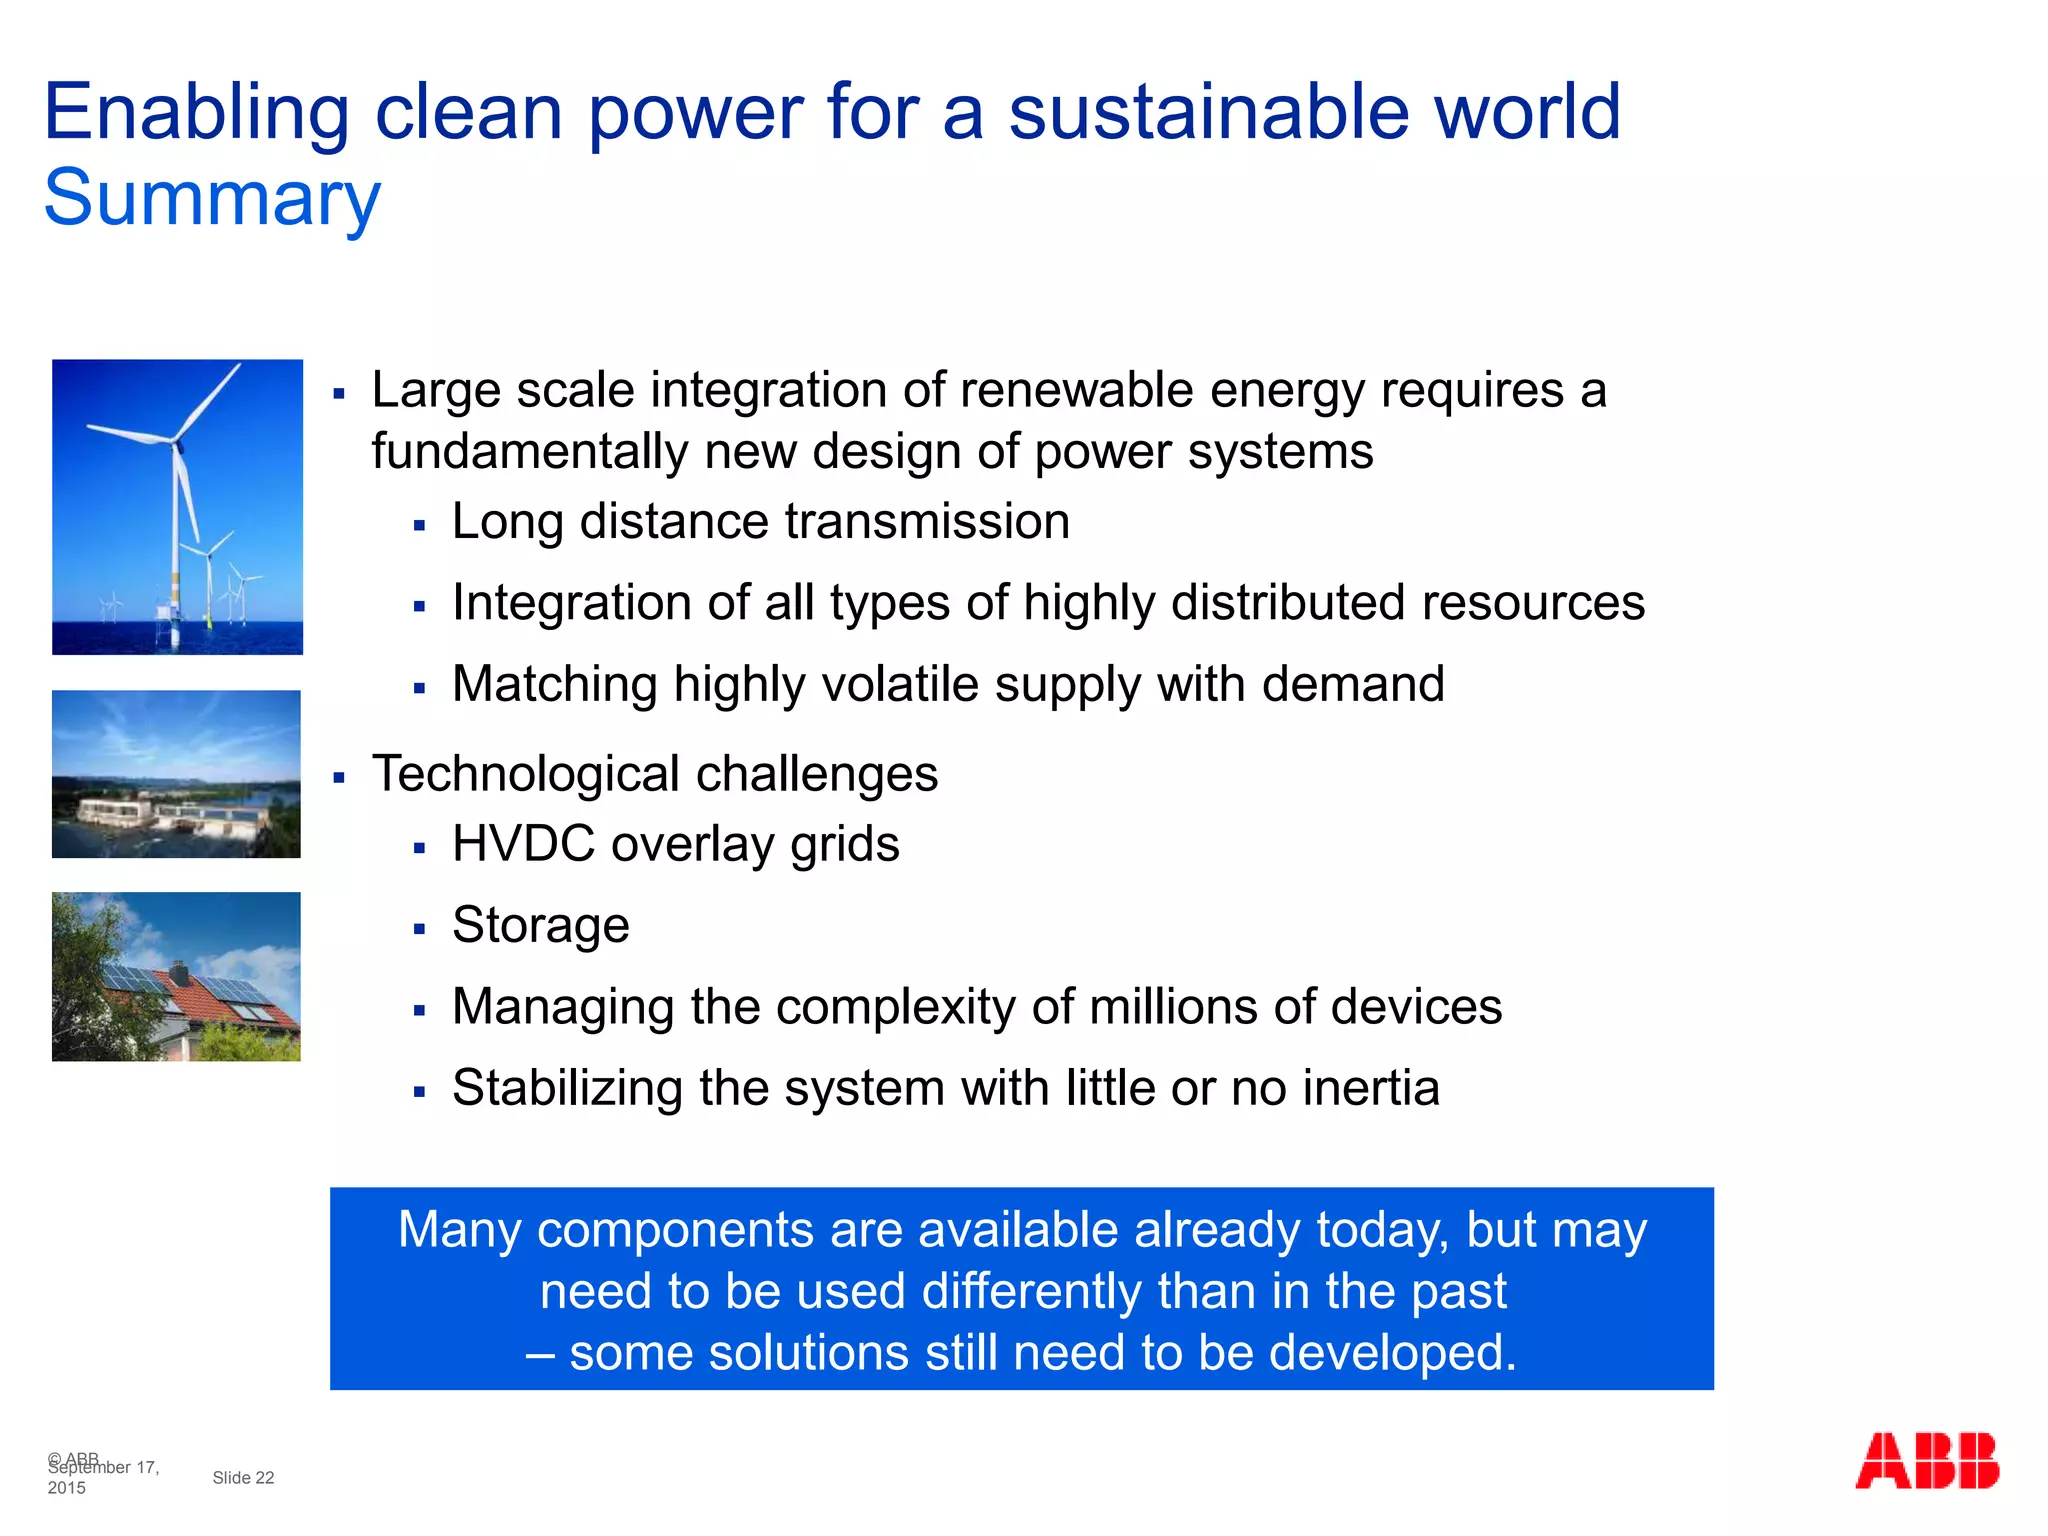
© ABB
Slide 1
September 17,
2015
Smart Grids
Energiaseminaari, Helsingin Insinöörit
Matti Vaattovaara 26.9.2015
© ABB
Tackling society’s challenges on path to low-carbon era
Helping customers do more using less
ABB power and automation
solutions are:
 Meeting rising demand for electricity
 Increasing energy efficiency and reducing
CO2 emissions
 Improving productivity to raise
competitiveness of businesses
and utilities
0
5
10
15
20
25
30
35
40
2011 2035
Electricity demand is calculated as the total gross electricity
generated less own use in the production of electricity and
transmission, and distribution losses.
Source: IEA, World Energy Outlook 2013
Rise in electricity demand by 2035
(under current policies)
In thousand Terawatt-hours (TWh)
+92
%
2015-06-08 ShanghaiMCEI_20150608.pptx | GF-SG| 4 |
© ABB
Renewable energy
Key growth driver for both power and automation
September 17, 2015
© ABB
Leading the transition to digital grid
September 17, 2015
Big shift in the electrical value chain
New gridTraditional grid
© ABB
Slide 7
September 17,
2015
Electricity demand to rise by around 80% through 2040
Significant increase from developing markets
Europe and North
America (OECD)
3% 26%
Latin America
61% 100%
South East
Asia
123% 196%
China
44% 119%
M. East and Africa
74% 152%
Source: International Energy Agency (IEA), WEO 2014
Growth in primary energy demand
Growth in electricity demand
IEA New policies scenario 2012-40
India
123% 235%
Europe and N. America
Rest of the world
M. East and Africa
Globalprojectedincreasein
electricitydemand(15.325TWh)
Year 2040: 34.887 TWh
34 %
14 %
13 %
13 %
6 %
11 %
China
India
Latin America
Year 2012: 19.562 TWh
9 % South East Asia
© ABB
Slide 8
September 17,
2015
Changes in the world of electricity
Examples of regional drivers
Ageing electrical infrastructure,
grown over a long period of time
North
America
AsiaEurope
Latin
America
Middle East
& Africa
Megacities
Rural electrification
Economic development
Strong push towards renewable energy
supported by legislation
Increasing interest in
renewable energy
High share of
green field
installationsFocus on asset optimization and
services
Will to diversify generation mix in
a sustainable way to:
New Clean
Power Plan
Renewable
policies pioneers
lower hydro
dependence
lower fossil fuel
dependence
Shift in fuel mix
(coal to gas)
Strong growth
Broad digital
inclusion
General trend towards urbanization
Single European
market for
electricity
Strong growth
© ABB
Slide 10
September 17,
2015
2020 2040
57% 53%
17% 24%
19% 11%
3% 7%
3% 3%
1% 2%
Energy efficiency and renewables
Significant contribution to CO2 emissions reductions
30
32
34
36
38
40
42
44
46
2012 2020 2040
Efficiency
Renewables
Energy demand
Nuclear
Biofuels
CCS*
Gt CO2
* Carbon capture and storage
Current trend
New policies
scenario
Source:
International
Energy Agency
(IEA), WEO 2014
World energy-related CO2 savings potential by policy
measure under New Policies Scenario relative to
Current Policies Scenario
© ABB
Slide 11
September 17,
2015
Renewable energy
Global installed capacity more than double by 2040
6% 7%
10%
64%
48%
40%10%
17%
21%
20%
27%
29%
0
1,000
2,000
3,000
4,000
5,000
2014 2025 2040
Wind
Solar PV
Hydro
Other**1.825 GW
30%*
3.148 GW
38%*
4.675 GW
43%*
GW
* Share of total power capacity
** Other include bioenergy,
geothermal, CSP and marine
Wind and solar amount to 50% of total renewables in 2040
Source: IRENA Statistics
© ABB
Slide 12
September 17,
2015
Power sources – example Germany
From hundreds to millions
© ABB
Slide 13
September 17,
2015
Challenges for the grid
© ABB
Slide 14
September 17,
2015
Characteristics of renewable energy sources
Wind and Solar PV: What is different?
dispatchable partial low partial
Bioenergy
Geo-
thermal
Hydro WindSolar
onshore offshore
high accuracy Moderate
CSP* PV
Reser-
voir
Run of
river
seasons to generations hours to years minutes to years
Dispatcha-
bility
Predictability
Variability
time scale
days to
years
* With thermal storage
Source: IPCC 2011
low
Balancing electricity supply and demand at any time is becoming
more challenging given the volatility and uncertainty of wind and
solar energy sources
© ABB
Slide 15
September 17,
2015
Properties of renewable generation
Challenging the power system
Variable and uncertain generation
Maximum output varies depending on wind and sunlight
No perfect forecast for wind and sunlight available
Inertial response capability
Non-synchronous generation technologies connect to grid via power
electronics and have little or no inertial response capability
Location constrained
Areas with the best resources are often situated in remote locations.
Tapping into these resources will require efficient ways to transport a large
amount of power over long distances.
Modularity
Renewable power generation can be found as residential or commercial
size. Increasing levels of distribution level generation will require new
approaches to regulate and manage this energy.
© ABB
Slide 16
September 17,
2015
The evolving grid
From traditional to smart grid
 Centralized power generation  Centralized and distributed generation
 One-directional power flow  Multi-directional power flow
 Generation follows load  Intermittent renewable generation
 Top-down operations planning
 Consumption integrated in system
operation
 Operation based on historical
experience
 Operation based on real-time
data
Traditional grid Smart grid
© ABB
Slide 17
September 17,
2015
Virtual Power
Plants
EV-charging
Demand
Response
Microgrid
stabilization
Energy
storage Substation automation,
protection and control
Plant automation
and control
Renewable integration
Key technologies to increase system flexibility
HVDC
Active voltage
regulation
FACTS
Generation
forecasting
PlanningandConsulting
ServiceandMaintenance
Communication networks
© ABB
Slide 18
September 17,
2015
PCS based battery energy storage
Layout for 20 MW / 60 minutes
© ABB Group
September 17, 2015 | Slide 19
electroMobility EV charging
© ABB
Group
September
Project Estonia: Country wide network
ABB awarded Europe’s largest EV infrastructure project
500 private and 500
government EV’s to be
launched
ABB awarded Europe’s
largest ever EV infrastructure
deployment
Nationwide network: every
main road in Estonia will have
a fast charger approximately
every 50 km
ABB manages full turnkey
project
Completed in Q4, 2012
200 DC + AC combined fast chargers
507 AC chargers at office locations
Turnkey project & network services
Transformation of the Electricity Supply
© ABB
Slide 22
September 17,
2015
Enabling clean power for a sustainable world
Summary
 Large scale integration of renewable energy requires a
fundamentally new design of power systems
 Long distance transmission
 Integration of all types of highly distributed resources
 Matching highly volatile supply with demand
 Technological challenges
 HVDC overlay grids
 Storage
 Managing the complexity of millions of devices
 Stabilizing the system with little or no inertia
Many components are available already today, but may
need to be used differently than in the past
– some solutions still need to be developed.
Smart Grids

Smart Grids

  • 1.
    © ABB Slide 1 September17, 2015 Smart Grids Energiaseminaari, Helsingin Insinöörit Matti Vaattovaara 26.9.2015
  • 2.
    © ABB Tackling society’schallenges on path to low-carbon era Helping customers do more using less ABB power and automation solutions are:  Meeting rising demand for electricity  Increasing energy efficiency and reducing CO2 emissions  Improving productivity to raise competitiveness of businesses and utilities 0 5 10 15 20 25 30 35 40 2011 2035 Electricity demand is calculated as the total gross electricity generated less own use in the production of electricity and transmission, and distribution losses. Source: IEA, World Energy Outlook 2013 Rise in electricity demand by 2035 (under current policies) In thousand Terawatt-hours (TWh) +92 % 2015-06-08 ShanghaiMCEI_20150608.pptx | GF-SG| 4 |
  • 3.
    © ABB Renewable energy Keygrowth driver for both power and automation September 17, 2015
  • 4.
    © ABB Leading thetransition to digital grid September 17, 2015 Big shift in the electrical value chain New gridTraditional grid
  • 5.
    © ABB Slide 7 September17, 2015 Electricity demand to rise by around 80% through 2040 Significant increase from developing markets Europe and North America (OECD) 3% 26% Latin America 61% 100% South East Asia 123% 196% China 44% 119% M. East and Africa 74% 152% Source: International Energy Agency (IEA), WEO 2014 Growth in primary energy demand Growth in electricity demand IEA New policies scenario 2012-40 India 123% 235% Europe and N. America Rest of the world M. East and Africa Globalprojectedincreasein electricitydemand(15.325TWh) Year 2040: 34.887 TWh 34 % 14 % 13 % 13 % 6 % 11 % China India Latin America Year 2012: 19.562 TWh 9 % South East Asia
  • 6.
    © ABB Slide 8 September17, 2015 Changes in the world of electricity Examples of regional drivers Ageing electrical infrastructure, grown over a long period of time North America AsiaEurope Latin America Middle East & Africa Megacities Rural electrification Economic development Strong push towards renewable energy supported by legislation Increasing interest in renewable energy High share of green field installationsFocus on asset optimization and services Will to diversify generation mix in a sustainable way to: New Clean Power Plan Renewable policies pioneers lower hydro dependence lower fossil fuel dependence Shift in fuel mix (coal to gas) Strong growth Broad digital inclusion General trend towards urbanization Single European market for electricity Strong growth
  • 7.
    © ABB Slide 10 September17, 2015 2020 2040 57% 53% 17% 24% 19% 11% 3% 7% 3% 3% 1% 2% Energy efficiency and renewables Significant contribution to CO2 emissions reductions 30 32 34 36 38 40 42 44 46 2012 2020 2040 Efficiency Renewables Energy demand Nuclear Biofuels CCS* Gt CO2 * Carbon capture and storage Current trend New policies scenario Source: International Energy Agency (IEA), WEO 2014 World energy-related CO2 savings potential by policy measure under New Policies Scenario relative to Current Policies Scenario
  • 8.
    © ABB Slide 11 September17, 2015 Renewable energy Global installed capacity more than double by 2040 6% 7% 10% 64% 48% 40%10% 17% 21% 20% 27% 29% 0 1,000 2,000 3,000 4,000 5,000 2014 2025 2040 Wind Solar PV Hydro Other**1.825 GW 30%* 3.148 GW 38%* 4.675 GW 43%* GW * Share of total power capacity ** Other include bioenergy, geothermal, CSP and marine Wind and solar amount to 50% of total renewables in 2040 Source: IRENA Statistics
  • 9.
    © ABB Slide 12 September17, 2015 Power sources – example Germany From hundreds to millions
  • 10.
    © ABB Slide 13 September17, 2015 Challenges for the grid
  • 11.
    © ABB Slide 14 September17, 2015 Characteristics of renewable energy sources Wind and Solar PV: What is different? dispatchable partial low partial Bioenergy Geo- thermal Hydro WindSolar onshore offshore high accuracy Moderate CSP* PV Reser- voir Run of river seasons to generations hours to years minutes to years Dispatcha- bility Predictability Variability time scale days to years * With thermal storage Source: IPCC 2011 low Balancing electricity supply and demand at any time is becoming more challenging given the volatility and uncertainty of wind and solar energy sources
  • 12.
    © ABB Slide 15 September17, 2015 Properties of renewable generation Challenging the power system Variable and uncertain generation Maximum output varies depending on wind and sunlight No perfect forecast for wind and sunlight available Inertial response capability Non-synchronous generation technologies connect to grid via power electronics and have little or no inertial response capability Location constrained Areas with the best resources are often situated in remote locations. Tapping into these resources will require efficient ways to transport a large amount of power over long distances. Modularity Renewable power generation can be found as residential or commercial size. Increasing levels of distribution level generation will require new approaches to regulate and manage this energy.
  • 13.
    © ABB Slide 16 September17, 2015 The evolving grid From traditional to smart grid  Centralized power generation  Centralized and distributed generation  One-directional power flow  Multi-directional power flow  Generation follows load  Intermittent renewable generation  Top-down operations planning  Consumption integrated in system operation  Operation based on historical experience  Operation based on real-time data Traditional grid Smart grid
  • 14.
    © ABB Slide 17 September17, 2015 Virtual Power Plants EV-charging Demand Response Microgrid stabilization Energy storage Substation automation, protection and control Plant automation and control Renewable integration Key technologies to increase system flexibility HVDC Active voltage regulation FACTS Generation forecasting PlanningandConsulting ServiceandMaintenance Communication networks
  • 15.
    © ABB Slide 18 September17, 2015 PCS based battery energy storage Layout for 20 MW / 60 minutes
  • 16.
    © ABB Group September17, 2015 | Slide 19 electroMobility EV charging
  • 17.
    © ABB Group September Project Estonia:Country wide network ABB awarded Europe’s largest EV infrastructure project 500 private and 500 government EV’s to be launched ABB awarded Europe’s largest ever EV infrastructure deployment Nationwide network: every main road in Estonia will have a fast charger approximately every 50 km ABB manages full turnkey project Completed in Q4, 2012 200 DC + AC combined fast chargers 507 AC chargers at office locations Turnkey project & network services
  • 18.
    Transformation of theElectricity Supply
  • 19.
    © ABB Slide 22 September17, 2015 Enabling clean power for a sustainable world Summary  Large scale integration of renewable energy requires a fundamentally new design of power systems  Long distance transmission  Integration of all types of highly distributed resources  Matching highly volatile supply with demand  Technological challenges  HVDC overlay grids  Storage  Managing the complexity of millions of devices  Stabilizing the system with little or no inertia Many components are available already today, but may need to be used differently than in the past – some solutions still need to be developed.