1. Alexandrea Countryman
EDMA 4970
Lesson Plan 1
October 2008
Slope Lesson Plan
-Objective:
Given a set of points or a line on a graph, the student will be able to calculate the correct
slope.
-Oklahoma Pass Objectives:
Algebra I:
Standard 2: Relations and Functions - The student will use relations and functions to model
number relationships.
2. Linear Equations and Graphs
c. Slope
I. Calculate the slope of a line using a graph, an equation, two points
or a set of data points.
-Materials:
SmartBoard or projector for PowerPoint presentation
Accompanying worksheet
-Lesson Plan Description:
I. Engagement Activity:
Use the SmartBoard or PowerPoint projector to show the class the following graphs at the
appropriate times.
Show the class the two snapshots of “Joan” catching bugs:
2. Alexandrea Countryman
EDMA 4970
Lesson Plan 1
October 2008
Ask the class what they notice about Joan’s tongue. Make sure the class sees that when Joan
caught the green fly, she had to stick her tongue almost straight up in the air. When Joan
caught the yellow fly, her tongue was close to flat.
Next, make the comparison between Joan’s tongue and lines on a coordinate plane. Show
that lines can be slanted different ways, just like Joan's tongue:
Then, introduce the correct terminology: We use slope to measure a line's slant. Show the
class that the green line [above] has a big slope, because it is slanted so sharply, and that
because the red line is close to flat, it has a small slope.
Finally, introduce lines with negative slope. Ask the class what they notice about this line, as
opposed to the previous ones. They should notice that it points down instead of up.
3. Alexandrea Countryman
EDMA 4970
Lesson Plan 1
October 2008
This concludes the engagement portion of the lesson.
II. Presentation/Exploration:
Continue to use the SmartBoard or PowerPoint projector to show the class the following
graphs at the appropriate times.
Explain that for slope to be useful in a mathematical sense, we need a more exact definition.
Start by drawing a line and picking two points on the line:
Note: If you are using a SmartBoard, you can draw a line and plot points that the students
choose (on a blank coordinate plane).
Next, explain that slope is defined as the change in the y-coordinates divided by the change
in the x-coordinates, and that people often remember this definition as "rise over run." Show
this on the next graph by explaining that the change in y-coordinates (rise) is red, and the
change in x-coordinates (run) is blue.
4. Alexandrea Countryman
EDMA 4970
Lesson Plan 1
October 2008
Before moving on to the next slide, ask the class how they think we should write “change in
x-coordinates divided by change in y-coordinates.” If they need it, give them the hint that
the Greek letter delta, , is an abbreviation for change.
After the class has come up with some ideas, help them get to the correct notation by
explaining that the traditional abbreviation for slope is “m.” Now they can write the formula
for slope as:
Help the class represent the first point as (x1, y1) and the second point as (x2, y2) using the
last graph.
Ask them for ideas of how we can rewrite our formula to get rid of the delta, helping them
eventually achieve:
5. Alexandrea Countryman
EDMA 4970
Lesson Plan 1
October 2008
Now, take a minute to explain a mnemonic device the students can use to help remember
the formula for slope: If Joan’s food was really tasty, she would be saying “Mmm…” while
eating. This is represented by the “m” in the equation. If you start by drawing the x’s
underneath the dividing line, your picture looks like a picnic table. If Joan’s yummy food was
on the table (draw the y’s on the top), she would have “yum-yum’s on a picnic table,” which
would make her say “Mmm…”
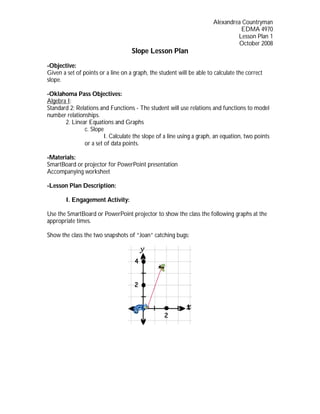
Moving on, help the students use this formula to find the slope of the example line. The first
point was (1, 2), so x1 = 1 and y1 = 2. Similarly, x2 = 2 and y2 = 4, because the second point
was (2, 4).
m = (y2 - y1) / (x2 - x1)
= (4 - 2) / (2 - 1)
= 2/1
= 2.
Explain that this means the slope of the line is 2. They can now see from the next graph that
the line moves up two spaces for every space that it moves to the right (2/1=2):
Next, try another example, finding the slope of the line between two flies:
6. Alexandrea Countryman
EDMA 4970
Lesson Plan 1
October 2008
Ask the students to give the points the flies are at. ((2, 1) and (4, 2)). Help them substitute
this into the slope equation to find the slope of the line (reminding them to put the “yum-
yum’s on the picnic table” if needed).
m = (y2 - y1) / (x2 - x1)
= (2 - 1) / (4 - 2)
= 1/2.
They can now see that this line's slope is 1/2.
In this situation, if Joan finds a point on the line and then gives her tongue the same slope,
she should be able to catch both flies:
Finally, give one more example.
Individually, have the students try to find the slope of this line. Before they begin, point out
that that the line slants down instead of up. Because the line is slanting down, its slope
should be negative.
7. Alexandrea Countryman
EDMA 4970
Lesson Plan 1
October 2008
After giving the class time to work, have a student share his or her answer. Give other
students with different answers an opportunity to share as well. Ask for a volunteer (with
the correct or incorrect answer) to present their work on the board. Then have a
conversation with the class about whether the solution and work is correct, and continue to
discuss until the class comes to a unanimous decision about the correct answer and
procedure. The students may have used an equation like this one:
m = (y2 - y1) / (x2 - x1)
= (1 - 4) / (2 - 0)
= -3/2, or -1.5.
However, they may have picked different points. Be sure that their procedure is as follows:
Locate two points on the line. For instance, we can see that the line intersects the y-axis at
the point (0, 4). We can try to be exact by finding a second point on the line where two
gridlines cross. One point like this is (2, 1). If they are still confused, show the students that
the two points you chose are colored blue in this picture:
8. Alexandrea Countryman
EDMA 4970
Lesson Plan 1
October 2008
Then, continue with the same equation mentioned above.
Finally, point out that the line's slope is a negative number, just as we predicted.
This concludes the presentation and exploration portion of the lesson.
III. Evaluation:
At the end of the class period, the students will journal about the definition of slope in their
own words, give an example of slope in real life, and explain how to calculate slope. This
will give me feedback on whether students have accurately understood the lesson, and what I
need to review before going on to teach particular types of slopes and equations using slope.
The students will be given a worksheet to complete in remaining class time or at home
calculating slopes given both graphs and sets of points. This will give me feedback as to
whether the students have accurately mastered the material.
-References:
http://mathforum.org/cgraph/cslope
http://www.edhelper.com/algebra.htm
9. Alexandrea Countryman
EDMA 4970
Lesson Plan 1
October 2008
Slope
Find the slope of the line passing through the two points.
1. (-1,7), (1,5) 2. (2,2), (6,8) 3. (7,8), (0,5)
4. (8.2,6.9), (-20.1,-8.2) 5. (-8.4,6.9), (-8.5,5.1) 6. (-34,-41), (-26,42)
7. (-7,8), (-4,-3) 8. (-25.7,-16.2), (-40.6,12.2) 9. (12,1), (36,-42)
10. (-1,-8), (-7,-4) 11. (2.1,3.8), (3.1,7.6) 12. (41.8,-18.2), (18.6 ,0.8)
13. (7,2), (-2,0) 14. (-42,21), (-25,3) 15. (-21,-24), (-2,-8)
10. Alexandrea Countryman
EDMA 4970
Lesson Plan 1
October 2008
16. (3.6,-4.2), (-6.6,-7.9) 17. (2,-6), (-1,-2) 18. (-1.1,-8.3), (-1.9,-3.6)
Find the slope of the line.
1. 2. 3.
4. 5. 6.

![Alexandrea Countryman
EDMA 4970
Lesson Plan 1
October 2008
Ask the class what they notice about Joan’s tongue. Make sure the class sees that when Joan
caught the green fly, she had to stick her tongue almost straight up in the air. When Joan
caught the yellow fly, her tongue was close to flat.
Next, make the comparison between Joan’s tongue and lines on a coordinate plane. Show
that lines can be slanted different ways, just like Joan's tongue:
Then, introduce the correct terminology: We use slope to measure a line's slant. Show the
class that the green line [above] has a big slope, because it is slanted so sharply, and that
because the red line is close to flat, it has a small slope.
Finally, introduce lines with negative slope. Ask the class what they notice about this line, as
opposed to the previous ones. They should notice that it points down instead of up.](data:image/gif;base64,R0lGODlhAQABAIAAAAAAAP///yH5BAEAAAAALAAAAAABAAEAAAIBRAA7)