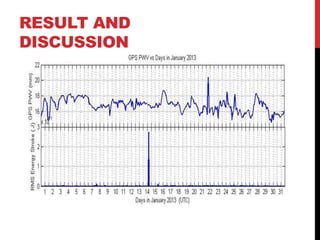
PROCESSING THE LIGHTNING DATA IN
ANTARCTICA FROM WWLLN AND COMPARE
THEM WITH GPS PWV
PRESENTER : SITI FATIRAH BINTI RAMLI
SUPERVISOR : ASSOCIATE PROF DR. WAYAN
SUPARTA
CO-SUPERVISOR : MISS SITI KHALIJAH BINTI
ZAINUDIN
CONTENT OVERVIEW
 Introduction
 Research Objectives
 Methodology
 Result and discussion
 Conclusion
 Future work
INTRODUCTION
LITERATURE OF LIGHTNING IN
ANTARCTICA
 From NASA SCIENCE NEWS
‘areas such as the Arctic and Antarctica have very
few thunderstorms and, therefore,almost no
lightning at all’
 From GEOLOGY.COM
‘The poles have very little lightning because their
white snow- and ice-covered surfaces are not
effectively warmed by the sun to produce convection.
There is also very little moisture in polar air. These
factors significantly reduce the amount of lightning
produced near the poles. ’
AVERAGE YEARLY COUNTS OF LIGHTNING FLASHES PER SQUARE
KILOMETER BASED ON DATA COLLECTED BY NASA'S LIGHTNING IMAGING
SENSOR ON THE TROPICAL RAINFALL MEASURING MISSION
Gray or light purple - Places where less than one flash
occurred (on average) each year are
Deep red, grading to black - Places with the largest number of
lightning strikes are
WWLLN WORLD LIGHTNING MAP
 Lightning stroke positions are shown as coloured dots
blue for the most recent (occurring within the last 10 min)
green and yellow to red for the oldest (30-40 minutes earlier)
 Red asterisks in white circles are active WWLLN lightning sensor locations.
 The terminator (day-night boundary) is shown, with the daylit section of the globe in grey.
RESEARCH STATIONS
 CASEY (Australia)
 MAWSON (Australia)
 MCMURDO (US)
 PALMER (US)
From this 4 research stations,the GPS data could be obtained
LOCATION OF RESEARCH STATION IN ANTARTICA
DATA USED
Type of data Website
GPS data SOPAC and IGN
Scripps Orbit and Permanent Array
Center
International GNSS Service
Meteorology data INTERFACE to BAS/MET Oracle
Data
Lightning data WWLLN
World Wide Lightning Location
Network
GPS PWV
 PWV
Represent the total amount of water vapor content in
lower atmosphere that result from condensing all the
water vapor in atmospheric column at particular time
and over a given location from surface of earth to the
top of atmosphere
LIGHTNING DATA FROM WWLLN
 WWLLN stands for World Wide Lightning Location
Network
 WWLLN is maintain by the University of Washington with
the cooperation of universities and institutes which host
the stations around the globe
 There are 5 sensors located in the Antarctica:
> SANAE > Rothera > Davis
> Scott Base > Syowa
RESEARCH OBJECTIVES
 To perform data analysis of GPS PWV data using Matlab
 To compare the GPS PWV data with lightning data from
WWLLN in Antartica
METHODOLOGY
Collect GPS data
from SOPAC/IGN
Analyze lightning
data with PWV
data
Data processing
to get max angle
Collect
meteorology data
from BUS
INTERFACE
Data processing
to get PWV
Plot a graph of
PWV against days
in January
Collect lightning
data from WWLLN
RESULT AND
DISCUSSION
 On 14th of January 2013
GPS PWV increase before lightning happen and
decrease after lightning happen and the RMS energy
value is the highest one
 But on 22nd of January 2013
As GPS PWV increase and it was the highest value
among all,the lightning happen but it RMS energy
value is low
COMPARISON WITH OTHER
RESEARCH
‘Monitoring the association between GPS PWV and lightning
activity during 2009 winter monsoon over Bangi Malaysia’
 PWV increase before lightning happen
 Research area in Bangi
the result from this research can only be used as
reference but the result cannot be the same as
research area different(temperature,climate,weather)
CONCLUSION
 Cannot conclude that as GPS PWV increase then lightning
will happen because on some other days when GPS PWV
increase,lightning do not happen
FUTURE WORK
 Literature on lightning
 Writing final report
THANK YOU

slide progress report

  • 1.
    PROCESSING THE LIGHTNINGDATA IN ANTARCTICA FROM WWLLN AND COMPARE THEM WITH GPS PWV PRESENTER : SITI FATIRAH BINTI RAMLI SUPERVISOR : ASSOCIATE PROF DR. WAYAN SUPARTA CO-SUPERVISOR : MISS SITI KHALIJAH BINTI ZAINUDIN
  • 2.
    CONTENT OVERVIEW  Introduction Research Objectives  Methodology  Result and discussion  Conclusion  Future work
  • 3.
  • 4.
    LITERATURE OF LIGHTNINGIN ANTARCTICA  From NASA SCIENCE NEWS ‘areas such as the Arctic and Antarctica have very few thunderstorms and, therefore,almost no lightning at all’  From GEOLOGY.COM ‘The poles have very little lightning because their white snow- and ice-covered surfaces are not effectively warmed by the sun to produce convection. There is also very little moisture in polar air. These factors significantly reduce the amount of lightning produced near the poles. ’
  • 5.
    AVERAGE YEARLY COUNTSOF LIGHTNING FLASHES PER SQUARE KILOMETER BASED ON DATA COLLECTED BY NASA'S LIGHTNING IMAGING SENSOR ON THE TROPICAL RAINFALL MEASURING MISSION Gray or light purple - Places where less than one flash occurred (on average) each year are Deep red, grading to black - Places with the largest number of lightning strikes are
  • 6.
    WWLLN WORLD LIGHTNINGMAP  Lightning stroke positions are shown as coloured dots blue for the most recent (occurring within the last 10 min) green and yellow to red for the oldest (30-40 minutes earlier)  Red asterisks in white circles are active WWLLN lightning sensor locations.  The terminator (day-night boundary) is shown, with the daylit section of the globe in grey.
  • 7.
    RESEARCH STATIONS  CASEY(Australia)  MAWSON (Australia)  MCMURDO (US)  PALMER (US) From this 4 research stations,the GPS data could be obtained
  • 8.
    LOCATION OF RESEARCHSTATION IN ANTARTICA
  • 9.
    DATA USED Type ofdata Website GPS data SOPAC and IGN Scripps Orbit and Permanent Array Center International GNSS Service Meteorology data INTERFACE to BAS/MET Oracle Data Lightning data WWLLN World Wide Lightning Location Network
  • 10.
    GPS PWV  PWV Representthe total amount of water vapor content in lower atmosphere that result from condensing all the water vapor in atmospheric column at particular time and over a given location from surface of earth to the top of atmosphere
  • 11.
    LIGHTNING DATA FROMWWLLN  WWLLN stands for World Wide Lightning Location Network  WWLLN is maintain by the University of Washington with the cooperation of universities and institutes which host the stations around the globe  There are 5 sensors located in the Antarctica: > SANAE > Rothera > Davis > Scott Base > Syowa
  • 12.
    RESEARCH OBJECTIVES  Toperform data analysis of GPS PWV data using Matlab  To compare the GPS PWV data with lightning data from WWLLN in Antartica
  • 13.
    METHODOLOGY Collect GPS data fromSOPAC/IGN Analyze lightning data with PWV data Data processing to get max angle Collect meteorology data from BUS INTERFACE Data processing to get PWV Plot a graph of PWV against days in January Collect lightning data from WWLLN
  • 14.
  • 15.
     On 14thof January 2013 GPS PWV increase before lightning happen and decrease after lightning happen and the RMS energy value is the highest one  But on 22nd of January 2013 As GPS PWV increase and it was the highest value among all,the lightning happen but it RMS energy value is low
  • 16.
    COMPARISON WITH OTHER RESEARCH ‘Monitoringthe association between GPS PWV and lightning activity during 2009 winter monsoon over Bangi Malaysia’  PWV increase before lightning happen  Research area in Bangi the result from this research can only be used as reference but the result cannot be the same as research area different(temperature,climate,weather)
  • 17.
    CONCLUSION  Cannot concludethat as GPS PWV increase then lightning will happen because on some other days when GPS PWV increase,lightning do not happen
  • 18.
    FUTURE WORK  Literatureon lightning  Writing final report
  • 19.