Download to read offline

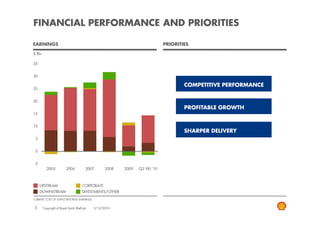
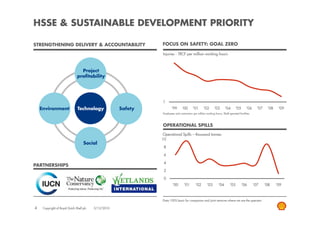

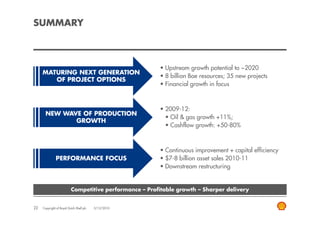

The document is a presentation by Royal Dutch Shell's CFO Simon Henry at a premium review conference, outlining Shell's financial performance, growth strategies, and market risks as of December 2010. It emphasizes the company's focus on operational efficiency, profitability in the upstream sector, and future projects with substantial resource potential. Additionally, it includes cautionary statements regarding forward-looking projections and factors that could influence Shell's financial outcomes.


