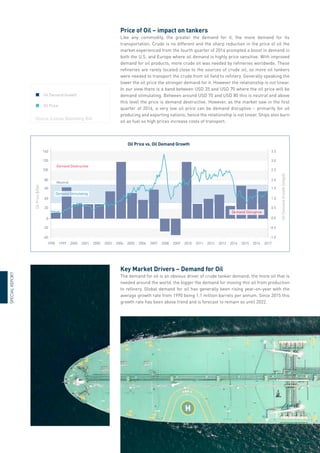
The Basics of the
Tanker Shipping
Market
This yearโ€™s special report focuses on the key drivers and influences on the crude
tanker market. The aim is to provide some basic market background and explain key
market drivers to investors, commentators and observers alike.
Where do Crude tankers sit within the Value chain?
CRUDE TANKER
PRODUCT CARRIER
OFFSHORE
PLATFORM
STORAGE
TANKS
EXPORTS
STORAGE
TANKS
REFINERY
END USER
SPECIAL
REPORT
DWT Barrel
capacity
Length (m) Breadth (m) Draught (m) Fleet size*
% owned
by top 10
VLCC 300,000 2,000,000 320 60 20 735 43%
Suezmax 160,000 1,000,000 265 50 17 523 39%
Aframax 115,000 600,000 240 45 15 959 36%
Crude oil tankers have a vital role to play within the energy value chain. Their main
role is to transport crude oil from production point to refinery, although they are
also sometimes used for storing crude oil post production. Crude tankers can also
be used for carrying oil products such as fuel oil. Any clean products that come out
of the refinery are carried on 'clean' or 'product' tankers, which are smaller in size
due to the smaller parcel sizes in which these products are traded. Euronav only
operates in the VLCC and Suezmax segment, this report will therefore focus on crude
oil tankers.
The Asset
Crude oil tankers come in various sizes, the biggest standard size being a Very Large
Crude Carrier โ€“ or 'VLCC'. These tankers take up to 2 million barrels of crude oil per
shipment, while the second largest size is the 'Suezmax' which takes around half of
that amount and is the largest size ship that can sail through the Suez Canal fully
laden. The smallest size of dedicated crude oil tankers is an 'Aframax' which can
carry around 600,000 barrels of oil. There are smaller tankers in the market, but
these tend to carry refined oil products and fuel oil, not crude oil.
* 
January 1, 2018
(Source: Clarksons SIN Excludes shuttle tankers)
At Euronav, we
depreciate the
original cost of a
vessel to zero value
over 20 years.

Construction of crude oil tankers takes 9 to 15 months from the time the keel is
first laid. This means that it will take at least two years from the time of newbuilding
contract signature (ordering) until the vessel is delivered because many critical parts
are long-lead items that needs to be ordered and produced before the construction
of the ship can commence. Their sheer size dictates that there is a limited number of
sites capable of building them and these are concentrated in Asia, more specifically
in South Korea, China, and Japan. The price for contracting a tanker newbuilding is
influenced by a number of factors such as the underlying price of energy, steel, labor
costs and available construction finance. The relative demand for contracting new
tonnage also plays a role and may lengthen or shorten waiting time to delivery and
affect price. Over the last ten years the cost of a new VLCC has ranged from around
USD 80 million to USD 160 million. The payment profile on the ships tends to be
very back loaded, typically with a 10% deposit on signing the contract, 20% to 40% in
milestone payments and finally 50% to 70% on delivery.
The economic lifespan of an oil tanker has historically been 25 years, although more
recently this has dropped closer to 20 years. Different tanker companies operate with
their own asset depreciation policies, ranging from 18 to 25 years. At Euronav, we
depreciate the original cost of a vessel to zero value over 20 years.
The Cost Structure
A ship owner chartering his vessel to a customer is paid 'freight'; this is the gross
revenue agreed with the charterer to cover the entire voyage from port of loading to
port of discharge. This revenue is used to cover the cost for the owner to undertake
the voyage, the cost of operating the vessel, any interest payments to loan providers
and other costs associated with owning a ship. Certain fixed costs vary between
shipping companies, most important the purchase price, and each will therefore
have their individual breakeven cost at which it becomes profitable to run the vessels.
However once these fixed costs are covered, all additional revenue results in profit.
Earnings are reported by companies and market watchers in terms of 'dollars per
day' also known as the Time Charter Equivalent (TCE). The cash breakeven TCE for a
VLCC is between USD 20,000 per day to USD 35,000 per day depending for example
THE
BASICS
OF
THE
TANKER
SHIP
MARKET
11
on the level of loan interest, fixed operating costs depreciation (or amortization) and
GA expenses.
Each $5,000 uplift in both VLCC and Suezmax rates
improves net revenue and EBIDTA by $72 mm
$267
+ $5,000
per day
VLCC TCE rates
Suezmax TCE rates
$25,000
$20,000 $25,000
$30,000
$339
$35,000
$40,000
+ $15,000
per day
$483
$45,000
$50,000
+ $25,000
per day
$627
$75,000
$80,000
+ $55,000
per day
$1,059
AVG TCE
OPEX
GA
EBITDA
Interest
Debt Repayment
Maintenance
Cash flow
0
5.000
10.000
15.000
20.000
25.000
30.000
35.000
(Source: Euronav)
(Source: Investor Presentation High Yield
Conference 2017)
Gross Revenue: Money agreed with
charterer to cover entire voyage from
A to B
Voyage Expenses: Cost of fuel, port
stay, tolls, cargo handling, commission
Net Revenue: Gross revenue minus
voyage expenses
Vessel Expenses (OPEX): cost of crew,
vessel stores  supplies, lubrication,
oils, insurance
Interest: cost of debt servicing
Debt repayment: debt repayment will
depend on financing but depreciation is
a real cost
Maintenance Capex: Cost of special
surveys
For the purpose of this report, the tax issues will not be covered in-depth, but
for more details please refer to the annual report. As a consequence of this cost
structure, most tanker companies are highly operationally levered. Therefore, every
additional dollar earned in revenue over and above the โ€œfixedโ€ cost base will fall
through to profit. Euronavโ€™s illustrative operational leverage for its cost structure is
depicted below.
Tanker Customers
Tanker shipping is a business to business environment with a number of key
customers who regard the shipping element as an integral part of their logistical
chain. These key customers are the oil majors โ€“ both National Oil Companies (e.g.
Unipec, Saudi Aramco, Petrobras) and International Oil Companies (e.g. Total, Shell
and Chevron) โ€“ and there are trading houses such as Trafigura and Glencore, and
SPECIAL
REPORT
large refiners. The oil majors generally require ships to take oil or to deliver to or from
third party refineries oil to their customers. This type of business depends on physical
oil flows, which refineries require what type of crude oil at any given time. The trading
houses are often more opportunistic in their trading of oil and therefore also more
unpredictable in terms of when and where they may need a ship. Most counterparties
in the large crude tanker space are large multinational companies with strong credit
ratings. The customer is often referred to as the 'charterer' of the vessel.
When a charterer requires a tanker to move oil from A to B they will typically get in
touch with a ship broker, who will in turn contact a number of vessel owners and act
as a middle man in negotiating price, terms and conditions for carrying the cargo. The
charterer can go directly to the ship owner himself, although this happens less often.
How the price of freight is set
The following chart gives a broad worked example on how the price of freight is set.
A number of vessels will be eligible to take a cargo and the broker (who has been
mandated by the cargo owner to find a vessel to carry the cargo) will over the course
of several rounds bring down the number of potential ships. This process will also
be driven by the ship owners themselves as some will voluntarily drop out of any
potential bidding for a range of reasons (logistics, price, other cargo to bid on etc.).
Round 1 Potential Vessel 10
Vessels that can make the lifting
window and are interested in this route
Round 2 Vessel evaluation 7
Brokers narrow down field basis e.g. logistics,
age of ship, embargo restriction, etc
Round 3 Selection 4
Viable vessels go into auction process
with often lowest bid the winning ship
Round 4 Vetting 1
Only one vessel goes on 'subjects' for the
cargo, charterer vetting process begins
(Source: Euronav)
Quite simply the higher the number of potential ships, the lower the eventual freight
rate will likely be as more qualifying bidders logically should mean more pressure
on the price. However, it is important to understand only one ship will be selected
to go through a final vetting process whereby the cargo owner will assess the
vesselโ€™s seaworthiness and suitability for the trade via previous survey results and
inspections. Ship owners competing with each other drive pricing down sometimes
below fixed costs.
THE
BASICS
OF
THE
TANKER
SHIP
MARKET
13
Price of Oil โ€“ impact on tankers
Like any commodity, the greater the demand for it, the more demand for its
transportation. Crude is no different and the sharp reduction in the price of oil the
market experienced from the fourth quarter of 2014 prompted a boost in demand in
both the U.S. and Europe where oil demand is highly price sensitive. With improved
demand for oil products, more crude oil was needed by refineries worldwide. These
refineries are rarely located close to the sources of crude oil, so more oil tankers
were needed to transport the crude from oil field to refinery. Generally speaking the
lower the oil price the stronger demand for it. However the relationship is not linear.
In our view there is a band between USD 35 and USD 70 where the oil price will be
demand stimulating. Between around USD 70 and USD 80 this is neutral and above
this level the price is demand destructive. However, as the market saw in the first
quarter of 2016, a very low oil price can be demand disruptive โ€“ primarily for oil
producing and exporting nations; hence the relationship is not linear. Ships also burn
oil as fuel so high prices increase costs of transport.
Key Market Drivers โ€“ Demand for Oil
The demand for oil is an obvious driver of crude tanker demand; the more oil that is
needed around the world, the bigger the demand for moving this oil from production
to refinery. Global demand for oil has generally been rising year-on-year with the
average growth rate from 1990 being 1.1 million barrels per annum. Since 2015 this
growth rate has been above trend and is forecast to remain so until 2022.
0
-20
-40
1998 1999 2000 2001 2002 2003 2004 2005 2006 2007 2008 2009 2010 2011 2012 2013 2014 2015 2016 2017
20
40
60
80
100
120
140
0.5
0.0
-0.5
-1.0
1.0
1.5
2.0
2.5
3.0
3.5
Neutral
Demand Destructive
Demand Disruptive
Demand Stimulating
(Source: Euronav, Bloomberg, IEA)
	
Oil Demand Growth
	 Oil Price
Oil Price vs. Oil Demand Growth
Oil
Price
$/bbl
Oil
Demand
Growth
(mbpd)
SPECIAL
REPORT
Translating oil demand growth into actual vessel demand is an inexact science as
many factors impact how this oil is being traded and what means of transportation
is used to move it. A rough calculation looks something like this: demand growth
of say 1 million barrels per day equates to 365 million barrels per year. If all
this incremental demand was shipped and carried on VLCCs in 2 million barrel
parcels this would be an additional 182 cargoes per year. With a VLCC performing
on average six voyages a year we can conclude that these additional cargoes
would require around 30 extra ships provided all the additional demand is carried
by sea.
Key Market Drivers โ€“ Supply of Oil
Clearly for any oil transportation business the supply of oil is critical to the status
of its markets. Oil supply dynamics have undergone a transformation in the past
decade, away from being very Middle East focused to having a more diverse supply
base, in particular with the development of U.S. shale oil. This quick-to-production
process of shale oil (less than six months) has made global oil production far more
responsive to short-term changes in demand. The fact that the U.S. government
started to allow the export of crude oil in December 2015 has developed a new
trade flow currently exporting 1.4 mbpd compared to zero exports two years ago
(since end September 2017 average weekly export 1.424 mbpd (source: DOE)). Oil
supply is dynamic with for instance OPEC (the national oil producers cartel) and
Russia voluntarily cutting their crude production and removing cargoes from the
traditional trade routes emanating in the Middle East as from the first quarter of
2017.
Key Market Drivers โ€“ Vessel Supply
Perhaps the key driver of tanker markets is vessel supply. This is the ultimate
driver of market fluctuation; when the market is in short supply of ships, the cost
of chartering a ship โ€“ the freight โ€“ goes up but of course down if there are too many
ships available. This over- or undersupply of vessels can be viewed on a macro level
with the total global supply of ships, which will drive more long-term trends in freight
levels, but it can also be viewed on a more regional level where the number of ships
available in a specific load area can drive short-term freight fluctuations, which may
vary in different load areas.
On a global scale the supply of ships is a function of how many newbuild ships are
delivered versus how many ships are removed from the fleet. The vessel supply
picture can be compared to a bathtub โ€“ new vessel order flow reflect when the taps
are on filling up the fleet with more ships. Vessel scrapping is when the plug is out
and vessels are removed from the fleet rebalancing what is in the tub. The water
contained in the bathtub represents the size of the fleet โ€“ see in this respect also the
special report included in the 2016 annual report 'What is the effective size of the
operational tanker fleet'.
The demand for oil
is an obvious driver
of crude tanker
demand.

THE
BASICS
OF
THE
TANKER
SHIP
MARKET
15
Trade Routes  Dynamic Market
The different sizes of ships cater for different trade routes. We have already discussed
how smaller ships carry oil products, but within the crude tanker segment we also
see a divergence. Economies of scale dictate that. The size of a VLCC makes them
more cost efficient for longer international trade routes between large ports that
can physically accommodate their larger size. The smaller the vessel size, the more
regional the trade routes become. However, there is cross elasticity between vessel
sizes when the price of utilizing a VLCC becomes too expensive it may become more
price efficient for a customer to use two Suezmax vessels to transport the same
amount of oil instead. So we do sometimes see Suezmaxes compete for the long haul
international routes that are dominated by VLCCs and vice versa. The same applies
for smaller vessel segments.
It is important to keep in mind that trade routes are not static; these routes are highly
dependent on oil flows. For example when we began to see crude oil exports from the
U.S. destined for the Far East, the market developed a need for large crude tankers
to load in the U.S. Gulf, something not seen before. Please find more details below.
Regulation of assets and operating businesses
The tanker industry is highly regulated, to ensure that all vessels are safe to use
for the crew, the cargo and the environment. Until the age of 15 years, the ship
must undergo a survey in dry dock only every five years. The vessels have to have
certification of classification society, which is an independent organization that
establishes and maintains technical standards for the operation of all ships. Vessels
have a five year survey cycle with an annual survey (12 months), intermediate survey
(30 months) and special survey (60 months). Performing this survey can take a couple
of weeks and will test for steel thickness and other indicators of seaworthiness. After
15 years, the intermediate survey cycle also needs to be done in dry dock every 30
months so at 17.5 years and 22.5 years. This is to account for the associated wear-
and-tear due to the vesselโ€™s age. The cost of these surveys increase as the vessel
gets older - see diagram.
Some important charterers consider the overall risks associated with carrying oil
on an older ship as being too large when the vessel reaches 15 years of age, and
only charter ships until this age limit. However, most oil tankers find employment
up until around their 20th anniversary, which is currently the expected life of a
vessel, although some trade for longer. Looking at tankers that have been scrapped
since 2009, the average scrapping age for both VLCCs and Suezmaxes has been
around 20 years.
100% Utilisation
5
Special
Survey
#1
Special
Survey
#2
Special
Survey
#3
Intermediate
Survey
Special
Survey
#4
7.5 10 12.5 15 17.5 20 22.5
USD 4.0m
USD 3.0m
USD 1.0m
USD 2.0m
0
 Constant vetting process throughout ship's life
Cost of Survey increases during tanker life
Ballast Water treatment Sept-2019
Sulphur emission controls Jan-2020
It is important
to keep in mind
that trade
routes are not
static

SPECIAL
REPORT
(Source: Clarksons SIN)
	
1 Year time charter rate
	 VLCC Contracting Value
Seasonality and Cyclicality
Historically, there has been a visible degree of seasonality in the tanker market as
freight rates have tended to perform better during the first quarter and the fourth
quarter of a calendar year. With 90% of the global population living in the northern
hemisphere, more oil is required during the northern hemisphere winter hence more
oil is consumed during these quarters. Below chart shows the seasonality differential
in average VLCC rates since 1990. However this marked contrast in seasonality has
been less evident in recent years. This can be explained by most demand growth now
originating from Asia, where oil demand is less affected by seasonal consumption
patterns.
Tanker shipping is a highly cyclical business with freight rates driven by numerous
factors, but in the medium to long-term vessel supply and demand are the main
drivers. Vessel supply is the one factor controlled by the shipping industry and the
supply of vessels is impacted largely by capital flows into and out of the sector, but
also availability of financing from banks and other investors. A tanker market cycle
generally begins with an oversupplied market where too many ships depress any
earnings and therefore the capital flows out of the sector. This will cause some
owners to get rid of their older ships as these become uneconomical to run. As
vessels are removed from the fleet, the market will become rebalanced, owners will
start earning more profits and more capital flows into the sector. This encourages
owners to start ordering new tonnage, although the lead time on delivery is at least
two years. Once these newly contracted vessels start delivering to the market it will
slowly, once again, become oversupplied and earnings will hit another trough โ€“ we
are back where the cycle started. These cycles are of varying duration but generally
take five to ten years to complete but like seasonality do appear to be more variable
in length.
(Source: Clarksons SIN)
Freight Market versus value of VLCC contracting ($/d)
Average monthly VLCC Rate (since 1990) ($/d)
USD/day
billion
USD
1996 2000 2004 2008 2012 2016
10.000
20.000
30.000
40.000
50.000
60.000
70.000
80.000
90.000
0
2
4
6
8
10
12
14
16
18
0
Jan Feb
25.000
30.000
35.000
40.000
45.000
50.000
55.000
Mar Apr May Jun Jul Aug Sep Oct Nov Dec
THE
BASICS
OF
THE
TANKER
SHIP
MARKET
17

Shippingmarker

  • 1.
    The Basics ofthe Tanker Shipping Market This yearโ€™s special report focuses on the key drivers and influences on the crude tanker market. The aim is to provide some basic market background and explain key market drivers to investors, commentators and observers alike. Where do Crude tankers sit within the Value chain? CRUDE TANKER PRODUCT CARRIER OFFSHORE PLATFORM STORAGE TANKS EXPORTS STORAGE TANKS REFINERY END USER SPECIAL REPORT
  • 2.
    DWT Barrel capacity Length (m)Breadth (m) Draught (m) Fleet size* % owned by top 10 VLCC 300,000 2,000,000 320 60 20 735 43% Suezmax 160,000 1,000,000 265 50 17 523 39% Aframax 115,000 600,000 240 45 15 959 36% Crude oil tankers have a vital role to play within the energy value chain. Their main role is to transport crude oil from production point to refinery, although they are also sometimes used for storing crude oil post production. Crude tankers can also be used for carrying oil products such as fuel oil. Any clean products that come out of the refinery are carried on 'clean' or 'product' tankers, which are smaller in size due to the smaller parcel sizes in which these products are traded. Euronav only operates in the VLCC and Suezmax segment, this report will therefore focus on crude oil tankers. The Asset Crude oil tankers come in various sizes, the biggest standard size being a Very Large Crude Carrier โ€“ or 'VLCC'. These tankers take up to 2 million barrels of crude oil per shipment, while the second largest size is the 'Suezmax' which takes around half of that amount and is the largest size ship that can sail through the Suez Canal fully laden. The smallest size of dedicated crude oil tankers is an 'Aframax' which can carry around 600,000 barrels of oil. There are smaller tankers in the market, but these tend to carry refined oil products and fuel oil, not crude oil. * January 1, 2018 (Source: Clarksons SIN Excludes shuttle tankers) At Euronav, we depreciate the original cost of a vessel to zero value over 20 years. Construction of crude oil tankers takes 9 to 15 months from the time the keel is first laid. This means that it will take at least two years from the time of newbuilding contract signature (ordering) until the vessel is delivered because many critical parts are long-lead items that needs to be ordered and produced before the construction of the ship can commence. Their sheer size dictates that there is a limited number of sites capable of building them and these are concentrated in Asia, more specifically in South Korea, China, and Japan. The price for contracting a tanker newbuilding is influenced by a number of factors such as the underlying price of energy, steel, labor costs and available construction finance. The relative demand for contracting new tonnage also plays a role and may lengthen or shorten waiting time to delivery and affect price. Over the last ten years the cost of a new VLCC has ranged from around USD 80 million to USD 160 million. The payment profile on the ships tends to be very back loaded, typically with a 10% deposit on signing the contract, 20% to 40% in milestone payments and finally 50% to 70% on delivery. The economic lifespan of an oil tanker has historically been 25 years, although more recently this has dropped closer to 20 years. Different tanker companies operate with their own asset depreciation policies, ranging from 18 to 25 years. At Euronav, we depreciate the original cost of a vessel to zero value over 20 years. The Cost Structure A ship owner chartering his vessel to a customer is paid 'freight'; this is the gross revenue agreed with the charterer to cover the entire voyage from port of loading to port of discharge. This revenue is used to cover the cost for the owner to undertake the voyage, the cost of operating the vessel, any interest payments to loan providers and other costs associated with owning a ship. Certain fixed costs vary between shipping companies, most important the purchase price, and each will therefore have their individual breakeven cost at which it becomes profitable to run the vessels. However once these fixed costs are covered, all additional revenue results in profit. Earnings are reported by companies and market watchers in terms of 'dollars per day' also known as the Time Charter Equivalent (TCE). The cash breakeven TCE for a VLCC is between USD 20,000 per day to USD 35,000 per day depending for example THE BASICS OF THE TANKER SHIP MARKET 11
  • 3.
    on the levelof loan interest, fixed operating costs depreciation (or amortization) and GA expenses. Each $5,000 uplift in both VLCC and Suezmax rates improves net revenue and EBIDTA by $72 mm $267 + $5,000 per day VLCC TCE rates Suezmax TCE rates $25,000 $20,000 $25,000 $30,000 $339 $35,000 $40,000 + $15,000 per day $483 $45,000 $50,000 + $25,000 per day $627 $75,000 $80,000 + $55,000 per day $1,059 AVG TCE OPEX GA EBITDA Interest Debt Repayment Maintenance Cash flow 0 5.000 10.000 15.000 20.000 25.000 30.000 35.000 (Source: Euronav) (Source: Investor Presentation High Yield Conference 2017) Gross Revenue: Money agreed with charterer to cover entire voyage from A to B Voyage Expenses: Cost of fuel, port stay, tolls, cargo handling, commission Net Revenue: Gross revenue minus voyage expenses Vessel Expenses (OPEX): cost of crew, vessel stores supplies, lubrication, oils, insurance Interest: cost of debt servicing Debt repayment: debt repayment will depend on financing but depreciation is a real cost Maintenance Capex: Cost of special surveys For the purpose of this report, the tax issues will not be covered in-depth, but for more details please refer to the annual report. As a consequence of this cost structure, most tanker companies are highly operationally levered. Therefore, every additional dollar earned in revenue over and above the โ€œfixedโ€ cost base will fall through to profit. Euronavโ€™s illustrative operational leverage for its cost structure is depicted below. Tanker Customers Tanker shipping is a business to business environment with a number of key customers who regard the shipping element as an integral part of their logistical chain. These key customers are the oil majors โ€“ both National Oil Companies (e.g. Unipec, Saudi Aramco, Petrobras) and International Oil Companies (e.g. Total, Shell and Chevron) โ€“ and there are trading houses such as Trafigura and Glencore, and SPECIAL REPORT
  • 4.
    large refiners. Theoil majors generally require ships to take oil or to deliver to or from third party refineries oil to their customers. This type of business depends on physical oil flows, which refineries require what type of crude oil at any given time. The trading houses are often more opportunistic in their trading of oil and therefore also more unpredictable in terms of when and where they may need a ship. Most counterparties in the large crude tanker space are large multinational companies with strong credit ratings. The customer is often referred to as the 'charterer' of the vessel. When a charterer requires a tanker to move oil from A to B they will typically get in touch with a ship broker, who will in turn contact a number of vessel owners and act as a middle man in negotiating price, terms and conditions for carrying the cargo. The charterer can go directly to the ship owner himself, although this happens less often. How the price of freight is set The following chart gives a broad worked example on how the price of freight is set. A number of vessels will be eligible to take a cargo and the broker (who has been mandated by the cargo owner to find a vessel to carry the cargo) will over the course of several rounds bring down the number of potential ships. This process will also be driven by the ship owners themselves as some will voluntarily drop out of any potential bidding for a range of reasons (logistics, price, other cargo to bid on etc.). Round 1 Potential Vessel 10 Vessels that can make the lifting window and are interested in this route Round 2 Vessel evaluation 7 Brokers narrow down field basis e.g. logistics, age of ship, embargo restriction, etc Round 3 Selection 4 Viable vessels go into auction process with often lowest bid the winning ship Round 4 Vetting 1 Only one vessel goes on 'subjects' for the cargo, charterer vetting process begins (Source: Euronav) Quite simply the higher the number of potential ships, the lower the eventual freight rate will likely be as more qualifying bidders logically should mean more pressure on the price. However, it is important to understand only one ship will be selected to go through a final vetting process whereby the cargo owner will assess the vesselโ€™s seaworthiness and suitability for the trade via previous survey results and inspections. Ship owners competing with each other drive pricing down sometimes below fixed costs. THE BASICS OF THE TANKER SHIP MARKET 13
  • 5.
    Price of Oilโ€“ impact on tankers Like any commodity, the greater the demand for it, the more demand for its transportation. Crude is no different and the sharp reduction in the price of oil the market experienced from the fourth quarter of 2014 prompted a boost in demand in both the U.S. and Europe where oil demand is highly price sensitive. With improved demand for oil products, more crude oil was needed by refineries worldwide. These refineries are rarely located close to the sources of crude oil, so more oil tankers were needed to transport the crude from oil field to refinery. Generally speaking the lower the oil price the stronger demand for it. However the relationship is not linear. In our view there is a band between USD 35 and USD 70 where the oil price will be demand stimulating. Between around USD 70 and USD 80 this is neutral and above this level the price is demand destructive. However, as the market saw in the first quarter of 2016, a very low oil price can be demand disruptive โ€“ primarily for oil producing and exporting nations; hence the relationship is not linear. Ships also burn oil as fuel so high prices increase costs of transport. Key Market Drivers โ€“ Demand for Oil The demand for oil is an obvious driver of crude tanker demand; the more oil that is needed around the world, the bigger the demand for moving this oil from production to refinery. Global demand for oil has generally been rising year-on-year with the average growth rate from 1990 being 1.1 million barrels per annum. Since 2015 this growth rate has been above trend and is forecast to remain so until 2022. 0 -20 -40 1998 1999 2000 2001 2002 2003 2004 2005 2006 2007 2008 2009 2010 2011 2012 2013 2014 2015 2016 2017 20 40 60 80 100 120 140 0.5 0.0 -0.5 -1.0 1.0 1.5 2.0 2.5 3.0 3.5 Neutral Demand Destructive Demand Disruptive Demand Stimulating (Source: Euronav, Bloomberg, IEA) Oil Demand Growth Oil Price Oil Price vs. Oil Demand Growth Oil Price $/bbl Oil Demand Growth (mbpd) SPECIAL REPORT
  • 6.
    Translating oil demandgrowth into actual vessel demand is an inexact science as many factors impact how this oil is being traded and what means of transportation is used to move it. A rough calculation looks something like this: demand growth of say 1 million barrels per day equates to 365 million barrels per year. If all this incremental demand was shipped and carried on VLCCs in 2 million barrel parcels this would be an additional 182 cargoes per year. With a VLCC performing on average six voyages a year we can conclude that these additional cargoes would require around 30 extra ships provided all the additional demand is carried by sea. Key Market Drivers โ€“ Supply of Oil Clearly for any oil transportation business the supply of oil is critical to the status of its markets. Oil supply dynamics have undergone a transformation in the past decade, away from being very Middle East focused to having a more diverse supply base, in particular with the development of U.S. shale oil. This quick-to-production process of shale oil (less than six months) has made global oil production far more responsive to short-term changes in demand. The fact that the U.S. government started to allow the export of crude oil in December 2015 has developed a new trade flow currently exporting 1.4 mbpd compared to zero exports two years ago (since end September 2017 average weekly export 1.424 mbpd (source: DOE)). Oil supply is dynamic with for instance OPEC (the national oil producers cartel) and Russia voluntarily cutting their crude production and removing cargoes from the traditional trade routes emanating in the Middle East as from the first quarter of 2017. Key Market Drivers โ€“ Vessel Supply Perhaps the key driver of tanker markets is vessel supply. This is the ultimate driver of market fluctuation; when the market is in short supply of ships, the cost of chartering a ship โ€“ the freight โ€“ goes up but of course down if there are too many ships available. This over- or undersupply of vessels can be viewed on a macro level with the total global supply of ships, which will drive more long-term trends in freight levels, but it can also be viewed on a more regional level where the number of ships available in a specific load area can drive short-term freight fluctuations, which may vary in different load areas. On a global scale the supply of ships is a function of how many newbuild ships are delivered versus how many ships are removed from the fleet. The vessel supply picture can be compared to a bathtub โ€“ new vessel order flow reflect when the taps are on filling up the fleet with more ships. Vessel scrapping is when the plug is out and vessels are removed from the fleet rebalancing what is in the tub. The water contained in the bathtub represents the size of the fleet โ€“ see in this respect also the special report included in the 2016 annual report 'What is the effective size of the operational tanker fleet'. The demand for oil is an obvious driver of crude tanker demand. THE BASICS OF THE TANKER SHIP MARKET 15
  • 7.
    Trade Routes Dynamic Market The different sizes of ships cater for different trade routes. We have already discussed how smaller ships carry oil products, but within the crude tanker segment we also see a divergence. Economies of scale dictate that. The size of a VLCC makes them more cost efficient for longer international trade routes between large ports that can physically accommodate their larger size. The smaller the vessel size, the more regional the trade routes become. However, there is cross elasticity between vessel sizes when the price of utilizing a VLCC becomes too expensive it may become more price efficient for a customer to use two Suezmax vessels to transport the same amount of oil instead. So we do sometimes see Suezmaxes compete for the long haul international routes that are dominated by VLCCs and vice versa. The same applies for smaller vessel segments. It is important to keep in mind that trade routes are not static; these routes are highly dependent on oil flows. For example when we began to see crude oil exports from the U.S. destined for the Far East, the market developed a need for large crude tankers to load in the U.S. Gulf, something not seen before. Please find more details below. Regulation of assets and operating businesses The tanker industry is highly regulated, to ensure that all vessels are safe to use for the crew, the cargo and the environment. Until the age of 15 years, the ship must undergo a survey in dry dock only every five years. The vessels have to have certification of classification society, which is an independent organization that establishes and maintains technical standards for the operation of all ships. Vessels have a five year survey cycle with an annual survey (12 months), intermediate survey (30 months) and special survey (60 months). Performing this survey can take a couple of weeks and will test for steel thickness and other indicators of seaworthiness. After 15 years, the intermediate survey cycle also needs to be done in dry dock every 30 months so at 17.5 years and 22.5 years. This is to account for the associated wear- and-tear due to the vesselโ€™s age. The cost of these surveys increase as the vessel gets older - see diagram. Some important charterers consider the overall risks associated with carrying oil on an older ship as being too large when the vessel reaches 15 years of age, and only charter ships until this age limit. However, most oil tankers find employment up until around their 20th anniversary, which is currently the expected life of a vessel, although some trade for longer. Looking at tankers that have been scrapped since 2009, the average scrapping age for both VLCCs and Suezmaxes has been around 20 years. 100% Utilisation 5 Special Survey #1 Special Survey #2 Special Survey #3 Intermediate Survey Special Survey #4 7.5 10 12.5 15 17.5 20 22.5 USD 4.0m USD 3.0m USD 1.0m USD 2.0m 0 Constant vetting process throughout ship's life Cost of Survey increases during tanker life Ballast Water treatment Sept-2019 Sulphur emission controls Jan-2020 It is important to keep in mind that trade routes are not static SPECIAL REPORT
  • 8.
    (Source: Clarksons SIN) 1Year time charter rate VLCC Contracting Value Seasonality and Cyclicality Historically, there has been a visible degree of seasonality in the tanker market as freight rates have tended to perform better during the first quarter and the fourth quarter of a calendar year. With 90% of the global population living in the northern hemisphere, more oil is required during the northern hemisphere winter hence more oil is consumed during these quarters. Below chart shows the seasonality differential in average VLCC rates since 1990. However this marked contrast in seasonality has been less evident in recent years. This can be explained by most demand growth now originating from Asia, where oil demand is less affected by seasonal consumption patterns. Tanker shipping is a highly cyclical business with freight rates driven by numerous factors, but in the medium to long-term vessel supply and demand are the main drivers. Vessel supply is the one factor controlled by the shipping industry and the supply of vessels is impacted largely by capital flows into and out of the sector, but also availability of financing from banks and other investors. A tanker market cycle generally begins with an oversupplied market where too many ships depress any earnings and therefore the capital flows out of the sector. This will cause some owners to get rid of their older ships as these become uneconomical to run. As vessels are removed from the fleet, the market will become rebalanced, owners will start earning more profits and more capital flows into the sector. This encourages owners to start ordering new tonnage, although the lead time on delivery is at least two years. Once these newly contracted vessels start delivering to the market it will slowly, once again, become oversupplied and earnings will hit another trough โ€“ we are back where the cycle started. These cycles are of varying duration but generally take five to ten years to complete but like seasonality do appear to be more variable in length. (Source: Clarksons SIN) Freight Market versus value of VLCC contracting ($/d) Average monthly VLCC Rate (since 1990) ($/d) USD/day billion USD 1996 2000 2004 2008 2012 2016 10.000 20.000 30.000 40.000 50.000 60.000 70.000 80.000 90.000 0 2 4 6 8 10 12 14 16 18 0 Jan Feb 25.000 30.000 35.000 40.000 45.000 50.000 55.000 Mar Apr May Jun Jul Aug Sep Oct Nov Dec THE BASICS OF THE TANKER SHIP MARKET 17