Download as PDF, PPTX

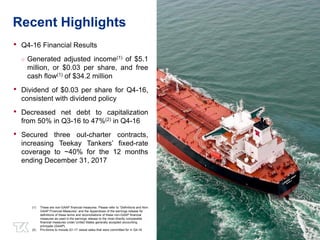
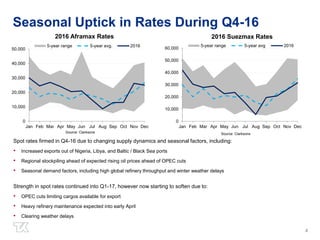
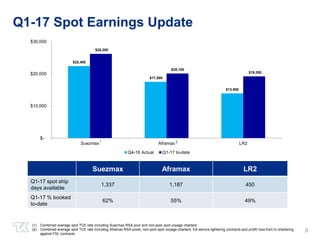


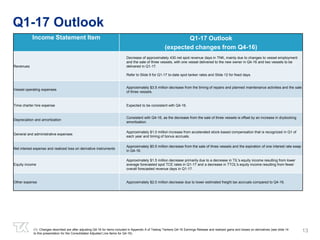


Teekay Tankers reported its Q4-2016 earnings. Key highlights included generating adjusted income of $5.1 million and free cash flow of $34.2 million. The dividend was maintained at $0.03 per share. Net debt to capitalization was reduced from 50% to 47%. Spot tanker rates increased in Q4-2016 due to seasonal factors and increased oil exports, though have since softened. Teekay Tankers expects revenues to decrease in Q1-2017 due to fewer spot revenue days from vessel sales and employment changes, while expenses are also expected to decrease from timing of repairs and maintenance.


