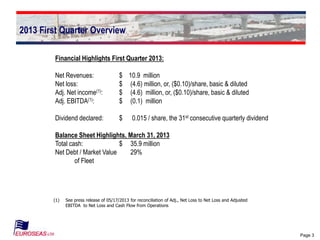
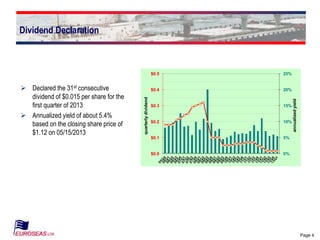
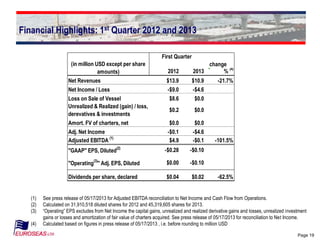
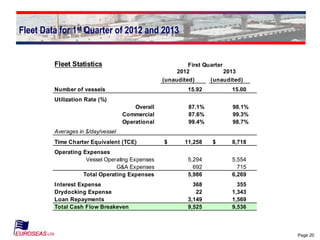
- The presentation summarizes Euroseas' financial results for the first quarter of 2013, including a net loss of $4.6 million and adjusted EBITDA of -$0.1 million. It declares a dividend of $0.015 per share.
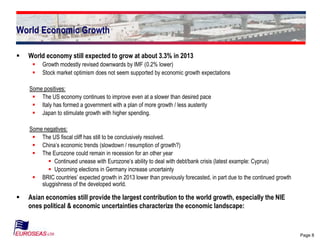
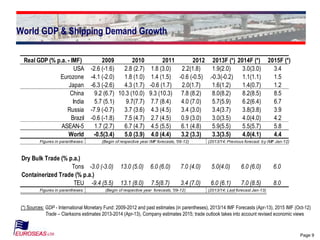
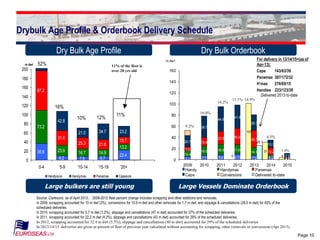
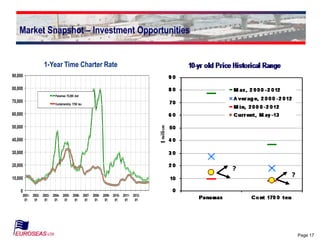
- It provides an overview of the dry bulk and container shipping markets, noting slowing global economic growth while Asian economies continue to be the largest contributor to growth. The dry bulk fleet remains relatively young while the container and large dry bulk orderbooks are dominated by panamaxes and capesizes.