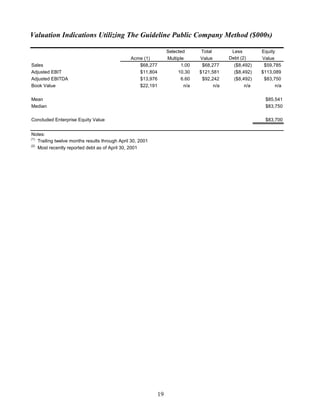
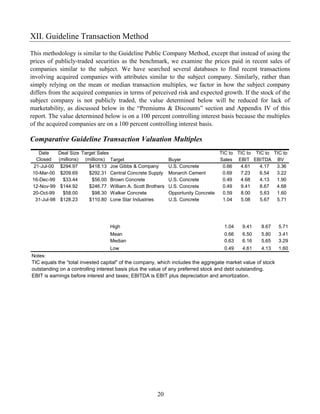
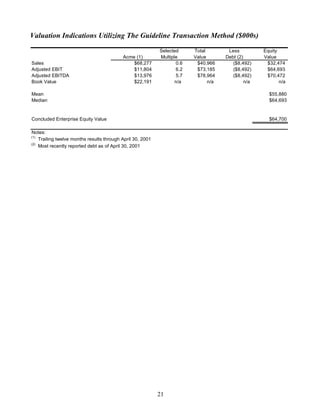
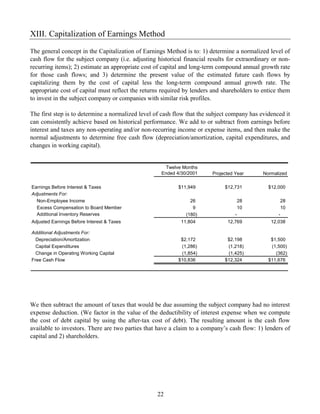
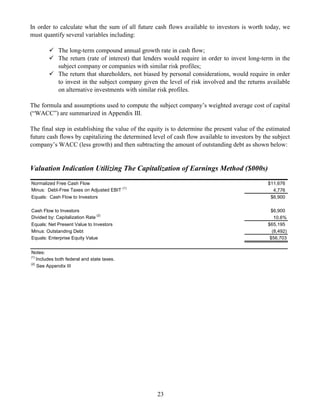
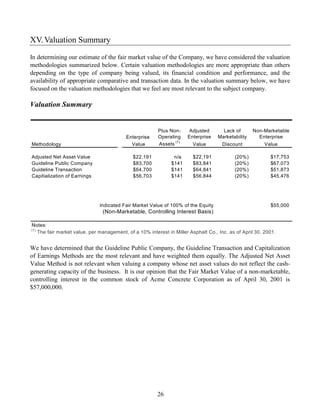
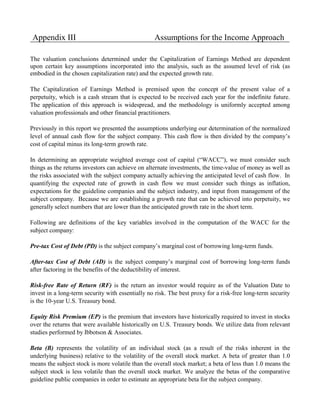
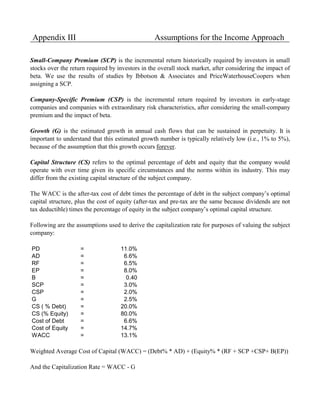
ACME CONCRETE CORPORATION


               Prepared by


       Schwartz Heslin Group, Inc.
          8 Airport Park Blvd.
          Latham, NY 12110
          www.shggroup.com


      Valuation Date: April 30, 2001
       Report Date: May 31, 2001
Table of Contents


I.      Certification .................................................................................................................................. 1
II.     Assumptions and Limiting Conditions ......................................................................................... 2
III.    Purpose ......................................................................................................................................... 3
IV. Opinion of Value .......................................................................................................................... 5
V.      Methodology................................................................................................................................. 6
VI. Subject Company Summary ......................................................................................................... 8
VII Economic Overview ..................................................................................................................... 13
VIII. Adjusted Net Asset Value Method ............................................................................................... 14
IX. Comparative Guideline Public Company Descriptions ................................................................ 15
X.      Financial Performance and Ratio Analysis................................................................................... 16
XI. Guideline Public Company Method ............................................................................................. 18
XII. Guideline Transaction Method ..................................................................................................... 20
XIII. Capitalization of Earnings Method.................................................................................... 22
XIV. Premiums & Discounts ...................................................................................................... 24
XV. Valuation Summary ........................................................................................................... 26

Appendix I – Standard & Poor’s Economic Overview
Appendix II – Profiles of Comparative Guideline Public Companies
Appendix III – Assumptions for the Income Approach
Appendix IV – Premiums & Discounts
I.    Certification

To the best of our knowledge and belief:

•    The statements of fact contained in this report are true and correct;

•    The analysis and opinions represent the unbiased conclusions of the appraisers who prepared this
     report;

•    Neither Schwartz Heslin Group, Inc. (“SHG”) nor its employees have any current or prospective
     interest in the Company, nor is there a bias with respect to any of the parties involved;

•    Neither SHG’s compensation nor that of its employees is contingent upon an action or event
     resulting from the analyses, opinions or conclusions of this report;

•    This appraisal has been prepared in compliance with the Uniform Standards of Professional
     Appraisal Practice promulgated by the Appraisal Foundation; and

•    This appraisal is valid only for the valuation date indicated on the cover of this report and is not an
     indication of past or future value


The undersigned had primary responsibility for the contents of this report and certifies that to the best
of the undersigned’s knowledge the statements of fact contained in this report are true and correct and
represent the unbiased professional analyses, opinions, and conclusions of SHG.


Steven M. Egna
Managing Director


                                                      1
II. Assumptions and Limiting Conditions

The due diligence information supplied to us that has been used as the basis for this valuation analysis
was provided and/or submitted by Steve Jones, CFO and Treasurer of Acme Concrete Corporation
(“Acme” or the “Company”), and has not been independently verified by SHG. We assume no
responsibility for its accuracy or completeness. In addition, we have assumed that no material change
occurred in the financial condition of the subject company between the date of the latest financial
statements used in this analysis and the date of the valuation, except as expressly noted herein.
Furthermore, certain financial and other market information used in this report is from third party
sources that we deem reliable. We make no representation as to the accuracy or completeness of third-
party information and have accepted it without further verification.

We did not personally inspect the records or investigate the legal rights of the subject company. The
conclusions and analyses in this report are based upon the assumption that management will continue
to manage the subject company in a similar manner going forward unless otherwise noted.


                                                   2
III. Purpose

The purpose of this business valuation report is to communicate a recommendation of the fair market
value of a 100% non-marketable, controlling interest in the shareholders’ equity of Acme Concrete
Corporation (“Acme” or the “Company”) as of April 30, 2001 (the “Valuation Date”). This valuation
report is intended solely for the purpose of a potential sale of the Company. We have no responsibility
to update this report for events and circumstances occurring after the Valuation Date.

For purposes of this report, Fair Market Value1 is defined as:

    “…the price at which property would change hands between a willing buyer and a willing seller,
    when the former is not under any compulsion to buy and the latter is not under compulsion to sell,
    assuming both parties have reasonable knowledge of relevant facts.”

Furthermore, court decisions often include the additional requirement that the hypothetical buyer and
the hypothetical seller are assumed to be able, as well as willing, to trade and are well informed about
the property and the market for such property.

The valuation of privately-held stock requires consideration of a number of factors that may influence
market value. The factors recognized by tax courts, the Internal Revenue Service, and most
sophisticated buyers and market participants typically include (and we have considered the following
in our determination of the value of the equity of the Company):

            the nature of the subject company’s business and the history of the enterprise;
            the economic outlook in general, and the condition and outlook of the subject company’s
            specific industry in particular;
            the book value of the subject company and the financial condition of its business;
            the earning capacity of the subject company;
            the dividend-paying capacity of the subject company;
            whether or not the subject company has goodwill or other intangible value;
            sales of the stock and the size of the block of stock being valued;
            the degree of marketability of the subject company’s stock;
            the market price of stocks of corporations engaged in the same or a similar line of business
            which are actively traded in a free and open market, either on an exchange or over-the-
            counter; and
            the level of control premium, if any, or discount for lack of control, with regard to the
            subject block of stock.


1
 In accord with Section 20.2031-1(b) of the Estate Tax Regulations (section 81.10 of the Estate Tax
Regulations 105) and section 25.2512-1 of the Gift Tax Regulations (section 86.19 of Gift Tax
Regulations 108).
                                                 3
These considerations are noted in Revenue Ruling 59-60, 1959-1 CB 237, as modified by Revenue
Ruling 65-193, 1965-2 CB 370, and Revenue Ruling 77-287, IRB 1977-33. Revenue Ruling 59-60 is
specifically intended for stock valuations for estate and gift tax purposes. Nonetheless, the guidelines
set forth are considered by valuation professionals, tax and other courts, the Internal Revenue Service,
the Department of Labor, and most sophisticated buyers and market participants to be applicable in
many valuation contexts, including those related to employee stock ownership plans, charitable gifts of
stock, buy/sell agreements, mergers, acquisitions and divestitures, transactions involving minority
interests in stock, the determination of exercise prices for options on privately held stock, marital
dissolutions, dissenter’s rights and bankruptcies.


                                                   4
IV. Opinion of Value

Based on relevant qualitative and quantitative analyses, subject to the assumptions and limiting
conditions disclosed herein, it is our opinion that the Fair Market Value as of April 30, 2001 of a 100%
non marketable, controlling interest in the shareholders’ equity of Acme Concrete Corporation is as
follows:


Market Value of 100% of the Equity of the Company                                         $55,000,000
(Non-Marketable, Controlling Interest Basis)


It is our opinion that an independent investor could realize a reasonable rate of return on investment at
this value, commensurate with the risks involved, assuming that the subject company is operated
prudently and that there are no unforeseen adverse changes in the economic and market conditions
affecting the business and the industry in which the subject company operates.


                                                   5
V. Methodology

There are three generally accepted approaches to valuing operating businesses. These are referred to as
the Cost Approach, the Market Approach, and the Income Approach. The value of the capital stock of
any company, regardless of its industry, size or location, is a function of the amount of cash expected
to be generated by that company which will be available to internally finance growth or to distribute to
shareholders. Consequently, all valuation methodologies are derivations of the present value of all cash
flows expected to accrue to shareholders in the future. It is difficult to quantify expected future cash
flows. In fact, many privately-held and publicly-traded companies do not prepare and disclose detailed
financial forecasts. Accordingly, many of the valuation methods use as a proxy for the present value of
expected future cash flows multiples of historical operating results. We have considered the following
methods in our determination of the value of the shareholders’ equity of the Company:

The Cost Approach

Adjusted Net Asset Value Method. This method adjusts the book value of assets and liabilities to
reflect their true economic value. The Adjusted Net Asset Value Method establishes the floor price at
which an adequately profitable company should be valued; however, companies which fail to generate
adequate profitability may be worth even less than the economic value of their net assets. The Adjusted
Net Asset Value Method assumes that a buyer of the subject company pays fair market economic value
for the net assets and does not liquidate the company. This method is often appropriate for the
valuation of businesses that have relatively low operating earnings relative to their assets.

The Market Approach

Guideline Public Company Method. The most common way to establish a value for a given
company is to examine the prices being paid in the financial markets for other companies with similar
attributes. We first select a group of companies (from over 13,000 that are publicly traded) that are
most similar to the subject company in terms of the nature of their industry and products, their markets,
their size and their growth prospects. We then analyze how the stock market values their securities.
This method is similar in many ways to the real estate appraisal process which considers the location,
size and other features of houses sold that are most similar to the one being valued to determine an
approximation of value.

The market values of publicly-traded companies and their securities are expressed as multiples of
revenue, earnings before interest and taxes, earnings before interest, taxes, depreciation, and
amortization, book value and other financial measures. We then perform a risk analysis, comparing the
subject company’s operations and financial attributes to the guideline public companies in terms of
size, breadth of operations, management and product lines, financial condition and performance,
profitability, growth, and other factors considered to be indicators of risk, in order to choose
appropriate multiples to apply to the subject company’s normalized levels of revenue, earnings, cash
flow, and/or book value.


                                                   6
Guideline Transaction Method. This methodology is similar to the prior one, except that instead of
using the prices of publicly-traded securities as the benchmark, we consider the prices paid in recent
sales of companies similar to the subject company. We search several databases containing information
on acquisition prices for companies recently acquired and determine which transactions involved
acquired companies with attributes most similar to the subject company. Although actual acquisition
prices of similar private companies would appear to be more relevant for comparative valuation
purposes than the prices of publicly-traded securities, the transaction data that is available is typically
not as comprehensive. Often, details of privately-held company acquisitions are not disclosed publicly.
Nonetheless, we search the major databases and consider the relevant transaction data that is available.

As in the Guideline Public Company Method, we perform a risk analysis comparing the subject
company’s operations and financial attributes to the comparable acquired companies’ in order to
choose appropriate multiples to apply to the subject company’s normalized levels of revenue, earnings,
cash flow, and/or book value.

The Income Approach

Discounted Cash Flow Method. The most theoretically valid, yet most subjective valuation
methodology, requires developing an estimate of expected future cash flows that will accrue to the
shareholders and then quantifying the present value of those expected future cash flows considering the
risks associated with actually achieving them. The discount rate, known as the cost of capital, must
reflect the returns required by lenders and shareholders to entice them to invest in the subject company
or companies with similar risk profiles.

Capitalization of Earnings Method. Because it is difficult to accurately project cash flows several
years into the future, many privately-held and publicly-traded companies do not prepare and disclose
detailed financial forecasts. The Capitalization of Earnings Method, which can be used as a variation
of the Discounted Cash Flow Method, capitalizes existing, proven cash flows. The general concept is
to: 1) determine a normalized level of cash flow for the subject company (i.e. adjusting historical
financial results for extraordinary or non-recurring items); 2) estimate an appropriate cost of capital
and long-term compound annual growth rate for those cash flows; and 3) determine the present value
of the estimated future cash flows by capitalizing them by the cost of capital less the long-term
compound annual growth rate.


There are other valuation methodologies that may be appropriate on occasion. For example, recent
purchases of the stock of the subject company that were negotiated between independent parties can
provide a good indication of value and must be considered. Unfortunately, it is uncommon that there
are arm’s-length transactions involving the stock of a privately-held company.

As a final note, we do not use industry rules of thumb as a valuation method. Industry rules of thumb
are typically derivatives of the above methods, thus redundant, and they do not readily allow for
consideration of differences between one company and the next. Moreover, the Internal Revenue
Service does not typically regard industry rules of thumb as an appropriate valuation method.

                                                    7
VI. Subject Company Summary

Company Name: Acme Concrete Corporation (“Acme” or the “Company”)

Description of Interest Being Valued: Non-marketable, controlling interest in Acme as of April 30,
2001. The Company has only one class of stock issued and outstanding as of the Valuation Date, and
there has been no public trading in the Company’s stock.

Special Provisions Affecting Capital Stock: None

Business Description: Acme processes and supplies ready mix concrete to the residential, industrial,
and commercial markets in the southeastern United States. The Company owns and operates
approximately 590 ready mix delivery trucks and 30 manufacturing plants located throughout the
southeastern United States.

Acme, founded in 1975 by Marvin Smith, is headquartered in Greensboro, North Carolina. Acme’s
CEO, John Gooch, and Senior Operations Executive, Marvin Taylor, have been employed by the
Company for at least 20 years and have over 40 years of industry experience. Mr. Gooch and Mr.
Taylor also have extensive involvement with regional and national trade associations. However, both
of these senior executives plan to retire in about five years. The CFO, Steve Jones, and Senior
Marketing Executive, Ryan Klein, have been with the Company for 10 and 12 years, respectively, and
do not plan on leaving Acme in the next 10 years. There are no stock options outstanding, and the
CEO and Senior Operations Executive currently own 45% of the common shares outstanding, with
55% owned by the other two senior executives. Mr. Jones and Mr. Klein have plans to succeed the
CEO and Senior Operations Executive without materially impacting Acme.

Acme’s cost structure is low in comparison to the Company’s competitors. Competition in this market
is increasing, with an emphasis on excellent service, strong customer relationships and timely delivery.
The industry leaders have gained strength through consolidation. The industry is moderately cyclical
but not seasonal. The primary barriers to enter and compete in the electrical contracting industry are
access to skilled labor and sufficient capital. Currently, the Company has approximately 4 competitors
in the same line of business.

Currently, the Company has approximately 150 customers including residential home builders, such as
Lyland Homes and Bob Barker Communities; government entities; commercial developers; and
individuals. Over the latest twelve months, Acme’s five largest customers accounted for
approximately 10% of total revenue. Alternate suppliers are available, however, 80% of all purchases
are currently coming from the Company’s top suppliers. Acme has 160 employees, 22 of which are
salaried. The work force is not unionized; the Company has not experienced any work stoppages;
employee moral is good; and turnover is below average for the industry.

The outlook for this market is favorable, with growth expected to outpace GNP by a modest margin.
As a result of new customers and new services to existing customers, the Company’s revenues have
grown at a compound annual rate of 26% over the last three fiscal years. Over the latest twelve
                                                   8
months, approximately 10% of revenue was generated from new customer business. Acme plans to
continue increasing sales to new customers by focusing on opportunities in both their existing
southeastern market and new geographic territories. In addition, Acme sees further opportunities in
offering new products and services. The Company is expecting 20% revenue growth to occur over the
current fiscal year ending December 31, 2001.

The Company’s equipment is in state of the art condition. All important aspects of the business are
covered by insurance, and there are no known environmental or contingent liabilities. Acme has not
received any legitimate offers to buy the Company to date.


                                                9
Income Statement ($000s)

                                                                                          Twelve Months
                                              Years Ended December 31,                    Ended April 30,
                               1998      % Rev.     1999     % Rev.    2000      % Rev.   2001      % Rev.


Net Revenues                  $49,301    100.0%    $61,600    100.0%   $72,591   100.0%   $68,277    100%
 Cost of Goods Sold            28,582     58.0%     36,796    59.7%    44,607     61.4%   42,301     62.0%
Gross Profit                  $20,719     42.0%    $24,804    40.3%    $27,984    38.6%   $25,976    38.0%
 Selling Expenses               5,857     11.9%      7,553    12.3%     8,238     11.3%    7,122     10.4%
 G&A Expenses                   6,797     13.8%      7,168    11.6%     7,002      9.6%    6,905     10.1%
Operating Income               $8,065     16.4%    $10,083    16.4%    $12,744    17.6%   $11,949    17.5%
 Interest Expense                   0      0.0%      1,854     3.0%     2,153      3.0%    2,145      3.1%
 Other Expenses/ (Income)         (68)    -0.1%        (63)    -0.1%     (106)    -0.1%     (139)    -0.2%
Profit Before Taxes            $8,133     16.5%     $8,292    13.5%    $10,697    14.7%    $9,943    14.6%
Taxes                           3,253      6.6%      3,317     5.4%     4,279      5.9%    3,977      5.8%
NET INCOME                     $4,880      9.9%     $4,975     8.1%     $6,418     8.8%    $5,966     8.7%


Capital Expenditures           $1,285      2.6%     $1,502     2.4%    $1,325      1.8%    $1,286     1.9%
Depreciation & Amortization     $706       1.4%     $1,956     3.2%    $2,274      3.1%    $2,172     3.2%


                                                   10
Balance Sheet ($000s)

                                                              Years Ended December 31,
                                           1998           %        1999       %          2000      %
ASSETS:
Cash and Equivalents                        $1,390        4.3%     $1,406      3.9%       $1,500    3.8%
Accounts Receivable                          7,089        21.8%     7,877     21.6%        8,621   22.0%
Inventory                                    8,085        24.8%    10,525     28.9%       12,468   31.8%
Other Current Assets                           246        0.8%        164      0.5%          157    0.4%
  Total Current Assets                     $16,810        51.6%   $19,972     54.9%      $22,746   58.1%


Property, Plant, & Equip.                   17,371        53.4%    16,349     44.9%       16,651   42.5%
  Less: Accumulated Depreciation             1,673        5.1%        145      0.4%          458    1.2%
Net Property, Plant & Equip.                15,698        48.2%    16,204     44.5%       16,193   41.3%
Land                                             0        0.0%          0      0.0%            0    0.0%
Intangibles                                      0        0.0%          0      0.0%            0    0.0%
Other Long-term Assets                          41        0.1%        234      0.6%          225    0.6%
Total Assets                               $32,549    100.0%      $36,410    100.0%      $39,164   100.0%


LIABILITIES:
Accounts Payable                            $4,348        13.4%    $7,154     19.6%       $8,079   20.6%
Accrued Expenses                             1,321        4.1%      1,685      4.6%        1,673    4.3%
Short-term Borrowings                            0        0.0%        895      2.5%          884    2.3%
Other Current Liabilities                       11        0.0%          6      0.0%           13    0.0%
 Total Current Liabs.                       $5,680        17.5%    $9,740     26.8%      $10,649   27.2%


Deferred Taxes                                   0        0.0%          0      0.0%            0    0.0%
Long-term Borrowings                         6,210        19.1%     6,401     17.6%        7,559   19.3%
Other Long-term Liabilities                      0        0.0%          0      0.0%            0    0.0%
  Total Liabilities                        $11,890        36.5%   $16,141     44.3%      $18,208   46.5%
SHAREHOLDERS' EQUITY:
Paid-In Capital                              1,699        5.2%      3,176      8.7%        3,176    8.1%
Retained Earnings                           18,960        58.3%    17,093     46.9%       17,780   45.4%
  Total Shareholders' Equity                20,659        63.5%    20,269     55.7%       20,956   53.5%
Total Liabilities & Shareholders' Equity   $32,549    100.0%      $36,410    100.0%      $39,164   100.0%


                                                     11
Current Year Financial Data ($000s)


BALANCE SHEET INFORMATION:

As of:                                                        4/30/2001
Cash                                                             $2,350
Other Current Assets                                             22,123
Net Property, Plant & Equip.                                     15,897
Other Assets                                                        225
Total Assets                                                   $40,595


Current Liabilities (excluding short term borrowings)           $9,912
Borrowings (both short term & long term)                         8,492
Other Liabilities                                                    0
Shareholders' Equity                                            22,191
Total Liabilities & Shareholders' Equity                       $40,595


PROJECTED INCOME STATEMENT:


Twelve Months Ending:                                        12/31/2001
Net Revenues                                                   $72,335
Gross Profit                                                     28,833
Operating Income                                               $12,731
Interest Expense                                                  2,170
Extraordinary Expenses/(Income)                                   (101)
Pre-Tax Income                                                 $10,662

Depreciation                                                     2,198
Capital Expenditures                                             1,218
Change in Working Capital                                        1,425


                                                        12
VII. Economic Overview

Prior to examining the appropriate valuation methodologies, it is necessary to evaluate the overall
economic environment in which the subject company operates as of the Valuation Date, paying
particular attention to variables that are most likely to influence the value of the subject company and
the industry in which it operates. We considered the economic trends, statistics, outlook, and analyses
as presented in Appendix I in performing our valuation analysis of the subject company. Moreover, the
Income and Market Approaches yield indications of value based on current prices of publicly-traded
stocks, current acquisition prices of companies similar to the subject, and the required returns (cost of
capital) of other companies similar to the subject, all of which reflect the latest economic data available
to the financial markets.

Below is a graph which illustrates the performance of the Standard & Poor’s (“S&P”) 500 Index, the
S&P Small Capitalization Company Index and an index comprised of the public companies that we
have selected as comparative guideline companies for purposes of this valuation analysis. These
comparative guideline public companies are described in detail in the next section of the report. The
relative performance of the Guideline Companies Index may offer an idea of how the value of the
subject company might have fluctuated over the past several years in both absolute and relative terms.

Over the three-year period analyzed, the comparative guideline public companies have generally kept
pace with the S&P 500 Index and S&P Small Capitalization Company Index.


                                            Market Performance
                                         3-Year Shareholder Return

         170


         130


          90


          50
                                       Mar99


                                                                       Mar00


                                                                                                        Mar01
                               Dec98


                                                               Dec99


                                                                                                Dec00
               Jun98


                                               Jun99


                                                                               Jun00


                                                                                                                Jun01
                       Sep98


                                                       Sep99


                                                                                       Sep00


                                                       Months Ending

                S&P 500 INDEX                  S&P SMALLCAP 600 INDEX                          Guideline Companies


                                                                 13
VIII. Adjusted Net Asset Value Method

Following is a summary of the results of the Adjusted Net Asset Value Method analysis, whereby the
Company’s most recent book values of assets and liabilities are adjusted to reflect their true economic
values. This method is often appropriate for the valuation of businesses that have substantial capital
investments, but is not as relevant for a rapidly growing, profitable business such as Acme.


Net Asset Adjustments ($000s)


Reported Book Value of Equity                                                                $22,191
Adjustments:
 Insufficient Allowance for Bad Debts                                                              0
 Market Value of Inventory Below Book Value                                                        0
 Market Value of Real Estate Below Book Value                                                      0
 Market Value of Equipment Below Book Value                                                        0
 Market Value of Investments in Excess of Book Value                                               0
 Underfunding of Retirement Plan                                                                   0
 Intangible Assets                                                                                 0
 Contingent Liabilities                                                                            0
Net Asset Value                                                                              $22,191


                                                  14
IX. Comparative Guideline Public Company Descriptions

The most appropriate public companies to select as comparative guideline companies are those with
attributes most similar to the subject company. Unfortunately, no public company is identical to the
subject business. The comparative guideline public companies may operate in different industries,
offer different products or services, differ substantially in terms of size, product and/or geographic
diversification, and management, or may perform better or worse than the subject company. The ways
in which the comparative guideline public companies differ from the subject company are factored into
the selection of the multiples, capitalization rates and discounts that are deemed appropriate for the
subject company. The following public companies have been chosen as comparative guideline
companies for purposes of this valuation analysis:

Centex Construction Products, Inc.- (CXP) Traded on the NYSE, the company, with revenues of
$381.5 million for the 12 months ended December 31, 2000, produces and sells cement, aggregates,
ready mix concrete and gypsum wallboard for use in the construction of homes, commercial and
industrial buildings and infrastructure. CXP operates four quarrying and manufacturing facilities and a
network of 11 terminals for the production and distribution of portland and masonry cement.

Continental Materials Corp.- (CUO) The company’s common stock is traded on the ASE. For the
12 months ended December 31, 2000, CUO generated revenues of $110.3 million. The company
operates primarily in two industry segments, the Heating and Air Conditioning segment and the
Construction Materials segment. The Construction Materials segment is involved in the production
and sale of ready mix concrete, construction aggregates and other building materials. This segment
markets its products primarily through its own direct sales representatives and confines its sales to the
Front Range area in southern Colorado. Sales are made to general and sub-contractors, government
entities and individuals.

Florida Rock Industries, Inc.- (FRK) Traded on the NYSE, FRK, with revenues of $655.3 million
for the 12 months ended December 31, 2000, mines, processes and sells construction aggregates;
produces and sells ready mix concrete, concrete block, prestressed concrete and calcium; and sells
other building materials. As of September 30, 1998, FRK had 90 sites for its ready mix concrete,
concrete block and prestressed concrete plants in Florida, Georgia, North Carolina, Virginia and
Maryland.

Monarch Cement Co.- (MCEM) The company, traded on the NASDAQ, generated $117.1 million in
revenues for the 12 months ended December 31, 2000. MCEM makes and sells several types of
portland cement and ready mix concrete, concrete products and sundry building materials.

U.S. Concrete Inc.- (RMIX) Traded on the NASDAQ, RMIX, with revenues of $394.7 million for
the 12 months ended December 31, 2000, provides ready mix concrete and related products and
services to the construction industry in major markets in the United States. The company operates 26
concrete plants in the San Francisco Bay area, the Sacramento metropolitan area, Washington, D.C.
and northern New Jersey.


                                                   15
X. Financial Performance and Ratio Analysis

Before selecting the appropriate multiples that will be utilized to derive a value for the subject
company under the Guideline Public Company Method, it is important to evaluate how the subject
company differs in terms of perceived risk and expected growth relative to the comparative guideline
public companies. We compare the subject company to the comparative guideline public companies
utilizing a number of measurements that consider relative size, breadth of operations, management and
product lines, financial condition and performance, growth, profitability, activity levels, liquidity and
leverage, as summarized below:


                    Revenue Growth                                                                                  Asset Growth
   Percentage change in total revenues during the twelve                                      Percentage change in total assets during the twelve
   months that correspond to the most recently completed                                     months that correspond to the most recently completed
                               fiscal year.                                                                           fiscal year.

  30%
                                                                                             15%

                                                                                             10%
  20%
                                                                                              5%

                                                                                              0%
  10%
                                                                                             -5%

                                                                                             -10%
   0%
                                                                                                    ACME


                                                                                                              CXP


                                                                                                                       CUO


                                                                                                                               FRK


                                                                                                                                       3MCEM


                                                                                                                                                       RMIX
         ACME


                   CXP


                               CUO


                                              FRK


                                                          3MCEM


                                                                          RMIX


                           Gross Margin                                                                       EBITDA Margin
  Net sales minus cost of goods sold as a percentage of net                                   EBITDA as a percentage of net sales. EBITDA is
                                     sales.                                                    income before interest, taxes, extraordinary items,
                                                                                                           depreciation and amortization.

   60%                                                                                       35%


   45%                                                                                       25%


   30%                                                                                       15%


   15%                                                                                        5%


    0%                                                                                       -5%
            ACME


                         CXP


                                     CUO


                                                    FRK


                                                                  3MCEM


                                                                                 RMIX


                                                                                                    ACME


                                                                                                               CXP


                                                                                                                        CUO


                                                                                                                                 FRK


                                                                                                                                               3MCEM


                                                                                                                                                              RMIX


                                                                                        16
Return on Equity                                              Return on Assets
   Net income before extraordinary items divided by the              Net income before extraordinary items divided by the
  average common equity during the twelve months that                  average total assets during the twelve months that
  correspond to the most recently completed fiscal year.             correspond to the most recently completed fiscal year.
 25%                                                                15%


 20%
                                                                    10%
 15%

 10%                                                                 5%

  5%

                                                                     0%
  0%


                                                                            ACME


                                                                                     CXP


                                                                                              CUO


                                                                                                          FRK


                                                                                                                        3MCEM


                                                                                                                                       RMIX
           ACME


                     CXP


                                CUO


                                      FRK


                                               3MCEM


                                                       RMIX


                    Inventory Turnover                                                Asset Turnover
Cost of goods sold for the twelve months that correspond to          Net sales for the twelve months that correspond to the
  the most recently completed fiscal year divided by the           most recently completed fiscal year divided by the average
average of that year’s inventories at year end and the prior       of that year’s total assets at year end and the prior year’s
                   year’s inventories at year end.                                   total assets at year end.
 50.0                                                                2.0

 40.0
                                                                     1.5
 30.0
                                                                     1.0
 20.0

 10.0                                                                0.5


  0.0                                                                0.0
            ACME


                      CXP


                                CUO


                                      FRK


                                               3MCEM


                                                       RMIX


                                                                            ACME


                                                                                    CXP


                                                                                            CUO


                                                                                                    FRK


                                                                                                                3MCEM


                                                                                                                                RMIX
                            Current Ratio                                             Debt to Capital
      Year-end current assets divided by year-end current           Year-end total debt divided by year-end common equity
                          liabilities.                                       plus preferred equity plus total debt.
5.0
                                                                     0.6
4.0

3.0                                                                  0.4

2.0
                                                                     0.2
1.0

0.0                                                                  0.0
         ACME


                    CXP


                               CUO


                                      FRK


                                               3MCEM


                                                       RMIX


                                                                             ACME


                                                                                     CXP


                                                                                              CUO


                                                                                                          FRK


                                                                                                                        3MCEM


                                                                                                                                       RMIX


                                                              17
XI. Guideline Public Company Method

Next, we examine how the public markets value the stock of the comparative guideline public
companies as a multiple of various performance measures.

Comparative Guideline Public Company Valuation Multiples

                                                             TIC to           TIC to          TIC to          EV to
                                                             Sales            EBIT           EBITDA         Book Value
CENTEX CONSTRN PRODS INC                                              2.36         7.75              6.62           1.61
CONTINENTAL MATERIALS CORP                                            0.54         7.51              4.52           0.99
FLORIDA ROCK INDS                                                     1.57        12.45              7.42           2.24
MONARCH CEMENT CO                                                     0.88        11.12              6.27           1.19
U S CONCRETE INC                                                      0.95        10.29              7.83           1.43

High                                                                  2.36        12.45             7.83            2.24
Mean                                                                  1.26         9.82             6.53            1.49
Median                                                                0.95        10.29             6.62            1.43
Low                                                                   0.54         7.51             4.52            0.99

Notes:
TIC equals the “total invested capital" of the company, which includes the aggregate market value of stock
outstanding on a controlling interest basis plus the value of any preferred stock and debt outstanding. EV equals
the aggregate market value of stock outstanding on a minority interest basis. EBIT is earnings before interest
and taxes; EBITDA is EBIT plus depreciation and amortization.


Rather than simply relying on the mean or median multiples of the comparative guideline public
companies, we must analyze the various multiples and factor in how the subject company differs from
the guideline companies, individually and as a whole, in terms perceived risk and expected growth. We
compare the subject company to the guideline public companies in terms of relative size, breadth of
operations, financial condition and performance, growth, profitability, activity levels, liquidity,
leverage, and other factors considered to be indicators of risk.

We then choose multiples that are appropriate and apply them, respectively, to the subject company’s
normalized levels of revenue, cash flow, and/or book value. If the stock of the subject company is not
publicly traded, the value determined below will be reduced for lack of marketability, as discussed in
the “Premiums & Discounts” section and Appendix IV of this report.


                                                            18
Valuation Indications Utilizing The Guideline Public Company Method ($000s)

                                                                  Selected       Total        Less        Equity
                                                Acme (1)          Multiple      Value        Debt (2)     Value
Sales                                              $68,277               1.00    $68,277       ($8,492)    $59,785
Adjusted EBIT                                      $11,804             10.30    $121,581       ($8,492)   $113,089
Adjusted EBITDA                                    $13,976               6.60    $92,242       ($8,492)    $83,750
Book Value                                         $22,191                n/a          n/a          n/a         n/a

Mean                                                                                                       $85,541
Median                                                                                                     $83,750

Concluded Enterprise Equity Value                                                                          $83,700


Notes:
(1)
    Trailing twelve months results through April 30, 2001
(2)
    Most recently reported debt as of April 30, 2001


                                                             19
XII. Guideline Transaction Method
This methodology is similar to the Guideline Public Company Method, except that instead of using the
prices of publicly-traded securities as the benchmark, we examine the prices paid in recent sales of
companies similar to the subject. We have searched several databases to find recent transactions
involving acquired companies with attributes similar to the subject company. Similarly, rather than
simply relying on the mean or median transaction multiples, we factor in how the subject company
differs from the acquired companies in terms of perceived risk and expected growth. If the stock of the
subject company is not publicly traded, the value determined below will be reduced for lack of
marketability, as discussed below in the “Premiums & Discounts” section and Appendix IV of this
report. The value determined below is on a 100 percent controlling interest basis because the multiples
of the acquired companies are on a 100 percent controlling interest basis.

Comparative Guideline Transaction Valuation Multiples
   Date      Deal Size Target Sales                                                  TIC to TIC to TIC to TIC to
 Closed      (millions) (millions) Target                     Buyer                  Sales EBIT EBITDA BV
21-Jul-00     $294.97     $418.13 Joe Gibbs & Company         U.S. Concrete           0.66   4.61    4.17  3.36
10-Mar-00     $209.69     $292.31 Central Concrete Supply     Monarch Cement          0.69   7.23    6.54  3.22
16-Dec-99      $33.44      $56.00 Brown Concrete              U.S. Concrete           0.49   4.68    4.13  1.90
12-Nov-99     $144.92     $246.77 William A. Scott Brothers   U.S. Concrete           0.49   9.41    8.67  4.68
20-Oct-99      $58.00      $98.30 Walker Concrete             Opportunity Concrete    0.59   8.00    5.63  1.60
 31-Jul-98    $128.23     $110.80 Lone Star Industries        U.S. Concrete           1.04   5.08    5.67  5.71


                                   High                                               1.04    9.41   8.67    5.71
                                   Mean                                               0.66    6.50   5.80    3.41
                                   Median                                             0.63    6.16   5.65    3.29
                                   Low                                                0.49    4.61   4.13    1.60
Notes:
TIC equals the “total invested capital" of the company, which includes the aggregate market value of stock
outstanding on a controlling interest basis plus the value of any preferred stock and debt outstanding.
EBIT is earnings before interest and taxes; EBITDA is EBIT plus depreciation and amortization.


                                                       20
Valuation Indications Utilizing The Guideline Transaction Method ($000s)
                                                            Selected     Total        Less          Equity
                                           Acme (1)         Multiple     Value       Debt (2)       Value
Sales                                          $68,277             0.6    $40,966       ($8,492)     $32,474
Adjusted EBIT                                  $11,804             6.2    $73,185       ($8,492)     $64,693
Adjusted EBITDA                                $13,976             5.7    $78,964       ($8,492)     $70,472
Book Value                                     $22,191             n/a         n/a            n/a          n/a

Mean                                                                                                  $55,880
Median                                                                                                $64,693


Concluded Enterprise Equity Value                                                                     $64,700

Notes:
(1)
    Trailing twelve months results through April 30, 2001
(2)
    Most recently reported debt as of April 30, 2001


                                                            21
XIII. Capitalization of Earnings Method

The general concept in the Capitalization of Earnings Method is to: 1) determine a normalized level of
cash flow for the subject company (i.e. adjusting historical financial results for extraordinary or non-
recurring items); 2) estimate an appropriate cost of capital and long-term compound annual growth rate
for those cash flows; and 3) determine the present value of the estimated future cash flows by
capitalizing them by the cost of capital less the long-term compound annual growth rate. The
appropriate cost of capital must reflect the returns required by lenders and shareholders to entice them
to invest in the subject company or companies with similar risk profiles.

The first step is to determine a normalized level of cash flow that the subject company has evidenced it
can consistently achieve based on historical performance. We add to or subtract from earnings before
interest and taxes any non-operating and/or non-recurring income or expense items, and then make the
normal adjustments to determine free cash flow (depreciation/amortization, capital expenditures, and
changes in working capital).


                                                      Twelve Months
                                                    Ended 4/30/2001     Projected Year       Normalized

Earnings Before Interest & Taxes                           $11,949           $12,731           $12,000
Adjustments For:
  Non-Employee Income                                           26                    28               28
  Excess Compensation to Board Member                            9                    10               10
  Additional Inventory Reserves                               (180)               -                -
Adjusted Earnings Before Interest & Taxes                   11,804             12,769           12,038

Additional Adjustments For:
  Depreciation/Amortization                                 $2,172            $2,198            $1,500
  Capital Expenditures                                      (1,286)           (1,218)           (1,500)
  Change in Operating Working Capital                       (1,854)           (1,425)             (362)
Free Cash Flow                                             $10,836           $12,324           $11,676


We then subtract the amount of taxes that would be due assuming the subject company had no interest
expense deduction. (We factor in the value of the deductibility of interest expense when we compute
the cost of debt capital by using the after-tax cost of debt). The resulting amount is the cash flow
available to investors. There are two parties that have a claim to a company’s cash flow: 1) lenders of
capital and 2) shareholders.


                                                  22
In order to calculate what the sum of all future cash flows available to investors is worth today, we
must quantify several variables including:

             The long-term compound annual growth rate in cash flow;
             The return (rate of interest) that lenders would require in order to invest long-term in the
             subject company or companies with similar risk profiles;
             The return that shareholders, not biased by personal considerations, would require in order
             to invest in the subject company given the level of risk involved and the returns available
             on alternative investments with similar risk profiles.

The formula and assumptions used to compute the subject company’s weighted average cost of capital
(“WACC”) are summarized in Appendix III.

The final step in establishing the value of the equity is to determine the present value of the estimated
future cash flows by capitalizing the determined level of cash flow available to investors by the subject
company’s WACC (less growth) and then subtracting the amount of outstanding debt as shown below:


Valuation Indication Utilizing The Capitalization of Earnings Method ($000s)
Normalized Free Cash Flow                                                                       $11,676
Minus: Debt-Free Taxes on Adjusted EBIT (1)                                                       4,776
Equals: Cash Flow to Investors                                                                   $6,900

Cash Flow to Investors                                                                           $6,900
Divided by: Capitalization Rate (2)                                                                10.6%
Equals: Net Present Value to Investors                                                          $65,195
Minus: Outstanding Debt                                                                           (8,492)
Equals: Enterprise Equity Value                                                                  $56,703


Notes:
(1)
    Includes both federal and state taxes.
(2)
    See Appendix III


                                                    23
XIV. Premiums & Discounts

The same share of stock may have a different value depending on the elements of control and
marketability inherent in the interest being valued. The valuation methodologies we have considered
yield value indications at different levels of value. A controlling interest in a company, which typically
implies in excess of 50 percent voting control, possesses the ability to implement changes in corporate
structure and policies. Conversely, a non-controlling (minority) interest does not possess such ability.
The Adjusted Net Asset Value Method, the Capitalization of Earnings Method, and the Guideline
Transaction Method each yield a controlling interest level of value. On the other hand, the Guideline
Public Company Method can yield value indications at a minority interest level of value. We must
apply premiums and discounts, as appropriate, so that all our value conclusions are at the same level of
value as the subject company stock being valued.

The most common premiums and discounts are as follows (for a more detailed discussion, please see
Appendix IV):

Control Premiums- A controlling interest is worth more because it provides the holder of the
controlling interest with the ability to determine how the subject business is governed, when it might
be sold, the level and frequency of dividends, and other matters that influence value and liquidity. A
control premium must be applied when determining certain comparative guideline public company
stock value multiples under the Guideline Public Company Method.

Minority Interest Discounts- The mathematical inverse of a control premium is a minority interest
discount. Consequently, the selection of an appropriate control premium effectively determines the
minority interest discount and vice-versa. The holder of a minority, non-controlling interest is unable
to unilaterally influence corporate governance and corporate structure and policies, many of which
directly impact value, making the minority interest worth less than a controlling interest on a per share
basis. A minority interest discount must be applied when the interest being valued represents a
minority interest.

Lack-of-Marketability Discounts- If the shares of the comparative guideline public companies can
be readily sold in an active market, they are worth more than illiquid shares. Typically, the stock of a
privately-held company is illiquid, i.e., it is not easy to accomplish a sale of stock in the subject
company. The magnitude of the appropriate lack-of-marketability discount varies depending on the
number of shares outstanding, the number of shareholders, the size of the subject block of stock,
governance provisions that affect the inherent elements of control, the performance of the company,
the volatility of the subject stock value, dividend policy, and other factors. A lack-of-marketability
discount must be applied when the subject company is privately held.

Lack of Voting Rights Discounts- In addition to the discounts applied for a minority interest and/or
lack-of-marketability, it is appropriate to apply a discount for lack of voting rights when valuing non-
voting stock. In order to quantify an appropriate discount for lack of voting rights, we analyze the price
differential between the voting common stock and the non-voting common stock of publicly-traded
companies.


                                                   24
The appropriate premium or aggregate discount that is applied is a function of factoring in all of the
above considerations and others. For example, research indicates that the stock of smaller companies is
generally worth less on a relative basis than the stock of larger companies. There may be several
reasons for this including the fact that larger companies generally achieve greater economies of scale,
greater product and/or geographic diversification, greater depth of management, greater access to
efficient capital markets in the short run, and enjoy greater barriers to entry against competitors. In
short, larger companies are perceived as having lower overall risk than smaller companies.

A “Key-Person” discount can be applied when the future of a company is dependent on a single
individual because there is an increased risk that the loss of that individual will hurt future
performance. It should also be noted that discounts are cumulative. For example, a minority interest
discount of 25% and a lack of lack-of-marketability discount of 30% results in a total discount of
47.5%.

The subject stock of the Company represents a 100% non-marketable, controlling interest in a
privately- held company. For purposes of this valuation analysis, we have applied a control premium
of 20%, and a discount for lack of marketability of 20%. A small-company risk premium of 3% and a
company-specific risk premium of 2% have been factored into the capitalization rate used in the
Capitalization of Earnings Method. See Appendix III and IV for a more detailed explanation of risk
premiums, discounts and control premiums.


                                                  25
XV. Valuation Summary

In determining our estimate of the fair market value of the Company, we have considered the valuation
methodologies summarized below. Certain valuation methodologies are more appropriate than others
depending on the type of company being valued, its financial condition and performance, and the
availability of appropriate comparative and transaction data. In the valuation summary below, we have
focused on the valuation methodologies that we feel are most relevant to the subject company.

Valuation Summary


                                                       Plus Non-     Adjusted       Lack of       Non-Marketable
                                         Enterprise    Operating     Enterprise   Marketability     Enterprise
Methodology                                Value       Assets (1)      Value        Discount           Value

Adjusted Net Asset Value                    $22,191           n/a      $22,191           (20%)           $17,753
Guideline Public Company                    $83,700          $141      $83,841           (20%)           $67,073
Guideline Transaction                       $64,700          $141      $64,841           (20%)           $51,873
Capitialization of Earnings                 $56,703          $141      $56,844           (20%)           $45,476


                              Indicated Fair Market Value of 100% of the Equity                          $55,000
                               (Non-Marketable, Controlling Interest Basis)

Notes:
(1)
  The fair market value, per management, of a 10% interest in Miller Asphalt Co., Inc. as of April 30, 2001.


We have determined that the Guideline Public Company, the Guideline Transaction and Capitalization
of Earnings Methods are the most relevant and have weighted them equally. The Adjusted Net Asset
Value Method is not relevant when valuing a company whose net asset values do not reflect the cash-
generating capacity of the business. It is our opinion that the Fair Market Value of a non-marketable,
controlling interest in the common stock of Acme Concrete Corporation as of April 30, 2001 is
$57,000,000.


                                                       26
Appendix I

Standard & Poor’s Economic Overview
&
                     INDUSTRY SURVEYS


                     Trends
                     Projections               David M. Blitzer
                                               Managing Director & Chief Investment Strategist


    May 17, 2001      Bridging the gap
                      Since the start of this year, we have seen stronger-than-expected consumer
                      spending combined with a widely anticipated slowdown in business technolo-
                      gy investment that has left the economy sliding toward the edge of recession.
                      When the April employment report revealed a plunge in employment of more
                      than 200,000 jobs and an uptick in the unemployment rate to 4.5%, we
                      seemed to be teetering on that edge.

                      The question facing the economy and eco-         are scarce and no one will consider even a
                      nomic forecasters is whether growth in con-      small risk. Maybe not all, but much of the
   Can consumer       sumer spending can hang on long enough to        new economy was — and is — real.
                      bridge the recessionary abyss until capital      Recognizing this is likely to be the key to a
                      spending growth resumes. We are still bet-       resumption of growth in capital spending.
spending hang on      ting it can, though there will be some ner-
                      vous moments in the next few quarters.           Consumers: the spending spree continues
     until capital       We begin this issue of Trends with a          Consumers spent in the first quarter. In real
                      review of some of the things that seem to        terms, overall spending rose at a 3.1% annu-
                      be worrying people about consumer spend-         al rate and more than accounted for all of
spending growth       ing. In particular, we will look at the sorry    the total 2% gain in real GDP. While this
                      state of savings, the damage done by the         was weaker than the rate for last year, it was
       resumes?       stock market, and the level of consumer          faster than in the fourth quarter of 2000.
                      debt. Looking at consumers, we conclude          Furthermore, it was not driven by overpriced
                      that the financial damage is focused where       necessities or rising gasoline prices.
                      it can most easily be absorbed — among              The fastest growing sector was autos,
                      the rich. Given this, surviving the short        where spending surged at a real annual rate
                      term is a reasonable bet.                        of almost 20%. Overall durable goods — a
                         We then turn to the long term and look at     category that includes autos, home furnish-
                      business capital investment. With interest       ings and appliances, and such things as
                      rates dropping and the stock market demon-       computers — rose at an 11.9% real annual
                      strating some resiliency, the main barrier to    rate in the first quarter. Despite reports of
                      increased capital spending is a willingness to   plunging confidence, people continued to
                      invest. A little over a year ago, risk capital   spend. At the same time, personal income
                      flowed freely, and people were investing in      rose at a 5.9% annual rate. (The income fig-
                      what are now viewed — with the benefit of        ure is not adjusted for inflation; the corre-
                      20-20 hindsight — as some outrageous             sponding unadjusted personal consumption
                      ideas. Keynes called this “animal spirits;”      figure is 6.5% growth in the first quarter).
                      more recently, others have called it believing      As these income and spending figures
                      in the new economy. Today, however, funds        suggest, savings fell in the first quarter of
2     Trends & Projections
      Real Growth & Inflation                 (Quarterly % Changes at Annual Rates)

       12

       10
                                                                                                                             Percent change in GDP deflator

       8

       6

       4

       2

       0
                                                                                                                                                                                                 Estimated
       -2
                                      Percent change in real GDP
       -4

       -6

       -8
              1981     1982      1983      1984      1985      1986     1987      1988      1989      1990      1991      1992      1993     1994      1995   1996   1997   1998   1999   2000   2001   2002


    2001. The savings rate — savings as                                          largely a response to the rising stock                                       to show how the bull market affected
    a percentage of disposable income —                                          market by wealthier individuals.                                             households at different income levels.
    was negative. At first glance, it                                            Furthermore, most other consumers                                            Total savings did decline and total
    would seem as though we’re dipping                                           do not have significant equity invest-                                       consumption did surge, but patterns
    into that vanishing nest egg to keep                                         ments; the savings rate for this group                                       varied significantly across the popula-
    spending like crazy, even as a reces-                                        did rise in recent years. A recent                                           tion.
    sion looms ahead. In addition, debt                                          study by the Federal Reserve —                                                  The wealthiest fifth of US house-
    levels are reportedly rising. And, if                                        “Disentangling the Wealth Effect: A                                          holds owns about 75% of all mutual
    that weren’t enough, there’s the bear                                        Cohort Analysis of Household Saving                                          fund shares and over 80% of all cor-
    market that threatens to shut down                                           in the 1990s,” by Dean M. Maki and                                           porate stock owned by households.
    consumer spending. While these hor-                                          Michael G. Palumbo (available at                                             For these households, the savings
    ror stories may have a small element                                         www.federalreserve.gov) — combines                                           rate fell from 4.9% in 1992 to
    of truth, they are overdone.                                                 data on household savings and invest-                                        –4.4% in 2000. Over the same peri-
       The collapse in the savings rate is                                       ments from two different Fed sources                                         od, the overall savings rate fell from
                                                                                                                                                              3.4% to –0.7%. Thus, the wealthiest
                                                                                                                                                              20% accounted for the lion’s share

      Trends
      Projections
                        &                                                                                                                                     of the drop in savings. However, the
                                                                                                                                                              decline was partially offset by an
                                                                                                                                                              increase in savings by the three-fifths
                                   Editor: Eileen M. Bossong-Martines            Copyright © 2001 by Standard & Poor’s                                        of households in the middle and bot-
                                            Copy Editor: Carol A. Wood           All rights reserved.
                                                                                 ISSN 0196-4666 USPS No. 517-780                                              tom of the wealth scale. The message
                                               Production: GraphMedia
                                     Statistician: Sally Kathryn Nuttall
                                                                                 Subscriber relations: (800) 852-1641
                                                                                 Visit the Standard & Poor’s web site
                                                                                                                                                              here is that, by and large, savings
                                    Assistant to Editor: Paulette Dixon          @ http://www.stockinfo.standardpoor.com                                      contracted among a segment of the
      STANDARD & POOR’S INDUSTRY SURVEYS is published weekly. Annual subscription to INDUSTRY SURVEYS is $10,500. Annual subscription                         population that has the capacity to
      for Trends & Projections alone is $171. Reproduction in whole or in part (including inputting into a computer) prohibited except by permission
      of Standard & Poor’s. Executive and Editorial Office: Standard & Poor’s, 55 Water Street, New York, NY 10041. Standard & Poor’s is a division
                                                                                                                                                              keep spending if it chooses to do so.
      of The McGraw-Hill Companies. Officers of The McGraw-Hill Companies: Harold McGraw III, Chairman, President, and CEO; Kenneth M. Vittor,                We’re not likely to see consumer
      Executive Vice President and General Counsel; Robert J. Bahash, Executive Vice President and CFO; Frank D. Penglase, Senior Vice President,
                                                                                                                                                              spending growth vanish because
      Treasury Operations. Periodicals postage paid at New York, NY 10004 and additional mailing offices. POSTMASTER: Send address changes
      to INDUSTRY SURVEYS, attention Mail Prep, Standard & Poor’s, 55 Water Street, New York, NY 10041. Information has been obtained by                      everyone is running out of money.
      INDUSTRY SURVEYS from sources believed to be reliable. However, because of the possibility of human or mechanical error by our sources,                    Consumer debt has also been
      INDUSTRY SURVEYS, or others, INDUSTRY SURVEYS does not guarantee the accuracy, adequacy, or completeness of any information and is
      not responsible for any errors or omissions or for the results obtained from the use of such information. This issue of INDUSTRY SURVEYS                widely discussed of late. While rela-
      includes 3 sections. Trends & Projections dated May 17, 2001 (Volume 169, Number 20, Section 3).                                                        tively high, debt levels are not out of
                                                                                                                                                              sight. Fed data through the fourth

    May 17, 2001
Trends & Projections                                                            3


quarter of 2000 show that mortgage       growth. Here, the prospects are                     This figure was the reason for some
debt service is at a peak, represent-    generally positive, and we continue                 of the angst in the trade press reports.
ing almost 6.5% of disposable            to expect the economy to avoid a                    The only bright spots in the invest-
income. However, consumer debt is        recession in 2001 by a narrow                       ment picture are construction and oil
7.8% of disposable income, down          margin. However, the economy’s                      drilling and exploration. Increased
from the peak of 8.7% seen in the        long-term prospects depend on a                     spending on electric power generating
beginning of 1990. As a result, over-    rebound in business investment.                     plants — nationally, as well as in
all debt service is 14.3%, compared                                                          California — may boost the numbers
with the peak of 14.4% seen in           Capital spending and the new economy                slightly, but the strength in the past
1986. Furthermore, growth in con-           One of the economy’s strengths in                and the anxiety in the present are all
sumer credit outstanding stabilized      the last decade has been robust capi-               about high technology.
over the last five quarters and was      tal investment. Nonresidential fixed                   The weakness is not just in com-
down sharply in March 2001 (latest       investment — business capital spend-                puters, but in a range of equipment
available). Of course, the amount of     ing on just about everything —                      including networking and telecom-
debt that’s comfortable varies among     reached a high of 13.8% in the third                munications gear — largely the
consumers. However, although cur-        quarter of 2000, the highest level                  same equipment that rode the dot-
rent debt levels are above their         since 1981. While the share hasn’t                  com boom at the end of 1990s. All
recent lows, it would be a mistake to    slipped much, spending on equip-                    those fabled Internet companies,
expect that the result will be a col-    ment and software contracted in                     fueled by venture capital cash,
lapse in consumer spending.              both the fourth quarter of 2000 and                 invested in a slew of technology
   Even though debt levels and           the first quarter of 2001. Had it not               infrastructure. When the boom end-
shrunken savings won’t stop spend-       been for a surge in spending on oil                 ed and the cash vanished, we were
ing growth, we do see some cause         drilling and exploration, overall non-              left with innumerable cancelled
for concern. Consumer spending           residential fixed investment would                  orders and a lot of unsold equip-
growth depends not only on the abil-     have been down in the first quarter.                ment. The first step to restoring
ity to spend, but also on the willing-   Investment in high-tech equipment                   some kind of order after any boom
ness to spend. If everyone believes      gained in real terms in 2000:4, but                 is production cutbacks to bring
the economy is about to collapse         turned down in 2001:1, as spending                  inventories back in line with slower
into a recession or the bear market      on computers fell at a 3% annual                    sales. This is happening now —
will get worse, consumers would          rate and spending on software fell at               with a vengeance.
likely rein in their spending. In this   a 2% annual rate.                                      In one way, the damage will be
regard, recent activity in the stock        Computers are one area where                     greater than some now realize. The
market is encouraging.                   prices fall significantly from quarter              combination of ample supplies of
   While most investors remain a bit     to quarter. Investment in computers                 (slightly) used equipment and contin-
nervous after seeing stock prices        and peripherals was down at a 30%                   ued technological progress will mean
plunge by almost 30% over a 12-          annual rate (before adjustment for                  sharply lower prices for just about
month period, some hints that the        inflation) in the first quarter of 2001.            any kind of gear. Whatever some
outlook may be improving have sur-                                                           companies thought their inventory
faced recently. For one, stock prices                                                        was worth, the real numbers are
rose sharply in April in the best          Economic Policy                                   probably significantly lower.
monthly performance in over a year.                                  2000   E2001    E2002   Nonetheless, we see something of a
Second, the market has managed to                                                            silver lining in this cloud. First, the
                                           Monetary Indicators
rise in the face of bad economic           Discount Rate              5.7      3.8     3.1   collapse in prices will probably
news. Third, and most important,           Fed Funds Rate             6.2      4.3     3.6   accelerate the process of selling the
the Fed’s previous rate cut on April       M-2 Growth (%)             6.2     11.9     8.2   inventory. Second, someone is bene-
18th reassured investors that the                                                            fiting from buying a lot of expensive
                                           Fiscal Policy: Budget Surplus/(Deficit)
central bank is concerned about the        Unified*                236.6 198.9 131.2
                                                                                             gear rather cheaply.
economy. All this is likely to encour-     NIPA**                  187.8 189.0 198.3            However long the inventory adjust-
age some spending growth in the            Surplus: GDP Ratio (%)     2.4     1.9  1.2       ment takes, the bigger question is
next few quarters.                                                                           what happens next. Will we see a
                                           E-Estimated. *Fiscal year. **Based on accrual
   The short-term puzzle for the           (not cash) accounting; excludes the S&L bailout
                                                                                             long-term revival? Does the new econ-
economy remains focused on con-            funds and uses a calendar year.                   omy still exist? A key aspect of what
sumers, the recent source of                                                                                       (continued on page 6)

                                                                                                                        Industry Surveys
4     Trends & Projections
                                                                                             Stock prices rose sharply in April as the Fed surprised the
      S&P 500 Stock Price Index           (Monthly average, 1941-43=10)
     1500
                                                                                             market with a rate cut on April 18th. The Fed action
                                                                                             strengthened a rally that had begun two weeks earlier and
     1300
                                                                                             gave the market its best gains in more than a year.
     1100

      900

      700

      500
              1996        1997            1998          1999          2000           2001


      Corporate Profits     (After taxes, in billions of current dollars, at annual rate)      Interest Rates (In percent)
      700                                                                                      8
      650                                                                                                                                 30 Year T-Bonds
                                                                                               7
      600
      550                                                                                      6
      500                                                                                                 10 Year T-Notes

      450                                                                                      5
      400                                                                                                       3 Month T-Bills
                                                                                               4
      350
      300                                                                                      3
            1994     1995          1996          1997       1998         1999         2000            1996            1997           1998             1999             2000           2001


    The April employment numbers were much weaker than                                        Employment
    expected. Continued difficulties in manufacturing and                                     6.5
                                                                                                             Payroll employment (in millions, scale at right)
                                                                                                                                                                                             133

    temporary help services resulted in a loss of about 220,000                               6.0
                                                                                                      Unemployment (%, scale at left)
                                                                                                                                                                                             130

    jobs in the month. Elsewhere there were some faint signs of                               5.5                                                                                            127

    hope, as the NAPM index gained slightly and industrial pro-                               5.0                                                                                            124
    duction gained in March.                                                                  4.5                                                                                            121

                                                                                              4.0                                                                                            118

                                                                                              3.5                                                                                            115
                                                                                                      1996          1997           1998           1999              2000            2001


      Industrial Production Index (1992=100)                                                   Capital Spending
      155
                                                                                               204                                                                                           74
                                                                                                         Business equipment production
      140                                                                                      191       (1992=100, scale at left)                                                           68
      125                                                                                      178                                                                                           62
      110                                                                                      165                                                                                           56
      Capacity Utilization (%)
                                                                                               152                                                                                           50
      85
                                                                                               139                                               New orders                                  44
      83
                                                                                                                                                 Nondefense capital goods
                                                                                               126                                               (Bil. of ‘96 $, scale at right)             38
      81
                                                                                               113                                                                                           32
      79                                                                                              1996          1997           1998           1999             2000            2001
            1996        1997              1998          1999           2000           2001


    May 17, 2001
Trends & Projections                                                                                 5


Consumer Confidence (1985=100)                                                                    Although retail sales are seeing slowness, consumers remain
150                                                                                               in reasonably good financial shape. Debt levels are high, but
140                                                                                               not at record levels, and sentiment is stabilizing. The big
130
                                                                                                  threat is from rising unemployment, which could raise
120
                                                                                                  renewed fears and dampen spending.
110

100

 90

 80
      1996              1997            1998             1999        2000          2001


Retail Activity                                                                                   Consumer Finance
19                                 Retail sales                                            210     18
                                                                                                                                        Consumer installment credit
                                   (In bil. $, excluding autos,                                                                         Net change, in bil. $
18
                                   scale at right)
                                                                                           200     15
      Light vehicle sales
      (In millions of units,                                                                                      The savings rate
      SAAR, scale at left)                                                                         12             as a percentage of
17                                                                                         190                    disposable income
                                                                                                   9
16                                                                                         180
                                                                                                   6
15                                                                                         170
                                                                                                   3
14                                                                                         160     0

13                                                                                         150     -3
      1996            1997           1998            1999         2000         2001                       1996         1997            1998          1999              2000         2001


                                                                                                 Inflation remains modest, and the housing market continues
Consumer & Producer Prices                  (Year-to-year % changes)
5
                                                                                                 to show a lot of strength. Sales of both new and existing
4                                                                                                homes were very strong in March.
                               Consumer Price Index
3
2
1                                                                   Producer Price Index

0
-1
-2
       1996             1997           1998             1999        2000          2001


NAPM Manufacturing Purchasing Managers' Index                                                      Housing Market      (In thousands of units, SAAR)
 60                                                                                                1950


 55                                                                                                1775
                                                                                                             Housing starts

 50                                                                                                1600


 45                                                                                                1425                                          Housing permits


 40                                                                                                1250
      1996             1997            1998             1999        2000           2001                    1996         1997           1998          1999             2000        2001


                                                                                                                                                                              Industry Surveys
6      Trends & Projections
       Interest Rates    (Monthly, in percent)

     10

                                                                10-Year Treasury Notes
      8


      6
                        3-Month Treasury Bills


      4


      2
              “Real“ Treasury Note rate

      0
             1988        1989        1990        1991   1992    1993       1994          1995   1996     1997      1998     1999      2000      2001


    At the May 15th meeting of the Federal Open Market Committee,                  to come at the June 26th–27th FOMC meeting. We expect either
    the Fed cut the target for the Fed funds rate to 4% from 4.5% and              a 50 bp or a 25 bp reduction at that time. If the economy looks
    lowered the discount rate to 3.5% from 4%. Within hours after                  significant better by late June, a 25 bp cut, with the possibility of
    the Fed's announcement, Fed funds were trading at close to 4%,                 a final 25 bp reduction during the summer to put the bottom at
    three-month T-bills at 3.6%, 10-year T-notes at 5.5%, and 30-year              3.5% is likely. If, however, the economy continues to look soft,
    T-bonds at 5.9%. On the foreign exchange markets, the dollar was               further reductions may be seen.
    quoted at 88 cents/euro and 124 yen.                                              The foreign exchange markets seem to be taking a favorable
       The Fed's action was widely expected. We anticipate further                 view of lower interest rates in hopes that a stronger US economy
    easing from the Fed, with the target for the funds rate to be cut              means a stronger dollar. As a result, further rate cuts are not
    to 3.5% or possibly 3% in coming months. The next move is likely               expected to dampen the dollar's continuing strength. I

    (continued from page 3)                               moment when money seemed to                       a myth; it’s the reality in technology.
    happens next is the willingness of                    grow on trees. We are back to a                   Gordon Moore, a founder of Intel,
    business to invest in anticipation of a               more normal situation where ven-                  predicted in the early 1970s that the
    stronger economy ahead. The Fed’s                     ture capital is available, but not                density of transistors on chips would
    rate cuts are a large step to assuring                seemingly for free.                               double every 18 months. The predic-
    that the financing will be available in                  The key issue for future capital               tion, which proved true, is now
    most cases. True, a few industries,                   investment is what business expects               enshrined as Moore’s Law. Even bet-
    such as telecommunications, may                       the investment will buy and return.               ter, it still has further to run. For the
    have some difficulty raising cash.                    The key to the 1990s boom was high                first decade or two of Moore’s law,
    However, there are no business credit                 technology gear that offered new                  costs collapsed, but chips were too
    problems comparable to the econo-                     opportunities, lower costs, and higher            small a part of the overall economy
    my’s condition a decade ago after the                 productivity. One part of this was the            to dominate the game. In the 1990s,
    savings and loan industry collapsed.                  relentless decline in the cost of any-            however, chips and related technolo-
    Thus, financing is not likely to be an                thing digital that kept opening up new            gy achieved a critical mass: the relent-
    insurmountable barrier.                               opportunities. If a company’s costs fall          less decline in costs and the widening
       Some may argue that the yearlong                   by a few percentage points a year, it’s           use of computing power it made pos-
    bear market has dried up venture                      pleasant, but not earth-shaking. If a             sible for technology to begin to domi-
    capital and made high-risk equity                     competitor’s costs fall by a similarly            nate more and more of the economy.
    investment impossible. Harder to                      small amount, it’s annoying, but not a               The rise of the Internet, the surge
    find, yes; but impossible, no.                        fatal blow to the business.                       in productivity, and the fall in
    Venture capital, initial public offer-                   However, when costs drop by half               information processing and commu-
    ings, and high-risk investments were                  in less than two years and keep doing             nication costs all have their roots in
    not invented in 1995. Rather, the                     so year after year, it’s revolutionary.           the ever-declining cost of computing
    period of the late 1990s was a rare                   Such a sharp decline is not a wish or             power. An economic slowdown of a

    May 17, 2001
Trends & Projections                                                      7


few quarters or a bear market last-          the bear market is that people will       seems to be slowing or fading as a
ing a year or so aren’t likely to            become afraid of taking risks. It         result of the bear market.
erase three decades of progress in           took more than a generation after            At the same time, the direct
physics and engineering. If any-             the Depression of the 1930s before        financing/bank route is fading in
thing, the economic shakeout may             most people would consider equities       some places where it had been
remove some financially weak play-           a reasonable investment for anything      strongest. In both the industrial
ers and open the door to other,              but the riskiest pursuits. After the      nations of continental Europe and
stronger competitors.                        1973–75 bear market, it took anoth-       the emerging markets around the
   Business will return to investing         er 10 to 15 years for large numbers       world, equities and market-based
because the longer-term opportuni-           of people to return to the stock mar-     financing are seen as the way to
ties are still there. The question is        ket. Will the 2000–01 bear market,        advance. Bank loans and direct
whether the return will be fast              even if it’s over already, scare people   financing are in long-term decline.
enough to avoid a recession. Here            away from stocks and taking risks         The growing use of market-based
we see a couple of reasons for opti-         for another 10 or 20 years? For the       methods to allocate capital strongly
mism: the role of computer technol-          moment at least, the answer seems         suggests that the difficulties of the
ogy in the economy and continuing            to be no.                                 last year have not seriously hurt the
faith in equities.                              If anything, many investors’ faith     willingness to take risks in pursuit
   Two facets of computer technolo-          in equities seems as unreasonably         of profits.
gy explain the role it has played in         strong today as it did at the begin-
the productivity boom of the 1990s           ning of 2000 when the Nasdaq was          Where we are, or the forecast
and in the overall economy. One,             still looking forward to crossing            What does all this mean for the
discussed earlier, is collapsing costs.      5,000 on the way up. Very few com-        economy? A bright future and a
The other is computer technology’s           mentators talk of a sustained bear        good chance of getting there with-
general purpose and wide applicabil-         market. Technology investments con-       out a recession (albeit with anoth-
ity. This is a fundamental difference        tinue to attract money. And, most         er two sluggish quarters). We have
from many other new technologies:            telling of all, an equity-market ori-     not spent a long time on the
some have limited application, while         ented culture continues to spread.        recently reported and surprisingly
others affect only small portions of            Broadly speaking, there are two        strong first-quarter GDP numbers,
the economy.                                 alternatives for organizing the financ-   in part because we expect them to
   Biotechnology, for example, is            ing and capital-raising functions         be revised downward and in part
enjoying renewed attention currently.        within an economy. The approach           because they don’t change the con-
While its benefits to medicine are           that is on the rise in the US, even       cerns about near-term weakness.
very significant, biotechnology is not       with the bear market, is to emphasize     Looking at the forecast table on
likely to change the course of the           the financial markets for both equi-      page 8, we still expect a slow and
economy. Likewise, substantial               ties and fixed-income instruments         frustrating summer for the econo-
improvements in automobile efficien-         and to step back from non-market          my and a rebound late this year.
cy and durability in the last decade         sources such as bank loans and pri-       We do think consumer spending
have changed the way people travel           vate or direct placements of debt or      will persevere enough to let the
from place to place. However impor-          equity. Furthermore, even when direct     economy avoid the worst, and we
tant, neither represents a truly gener-      placements such as venture capital        also expect investment and earn-
al-purpose technological change.             are done, efforts are made to replace     ings to rebound in 2002. I
   Like electric power, computers are        the funds with capital from the public
general-purpose technologies that            markets (IPOs) as quickly as possible.
affect almost everything. Computers             The last two decades have seen
continue to seep into every corner of        more and more kinds of financing
the economy, changing the way busi-          move to the public markets.
ness operates and raising productivity.      Mortgages, consumer loans, auto
The opportunities to harness technolo-       loans, and, more recently, commer-
gy didn’t vanish in the last year:           cial bank loans are all securitized
they’re still recognized and will still be   and sold in the public markets today.
pursued. Business will not forget            Even executive compensation is
about technology.                            moving to the public markets
   The bigger worry associated with          through stock options. None of this

                                                                                                                 Industry Surveys
8
May 17, 2001


                                                                                                                                                                                                                                                        Trends & Projections
               Economic Indicators
               Seasonally Adjusted Annual Rates — Dollar Figures in Billions
                                                               Annual % Change                                                                            2000                                  2001                                      E2002
                   2000        E2001        E2002       2000      E2001    E2002                                                                     3Q              4Q      A1Q         E2Q              E3Q         E4Q           1Q            2Q
                                                                                       Gross Domestic Product
               $9,963.1 $10,404.8 $10,876.9              7.1        4.4      4.5       GDP (current dollars)                      $10,039.4                $10,114.4 $10,243.6 $10,342.1           $10,466.7 $10,566.8 $10,674.5 $10,798.4
                    7.1       4.4       4.5              -          -        -           Annual rate of increase (%)                    3.8                      3.0       5.2       3.9                 4.9       3.9       4.1       4.7
                    5.0       2.0       2.4              -          -        -           Annual rate of increase–real GDP (%)           2.2                      1.0       2.0       1.3                 2.6       1.9       1.8       2.7
                    2.1       2.3       2.0              -          -        -           Annual rate of increase–GDP deflator (%)       1.6                      2.0       3.2       2.2                 2.2       2.0       2.2       1.9
                                                                                     * Components of Real GDP
               $6,826.6 $7,011.1         $7,204.3        6.2        2.7      2.8       Personal consumption expenditures                      $6,329.8       $6,373.3 $6,422.6 $6,451.7                $6,491.9 $6,539.6      $6,592.3    $6,648.9
                    6.2      2.7              2.8        -          -        -             % change                                                4.5            2.8      3.1      1.8                     2.5      3.0           3.3         3.5
                  896.0    915.7            958.1        9.6        2.2      4.6         Durable goods                                           903.2          896.0    921.5    912.8                   909.2    919.4         936.3       950.9
                1,869.0  1,916.1          1,972.0        5.0        2.5      2.9         Nondurable goods                                      1,882.6        1,887.4  1,899.6  1,905.4                 1,922.2  1,937.2       1,948.9     1,963.9
                3,543.9  3,658.2          3,766.4        4.5        3.2      3.0         Services                                              3,559.3        3,602.5  3,617.6  3,647.0                 3,672.4  3,695.8       3,722.0     3,750.4
                1,413.7  1,436.7          1,465.9       12.6        1.6      2.0       Nonresidental fixed investment                          1,438.8        1,438.3  1,442.2  1,431.0                 1,436.2  1,437.6       1,443.1     1,451.4
                   12.6      1.6              2.0        -          -        -             % change                                                7.7           (0.1)     1.1     (3.1)                    1.4      0.4           1.6         2.3
                1,140.5  1,142.4          1,200.7       13.7        0.2      5.1       Producers durable equipment                             1,162.4        1,152.7  1,146.7  1,126.8                 1,141.9  1,154.5       1,169.3     1,186.1
                  366.3    355.1            345.4       (0.5)      (3.1)    (2.7)      Residental fixed investment                               362.3          359.0    361.9    358.5                   353.0    347.0         343.6       343.5
                   (0.5)    (3.1)            (2.7)       -          -        -             % change                                              (10.6)          (3.6)     3.3     (3.7)                   (6.0)    (6.7)         (3.9)       (0.1)
                   60.9     13.8             29.8        -          -        -         Net change in business inventories                         72.5           55.7     (7.1)     3.7                    29.6     28.9          16.8        27.8
                1,579.2  1,617.7          1,654.7        2.8        2.4      2.3       Gov't purchases of goods & services                     1,578.2        1,589.6  1,605.1  1,612.6                 1,622.0  1,631.2       1,641.6     1,650.6
                  548.2    563.6            575.5        1.5        2.8      2.1         Federal                                                 545.8          550.9    558.6    561.3                   565.8    568.7         572.2       574.4
                1,030.5  1,053.6          1,078.7        3.5        2.2      2.4         State & local                                         1,031.9        1,038.1  1,046.0  1,050.8                 1,055.7  1,062.0       1,068.9     1,075.7
                 (412.4)  (415.8)          (466.9)       -          -        -         Net exports                                              (427.6)        (441.7)  (404.9)  (407.5)                 (421.0)  (429.9)       (441.8)     (463.8)
                1,126.3  1,145.6          1,200.2        9.0        1.7      4.8         Exports                                               1,158.8        1,139.8  1,133.6  1,142.5                 1,148.4  1,158.0       1,171.0     1,189.4
                1,538.7  1,561.5          1,667.1       13.5        1.5      6.8         Imports                                               1,586.4        1,581.5  1,538.5  1,550.0                 1,569.5  1,587.9       1,612.8     1,653.2
                                                                                    ** Income & Profits
               $8,281.7 $8,664.3 $9,040.0                6.3        4.6      4.3       Personal income                                        $8,349.0       $8,429.7 $8,550.9 $8,622.7                $8,707.5 $8,776.3 $8,883.8 $8,981.0
                6,989.8  7,358.2  7,721.8                5.3        5.3      4.9       Disposable personal income                              7,040.9        7,087.0  7,179.2  7,244.2                 7,524.1  7,485.3  7,582.8  7,665.9
                    0.8      1.5      1.7                -          -        -         Savings rate (%)                                            1.0            1.1      1.4      1.4                     1.5      1.6      1.8      1.8
                  925.6    879.6    926.6               12.5       (5.0)     5.3       Corporate profits before taxes                            945.1          894.1    866.0    871.9                   884.1    896.6    902.4    917.8
                  641.4    621.1    664.4               13.1       (3.2)     7.0       Corporate profits after taxes                             654.4          626.4    601.9    617.2                   627.5    637.7    644.6    657.7
                   50.81    45.78    46.33               5.5       (9.9)     1.2     ‡ Earnings per share (S&P 500)                               53.70          50.81    47.88    46.83                   45.04    45.78    47.28    46.66
                                                                                     † Prices & Interest Rates
                    3.4          3.3          2.0         -         -        -         Consumer price index                                         3.5              2.9       4.2        3.7               2.6        1.8         1.9            1.9
                    5.8          3.8          3.3         -         -        -         Treasury bills                                               6.0              6.0       4.8        3.9               3.3        3.2         3.2            3.2
                    6.0          5.1          5.1         -         -        -         10-yr notes                                                  5.9              5.6       5.1        5.2               5.1        5.1         5.1            5.1
                    5.9          5.6          5.7         -         -        -         30-yr bonds                                                  5.8              5.7       5.4        5.7               5.6        5.6         5.6            5.6
                    7.7          8.1          8.1         -         -        -         New issue rate–corporate bonds                               7.5              7.9       8.0        8.0               8.2        8.2         8.2            8.1
                                                                                       Other Key Indicators
                  146.9        146.6        150.3        5.6       (0.2)     2.5       Industrial production index (1992=100)                    148.3             147.9     146.1      145.9             146.8      147.6       148.3       149.6
                   81.3         77.4         76.3        -          -        -         Capacity utilization rate (%)                              81.7              80.3      78.3       77.4              77.1       76.7        76.3        76.1
                1,605.3      1,530.2      1,466.6       (4.2)      (4.7)    (4.2)      Housing starts (1,000 units SAAR)                       1,527.7           1,556.7   1,639.3    1,547.4           1,465.4    1,468.7     1,459.2     1,448.0
                   17.4         16.5         16.7        2.8       (5.1)     1.4       Auto & truck sales (1,000,000 units)                       17.5              16.3      17.2       16.4              16.2       16.1        16.4        16.7
                    4.0          4.7          5.6        -          -        -         Unemployment rate (%)                                       4.0               4.0       4.2        4.7               4.9        5.1         5.4         5.6
                    3.0         (2.6)        (5.5)       -          -        -       § U.S. dollar                                                 0.6               0.4      (1.6)      (1.7)             (1.5)      (1.6)       (1.5)       (1.4)
               Note: Annual changes are from prior year and quarterly changes are from prior quarter. Figures may not add to totals because of rounding. A–Advance data. P–Preliminary. E–Estimated. R–Revised. *1992 Chain-weighted dollars.
               **Current dollars. ‡Trailing 4 quarters. †Average for period. §Quarterly % changes at quarterly rates. This forecast prepared by Standard & Poor‘s.
Appendix II

Profiles of Comparative Guideline Public Companies
CENTEX CONSTRN PRODS INC
                                 TICKER:      CXP                                                     ADDRESS: 3710 Rawlins St Ste 1600
                              EXCHANGE: New York Stock Exchange                                                     Dallas                        TX               75219-4258
                              INDUSTRY: CONCRETE,GYPSUM,PLASTER PDS
                          CURRENT BETA 0.55


                  2,500.000                                                                                                                                                     $50.00
                                                                                                                                                                                $45.00
                  2,000.000                                                                                                                                                     $40.00
                                                                                                                                                                                $35.00
                  1,500.000                                                                                                                                                     $30.00
         Volume


                                                                                                                                                                                                Price
                                                                                                                                                                                $25.00
                  1,000.000                                                                                                                                                     $20.00
                                                                                                                                                                                $15.00
                   500.000                                                                                                                                                      $10.00
                                                                                                                                                                                $5.00
                     0.000                                                                                                                                                      $0.00
                                8

                                8


                                               98


                                                                       9

                                                                       9


                                                                                          99


                                                                                                                   0

                                                                                                                   0


                                                                                                                                      00


                                                                                                                                                                        1
                                                         9

                                                         9


                                                                                                    0

                                                                                                    0


                                                                                                                                                   1

                                                                                                                                                   1
                                       98


                                                                                  99


                                                                                                                              00
                         n9

                             g9


                                                      b9

                                                       r9

                                                                 n9

                                                                    g9


                                                                                                 b0

                                                                                                  r0

                                                                                                             n0

                                                                                                                g0


                                                                                                                                                b0

                                                                                                                                                 r0

                                                                                                                                                                     n0
                                             ec


                                                                                        ec


                                                                                                                                    ec
                                    ct


                                                                               ct


                                                                                                                           ct
                                                    Ap


                                                                                               Ap


                                                                                                                                              Ap
                       Ju

                          Au


                                                    Fe


                                                               Ju

                                                                 Au


                                                                                               Fe


                                                                                                           Ju

                                                                                                             Au


                                                                                                                                              Fe


                                                                                                                                                                   Ju
                                    O


                                                                               O


                                                                                                                       O
                                            D


                                                                                       D


                                                                                                                                   D
                                                             12 Mo Ended Fiscal Year End
      IN C OME ST A T EME N T                                     Mar01                   Mar01         Mar00                         #N/AR O#N/A& N E T P R#N/AT
                                                                                                                                         G    SS             O FI
Sales-Net                                                         437.454                437.454        417.464                   334.356              #N/A                             #N/A
                                                                                                                                                           MARGINS
 Cost of Goods Sold                                               316.950                316.950        228.983                   197.424 191.106                               158.675
 SG&A Expense                                                          4.691               4.691            4.683                     4.380           3.825                          3.904
                                                                                                                        60
Operating Income                                                  115.813                115.813        183.798                   132.552 100.452                                   74.978
Depreciation & Amortization                                           24.871              24.871           18.589       50         16.187          15.880                           13.752
Interest Expense                                                       @CF                 9.046            @CF                       @CF              @CF                            @CF
                                                                                                                        40
Non-Operating Income                                                   1.321              10.367            4.968                     4.762           3.761                          3.180
Special Items                                                          0.000               0.000            0.000       30            0.000           0.000                          0.000
PreTax Income                                                         92.263              92.263        170.177                   121.127          88.333                           64.406
                                                                                                                        20
Income Before Extra Items                                             59.429              59.429        108.232                    77.289          56.533                           41.799
 Net Income                                                           59.429              59.429        108.232         10         77.289          56.533                           41.799
EPS excluding Extra Items (Primary)                                     3.23                   3.23          5.66                         3.73            2.58                          1.89
                                                                                                                             0
EPS excl Extra Items (Fully Diluted)                                    3.22                   3.22          5.63                         3.71            2.56                          1.89
                                                                                                                             6


                                                                                                                                      6


                                                                                                                                              7


                                                                                                                                                       7


                                                                                                                                                               8


                                                                                                                                                                        8


                                                                                                                                                                                9


                                                                                                                                                                                        9


                                                                                                                                                                                                 0


                                                                                                                                                                                                            0
                                                                                                                          9


                                                                                                                                     9


                                                                                                                                              9


                                                                                                                                                      9


                                                                                                                                                               9


                                                                                                                                                                        9


                                                                                                                                                                                9


                                                                                                                                                                                        9


                                                                                                                                                                                                0


                                                                                                                                                                                                           0
                                                                                                                       2Y


                                                                                                                                  4Y


                                                                                                                                           2Y


                                                                                                                                                   4Y


                                                                                                                                                            2Y


                                                                                                                                                                     4Y


                                                                                                                                                                             2Y


                                                                                                                                                                                     4Y


                                                                                                                                                                                             2Y


                                                                                                                                                                                                        4Y
                                                                                                                       Q


                                                                                                                                  Q


                                                                                                                                          Q


                                                                                                                                                  Q


                                                                                                                                                           Q


                                                                                                                                                                    Q


                                                                                                                                                                            Q


                                                                                                                                                                                    Q


                                                                                                                                                                                            Q


                                                                                                                                                                                                        Q
      BALANCE SHEET                                               Mar01                   Mar01         Mar00                         #N/A            #N/A                          #N/A
Cash & Short Term Investments                                          8.747               8.747           96.170                  49.646          62.090                            4.812
Receivables - Total                                                   92.619              92.619           54.459                  43.192          36.669r i c e / B o o k 38.700
                                                                                                                                                        P
Inventories - Total                                                   56.008              56.008           38.582                  33.030          32.537                           31.482
  Total Current Assets                                            157.374                157.374        189.211                   125.868 131.296                                   74.994
                                                                                                                        3
Plant, Property, Equipment - Net                                  583.333                583.333        235.900                   228.557 212.909                               224.376
Debt in Current Liabilities                                            0.080               0.080            0.080      2.5
                                                                                                                                      0.080           0.080                          2.080
Accounts Payable                                                      42.168              42.168           22.348                  18.276          18.404                           16.472
  Current Liabilities-Total                                           90.191              90.191           72.987       2          59.205          53.579                           46.806
LT Debt-Total                                                     278.748                278.748            0.320                     0.400           0.480                          0.560
Preferred Stock                                                        0.000               0.000            0.000      1.5            0.000           0.000                          0.000
Common Stock                                                           0.183               0.183            0.186                     0.197           0.215                          0.220
Capital Surplus                                                       14.614              14.614           20.302       1          62.376 130.413                               147.212
Retained Earnings                                                 377.523                377.523        319.984                   217.347 144.175                                   92.004
Treasury Stock-Total $ Amt                                             0.000               0.000            0.000      0.5
                                                                                                                                      0.000           0.000                          0.000
Common Equity-Total                                               392.320                392.320        340.472                   279.920 274.803                               239.436
                                                                                                                        0
Stockholders' Equity                                              392.320                392.320        340.472                   279.920 274.803
                                                                                                                                  Mar97   Mar98                    Mar99        239.436
                                                                                                                                                                                Mar00             Mar01
  Assets-Total                                                    809.960                809.960        438.139                   364.683 351.112                               305.637


                              5- Y E A R A N N U A L S A L E S G R O W T H                                                       PER SH ARE O V ERVIEW

   30%                                                                                                                 Qtr End                     EPS               Dividends
   25%                                                                                                              Jun01                           0.30                    0.050
   20%                                                                                                              Mar01                           0.20                    0.050
   15%                                                                                                              Dec00                           0.63                    0.050
   10%                                                                                                              Sep00                           1.14                    0.050
    5%                                                                                                              Jun00                           1.25                    0.050
    0%                                                                                                              Mar00                           1.24                    0.100
     Mar97                    Mar98                  Mar99                Mar00                    Mar01                                            1.53
                                                                                                                    Dec99                                                   0.050
                                                                                                                    Sep99                           1.72                    0.000
                                                                                                                    Jun99                           1.16                    0.050
CONTINENTAL MATERIALS CORP
                                  TICKER:     CUO                                                        ADDRESS: 225 W Wacker Dr Ste 1800
                               EXCHANGE: American Stock Exchange                                                         Chicago                       IL                 60606-1274
                                INDUSTRY: CONCRETE,GYPSUM,PLASTER PDS
                            CURRENT BETA 0.16


                  160.000                                                                                                                                                              $30.00
                  140.000
                                                                                                                                                                                       $25.00
                  120.000
                                                                                                                                                                                       $20.00
                  100.000
         Volume


                                                                                                                                                                                                        Price
                   80.000                                                                                                                                                              $15.00
                   60.000
                                                                                                                                                                                       $10.00
                   40.000
                                                                                                                                                                                       $5.00
                   20.000
                    0.000                                                                                                                                                              $0.00
                              8

                              8


                                              98


                                                                      9

                                                                      9


                                                                                          99


                                                                                                                       0

                                                                                                                       0


                                                                                                                                          00


                                                                                                                                                                               1
                                                        9

                                                        9


                                                                                                    0

                                                                                                    0


                                                                                                                                                        1

                                                                                                                                                        1
                                      98


                                                                                  99


                                                                                                                                00
                       n9

                           g9


                                                     b9

                                                      r9

                                                                n9

                                                                   g9


                                                                                                 b0

                                                                                                  r0

                                                                                                             n0

                                                                                                                    g0


                                                                                                                                                     b0

                                                                                                                                                      r0

                                                                                                                                                                            n0
                                            ec


                                                                                        ec


                                                                                                                                        ec
                                   ct


                                                                               ct


                                                                                                                             ct
                                                   Ap


                                                                                               Ap


                                                                                                                                                   Ap
                     Ju

                        Au


                                                   Fe


                                                              Ju

                                                                Au


                                                                                               Fe


                                                                                                           Ju

                                                                                                                 Au


                                                                                                                                                   Fe


                                                                                                                                                                          Ju
                                  O


                                                                           O


                                                                                                                           O
                                           D


                                                                                       D


                                                                                                                                       D
                                                             12 Mo Ended Fiscal Year End
      IN C OME ST A T EME N T                                        Mar01                Dec00            Dec99                           #N/AR O#N/A& N E T P R#N/AT
                                                                                                                                              G    SS             O FI
Sales-Net                                                            113.015              110.288          118.620                     108.744               #N/A                               #N/A
                                                                                                                                                                 MARGINS
 Cost of Goods Sold                                                     @SF                81.521              86.181                   81.881          74.524                             70.094
 SG&A Expense                                                           @SF                15.158              16.146                   15.056          14.451                             14.483
                                                                                                                             35
Operating Income                                                        @SF                13.609              16.293                   11.807              9.063                           8.191
                                                                                                                             30
Depreciation & Amortization                                            5.718                   5.419            4.998                      3.992            3.493                           2.614
Interest Expense                                                        @SF                    0.571            0.469        25
                                                                                                                                           0.585            0.921                           0.584
Non-Operating Income                                                    @SF                    0.691           (0.084)       20            (0.237)          0.161                           (0.708)
Special Items                                                          0.000                   0.000            0.000        15            0.000            0.000                           (0.780)
PreTax Income                                                          7.576                   8.310           10.742        10
                                                                                                                                           6.993            4.810                           3.505
Income Before Extra Items                                              4.871                   5.335            6.902                      4.618            3.110                           2.355
                                                                                                                                  5
 Net Income                                                            4.871                   5.335            6.902                      4.618            3.110                           2.355
                                                                                                                                  0
EPS excluding Extra Items (Primary)                                     2.63                    2.86             3.39                          2.15            1.41                             1.07
                                                                                                                              -5
EPS excl Extra Items (Fully Diluted)                                    2.59                    2.81             3.32                          2.11            1.39                             1.03
                                                                                                                                  6


                                                                                                                                           6


                                                                                                                                                   7


                                                                                                                                                             7


                                                                                                                                                                     8


                                                                                                                                                                               8


                                                                                                                                                                                       9


                                                                                                                                                                                                9


                                                                                                                                                                                                         0


                                                                                                                                                                                                                    0
                                                                                                                               9


                                                                                                                                          9


                                                                                                                                                   9


                                                                                                                                                           9


                                                                                                                                                                      9


                                                                                                                                                                               9


                                                                                                                                                                                       9


                                                                                                                                                                                                9


                                                                                                                                                                                                        0


                                                                                                                                                                                                                   0
                                                                                                                            2Y


                                                                                                                                       4Y


                                                                                                                                                2Y


                                                                                                                                                        4Y


                                                                                                                                                                   2Y


                                                                                                                                                                            4Y


                                                                                                                                                                                    2Y


                                                                                                                                                                                             4Y


                                                                                                                                                                                                     2Y


                                                                                                                                                                                                                4Y
                                                                                                                           Q


                                                                                                                                       Q


                                                                                                                                               Q


                                                                                                                                                       Q


                                                                                                                                                                 Q


                                                                                                                                                                           Q


                                                                                                                                                                                   Q


                                                                                                                                                                                            Q


                                                                                                                                                                                                    Q


                                                                                                                                                                                                                Q
      BALANCE SHEET                                                  Mar01                Dec00            Dec99                           #N/A             #N/A                            #N/A
Cash & Short Term Investments                                          2.824                   6.216            0.347                      7.120            1.524                           0.379
Receivables - Total                                                   18.282               16.723              20.161                   16.821          13.882r i c e / B o o k 14.584
                                                                                                                                                             P
Inventories - Total                                                   16.733               16.014              15.966                   12.050          14.293                             15.184
  Total Current Assets                                                41.308               41.525              39.066                   38.686          32.042                             32.834
                                                                                                                            1.2
Plant, Property, Equipment - Net                                      30.316               24.727              26.891                   22.105          19.581                             18.818
Debt in Current Liabilities                                            3.534                   2.158            4.182        1
                                                                                                                                           2.526            1.900                           1.900
Accounts Payable                                                      14.222                   4.437            7.263                      5.124            3.514                           5.182
  Current Liabilities-Total                                           17.824               17.280              23.057       0.8         20.492          13.449                             16.213
LT Debt-Total                                                         17.002                   5.147            1.875                      4.284            6.400                           6.500
Preferred Stock                                                        0.000                   0.000            0.000       0.6            0.000            0.000                           0.000
Common Stock                                                           0.643                   0.643            0.643                      0.663            0.663                           0.663
Capital Surplus                                                        1.985                   1.985            1.983       0.4            3.484            3.484                           3.484
Retained Earnings                                                     48.057               48.138              42.803                   35.901          31.283                             28.173
Treasury Stock-Total $ Amt                                             9.247                   8.953            6.386       0.2
                                                                                                                                           3.810            3.572                           2.970
Common Equity-Total                                                   41.438               41.813              39.043                   36.238          31.858                             29.350
                                                                                                                             0
Stockholders' Equity                                                  41.438               41.813              39.043                   36.238
                                                                                                                                       Dec96            31.858
                                                                                                                                                       Dec97              Dec98             29.350
                                                                                                                                                                                           Dec99          Dec00
  Assets-Total                                                        80.398               68.250              67.751                   63.617          54.355                             53.893


                               5- Y E A R A N N U A L S A L E S G R O W T H                                                           PER SH ARE O V ERVIEW

    25%                                                                                                                     Qtr End                     EPS                 Dividends
    20%                                                                                                                  Mar01                              -0.04                  0.000
    15%
                                                                                                                         Dec00                              1.61                   0.000
    10%
     5%                                                                                                                  Sep00                              0.50                   0.000
     0%                                                                                                                  Jun00                              0.56                   0.000
    -5%                                                                                                                  Mar00                              0.20                   0.000
   -10%                                                                                                                  Dec99                              1.27                   0.000
      Dec96                    Dec97                 Dec98                Dec99                        Dec00                                                0.80
                                                                                                                         Sep99                                                     0.000
                                                                                                                         Jun99                              0.99                   0.000
                                                                                                                         Mar99                              0.34                   0.000
FLORIDA ROCK INDS
                                 TICKER:      FRK                                                     ADDRESS: 155 E 21st St
                              EXCHANGE: New York Stock Exchange                                                      Jacksonville                  FL               32206-2136
                              INDUSTRY: CONCRETE,GYPSUM,PLASTER PDS
                          CURRENT BETA 0.37


                  1,400.000                                                                                                                                                      $60.00
                  1,200.000                                                                                                                                                      $50.00
                  1,000.000
                                                                                                                                                                                 $40.00
         Volume


                                                                                                                                                                                                 Price
                   800.000
                                                                                                                                                                                 $30.00
                   600.000
                                                                                                                                                                                 $20.00
                   400.000
                   200.000                                                                                                                                                       $10.00

                     0.000                                                                                                                                                       $0.00
                                8

                                8


                                               98


                                                                       9

                                                                       9


                                                                                          99


                                                                                                                   0

                                                                                                                   0


                                                                                                                                       00


                                                                                                                                                                         1
                                                         9

                                                         9


                                                                                                    0

                                                                                                    0


                                                                                                                                                    1

                                                                                                                                                    1
                                       98


                                                                                  99


                                                                                                                               00
                         n9

                             g9


                                                      b9

                                                       r9

                                                                 n9

                                                                    g9


                                                                                                 b0

                                                                                                  r0

                                                                                                             n0

                                                                                                                g0


                                                                                                                                                 b0

                                                                                                                                                  r0

                                                                                                                                                                      n0
                                             ec


                                                                                        ec


                                                                                                                                     ec
                                    ct


                                                                               ct


                                                                                                                            ct
                                                    Ap


                                                                                               Ap


                                                                                                                                               Ap
                       Ju

                          Au


                                                    Fe


                                                               Ju

                                                                 Au


                                                                                               Fe


                                                                                                           Ju

                                                                                                             Au


                                                                                                                                               Fe


                                                                                                                                                                    Ju
                                    O


                                                                               O


                                                                                                                        O
                                            D


                                                                                       D


                                                                                                                                    D
                                                             12 Mo Ended Fiscal Year End
      IN C OME ST A T EME N T                                     Mar01                   Sep00         Sep99                          #N/AR O#N/A& N E T P R#N/AT
                                                                                                                                          G    SS             O FI
Sales-Net                                                         666.546                647.753        579.302                    492.467               #N/A                            #N/A
                                                                                                                                                            MARGINS
 Cost of Goods Sold                                               448.277                448.046        408.282                    350.888 326.941                               290.804
 SG&A Expense                                                         71.251              65.131           54.782                   47.290          43.096                           36.768
                                                                                                                         40
Operating Income                                                  147.018                134.576        116.238                     94.289          86.766                           71.101
                                                                                                                         35
Depreciation & Amortization                                           59.187              51.960           38.497                   33.433          30.688                           28.766
Interest Expense                                                      11.451              10.077            4.334        30
                                                                                                                                       1.803            1.110                         2.012
Non-Operating Income                                                   1.578               3.358            7.160        25            3.133            1.402                         0.787
Special Items                                                          2.014              16.256           (8.719)       20            (2.209)          0.000                         0.000
PreTax Income                                                         79.972              92.153           71.848        15
                                                                                                                                    59.977          56.370                           41.110
Income Before Extra Items                                             51.817              59.714           46.557                   38.860          37.142                           27.000
                                                                                                                         10
 Net Income                                                           51.817              59.714           46.557                   38.860          37.142                           27.000
                                                                                                                              5
EPS excluding Extra Items (Primary)                                     2.79                   3.21          2.47                          2.06            1.98                          1.43
                                                                                                                              0
EPS excl Extra Items (Fully Diluted)                                    2.73                   3.15          2.42                          2.02            1.94                          1.42
                                                                                                                              6


                                                                                                                                       7


                                                                                                                                               7


                                                                                                                                                        8


                                                                                                                                                                8


                                                                                                                                                                         9


                                                                                                                                                                                 9


                                                                                                                                                                                         0


                                                                                                                                                                                                  0


                                                                                                                                                                                                             1
                                                                                                                           9


                                                                                                                                      9


                                                                                                                                               9


                                                                                                                                                       9


                                                                                                                                                                9


                                                                                                                                                                         9


                                                                                                                                                                                 9


                                                                                                                                                                                         0


                                                                                                                                                                                                 0


                                                                                                                                                                                                            0
                                                                                                                        3Y


                                                                                                                                   1Y


                                                                                                                                            3Y


                                                                                                                                                    1Y


                                                                                                                                                             3Y


                                                                                                                                                                      1Y


                                                                                                                                                                              3Y


                                                                                                                                                                                      1Y


                                                                                                                                                                                              3Y


                                                                                                                                                                                                         1Y
                                                                                                                        Q


                                                                                                                                   Q


                                                                                                                                           Q


                                                                                                                                                   Q


                                                                                                                                                            Q


                                                                                                                                                                     Q


                                                                                                                                                                             Q


                                                                                                                                                                                     Q


                                                                                                                                                                                             Q


                                                                                                                                                                                                         Q
      BALANCE SHEET                                               Mar01                   Sep00         Sep99                          #N/A            #N/A                          #N/A
Cash & Short Term Investments                                          2.560               3.372            3.726                      4.457        18.433                            4.995
Receivables - Total                                                   80.777              82.468           75.386                   65.334          56.723r i c e / B o o k 52.436
                                                                                                                                                         P
Inventories - Total                                                   33.435              32.831           23.634                   25.535          22.587                           23.475
  Total Current Assets                                            125.859                123.348        122.465                    100.607 104.194                                   87.082
                                                                                                                        2.5
Plant, Property, Equipment - Net                                  487.701                486.544        419.917                    321.055 250.005                               233.858
Debt in Current Liabilities                                           13.944               3.243           35.813                   10.824              2.747                         3.914
                                                                                                                         2
Accounts Payable                                                      34.288              40.624           41.590                   38.783          32.867                           28.602
  Current Liabilities-Total                                           76.568              80.717        107.566                     74.786          55.676                           51.857
LT Debt-Total                                                     152.294                163.620           96.989       1.5         23.935          10.859                           16.862
Preferred Stock                                                        0.000               0.000            0.000                      0.000            0.000                         0.000
Common Stock                                                           1.897               1.897            1.897        1             1.897            0.949                         0.949
Capital Surplus                                                       17.071              17.549           18.249                   18.796          19.001                           17.400
Retained Earnings                                                 392.443                373.650        321.832                    281.882 247.733                               215.195
                                                                                                                        0.5
Treasury Stock-Total $ Amt                                            11.436              13.147            3.720                      2.689            3.068                         5.394
Common Equity-Total                                               399.975                379.949        338.258                    299.886 264.615                               228.150
                                                                                                                         0
Stockholders' Equity                                              399.975                379.949        338.258                    299.886 264.615
                                                                                                                                   Sep96   Sep97                    Sep98        228.150
                                                                                                                                                                                 Sep99             Sep00
  Assets-Total                                                    697.191                690.045        604.168                    451.556 382.616                               346.709


                              5- Y E A R A N N U A L S A L E S G R O W T H                                                        PER SH ARE O V ERVIEW

   20%                                                                                                                  Qtr End                     EPS               Dividends
                                                                                                                     Mar01                           0.68                    0.125
   15%
                                                                                                                     Dec00                           0.58                    0.125
   10%                                                                                                               Sep00                           0.58                    0.125
    5%                                                                                                               Jun00                           0.95                    0.100
                                                                                                                     Mar00                           0.45                    0.100
    0%                                                                                                               Dec99                           1.23                    0.100
     Sep96                    Sep97                  Sep98                Sep99                    Sep00                                             0.68
                                                                                                                     Sep99                                                   0.100
                                                                                                                     Jun99                           0.74                    0.125
                                                                                                                     Mar99                           0.51                    0.000
STEWART ENTERPRISES -CL A
                                   TICKER:   STEI                                     ADDRESS: 110 Veterans Memorial Blvd
                               EXCHANGE: NASDAQ                                                     Metairie                 LA              70005-3027
                                INDUSTRY: PERSONAL SERVICES                               PHONE: 504-837-5880
                         CURRENT BETA 1.00


                 120,000.000                                                                                                                              $35.00

                 100,000.000                                                                                                                              $30.00
                                                                                                                                                          $25.00
                  80,000.000
        Volume


                                                                                                                                                                       Price
                                                                                                                                                          $20.00
                  60,000.000
                                                                                                                                                          $15.00
                  40,000.000
                                                                                                                                                          $10.00
                  20,000.000                                                                                                                              $5.00
                       0.000                                                                                                                              $0.00
                              8

                              8


                                                  98


                                                                 9

                                                                 9


                                                                              99


                                                                                                 0

                                                                                                 0


                                                                                                                         00
                             8


                                                   9

                                                                9


                                                                               0

                                                                                                0


                                                                                                                          1

                                                                                                                                                  1
                                                  98


                                                                              99


                                                                                                                         00
                           r9

                           n9

                           g9


                                               b9

                                                              r9

                                                              n9

                                                              g9


                                                                             b0

                                                                                              r0

                                                                                              n0

                                                                                              g0


                                                                                                                        b0

                                                                                                                                                r0
                                              ec


                                                                            ec


                                                                                                                       ec
                                                                          ct


                                                                                                                   ct
                                               ct
                        Ap


                                                           Ap


                                                                                           Ap


                                                                                                                                             Ap
                        Ju

                        Au


                                             Fe


                                                           Ju

                                                           Au


                                                                           Fe


                                                                                           Ju

                                                                                           Au


                                                                                                                      Fe
                                             O


                                                                         O


                                                                                                                  O
                                             D


                                                                           D


                                                                                                                      D
                                                        12 Mo Ended Fiscal Year End
      INCOME STATEMENT                                       Oct00           Oct00        Oct99                    #N/A #N/A NET PROFIT
                                                                                                                     GROSS &       #N/A
Sales-Net                                                    734.801      734.801         756.108                648.365           #N/A                         #N/A
                                                                                                                                       MARGINS
 Cost of Goods Sold                                          501.494      507.179         500.820                416.839 357.442                          293.568
 SG&A Expense                                                 19.763         19.763        19.161                 16.621         15.402                    14.096
                                                                                                        40
Operating Income                                             213.544      207.859         236.127                214.905 159.742                          125.723
Depreciation & Amortization                                   54.267         48.582        44.887       30        35.542         17.972                    21.701
Interest Expense                                              56.284         56.284        52.174                 43.821         38.031                    26.051
                                                                                                        20
Non-Operating Income                                           2.194          2.194         3.485                  6.184          2.738                        2.504
Special Items                                                  0.000          0.000         0.000       10       (76.762)         0.000                        1.600
PreTax Income                                                105.187      105.187         142.551                 64.964 106.477                           82.075
                                                                                                         0
Income Before Extra Items                                     66.794         66.794        90.520                 41.902         69.742                    51.297
 Net Income                                                   66.794         66.794        40.419      -10        41.902         67.418                    51.297
EPS excluding Extra Items (Primary)                             0.63           0.63          0.84                     0.43            0.79                      0.62
                                                                                                       -20
EPS excl Extra Items (Fully Diluted)                            0.63           0.63          0.84                     0.43            0.79                      0.62
                                                                                                         96

                                                                                                         96

                                                                                                                     96

                                                                                                                     96

                                                                                                                               97

                                                                                                                               97

                                                                                                                                          97

                                                                                                                                          97

                                                                                                                                                    98

                                                                                                                                                           98

                                                                                                                                                           98

                                                                                                                                                                   98

                                                                                                                                                                   00

                                                                                                                                                                                 00

                                                                                                                                                                                        00
                                                                                                       1Y

                                                                                                       2Y

                                                                                                                   3Y

                                                                                                                   4Y

                                                                                                                             1Y

                                                                                                                             2Y

                                                                                                                                        3Y

                                                                                                                                        4Y

                                                                                                                                                  1Y

                                                                                                                                                         2Y

                                                                                                                                                         3Y

                                                                                                                                                                 4Y

                                                                                                                                                                 2Y

                                                                                                                                                                               3Y

                                                                                                                                                                                      4Y
                                                                                                       Q

                                                                                                             Q

                                                                                                                  Q

                                                                                                                      Q

                                                                                                                             Q

                                                                                                                                  Q

                                                                                                                                       Q

                                                                                                                                             Q

                                                                                                                                                 Q

                                                                                                                                                      Q

                                                                                                                                                           Q

                                                                                                                                                                Q

                                                                                                                                                                    Q

                                                                                                                                                                          Q

                                                                                                                                                                                  Q
      BALANCE SHEET                                          Oct00           Oct00        Oct99                    #N/A          #N/A                          #N/A
Cash & Short Term Investments                                 98.868         98.868        77.426                 36.853         36.255                    27.094
Receivables - Total                                          177.474      177.474         176.215                             Price/Book 109.129
                                                                                                                 171.849 129.760
Inventories - Total                                           60.649         60.649        51.431                 48.833         43.044                    31.044
  Total Current Assets                                       341.054      341.054         311.069                261.405 213.751                          171.542
                                                                                                        3
Plant, Property, Equipment - Net                             447.929      447.929         447.045                381.739 329.404                          278.781
Debt in Current Liabilities                                   29.857         29.857        12.582      2.5
                                                                                                                  11.219         33.973                        4.240
Accounts Payable                                              20.342         20.342        21.802                 19.048         16.705                    11.889
  Current Liabilities-Total                                  134.476      134.476         133.476       2        118.782 107.137                           73.482
LT Debt-Total                                                920.670      920.670         938.831                913.215 524.351                          515.901
Preferred Stock                                                0.000          0.000         0.000      1.5         0.000          0.000                        0.000
Common Stock                                                 106.832      106.832         106.219                 98.028         48.682                    41.800
Capital Surplus                                              673.658      673.658         671.891       1        492.177 526.180                          306.706
Retained Earnings                                            294.167      294.167         278.502                249.085 244.708                          198.941
Treasury Stock-Total $ Amt                                     0.000          0.000         0.000      0.5
                                                                                                                   0.000          0.000                        0.000
Common Equity-Total                                        1,074.657     1,074.657    1,056.612                  839.290 819.570                          547.447
                                                                                                        0
Stockholders' Equity                                       1,074.657     1,074.657    1,056.612                839.290 819.570
                                                                                                               Oct96   Oct97                 Oct98         547.447
                                                                                                                                                            Oct99        Oct00
  Assets-Total                                             2,337.008     2,337.008    2,283.880              2,071.802 #######                           1,365.941


                                5-YEAR ANNUAL SALES GROWTH                                                   PER SHARE OVERVIEW

                                                                                                       Qtr End                   EPS             Dividends
 25%
 20%                                                                                                Oct00                        0.10                 0.000
 15%                                                                                                Jul00                        0.17                 0.020
 10%                                                                                                Apr00                        0.18                 0.020
  5%                                                                                                Jan00                        0.18                 0.020
  0%                                                                                                Oct99                        0.15                 0.020
 -5%                                                                                                Jul99                        0.21                 0.020
   Oct96                       Oct97            Oct98            Oct99            Oct00             Apr99                        0.24                 0.020
                                                                                                    Jan99                        0.24                 0.020
                                                                                                    Oct98                        0.22                 0.020
U S CONCRETE INC
                                  TICKER:      RMIX                                                  ADDRESS: 1300 Post Oak Blvd Ste 1200
                               EXCHANGE: NASDAQ                                                                     Houston                       TX              77056-3018
                               INDUSTRY: CONCRETE,GYPSUM,PLASTER PDS
                           CURRENT BETA -1.16


                   3,500.000                                                                                                                                                    $12.00
                   3,000.000                                                                                                                                                    $10.00
                   2,500.000
                                                                                                                                                                                $8.00
          Volume


                                                                                                                                                                                                 Price
                   2,000.000
                                                                                                                                                                                $6.00
                   1,500.000
                                                                                                                                                                                $4.00
                   1,000.000
                    500.000                                                                                                                                                     $2.00

                      0.000                                                                                                                                                     $0.00
                                 8

                                 8


                                                98


                                                                        9

                                                                        9


                                                                                         99


                                                                                                                  0

                                                                                                                  0


                                                                                                                                     00


                                                                                                                                                                        1
                                                          9

                                                          9


                                                                                                   0

                                                                                                   0


                                                                                                                                                   1

                                                                                                                                                   1
                                        98


                                                                                 99


                                                                                                                             00
                          n9

                              g9


                                                       b9

                                                        r9

                                                                n9

                                                                     g9


                                                                                                b0

                                                                                                 r0

                                                                                                            n0

                                                                                                               g0


                                                                                                                                                b0

                                                                                                                                                 r0

                                                                                                                                                                    n0
                                              ec


                                                                                       ec


                                                                                                                                   ec
                                     ct


                                                                              ct


                                                                                                                          ct
                                                     Ap


                                                                                              Ap


                                                                                                                                              Ap
                        Ju

                           Au


                                                     Fe


                                                              Ju

                                                                  Au


                                                                                              Fe


                                                                                                          Ju

                                                                                                            Au


                                                                                                                                              Fe


                                                                                                                                                                  Ju
                                     O


                                                                              O


                                                                                                                       O
                                             D


                                                                                      D


                                                                                                                                  D
                                                           12 Mo Ended Fiscal Year End
      IN C OME ST A T EME N T                                      Mar01                 Dec00         Dec99                          #N/AR O#N/A& N E T P R#N/AT
                                                                                                                                         G    SS             O FI
Sales-Net                                                          416.581              394.636        167.912                    66.499               #N/A                              #N/A
                                                                                                                                                           MARGINS
 Cost of Goods Sold                                                334.776              314.297        135.195                    53.974           43.794                             @NA
 SG&A Expense                                                        31.207              27.741            9.491                      4.712           4.265                           @NA
                                                                                                                        25
Operating Income                                                     50.598              52.598           23.226                      7.813           5.572                           @NA
Depreciation & Amortization                                          12.099              11.212            3.453        20
                                                                                                                                      0.930           1.330                           @NA
Interest Expense                                                     16.814              14.095            1.708        15            0.165           0.226                           @NA
Non-Operating Income                                                  1.291               1.319            0.663                      0.036           0.026                           @NA
                                                                                                                        10
Special Items                                                         0.000               0.000           (2.880)                     0.000           0.000                           @NA
                                                                                                                             5
PreTax Income                                                        22.976              28.610           15.848                      6.754           4.042                           @NA
Income Before Extra Items                                            13.516              16.860            8.190             0        6.654           4.499                           @NA
 Net Income                                                          13.516              16.860            8.190                      6.654           4.499                           @NA
                                                                                                                         -5
EPS excluding Extra Items (Primary)                                    0.63                   0.78          0.70                          0.43         @NA                            @NA
                                                                                                                        -10
EPS excl Extra Items (Fully Diluted)                                   0.63                   0.78          0.70                          0.43         @NA                            @NA
                                                                                                                             6


                                                                                                                                      6


                                                                                                                                              7


                                                                                                                                                       7


                                                                                                                                                               8


                                                                                                                                                                        8


                                                                                                                                                                                9


                                                                                                                                                                                         9


                                                                                                                                                                                                  0


                                                                                                                                                                                                             0
                                                                                                                          9


                                                                                                                                     9


                                                                                                                                              9


                                                                                                                                                      9


                                                                                                                                                              9


                                                                                                                                                                        9


                                                                                                                                                                                9


                                                                                                                                                                                        9


                                                                                                                                                                                                0


                                                                                                                                                                                                            0
                                                                                                                       2Y


                                                                                                                                  4Y


                                                                                                                                           2Y


                                                                                                                                                   4Y


                                                                                                                                                           2Y


                                                                                                                                                                     4Y


                                                                                                                                                                             2Y


                                                                                                                                                                                     4Y


                                                                                                                                                                                             2Y


                                                                                                                                                                                                         4Y
                                                                                                                      Q


                                                                                                                                  Q


                                                                                                                                          Q


                                                                                                                                                  Q


                                                                                                                                                           Q


                                                                                                                                                                    Q


                                                                                                                                                                            Q


                                                                                                                                                                                     Q


                                                                                                                                                                                             Q


                                                                                                                                                                                                         Q
      BALANCE SHEET                                                Mar01                 Dec00         Dec99                          #N/A            #N/A                           #N/A
Cash & Short Term Investments                                         2.673               0.711            0.627                      4.213           1.945                           @NA
Receivables - Total                                                  69.589              62.641           45.581                  10.353              8.741r i c e / B o o k
                                                                                                                                                          P                           @NA
Inventories - Total                                                  11.947               9.494            4.351                      0.792           0.941                           @NA
  Total Current Assets                                               92.757              77.952           52.317                  16.347           12.087                             @NA
                                                                                                                       1.2
Plant, Property, Equipment - Net                                     89.505              82.993           53.949                      9.138           6.784                           @NA
Debt in Current Liabilities                                           0.085               0.107            0.140        1
                                                                                                                                      1.006           0.776                           @NA
Accounts Payable                                                     50.706              25.283           27.473                      7.042           5.427                           @NA
  Current Liabilities-Total                                          50.791              36.420           37.739       0.8            8.916           7.188                           @NA
LT Debt-Total                                                      176.242              157.027           57.235                      2.524           1.884                           @NA
Preferred Stock                                                       0.000               0.000            0.000       0.6            0.000           0.000                           @NA
Common Stock                                                          0.023               0.022            0.019                      0.070           0.070                           @NA
Capital Surplus                                                    131.795              127.170        104.271         0.4            0.554           0.554                           @NA
Retained Earnings                                                    21.536              23.363            6.503                  14.530           10.107                             @NA
Treasury Stock-Total $ Amt                                            0.000               0.000            0.000       0.2
                                                                                                                                      0.000           0.000                           @NA
Common Equity-Total                                                153.354              150.555        110.793                    15.154           10.731                             @NA
                                                                                                                        0
Stockholders' Equity                                               153.354              150.555        110.793                     15.154
                                                                                                                                  Dec96            10.731
                                                                                                                                                  Dec97            Dec98               @NA
                                                                                                                                                                                    Dec99          Dec00
  Assets-Total                                                     394.374              355.837        212.734                    26.640           19.837                             @NA


                               5- Y E A R A N N U A L S A L E S G R O W T H                                                      PER SH ARE O V ERVIEW

   200%                                                                                                                Qtr End                     EPS               Dividends
                                                                                                                    Mar01                          -0.08                    0.000
   150%
                                                                                                                    Dec00                           0.09                    0.000
   100%                                                                                                             Sep00                           0.31                    0.000
    50%                                                                                                             Jun00                           0.31                    0.000
                                                                                                                    Mar00                           0.08                    0.000
     0%                                                                                                             Dec99                           0.24                    0.000
      Dec96                    Dec97                  Dec98              Dec99                    Dec00                                             0.30
                                                                                                                    Sep99                                                   0.000
                                                                                                                    Jun99                          -0.23                    @NA
                                                                                                                    Mar99                           0.06                    @NA
Appendix III                                      Assumptions for the Income Approach

The valuation conclusions determined under the Capitalization of Earnings Method are dependent
upon certain key assumptions incorporated into the analysis, such as the assumed level of risk (as
embodied in the chosen capitalization rate) and the expected growth rate.

The Capitalization of Earnings Method is premised upon the concept of the present value of a
perpetuity, which is a cash stream that is expected to be received each year for the indefinite future.
The application of this approach is widespread, and the methodology is uniformly accepted among
valuation professionals and other financial practitioners.

Previously in this report we presented the assumptions underlying our determination of the normalized
level of annual cash flow for the subject company. This cash flow is then divided by the company’s
cost of capital minus its long-term growth rate.

In determining an appropriate weighted average cost of capital (“WACC”), we must consider such
things as the returns investors can achieve on alternate investments, the time-value of money as well as
the risks associated with the subject company actually achieving the anticipated level of cash flow. In
quantifying the expected rate of growth in cash flow we must consider such things as inflation,
expectations for the guideline companies and the subject industry, and input from management of the
subject company. Because we are establishing a growth rate that can be achieved into perpetuity, we
generally select numbers that are lower than the anticipated growth rate in the short term.

Following are definitions of the key variables involved in the computation of the WACC for the
subject company:

Pre-tax Cost of Debt (PD) is the subject company’s marginal cost of borrowing long-term funds.

After-tax Cost of Debt (AD) is the subject company’s marginal cost of borrowing long-term funds
after factoring in the benefits of the deductibility of interest.

Risk-free Rate of Return (RF) is the return an investor would require as of the Valuation Date to
invest in a long-term security with essentially no risk. The best proxy for a risk-free long-term security
is the 10-year U.S. Treasury bond.

Equity Risk Premium (EP) is the premium that investors have historically required to invest in stocks
over the returns that were available historically on U.S. Treasury bonds. We utilize data from relevant
studies performed by Ibbotson & Associates.

Beta (B) represents the volatility of an individual stock (as a result of the risks inherent in the
underlying business) relative to the volatility of the overall stock market. A beta of greater than 1.0
means the subject stock is more volatile than the overall stock market; a beta of less than 1.0 means the
subject stock is less volatile than the overall stock market. We analyze the betas of the comparative
guideline public companies in order to estimate an appropriate beta for the subject company.
Appendix III                                      Assumptions for the Income Approach

Small-Company Premium (SCP) is the incremental return historically required by investors in small
stocks over the return required by investors in the overall stock market, after considering the impact of
beta. We use the results of studies by Ibbotson & Associates and PriceWaterhouseCoopers when
assigning a SCP.

Company-Specific Premium (CSP) is the incremental return required by investors in early-stage
companies and companies with extraordinary risk characteristics, after considering the small-company
premium and the impact of beta.

Growth (G) is the estimated growth in annual cash flows that can be sustained in perpetuity. It is
important to understand that this estimated growth number is typically relatively low (i.e., 1% to 5%),
because of the assumption that this growth occurs forever.

Capital Structure (CS) refers to the optimal percentage of debt and equity that the company would
operate with over time given its specific circumstances and the norms within its industry. This may
differ from the existing capital structure of the subject company.

The WACC is the after-tax cost of debt times the percentage of debt in the subject company’s optimal
capital structure, plus the cost of equity (after-tax and pre-tax are the same because dividends are not
tax deductible) times the percentage of equity in the subject company’s optimal capital structure.

Following are the assumptions used to derive the capitalization rate for purposes of valuing the subject
company:

PD                  =               11.0%
AD                  =                6.6%
RF                  =                6.5%
EP                  =                8.0%
B                   =                 0.40
SCP                 =                3.0%
CSP                 =                2.0%
G                   =                2.5%
CS ( % Debt)        =               20.0%
CS (% Equity)       =               80.0%
Cost of Debt        =                6.6%
Cost of Equity      =               14.7%
WACC                =               13.1%

Weighted Average Cost of Capital (WACC) = (Debt% * AD) + (Equity% * (RF + SCP +CSP+ B(EP))

And the Capitalization Rate = WACC - G
Appendix IV                                                         Premiums & Discounts

Control Premiums

A controlling interest in a company is considered to have greater value than a non-controlling
(minority) interest because the holder of a controlling interest has the ability to implement changes in
businesses policies, while the holder of a minority interest does not. Accordingly, when the subject
interest being valued is a controlling interest, we must apply a control premium. Conversely, when the
subject interest being valued is a non-controlling (minority) interest, we must apply a discount for lack
of control. Control premiums can vary tremendously. Factors that affect the magnitude of a control
premium include:

       •   The nature and magnitude of non-operating assets.
       •   The nature and magnitude of discretionary expenses.
       •   The perceived quality of existing management.
       •   The nature and magnitude of business opportunities which are not currently being exploited.
       •   The ability to integrate the acquiree into the acquiror’s business or distribution channels.1

Mergerstat’s Control Premium Study defines a control premium as “the additional consideration that
an investor would pay over a marketable minority equity value (i.e., current, publicly-traded stock
prices) in order to own a controlling interest in the common stock of a company.”2 The primary
objective of control premium studies is to measure the premium over marketable minority interest
transaction prices at which controlling interests in the same class of stock of the same company have
been acquired. The percentage of the per share acquisition price over the pre-announcement minority
public market per share trading price is commonly called the control premium. Conversely, the
percentage below the per share acquisition price at which the minority stock had been trading in the
public markets is commonly called the minority interest discount.

In reality, it might be more appropriate to refer to the subject premium as an acquisition premium
rather than a control premium because control level transaction prices often reflect additional factors
over and above the noted elements of control, such as synergistic benefits.

If a controlling interest in a company is being valued using multiples derived from trading prices of
minority interests in publicly-traded stocks, such as in the Guideline Public Company Method, then a
control premium must be applied when determining certain comparative guideline public company
stock value multiples. However, if a controlling interest in the subject company is being valued using a
method that already considers the company on a control basis such as the Adjusted Net Asset Value
Method, the Capitalization of Earnings Method, as applied herein, the Discounted Cash Flow Method,
or the Guideline Transaction Method, then a control premium need not be applied.


1
    Mergerstat Control Premium Study 3rd Quarter 2000 (Los Angeles: Mergerstat LP)
2
    Ibid.
Appendix IV                                                            Premiums & Discounts

Mergerstat Review’s 2001 Control Premium Study for SIC codes in the 3754-3756 range (Concrete
Products) yielded the following control premium data (30 transactions):

                             Range                               3.4% - 59.3%
                             Median                                 19.9%
                             Mean                                   21.7%

We have elected to apply a median control premium from the above study as rounded to 20%.

Discounts for Lack of Marketability

Because the subject company is privately held, its shareholders have no access to an active, public
trading market in the subject company's shares. Without market access, an investor's ability to control
the timing of potential gains, to avoid losses, and to minimize the opportunity costs associated with the
inability to direct funds to a more promising investment are severely impaired. Accordingly, it is
appropriate to discount the value of illiquid securities to reflect this differential in marketability.

If an investor in a publicly-traded company needs cash or becomes dissatisfied with the performance of
the issuing company or its management team, he/she can sell his/her interest almost immediately at its
market value. An investor in a publicly-traded company also enjoys a certain level of assurance that
management will operate the issuing company in the best interest of the shareholders if effective
governance mechanisms are in place. As a result of regulatory reporting requirements and analyst
coverage, an investor in a publicly-traded company also has access to significant information
concerning a company's performance.

There are two categories of empirical data that assist appraisers and investors in quantifying
appropriate discounts for lack of marketability: 1) discounts on sales of restricted shares of publicly-
traded companies (restricted stock transactions); and 2) prices on earlier sales of privately-held
company shares compared to subsequent per share prices in initial public offerings for the same or a
similar class of shares of the same company (pre-IPO transactions). Studies of restricted stock
transactions are generally considered to provide better data because they directly measure the
difference between the prices of two otherwise identical securities at the same point in time.

Restricted securities are subject to the marketability restrictions of Rule 144 of the Securities Act of
1933. Rule 144 was adopted by the Securities and Exchange Commission (“SEC”) in 1972. Under
Rule 144, unregistered securities had to be held for a minimum of two years before they could be sold.
After this two-year holding period expired, the restricted securities could be sold only in accord with
certain volume limit provisions. To qualify for an exemption under Rule 144, the total number of
restricted securities sold in any three-month period cannot exceed the greater of: 1) one percent of the
total number of the issuing company’s outstanding shares, or 2) the average weekly reported trading
volume during the four weeks preceding the sale (these are referred to as “dribble out” provisions).
Appendix IV                                                             Premiums & Discounts
Rule 144 also allowed that any person or entity who is not considered an affiliate of the issuer could
sell all remaining securities, without being subject to the “dribble out” provisions, after a holding
period of a minimum of three years. In 1990, Rule 144 was amended. Prior to this amendment, if a
purchaser of restricted securities sold such securities in a privately-negotiated transaction, the required
holding period would start anew for the new buyer. The 1990 amendment allowed the new buyer of
restricted securities to “tack” the holding period of the previous owner(s) of the restricted securities
onto his own holding period, but only if the previous owner was not an affiliate of the issuing
company. Accordingly, the 1990 amendment effectively increased the liquidity of restricted securities.
In 1997, Rule 144 was amended once again. The 1997 amendment shortened the initial holding period
from two years to one year and the holding period for non-affiliates from three years to two years.

Most of the studies discussed herein involve transactions taking place before the 1990 amendment and
none of the studies discussed herein involve transactions taking place after the 1997 amendment. In
some ways, this makes the data derived from the studies discussed herein even more relevant than data
that might be derived from studies involving transactions taking place after the 1997 amendment. This
is because restricted securities existing prior to the 1990 and 1997 amendments were less liquid than
restricted securities existing subsequent to the 1990 and 1997 amendments and were, therefore, more
similar to securities of privately-held companies, which have no trading market.

The Internal Revenue Service, through Revenue Ruling 77-287, has set forth guidelines for the
determination of discounts for lack of marketability for securities subject to restriction under Rule 144.
Revenue Ruling 77-287 notes two primary factors that a purchaser of restricted securities must
consider:

     •   “The risk that the underlying value of the stock will change in a way that, absent the
         restrictive provisions, would have prompted a decision to sell.”
     •   “The risk that the contemplated means of legally disposing of the stock may not materialize.”

Revenue Ruling 77-287 sets forth that the value of a security restricted under Rule 144 is less than the
value of that security’s freely-traded counterpart. Revenue Ruling 77-287 also provides the following
guidelines for the determination of discounts for lack of marketability for securities subject to
restriction under Rule 144:

     •   No automatic formulas should be used to determine the discount for lack of marketability.
     •   The discount for lack of marketability is a function of the earnings, net assets and sales of the
         subject entity.
     •   The discount for lack of marketability is a function of the trading market for the equivalent
         freely-traded stock.
     •   The discount for lack of marketability is a function of the resale restrictions applicable to the
         restricted security.
Appendix IV                                                                                          Premiums & Discounts

                                                     Institutional Investor Study

Revenue Ruling 77-287 is based on the Institutional Investor Study Report4 (“SEC Study”). The SEC
Study measured discounts in transactions occurring from 1966-1969 that involved securities that were
restricted under provisions similar to Rule 144. Based on more than 300 such transactions, the SEC
Study found the following:

        •    Companies Sorted By Exchange                                                           Discount Range

                     NYSE                                                                           10% - 20%
                     ASE                                                                            20% - 30%
                     OTC - Reporting                                                                20% - 30%
                     OTC - Non-reporting                                                            30% - 40%

        •    Companies Sorted By Sales

                     $100 mm         +                                                              10% - 20%
                     $20 mm          -    $100 mm                                                   10% - 20%
                     $ 5 mm          -    $ 20 mm                                                   10% - 20%
                     $ 1 mm          -    $ 5 mm                                                    30% - 40%
                     $ 0 mm          -    $ 1 mm                                                    30% - 40%

        •    Companies Sorted By Earnings

                     $10 mm +                                                                       10% - 20%
                     $ 1 mm - $ 10 mm                                                               10% - 20%
                     $ 0 mm - $ 1 mm                                                                20% - 30%

        •    Overall Mean Discount                                                                        24%
        •    Overall Median Discount                                                                      26%

The SEC Study includes transactions in securities with certain resale provisions, commonly referred to
as registration rights. The SEC Study notes that the existence of such resale provisions “assuages, but
by no means eliminates the illiquid character of restricted securities.” The SEC Study does not separate
the transactions involving securities with resale provisions from those without.

The SEC Study provides useful insight to appraisers and investors for quantifying appropriate
discounts for lack of marketability. More particularly, securities of a privately-held firm, such as the
subject company, should be considered less liquid than the Rule 144 securities of a publicly-held
company that are sold in a private placement. A publicly-held company has an established trading
market for its securities and its Rule 144 securities will eventually become tradable in that market,

4 Institutional Investor Study Report of the Securities and Exchange Commission, H.R. Doc. No. 64, Part 5, 92nd Congress, 1st Session, 1971, pp. 2444-
2456.
Appendix IV                                                            Premiums & Discounts
which generally indicates a discount for lack of marketability for private companies higher than the
overall mean discount in the SEC Study.

 Other Studies Involving Discounts on Sales of Restricted Shares of Publicly-Traded Companies

Several restricted stock studies other than the SEC Study have focused on discounts for lack of
marketability. The restricted stock studies summarized in the table below typically indicate discounts
for lack of marketability in the 25 to 45 percent range. The last two studies in the table below, the
Solberg Study and the Moore Study, both of which surveyed court cases, reflect average discounts for
lack of marketability of 37.4 percent and 24.0 percent, respectively. While the studies summarized in
the table below provide less detail than the SEC Study, they can be used as benchmarks that indicate
higher discounts than the SEC Study. The Standard Research Consultants study is somewhat
anomalous and reflects a median discount for lack of marketability of 45 percent. Four of the other five
studies (excluding the Solberg Study and the Moore Study) reflect median or average discounts for
lack of marketability in a very tight range of approximately 31-35 percent.


 Market Study                                        Data Date Range              Average Discount

 Gelman Study                                           1968-1970                      33.00% *

 Trout Study                                            1968-1972                      33.45%

 Maher Study                                            1969-1973                      35.43%

 Standard Research Consultants                          1978-1982                      45.00% *

 Willamette Management Associates Study                 1981-1984                      31.20% *

 Management Planning Study                              1980-1990                      24.50%

 Solberg Study                                                                         37.40%

 Moore Study                                                                           24.00%

 * Denotes median discounts


The data indicates that companies with the largest sales volumes have the smallest discounts for lack of
marketability and companies with the smallest sales volumes have the largest discounts for lack of
marketability. This may be partially a result of the market on which the issuing company’s unrestricted
securities trade. For example, in the SEC Study, discounts for lack of marketability on restricted
securities were found to be the lowest for NYSE-listed companies, and increased, in order, for ASE-
listed companies, OTC-reporting companies and OTC-non-reporting companies. A non-reporting OTC
company is a company in which the stock is publicly-traded over the counter but is not subject to
reporting requirements because its total assets are under $1 million or it has total stockholders
numbering 500 or fewer. Non-reporting OTC companies, as opposed to reporting companies traded
OTC or on the ASE or NYSE, are considered to more closely resemble privately-held companies. This
would indicate that discounts for lack of marketability for privately-held companies should generally
be on the higher end of the relevant range of discount for lack of marketability data.
Appendix IV                                                                      Premiums & Discounts
      Studies Involving Transactions in Closely-Held Stocks Prior to Initial Public Offerings

Robert W. Baird & Co., under the direction of John O. Emory, has conducted six studies over time
periods ranging from 1980 through April of 1995 comparing transaction prices in the stock of
privately-held companies, at times when no public market existed for such stock, to the prices of the
same or similar classes of stock when subsequently sold in an IPO transaction. Over the fifteen-year
period of the study, the average discount for lack of marketability was 46.67%.

                             THE VALUE OF MARKETABILITY AS ILLUSTRATED IN
                              INITIAL PUBLIC OFFERINGS OF COMMON STOCK *

                                                       Mean                                 Median
                 Study                                Discount                              Discount
               1994-1995                                45%                                   45%
               1992-1993                                45%                                   44%
               1990-1992                                42%                                   40%
               1989-1990                                45%                                   40%
               1987-1989                                45%                                   45%
               1985-1986                                43%                                   43%
               1980-1981                                60%                                   66%
*Source: Emory, John D., The Value of Marketability as illustrated in Initial Public Offerings of Common Stock, Business
Valuation Review, March 1994.

                    Summary of Discount for Lack of Marketability Considerations

All of the studies noted above regarding discounts for lack of marketability include transactions
involving less than all of the issuing company’s outstanding shares. For most, if not all, of the
transactions analyzed in the studies noted above, the subject blocks of stock constituted a minority
interest in the issuing company. When we value a controlling interest, we must consider the extent to
which the elements of control associated with the subject interest enhance marketability.

Aside from the studies noted above, other factors that may effect the marketability of stock include
associated puts and/or calls, transfer restrictions imposed by shareholder or other agreements, the
history of and prospects for the continued payment of dividends, the prospects of a sale of some or all
of the stock or assets of an issuing company, the prospects of a public offering of the subject stock, and
an investor’s expected holding period and return, including the expected growth in value of the subject
stock.

After taking into consideration the above factors and empirical studies, it is our opinion that an
appropriate discount for lack of marketability for the subject company is 20%.
Appendix V   Terms of the Engagement

SHG: Sample Valuation

  • 1.
    ACME CONCRETE CORPORATION Prepared by Schwartz Heslin Group, Inc. 8 Airport Park Blvd. Latham, NY 12110 www.shggroup.com Valuation Date: April 30, 2001 Report Date: May 31, 2001
  • 2.
    Table of Contents I. Certification .................................................................................................................................. 1 II. Assumptions and Limiting Conditions ......................................................................................... 2 III. Purpose ......................................................................................................................................... 3 IV. Opinion of Value .......................................................................................................................... 5 V. Methodology................................................................................................................................. 6 VI. Subject Company Summary ......................................................................................................... 8 VII Economic Overview ..................................................................................................................... 13 VIII. Adjusted Net Asset Value Method ............................................................................................... 14 IX. Comparative Guideline Public Company Descriptions ................................................................ 15 X. Financial Performance and Ratio Analysis................................................................................... 16 XI. Guideline Public Company Method ............................................................................................. 18 XII. Guideline Transaction Method ..................................................................................................... 20 XIII. Capitalization of Earnings Method.................................................................................... 22 XIV. Premiums & Discounts ...................................................................................................... 24 XV. Valuation Summary ........................................................................................................... 26 Appendix I – Standard & Poor’s Economic Overview Appendix II – Profiles of Comparative Guideline Public Companies Appendix III – Assumptions for the Income Approach Appendix IV – Premiums & Discounts
  • 3.
    I. Certification To the best of our knowledge and belief: • The statements of fact contained in this report are true and correct; • The analysis and opinions represent the unbiased conclusions of the appraisers who prepared this report; • Neither Schwartz Heslin Group, Inc. (“SHG”) nor its employees have any current or prospective interest in the Company, nor is there a bias with respect to any of the parties involved; • Neither SHG’s compensation nor that of its employees is contingent upon an action or event resulting from the analyses, opinions or conclusions of this report; • This appraisal has been prepared in compliance with the Uniform Standards of Professional Appraisal Practice promulgated by the Appraisal Foundation; and • This appraisal is valid only for the valuation date indicated on the cover of this report and is not an indication of past or future value The undersigned had primary responsibility for the contents of this report and certifies that to the best of the undersigned’s knowledge the statements of fact contained in this report are true and correct and represent the unbiased professional analyses, opinions, and conclusions of SHG. Steven M. Egna Managing Director 1
  • 4.
    II. Assumptions andLimiting Conditions The due diligence information supplied to us that has been used as the basis for this valuation analysis was provided and/or submitted by Steve Jones, CFO and Treasurer of Acme Concrete Corporation (“Acme” or the “Company”), and has not been independently verified by SHG. We assume no responsibility for its accuracy or completeness. In addition, we have assumed that no material change occurred in the financial condition of the subject company between the date of the latest financial statements used in this analysis and the date of the valuation, except as expressly noted herein. Furthermore, certain financial and other market information used in this report is from third party sources that we deem reliable. We make no representation as to the accuracy or completeness of third- party information and have accepted it without further verification. We did not personally inspect the records or investigate the legal rights of the subject company. The conclusions and analyses in this report are based upon the assumption that management will continue to manage the subject company in a similar manner going forward unless otherwise noted. 2
  • 5.
    III. Purpose The purposeof this business valuation report is to communicate a recommendation of the fair market value of a 100% non-marketable, controlling interest in the shareholders’ equity of Acme Concrete Corporation (“Acme” or the “Company”) as of April 30, 2001 (the “Valuation Date”). This valuation report is intended solely for the purpose of a potential sale of the Company. We have no responsibility to update this report for events and circumstances occurring after the Valuation Date. For purposes of this report, Fair Market Value1 is defined as: “…the price at which property would change hands between a willing buyer and a willing seller, when the former is not under any compulsion to buy and the latter is not under compulsion to sell, assuming both parties have reasonable knowledge of relevant facts.” Furthermore, court decisions often include the additional requirement that the hypothetical buyer and the hypothetical seller are assumed to be able, as well as willing, to trade and are well informed about the property and the market for such property. The valuation of privately-held stock requires consideration of a number of factors that may influence market value. The factors recognized by tax courts, the Internal Revenue Service, and most sophisticated buyers and market participants typically include (and we have considered the following in our determination of the value of the equity of the Company): the nature of the subject company’s business and the history of the enterprise; the economic outlook in general, and the condition and outlook of the subject company’s specific industry in particular; the book value of the subject company and the financial condition of its business; the earning capacity of the subject company; the dividend-paying capacity of the subject company; whether or not the subject company has goodwill or other intangible value; sales of the stock and the size of the block of stock being valued; the degree of marketability of the subject company’s stock; the market price of stocks of corporations engaged in the same or a similar line of business which are actively traded in a free and open market, either on an exchange or over-the- counter; and the level of control premium, if any, or discount for lack of control, with regard to the subject block of stock. 1 In accord with Section 20.2031-1(b) of the Estate Tax Regulations (section 81.10 of the Estate Tax Regulations 105) and section 25.2512-1 of the Gift Tax Regulations (section 86.19 of Gift Tax Regulations 108). 3
  • 6.
    These considerations arenoted in Revenue Ruling 59-60, 1959-1 CB 237, as modified by Revenue Ruling 65-193, 1965-2 CB 370, and Revenue Ruling 77-287, IRB 1977-33. Revenue Ruling 59-60 is specifically intended for stock valuations for estate and gift tax purposes. Nonetheless, the guidelines set forth are considered by valuation professionals, tax and other courts, the Internal Revenue Service, the Department of Labor, and most sophisticated buyers and market participants to be applicable in many valuation contexts, including those related to employee stock ownership plans, charitable gifts of stock, buy/sell agreements, mergers, acquisitions and divestitures, transactions involving minority interests in stock, the determination of exercise prices for options on privately held stock, marital dissolutions, dissenter’s rights and bankruptcies. 4
  • 7.
    IV. Opinion ofValue Based on relevant qualitative and quantitative analyses, subject to the assumptions and limiting conditions disclosed herein, it is our opinion that the Fair Market Value as of April 30, 2001 of a 100% non marketable, controlling interest in the shareholders’ equity of Acme Concrete Corporation is as follows: Market Value of 100% of the Equity of the Company $55,000,000 (Non-Marketable, Controlling Interest Basis) It is our opinion that an independent investor could realize a reasonable rate of return on investment at this value, commensurate with the risks involved, assuming that the subject company is operated prudently and that there are no unforeseen adverse changes in the economic and market conditions affecting the business and the industry in which the subject company operates. 5
  • 8.
    V. Methodology There arethree generally accepted approaches to valuing operating businesses. These are referred to as the Cost Approach, the Market Approach, and the Income Approach. The value of the capital stock of any company, regardless of its industry, size or location, is a function of the amount of cash expected to be generated by that company which will be available to internally finance growth or to distribute to shareholders. Consequently, all valuation methodologies are derivations of the present value of all cash flows expected to accrue to shareholders in the future. It is difficult to quantify expected future cash flows. In fact, many privately-held and publicly-traded companies do not prepare and disclose detailed financial forecasts. Accordingly, many of the valuation methods use as a proxy for the present value of expected future cash flows multiples of historical operating results. We have considered the following methods in our determination of the value of the shareholders’ equity of the Company: The Cost Approach Adjusted Net Asset Value Method. This method adjusts the book value of assets and liabilities to reflect their true economic value. The Adjusted Net Asset Value Method establishes the floor price at which an adequately profitable company should be valued; however, companies which fail to generate adequate profitability may be worth even less than the economic value of their net assets. The Adjusted Net Asset Value Method assumes that a buyer of the subject company pays fair market economic value for the net assets and does not liquidate the company. This method is often appropriate for the valuation of businesses that have relatively low operating earnings relative to their assets. The Market Approach Guideline Public Company Method. The most common way to establish a value for a given company is to examine the prices being paid in the financial markets for other companies with similar attributes. We first select a group of companies (from over 13,000 that are publicly traded) that are most similar to the subject company in terms of the nature of their industry and products, their markets, their size and their growth prospects. We then analyze how the stock market values their securities. This method is similar in many ways to the real estate appraisal process which considers the location, size and other features of houses sold that are most similar to the one being valued to determine an approximation of value. The market values of publicly-traded companies and their securities are expressed as multiples of revenue, earnings before interest and taxes, earnings before interest, taxes, depreciation, and amortization, book value and other financial measures. We then perform a risk analysis, comparing the subject company’s operations and financial attributes to the guideline public companies in terms of size, breadth of operations, management and product lines, financial condition and performance, profitability, growth, and other factors considered to be indicators of risk, in order to choose appropriate multiples to apply to the subject company’s normalized levels of revenue, earnings, cash flow, and/or book value. 6
  • 9.
    Guideline Transaction Method.This methodology is similar to the prior one, except that instead of using the prices of publicly-traded securities as the benchmark, we consider the prices paid in recent sales of companies similar to the subject company. We search several databases containing information on acquisition prices for companies recently acquired and determine which transactions involved acquired companies with attributes most similar to the subject company. Although actual acquisition prices of similar private companies would appear to be more relevant for comparative valuation purposes than the prices of publicly-traded securities, the transaction data that is available is typically not as comprehensive. Often, details of privately-held company acquisitions are not disclosed publicly. Nonetheless, we search the major databases and consider the relevant transaction data that is available. As in the Guideline Public Company Method, we perform a risk analysis comparing the subject company’s operations and financial attributes to the comparable acquired companies’ in order to choose appropriate multiples to apply to the subject company’s normalized levels of revenue, earnings, cash flow, and/or book value. The Income Approach Discounted Cash Flow Method. The most theoretically valid, yet most subjective valuation methodology, requires developing an estimate of expected future cash flows that will accrue to the shareholders and then quantifying the present value of those expected future cash flows considering the risks associated with actually achieving them. The discount rate, known as the cost of capital, must reflect the returns required by lenders and shareholders to entice them to invest in the subject company or companies with similar risk profiles. Capitalization of Earnings Method. Because it is difficult to accurately project cash flows several years into the future, many privately-held and publicly-traded companies do not prepare and disclose detailed financial forecasts. The Capitalization of Earnings Method, which can be used as a variation of the Discounted Cash Flow Method, capitalizes existing, proven cash flows. The general concept is to: 1) determine a normalized level of cash flow for the subject company (i.e. adjusting historical financial results for extraordinary or non-recurring items); 2) estimate an appropriate cost of capital and long-term compound annual growth rate for those cash flows; and 3) determine the present value of the estimated future cash flows by capitalizing them by the cost of capital less the long-term compound annual growth rate. There are other valuation methodologies that may be appropriate on occasion. For example, recent purchases of the stock of the subject company that were negotiated between independent parties can provide a good indication of value and must be considered. Unfortunately, it is uncommon that there are arm’s-length transactions involving the stock of a privately-held company. As a final note, we do not use industry rules of thumb as a valuation method. Industry rules of thumb are typically derivatives of the above methods, thus redundant, and they do not readily allow for consideration of differences between one company and the next. Moreover, the Internal Revenue Service does not typically regard industry rules of thumb as an appropriate valuation method. 7
  • 10.
    VI. Subject CompanySummary Company Name: Acme Concrete Corporation (“Acme” or the “Company”) Description of Interest Being Valued: Non-marketable, controlling interest in Acme as of April 30, 2001. The Company has only one class of stock issued and outstanding as of the Valuation Date, and there has been no public trading in the Company’s stock. Special Provisions Affecting Capital Stock: None Business Description: Acme processes and supplies ready mix concrete to the residential, industrial, and commercial markets in the southeastern United States. The Company owns and operates approximately 590 ready mix delivery trucks and 30 manufacturing plants located throughout the southeastern United States. Acme, founded in 1975 by Marvin Smith, is headquartered in Greensboro, North Carolina. Acme’s CEO, John Gooch, and Senior Operations Executive, Marvin Taylor, have been employed by the Company for at least 20 years and have over 40 years of industry experience. Mr. Gooch and Mr. Taylor also have extensive involvement with regional and national trade associations. However, both of these senior executives plan to retire in about five years. The CFO, Steve Jones, and Senior Marketing Executive, Ryan Klein, have been with the Company for 10 and 12 years, respectively, and do not plan on leaving Acme in the next 10 years. There are no stock options outstanding, and the CEO and Senior Operations Executive currently own 45% of the common shares outstanding, with 55% owned by the other two senior executives. Mr. Jones and Mr. Klein have plans to succeed the CEO and Senior Operations Executive without materially impacting Acme. Acme’s cost structure is low in comparison to the Company’s competitors. Competition in this market is increasing, with an emphasis on excellent service, strong customer relationships and timely delivery. The industry leaders have gained strength through consolidation. The industry is moderately cyclical but not seasonal. The primary barriers to enter and compete in the electrical contracting industry are access to skilled labor and sufficient capital. Currently, the Company has approximately 4 competitors in the same line of business. Currently, the Company has approximately 150 customers including residential home builders, such as Lyland Homes and Bob Barker Communities; government entities; commercial developers; and individuals. Over the latest twelve months, Acme’s five largest customers accounted for approximately 10% of total revenue. Alternate suppliers are available, however, 80% of all purchases are currently coming from the Company’s top suppliers. Acme has 160 employees, 22 of which are salaried. The work force is not unionized; the Company has not experienced any work stoppages; employee moral is good; and turnover is below average for the industry. The outlook for this market is favorable, with growth expected to outpace GNP by a modest margin. As a result of new customers and new services to existing customers, the Company’s revenues have grown at a compound annual rate of 26% over the last three fiscal years. Over the latest twelve 8
  • 11.
    months, approximately 10%of revenue was generated from new customer business. Acme plans to continue increasing sales to new customers by focusing on opportunities in both their existing southeastern market and new geographic territories. In addition, Acme sees further opportunities in offering new products and services. The Company is expecting 20% revenue growth to occur over the current fiscal year ending December 31, 2001. The Company’s equipment is in state of the art condition. All important aspects of the business are covered by insurance, and there are no known environmental or contingent liabilities. Acme has not received any legitimate offers to buy the Company to date. 9
  • 12.
    Income Statement ($000s) Twelve Months Years Ended December 31, Ended April 30, 1998 % Rev. 1999 % Rev. 2000 % Rev. 2001 % Rev. Net Revenues $49,301 100.0% $61,600 100.0% $72,591 100.0% $68,277 100% Cost of Goods Sold 28,582 58.0% 36,796 59.7% 44,607 61.4% 42,301 62.0% Gross Profit $20,719 42.0% $24,804 40.3% $27,984 38.6% $25,976 38.0% Selling Expenses 5,857 11.9% 7,553 12.3% 8,238 11.3% 7,122 10.4% G&A Expenses 6,797 13.8% 7,168 11.6% 7,002 9.6% 6,905 10.1% Operating Income $8,065 16.4% $10,083 16.4% $12,744 17.6% $11,949 17.5% Interest Expense 0 0.0% 1,854 3.0% 2,153 3.0% 2,145 3.1% Other Expenses/ (Income) (68) -0.1% (63) -0.1% (106) -0.1% (139) -0.2% Profit Before Taxes $8,133 16.5% $8,292 13.5% $10,697 14.7% $9,943 14.6% Taxes 3,253 6.6% 3,317 5.4% 4,279 5.9% 3,977 5.8% NET INCOME $4,880 9.9% $4,975 8.1% $6,418 8.8% $5,966 8.7% Capital Expenditures $1,285 2.6% $1,502 2.4% $1,325 1.8% $1,286 1.9% Depreciation & Amortization $706 1.4% $1,956 3.2% $2,274 3.1% $2,172 3.2% 10
  • 13.
    Balance Sheet ($000s) Years Ended December 31, 1998 % 1999 % 2000 % ASSETS: Cash and Equivalents $1,390 4.3% $1,406 3.9% $1,500 3.8% Accounts Receivable 7,089 21.8% 7,877 21.6% 8,621 22.0% Inventory 8,085 24.8% 10,525 28.9% 12,468 31.8% Other Current Assets 246 0.8% 164 0.5% 157 0.4% Total Current Assets $16,810 51.6% $19,972 54.9% $22,746 58.1% Property, Plant, & Equip. 17,371 53.4% 16,349 44.9% 16,651 42.5% Less: Accumulated Depreciation 1,673 5.1% 145 0.4% 458 1.2% Net Property, Plant & Equip. 15,698 48.2% 16,204 44.5% 16,193 41.3% Land 0 0.0% 0 0.0% 0 0.0% Intangibles 0 0.0% 0 0.0% 0 0.0% Other Long-term Assets 41 0.1% 234 0.6% 225 0.6% Total Assets $32,549 100.0% $36,410 100.0% $39,164 100.0% LIABILITIES: Accounts Payable $4,348 13.4% $7,154 19.6% $8,079 20.6% Accrued Expenses 1,321 4.1% 1,685 4.6% 1,673 4.3% Short-term Borrowings 0 0.0% 895 2.5% 884 2.3% Other Current Liabilities 11 0.0% 6 0.0% 13 0.0% Total Current Liabs. $5,680 17.5% $9,740 26.8% $10,649 27.2% Deferred Taxes 0 0.0% 0 0.0% 0 0.0% Long-term Borrowings 6,210 19.1% 6,401 17.6% 7,559 19.3% Other Long-term Liabilities 0 0.0% 0 0.0% 0 0.0% Total Liabilities $11,890 36.5% $16,141 44.3% $18,208 46.5% SHAREHOLDERS' EQUITY: Paid-In Capital 1,699 5.2% 3,176 8.7% 3,176 8.1% Retained Earnings 18,960 58.3% 17,093 46.9% 17,780 45.4% Total Shareholders' Equity 20,659 63.5% 20,269 55.7% 20,956 53.5% Total Liabilities & Shareholders' Equity $32,549 100.0% $36,410 100.0% $39,164 100.0% 11
  • 14.
    Current Year FinancialData ($000s) BALANCE SHEET INFORMATION: As of: 4/30/2001 Cash $2,350 Other Current Assets 22,123 Net Property, Plant & Equip. 15,897 Other Assets 225 Total Assets $40,595 Current Liabilities (excluding short term borrowings) $9,912 Borrowings (both short term & long term) 8,492 Other Liabilities 0 Shareholders' Equity 22,191 Total Liabilities & Shareholders' Equity $40,595 PROJECTED INCOME STATEMENT: Twelve Months Ending: 12/31/2001 Net Revenues $72,335 Gross Profit 28,833 Operating Income $12,731 Interest Expense 2,170 Extraordinary Expenses/(Income) (101) Pre-Tax Income $10,662 Depreciation 2,198 Capital Expenditures 1,218 Change in Working Capital 1,425 12
  • 15.
    VII. Economic Overview Priorto examining the appropriate valuation methodologies, it is necessary to evaluate the overall economic environment in which the subject company operates as of the Valuation Date, paying particular attention to variables that are most likely to influence the value of the subject company and the industry in which it operates. We considered the economic trends, statistics, outlook, and analyses as presented in Appendix I in performing our valuation analysis of the subject company. Moreover, the Income and Market Approaches yield indications of value based on current prices of publicly-traded stocks, current acquisition prices of companies similar to the subject, and the required returns (cost of capital) of other companies similar to the subject, all of which reflect the latest economic data available to the financial markets. Below is a graph which illustrates the performance of the Standard & Poor’s (“S&P”) 500 Index, the S&P Small Capitalization Company Index and an index comprised of the public companies that we have selected as comparative guideline companies for purposes of this valuation analysis. These comparative guideline public companies are described in detail in the next section of the report. The relative performance of the Guideline Companies Index may offer an idea of how the value of the subject company might have fluctuated over the past several years in both absolute and relative terms. Over the three-year period analyzed, the comparative guideline public companies have generally kept pace with the S&P 500 Index and S&P Small Capitalization Company Index. Market Performance 3-Year Shareholder Return 170 130 90 50 Mar99 Mar00 Mar01 Dec98 Dec99 Dec00 Jun98 Jun99 Jun00 Jun01 Sep98 Sep99 Sep00 Months Ending S&P 500 INDEX S&P SMALLCAP 600 INDEX Guideline Companies 13
  • 16.
    VIII. Adjusted NetAsset Value Method Following is a summary of the results of the Adjusted Net Asset Value Method analysis, whereby the Company’s most recent book values of assets and liabilities are adjusted to reflect their true economic values. This method is often appropriate for the valuation of businesses that have substantial capital investments, but is not as relevant for a rapidly growing, profitable business such as Acme. Net Asset Adjustments ($000s) Reported Book Value of Equity $22,191 Adjustments: Insufficient Allowance for Bad Debts 0 Market Value of Inventory Below Book Value 0 Market Value of Real Estate Below Book Value 0 Market Value of Equipment Below Book Value 0 Market Value of Investments in Excess of Book Value 0 Underfunding of Retirement Plan 0 Intangible Assets 0 Contingent Liabilities 0 Net Asset Value $22,191 14
  • 17.
    IX. Comparative GuidelinePublic Company Descriptions The most appropriate public companies to select as comparative guideline companies are those with attributes most similar to the subject company. Unfortunately, no public company is identical to the subject business. The comparative guideline public companies may operate in different industries, offer different products or services, differ substantially in terms of size, product and/or geographic diversification, and management, or may perform better or worse than the subject company. The ways in which the comparative guideline public companies differ from the subject company are factored into the selection of the multiples, capitalization rates and discounts that are deemed appropriate for the subject company. The following public companies have been chosen as comparative guideline companies for purposes of this valuation analysis: Centex Construction Products, Inc.- (CXP) Traded on the NYSE, the company, with revenues of $381.5 million for the 12 months ended December 31, 2000, produces and sells cement, aggregates, ready mix concrete and gypsum wallboard for use in the construction of homes, commercial and industrial buildings and infrastructure. CXP operates four quarrying and manufacturing facilities and a network of 11 terminals for the production and distribution of portland and masonry cement. Continental Materials Corp.- (CUO) The company’s common stock is traded on the ASE. For the 12 months ended December 31, 2000, CUO generated revenues of $110.3 million. The company operates primarily in two industry segments, the Heating and Air Conditioning segment and the Construction Materials segment. The Construction Materials segment is involved in the production and sale of ready mix concrete, construction aggregates and other building materials. This segment markets its products primarily through its own direct sales representatives and confines its sales to the Front Range area in southern Colorado. Sales are made to general and sub-contractors, government entities and individuals. Florida Rock Industries, Inc.- (FRK) Traded on the NYSE, FRK, with revenues of $655.3 million for the 12 months ended December 31, 2000, mines, processes and sells construction aggregates; produces and sells ready mix concrete, concrete block, prestressed concrete and calcium; and sells other building materials. As of September 30, 1998, FRK had 90 sites for its ready mix concrete, concrete block and prestressed concrete plants in Florida, Georgia, North Carolina, Virginia and Maryland. Monarch Cement Co.- (MCEM) The company, traded on the NASDAQ, generated $117.1 million in revenues for the 12 months ended December 31, 2000. MCEM makes and sells several types of portland cement and ready mix concrete, concrete products and sundry building materials. U.S. Concrete Inc.- (RMIX) Traded on the NASDAQ, RMIX, with revenues of $394.7 million for the 12 months ended December 31, 2000, provides ready mix concrete and related products and services to the construction industry in major markets in the United States. The company operates 26 concrete plants in the San Francisco Bay area, the Sacramento metropolitan area, Washington, D.C. and northern New Jersey. 15
  • 18.
    X. Financial Performanceand Ratio Analysis Before selecting the appropriate multiples that will be utilized to derive a value for the subject company under the Guideline Public Company Method, it is important to evaluate how the subject company differs in terms of perceived risk and expected growth relative to the comparative guideline public companies. We compare the subject company to the comparative guideline public companies utilizing a number of measurements that consider relative size, breadth of operations, management and product lines, financial condition and performance, growth, profitability, activity levels, liquidity and leverage, as summarized below: Revenue Growth Asset Growth Percentage change in total revenues during the twelve Percentage change in total assets during the twelve months that correspond to the most recently completed months that correspond to the most recently completed fiscal year. fiscal year. 30% 15% 10% 20% 5% 0% 10% -5% -10% 0% ACME CXP CUO FRK 3MCEM RMIX ACME CXP CUO FRK 3MCEM RMIX Gross Margin EBITDA Margin Net sales minus cost of goods sold as a percentage of net EBITDA as a percentage of net sales. EBITDA is sales. income before interest, taxes, extraordinary items, depreciation and amortization. 60% 35% 45% 25% 30% 15% 15% 5% 0% -5% ACME CXP CUO FRK 3MCEM RMIX ACME CXP CUO FRK 3MCEM RMIX 16
  • 19.
    Return on Equity Return on Assets Net income before extraordinary items divided by the Net income before extraordinary items divided by the average common equity during the twelve months that average total assets during the twelve months that correspond to the most recently completed fiscal year. correspond to the most recently completed fiscal year. 25% 15% 20% 10% 15% 10% 5% 5% 0% 0% ACME CXP CUO FRK 3MCEM RMIX ACME CXP CUO FRK 3MCEM RMIX Inventory Turnover Asset Turnover Cost of goods sold for the twelve months that correspond to Net sales for the twelve months that correspond to the the most recently completed fiscal year divided by the most recently completed fiscal year divided by the average average of that year’s inventories at year end and the prior of that year’s total assets at year end and the prior year’s year’s inventories at year end. total assets at year end. 50.0 2.0 40.0 1.5 30.0 1.0 20.0 10.0 0.5 0.0 0.0 ACME CXP CUO FRK 3MCEM RMIX ACME CXP CUO FRK 3MCEM RMIX Current Ratio Debt to Capital Year-end current assets divided by year-end current Year-end total debt divided by year-end common equity liabilities. plus preferred equity plus total debt. 5.0 0.6 4.0 3.0 0.4 2.0 0.2 1.0 0.0 0.0 ACME CXP CUO FRK 3MCEM RMIX ACME CXP CUO FRK 3MCEM RMIX 17
  • 20.
    XI. Guideline PublicCompany Method Next, we examine how the public markets value the stock of the comparative guideline public companies as a multiple of various performance measures. Comparative Guideline Public Company Valuation Multiples TIC to TIC to TIC to EV to Sales EBIT EBITDA Book Value CENTEX CONSTRN PRODS INC 2.36 7.75 6.62 1.61 CONTINENTAL MATERIALS CORP 0.54 7.51 4.52 0.99 FLORIDA ROCK INDS 1.57 12.45 7.42 2.24 MONARCH CEMENT CO 0.88 11.12 6.27 1.19 U S CONCRETE INC 0.95 10.29 7.83 1.43 High 2.36 12.45 7.83 2.24 Mean 1.26 9.82 6.53 1.49 Median 0.95 10.29 6.62 1.43 Low 0.54 7.51 4.52 0.99 Notes: TIC equals the “total invested capital" of the company, which includes the aggregate market value of stock outstanding on a controlling interest basis plus the value of any preferred stock and debt outstanding. EV equals the aggregate market value of stock outstanding on a minority interest basis. EBIT is earnings before interest and taxes; EBITDA is EBIT plus depreciation and amortization. Rather than simply relying on the mean or median multiples of the comparative guideline public companies, we must analyze the various multiples and factor in how the subject company differs from the guideline companies, individually and as a whole, in terms perceived risk and expected growth. We compare the subject company to the guideline public companies in terms of relative size, breadth of operations, financial condition and performance, growth, profitability, activity levels, liquidity, leverage, and other factors considered to be indicators of risk. We then choose multiples that are appropriate and apply them, respectively, to the subject company’s normalized levels of revenue, cash flow, and/or book value. If the stock of the subject company is not publicly traded, the value determined below will be reduced for lack of marketability, as discussed in the “Premiums & Discounts” section and Appendix IV of this report. 18
  • 21.
    Valuation Indications UtilizingThe Guideline Public Company Method ($000s) Selected Total Less Equity Acme (1) Multiple Value Debt (2) Value Sales $68,277 1.00 $68,277 ($8,492) $59,785 Adjusted EBIT $11,804 10.30 $121,581 ($8,492) $113,089 Adjusted EBITDA $13,976 6.60 $92,242 ($8,492) $83,750 Book Value $22,191 n/a n/a n/a n/a Mean $85,541 Median $83,750 Concluded Enterprise Equity Value $83,700 Notes: (1) Trailing twelve months results through April 30, 2001 (2) Most recently reported debt as of April 30, 2001 19
  • 22.
    XII. Guideline TransactionMethod This methodology is similar to the Guideline Public Company Method, except that instead of using the prices of publicly-traded securities as the benchmark, we examine the prices paid in recent sales of companies similar to the subject. We have searched several databases to find recent transactions involving acquired companies with attributes similar to the subject company. Similarly, rather than simply relying on the mean or median transaction multiples, we factor in how the subject company differs from the acquired companies in terms of perceived risk and expected growth. If the stock of the subject company is not publicly traded, the value determined below will be reduced for lack of marketability, as discussed below in the “Premiums & Discounts” section and Appendix IV of this report. The value determined below is on a 100 percent controlling interest basis because the multiples of the acquired companies are on a 100 percent controlling interest basis. Comparative Guideline Transaction Valuation Multiples Date Deal Size Target Sales TIC to TIC to TIC to TIC to Closed (millions) (millions) Target Buyer Sales EBIT EBITDA BV 21-Jul-00 $294.97 $418.13 Joe Gibbs & Company U.S. Concrete 0.66 4.61 4.17 3.36 10-Mar-00 $209.69 $292.31 Central Concrete Supply Monarch Cement 0.69 7.23 6.54 3.22 16-Dec-99 $33.44 $56.00 Brown Concrete U.S. Concrete 0.49 4.68 4.13 1.90 12-Nov-99 $144.92 $246.77 William A. Scott Brothers U.S. Concrete 0.49 9.41 8.67 4.68 20-Oct-99 $58.00 $98.30 Walker Concrete Opportunity Concrete 0.59 8.00 5.63 1.60 31-Jul-98 $128.23 $110.80 Lone Star Industries U.S. Concrete 1.04 5.08 5.67 5.71 High 1.04 9.41 8.67 5.71 Mean 0.66 6.50 5.80 3.41 Median 0.63 6.16 5.65 3.29 Low 0.49 4.61 4.13 1.60 Notes: TIC equals the “total invested capital" of the company, which includes the aggregate market value of stock outstanding on a controlling interest basis plus the value of any preferred stock and debt outstanding. EBIT is earnings before interest and taxes; EBITDA is EBIT plus depreciation and amortization. 20
  • 23.
    Valuation Indications UtilizingThe Guideline Transaction Method ($000s) Selected Total Less Equity Acme (1) Multiple Value Debt (2) Value Sales $68,277 0.6 $40,966 ($8,492) $32,474 Adjusted EBIT $11,804 6.2 $73,185 ($8,492) $64,693 Adjusted EBITDA $13,976 5.7 $78,964 ($8,492) $70,472 Book Value $22,191 n/a n/a n/a n/a Mean $55,880 Median $64,693 Concluded Enterprise Equity Value $64,700 Notes: (1) Trailing twelve months results through April 30, 2001 (2) Most recently reported debt as of April 30, 2001 21
  • 24.
    XIII. Capitalization ofEarnings Method The general concept in the Capitalization of Earnings Method is to: 1) determine a normalized level of cash flow for the subject company (i.e. adjusting historical financial results for extraordinary or non- recurring items); 2) estimate an appropriate cost of capital and long-term compound annual growth rate for those cash flows; and 3) determine the present value of the estimated future cash flows by capitalizing them by the cost of capital less the long-term compound annual growth rate. The appropriate cost of capital must reflect the returns required by lenders and shareholders to entice them to invest in the subject company or companies with similar risk profiles. The first step is to determine a normalized level of cash flow that the subject company has evidenced it can consistently achieve based on historical performance. We add to or subtract from earnings before interest and taxes any non-operating and/or non-recurring income or expense items, and then make the normal adjustments to determine free cash flow (depreciation/amortization, capital expenditures, and changes in working capital). Twelve Months Ended 4/30/2001 Projected Year Normalized Earnings Before Interest & Taxes $11,949 $12,731 $12,000 Adjustments For: Non-Employee Income 26 28 28 Excess Compensation to Board Member 9 10 10 Additional Inventory Reserves (180) - - Adjusted Earnings Before Interest & Taxes 11,804 12,769 12,038 Additional Adjustments For: Depreciation/Amortization $2,172 $2,198 $1,500 Capital Expenditures (1,286) (1,218) (1,500) Change in Operating Working Capital (1,854) (1,425) (362) Free Cash Flow $10,836 $12,324 $11,676 We then subtract the amount of taxes that would be due assuming the subject company had no interest expense deduction. (We factor in the value of the deductibility of interest expense when we compute the cost of debt capital by using the after-tax cost of debt). The resulting amount is the cash flow available to investors. There are two parties that have a claim to a company’s cash flow: 1) lenders of capital and 2) shareholders. 22
  • 25.
    In order tocalculate what the sum of all future cash flows available to investors is worth today, we must quantify several variables including: The long-term compound annual growth rate in cash flow; The return (rate of interest) that lenders would require in order to invest long-term in the subject company or companies with similar risk profiles; The return that shareholders, not biased by personal considerations, would require in order to invest in the subject company given the level of risk involved and the returns available on alternative investments with similar risk profiles. The formula and assumptions used to compute the subject company’s weighted average cost of capital (“WACC”) are summarized in Appendix III. The final step in establishing the value of the equity is to determine the present value of the estimated future cash flows by capitalizing the determined level of cash flow available to investors by the subject company’s WACC (less growth) and then subtracting the amount of outstanding debt as shown below: Valuation Indication Utilizing The Capitalization of Earnings Method ($000s) Normalized Free Cash Flow $11,676 Minus: Debt-Free Taxes on Adjusted EBIT (1) 4,776 Equals: Cash Flow to Investors $6,900 Cash Flow to Investors $6,900 Divided by: Capitalization Rate (2) 10.6% Equals: Net Present Value to Investors $65,195 Minus: Outstanding Debt (8,492) Equals: Enterprise Equity Value $56,703 Notes: (1) Includes both federal and state taxes. (2) See Appendix III 23
  • 26.
    XIV. Premiums &Discounts The same share of stock may have a different value depending on the elements of control and marketability inherent in the interest being valued. The valuation methodologies we have considered yield value indications at different levels of value. A controlling interest in a company, which typically implies in excess of 50 percent voting control, possesses the ability to implement changes in corporate structure and policies. Conversely, a non-controlling (minority) interest does not possess such ability. The Adjusted Net Asset Value Method, the Capitalization of Earnings Method, and the Guideline Transaction Method each yield a controlling interest level of value. On the other hand, the Guideline Public Company Method can yield value indications at a minority interest level of value. We must apply premiums and discounts, as appropriate, so that all our value conclusions are at the same level of value as the subject company stock being valued. The most common premiums and discounts are as follows (for a more detailed discussion, please see Appendix IV): Control Premiums- A controlling interest is worth more because it provides the holder of the controlling interest with the ability to determine how the subject business is governed, when it might be sold, the level and frequency of dividends, and other matters that influence value and liquidity. A control premium must be applied when determining certain comparative guideline public company stock value multiples under the Guideline Public Company Method. Minority Interest Discounts- The mathematical inverse of a control premium is a minority interest discount. Consequently, the selection of an appropriate control premium effectively determines the minority interest discount and vice-versa. The holder of a minority, non-controlling interest is unable to unilaterally influence corporate governance and corporate structure and policies, many of which directly impact value, making the minority interest worth less than a controlling interest on a per share basis. A minority interest discount must be applied when the interest being valued represents a minority interest. Lack-of-Marketability Discounts- If the shares of the comparative guideline public companies can be readily sold in an active market, they are worth more than illiquid shares. Typically, the stock of a privately-held company is illiquid, i.e., it is not easy to accomplish a sale of stock in the subject company. The magnitude of the appropriate lack-of-marketability discount varies depending on the number of shares outstanding, the number of shareholders, the size of the subject block of stock, governance provisions that affect the inherent elements of control, the performance of the company, the volatility of the subject stock value, dividend policy, and other factors. A lack-of-marketability discount must be applied when the subject company is privately held. Lack of Voting Rights Discounts- In addition to the discounts applied for a minority interest and/or lack-of-marketability, it is appropriate to apply a discount for lack of voting rights when valuing non- voting stock. In order to quantify an appropriate discount for lack of voting rights, we analyze the price differential between the voting common stock and the non-voting common stock of publicly-traded companies. 24
  • 27.
    The appropriate premiumor aggregate discount that is applied is a function of factoring in all of the above considerations and others. For example, research indicates that the stock of smaller companies is generally worth less on a relative basis than the stock of larger companies. There may be several reasons for this including the fact that larger companies generally achieve greater economies of scale, greater product and/or geographic diversification, greater depth of management, greater access to efficient capital markets in the short run, and enjoy greater barriers to entry against competitors. In short, larger companies are perceived as having lower overall risk than smaller companies. A “Key-Person” discount can be applied when the future of a company is dependent on a single individual because there is an increased risk that the loss of that individual will hurt future performance. It should also be noted that discounts are cumulative. For example, a minority interest discount of 25% and a lack of lack-of-marketability discount of 30% results in a total discount of 47.5%. The subject stock of the Company represents a 100% non-marketable, controlling interest in a privately- held company. For purposes of this valuation analysis, we have applied a control premium of 20%, and a discount for lack of marketability of 20%. A small-company risk premium of 3% and a company-specific risk premium of 2% have been factored into the capitalization rate used in the Capitalization of Earnings Method. See Appendix III and IV for a more detailed explanation of risk premiums, discounts and control premiums. 25
  • 28.
    XV. Valuation Summary Indetermining our estimate of the fair market value of the Company, we have considered the valuation methodologies summarized below. Certain valuation methodologies are more appropriate than others depending on the type of company being valued, its financial condition and performance, and the availability of appropriate comparative and transaction data. In the valuation summary below, we have focused on the valuation methodologies that we feel are most relevant to the subject company. Valuation Summary Plus Non- Adjusted Lack of Non-Marketable Enterprise Operating Enterprise Marketability Enterprise Methodology Value Assets (1) Value Discount Value Adjusted Net Asset Value $22,191 n/a $22,191 (20%) $17,753 Guideline Public Company $83,700 $141 $83,841 (20%) $67,073 Guideline Transaction $64,700 $141 $64,841 (20%) $51,873 Capitialization of Earnings $56,703 $141 $56,844 (20%) $45,476 Indicated Fair Market Value of 100% of the Equity $55,000 (Non-Marketable, Controlling Interest Basis) Notes: (1) The fair market value, per management, of a 10% interest in Miller Asphalt Co., Inc. as of April 30, 2001. We have determined that the Guideline Public Company, the Guideline Transaction and Capitalization of Earnings Methods are the most relevant and have weighted them equally. The Adjusted Net Asset Value Method is not relevant when valuing a company whose net asset values do not reflect the cash- generating capacity of the business. It is our opinion that the Fair Market Value of a non-marketable, controlling interest in the common stock of Acme Concrete Corporation as of April 30, 2001 is $57,000,000. 26
  • 29.
    Appendix I Standard &Poor’s Economic Overview
  • 30.
    & INDUSTRY SURVEYS Trends Projections David M. Blitzer Managing Director & Chief Investment Strategist May 17, 2001 Bridging the gap Since the start of this year, we have seen stronger-than-expected consumer spending combined with a widely anticipated slowdown in business technolo- gy investment that has left the economy sliding toward the edge of recession. When the April employment report revealed a plunge in employment of more than 200,000 jobs and an uptick in the unemployment rate to 4.5%, we seemed to be teetering on that edge. The question facing the economy and eco- are scarce and no one will consider even a nomic forecasters is whether growth in con- small risk. Maybe not all, but much of the Can consumer sumer spending can hang on long enough to new economy was — and is — real. bridge the recessionary abyss until capital Recognizing this is likely to be the key to a spending growth resumes. We are still bet- resumption of growth in capital spending. spending hang on ting it can, though there will be some ner- vous moments in the next few quarters. Consumers: the spending spree continues until capital We begin this issue of Trends with a Consumers spent in the first quarter. In real review of some of the things that seem to terms, overall spending rose at a 3.1% annu- be worrying people about consumer spend- al rate and more than accounted for all of spending growth ing. In particular, we will look at the sorry the total 2% gain in real GDP. While this state of savings, the damage done by the was weaker than the rate for last year, it was resumes? stock market, and the level of consumer faster than in the fourth quarter of 2000. debt. Looking at consumers, we conclude Furthermore, it was not driven by overpriced that the financial damage is focused where necessities or rising gasoline prices. it can most easily be absorbed — among The fastest growing sector was autos, the rich. Given this, surviving the short where spending surged at a real annual rate term is a reasonable bet. of almost 20%. Overall durable goods — a We then turn to the long term and look at category that includes autos, home furnish- business capital investment. With interest ings and appliances, and such things as rates dropping and the stock market demon- computers — rose at an 11.9% real annual strating some resiliency, the main barrier to rate in the first quarter. Despite reports of increased capital spending is a willingness to plunging confidence, people continued to invest. A little over a year ago, risk capital spend. At the same time, personal income flowed freely, and people were investing in rose at a 5.9% annual rate. (The income fig- what are now viewed — with the benefit of ure is not adjusted for inflation; the corre- 20-20 hindsight — as some outrageous sponding unadjusted personal consumption ideas. Keynes called this “animal spirits;” figure is 6.5% growth in the first quarter). more recently, others have called it believing As these income and spending figures in the new economy. Today, however, funds suggest, savings fell in the first quarter of
  • 31.
    2 Trends & Projections Real Growth & Inflation (Quarterly % Changes at Annual Rates) 12 10 Percent change in GDP deflator 8 6 4 2 0 Estimated -2 Percent change in real GDP -4 -6 -8 1981 1982 1983 1984 1985 1986 1987 1988 1989 1990 1991 1992 1993 1994 1995 1996 1997 1998 1999 2000 2001 2002 2001. The savings rate — savings as largely a response to the rising stock to show how the bull market affected a percentage of disposable income — market by wealthier individuals. households at different income levels. was negative. At first glance, it Furthermore, most other consumers Total savings did decline and total would seem as though we’re dipping do not have significant equity invest- consumption did surge, but patterns into that vanishing nest egg to keep ments; the savings rate for this group varied significantly across the popula- spending like crazy, even as a reces- did rise in recent years. A recent tion. sion looms ahead. In addition, debt study by the Federal Reserve — The wealthiest fifth of US house- levels are reportedly rising. And, if “Disentangling the Wealth Effect: A holds owns about 75% of all mutual that weren’t enough, there’s the bear Cohort Analysis of Household Saving fund shares and over 80% of all cor- market that threatens to shut down in the 1990s,” by Dean M. Maki and porate stock owned by households. consumer spending. While these hor- Michael G. Palumbo (available at For these households, the savings ror stories may have a small element www.federalreserve.gov) — combines rate fell from 4.9% in 1992 to of truth, they are overdone. data on household savings and invest- –4.4% in 2000. Over the same peri- The collapse in the savings rate is ments from two different Fed sources od, the overall savings rate fell from 3.4% to –0.7%. Thus, the wealthiest 20% accounted for the lion’s share Trends Projections & of the drop in savings. However, the decline was partially offset by an increase in savings by the three-fifths Editor: Eileen M. Bossong-Martines Copyright © 2001 by Standard & Poor’s of households in the middle and bot- Copy Editor: Carol A. Wood All rights reserved. ISSN 0196-4666 USPS No. 517-780 tom of the wealth scale. The message Production: GraphMedia Statistician: Sally Kathryn Nuttall Subscriber relations: (800) 852-1641 Visit the Standard & Poor’s web site here is that, by and large, savings Assistant to Editor: Paulette Dixon @ http://www.stockinfo.standardpoor.com contracted among a segment of the STANDARD & POOR’S INDUSTRY SURVEYS is published weekly. Annual subscription to INDUSTRY SURVEYS is $10,500. Annual subscription population that has the capacity to for Trends & Projections alone is $171. Reproduction in whole or in part (including inputting into a computer) prohibited except by permission of Standard & Poor’s. Executive and Editorial Office: Standard & Poor’s, 55 Water Street, New York, NY 10041. Standard & Poor’s is a division keep spending if it chooses to do so. of The McGraw-Hill Companies. Officers of The McGraw-Hill Companies: Harold McGraw III, Chairman, President, and CEO; Kenneth M. Vittor, We’re not likely to see consumer Executive Vice President and General Counsel; Robert J. Bahash, Executive Vice President and CFO; Frank D. Penglase, Senior Vice President, spending growth vanish because Treasury Operations. Periodicals postage paid at New York, NY 10004 and additional mailing offices. POSTMASTER: Send address changes to INDUSTRY SURVEYS, attention Mail Prep, Standard & Poor’s, 55 Water Street, New York, NY 10041. Information has been obtained by everyone is running out of money. INDUSTRY SURVEYS from sources believed to be reliable. However, because of the possibility of human or mechanical error by our sources, Consumer debt has also been INDUSTRY SURVEYS, or others, INDUSTRY SURVEYS does not guarantee the accuracy, adequacy, or completeness of any information and is not responsible for any errors or omissions or for the results obtained from the use of such information. This issue of INDUSTRY SURVEYS widely discussed of late. While rela- includes 3 sections. Trends & Projections dated May 17, 2001 (Volume 169, Number 20, Section 3). tively high, debt levels are not out of sight. Fed data through the fourth May 17, 2001
  • 32.
    Trends & Projections 3 quarter of 2000 show that mortgage growth. Here, the prospects are This figure was the reason for some debt service is at a peak, represent- generally positive, and we continue of the angst in the trade press reports. ing almost 6.5% of disposable to expect the economy to avoid a The only bright spots in the invest- income. However, consumer debt is recession in 2001 by a narrow ment picture are construction and oil 7.8% of disposable income, down margin. However, the economy’s drilling and exploration. Increased from the peak of 8.7% seen in the long-term prospects depend on a spending on electric power generating beginning of 1990. As a result, over- rebound in business investment. plants — nationally, as well as in all debt service is 14.3%, compared California — may boost the numbers with the peak of 14.4% seen in Capital spending and the new economy slightly, but the strength in the past 1986. Furthermore, growth in con- One of the economy’s strengths in and the anxiety in the present are all sumer credit outstanding stabilized the last decade has been robust capi- about high technology. over the last five quarters and was tal investment. Nonresidential fixed The weakness is not just in com- down sharply in March 2001 (latest investment — business capital spend- puters, but in a range of equipment available). Of course, the amount of ing on just about everything — including networking and telecom- debt that’s comfortable varies among reached a high of 13.8% in the third munications gear — largely the consumers. However, although cur- quarter of 2000, the highest level same equipment that rode the dot- rent debt levels are above their since 1981. While the share hasn’t com boom at the end of 1990s. All recent lows, it would be a mistake to slipped much, spending on equip- those fabled Internet companies, expect that the result will be a col- ment and software contracted in fueled by venture capital cash, lapse in consumer spending. both the fourth quarter of 2000 and invested in a slew of technology Even though debt levels and the first quarter of 2001. Had it not infrastructure. When the boom end- shrunken savings won’t stop spend- been for a surge in spending on oil ed and the cash vanished, we were ing growth, we do see some cause drilling and exploration, overall non- left with innumerable cancelled for concern. Consumer spending residential fixed investment would orders and a lot of unsold equip- growth depends not only on the abil- have been down in the first quarter. ment. The first step to restoring ity to spend, but also on the willing- Investment in high-tech equipment some kind of order after any boom ness to spend. If everyone believes gained in real terms in 2000:4, but is production cutbacks to bring the economy is about to collapse turned down in 2001:1, as spending inventories back in line with slower into a recession or the bear market on computers fell at a 3% annual sales. This is happening now — will get worse, consumers would rate and spending on software fell at with a vengeance. likely rein in their spending. In this a 2% annual rate. In one way, the damage will be regard, recent activity in the stock Computers are one area where greater than some now realize. The market is encouraging. prices fall significantly from quarter combination of ample supplies of While most investors remain a bit to quarter. Investment in computers (slightly) used equipment and contin- nervous after seeing stock prices and peripherals was down at a 30% ued technological progress will mean plunge by almost 30% over a 12- annual rate (before adjustment for sharply lower prices for just about month period, some hints that the inflation) in the first quarter of 2001. any kind of gear. Whatever some outlook may be improving have sur- companies thought their inventory faced recently. For one, stock prices was worth, the real numbers are rose sharply in April in the best Economic Policy probably significantly lower. monthly performance in over a year. 2000 E2001 E2002 Nonetheless, we see something of a Second, the market has managed to silver lining in this cloud. First, the Monetary Indicators rise in the face of bad economic Discount Rate 5.7 3.8 3.1 collapse in prices will probably news. Third, and most important, Fed Funds Rate 6.2 4.3 3.6 accelerate the process of selling the the Fed’s previous rate cut on April M-2 Growth (%) 6.2 11.9 8.2 inventory. Second, someone is bene- 18th reassured investors that the fiting from buying a lot of expensive Fiscal Policy: Budget Surplus/(Deficit) central bank is concerned about the Unified* 236.6 198.9 131.2 gear rather cheaply. economy. All this is likely to encour- NIPA** 187.8 189.0 198.3 However long the inventory adjust- age some spending growth in the Surplus: GDP Ratio (%) 2.4 1.9 1.2 ment takes, the bigger question is next few quarters. what happens next. Will we see a E-Estimated. *Fiscal year. **Based on accrual The short-term puzzle for the (not cash) accounting; excludes the S&L bailout long-term revival? Does the new econ- economy remains focused on con- funds and uses a calendar year. omy still exist? A key aspect of what sumers, the recent source of (continued on page 6) Industry Surveys
  • 33.
    4 Trends & Projections Stock prices rose sharply in April as the Fed surprised the S&P 500 Stock Price Index (Monthly average, 1941-43=10) 1500 market with a rate cut on April 18th. The Fed action strengthened a rally that had begun two weeks earlier and 1300 gave the market its best gains in more than a year. 1100 900 700 500 1996 1997 1998 1999 2000 2001 Corporate Profits (After taxes, in billions of current dollars, at annual rate) Interest Rates (In percent) 700 8 650 30 Year T-Bonds 7 600 550 6 500 10 Year T-Notes 450 5 400 3 Month T-Bills 4 350 300 3 1994 1995 1996 1997 1998 1999 2000 1996 1997 1998 1999 2000 2001 The April employment numbers were much weaker than Employment expected. Continued difficulties in manufacturing and 6.5 Payroll employment (in millions, scale at right) 133 temporary help services resulted in a loss of about 220,000 6.0 Unemployment (%, scale at left) 130 jobs in the month. Elsewhere there were some faint signs of 5.5 127 hope, as the NAPM index gained slightly and industrial pro- 5.0 124 duction gained in March. 4.5 121 4.0 118 3.5 115 1996 1997 1998 1999 2000 2001 Industrial Production Index (1992=100) Capital Spending 155 204 74 Business equipment production 140 191 (1992=100, scale at left) 68 125 178 62 110 165 56 Capacity Utilization (%) 152 50 85 139 New orders 44 83 Nondefense capital goods 126 (Bil. of ‘96 $, scale at right) 38 81 113 32 79 1996 1997 1998 1999 2000 2001 1996 1997 1998 1999 2000 2001 May 17, 2001
  • 34.
    Trends & Projections 5 Consumer Confidence (1985=100) Although retail sales are seeing slowness, consumers remain 150 in reasonably good financial shape. Debt levels are high, but 140 not at record levels, and sentiment is stabilizing. The big 130 threat is from rising unemployment, which could raise 120 renewed fears and dampen spending. 110 100 90 80 1996 1997 1998 1999 2000 2001 Retail Activity Consumer Finance 19 Retail sales 210 18 Consumer installment credit (In bil. $, excluding autos, Net change, in bil. $ 18 scale at right) 200 15 Light vehicle sales (In millions of units, The savings rate SAAR, scale at left) 12 as a percentage of 17 190 disposable income 9 16 180 6 15 170 3 14 160 0 13 150 -3 1996 1997 1998 1999 2000 2001 1996 1997 1998 1999 2000 2001 Inflation remains modest, and the housing market continues Consumer & Producer Prices (Year-to-year % changes) 5 to show a lot of strength. Sales of both new and existing 4 homes were very strong in March. Consumer Price Index 3 2 1 Producer Price Index 0 -1 -2 1996 1997 1998 1999 2000 2001 NAPM Manufacturing Purchasing Managers' Index Housing Market (In thousands of units, SAAR) 60 1950 55 1775 Housing starts 50 1600 45 1425 Housing permits 40 1250 1996 1997 1998 1999 2000 2001 1996 1997 1998 1999 2000 2001 Industry Surveys
  • 35.
    6 Trends & Projections Interest Rates (Monthly, in percent) 10 10-Year Treasury Notes 8 6 3-Month Treasury Bills 4 2 “Real“ Treasury Note rate 0 1988 1989 1990 1991 1992 1993 1994 1995 1996 1997 1998 1999 2000 2001 At the May 15th meeting of the Federal Open Market Committee, to come at the June 26th–27th FOMC meeting. We expect either the Fed cut the target for the Fed funds rate to 4% from 4.5% and a 50 bp or a 25 bp reduction at that time. If the economy looks lowered the discount rate to 3.5% from 4%. Within hours after significant better by late June, a 25 bp cut, with the possibility of the Fed's announcement, Fed funds were trading at close to 4%, a final 25 bp reduction during the summer to put the bottom at three-month T-bills at 3.6%, 10-year T-notes at 5.5%, and 30-year 3.5% is likely. If, however, the economy continues to look soft, T-bonds at 5.9%. On the foreign exchange markets, the dollar was further reductions may be seen. quoted at 88 cents/euro and 124 yen. The foreign exchange markets seem to be taking a favorable The Fed's action was widely expected. We anticipate further view of lower interest rates in hopes that a stronger US economy easing from the Fed, with the target for the funds rate to be cut means a stronger dollar. As a result, further rate cuts are not to 3.5% or possibly 3% in coming months. The next move is likely expected to dampen the dollar's continuing strength. I (continued from page 3) moment when money seemed to a myth; it’s the reality in technology. happens next is the willingness of grow on trees. We are back to a Gordon Moore, a founder of Intel, business to invest in anticipation of a more normal situation where ven- predicted in the early 1970s that the stronger economy ahead. The Fed’s ture capital is available, but not density of transistors on chips would rate cuts are a large step to assuring seemingly for free. double every 18 months. The predic- that the financing will be available in The key issue for future capital tion, which proved true, is now most cases. True, a few industries, investment is what business expects enshrined as Moore’s Law. Even bet- such as telecommunications, may the investment will buy and return. ter, it still has further to run. For the have some difficulty raising cash. The key to the 1990s boom was high first decade or two of Moore’s law, However, there are no business credit technology gear that offered new costs collapsed, but chips were too problems comparable to the econo- opportunities, lower costs, and higher small a part of the overall economy my’s condition a decade ago after the productivity. One part of this was the to dominate the game. In the 1990s, savings and loan industry collapsed. relentless decline in the cost of any- however, chips and related technolo- Thus, financing is not likely to be an thing digital that kept opening up new gy achieved a critical mass: the relent- insurmountable barrier. opportunities. If a company’s costs fall less decline in costs and the widening Some may argue that the yearlong by a few percentage points a year, it’s use of computing power it made pos- bear market has dried up venture pleasant, but not earth-shaking. If a sible for technology to begin to domi- capital and made high-risk equity competitor’s costs fall by a similarly nate more and more of the economy. investment impossible. Harder to small amount, it’s annoying, but not a The rise of the Internet, the surge find, yes; but impossible, no. fatal blow to the business. in productivity, and the fall in Venture capital, initial public offer- However, when costs drop by half information processing and commu- ings, and high-risk investments were in less than two years and keep doing nication costs all have their roots in not invented in 1995. Rather, the so year after year, it’s revolutionary. the ever-declining cost of computing period of the late 1990s was a rare Such a sharp decline is not a wish or power. An economic slowdown of a May 17, 2001
  • 36.
    Trends & Projections 7 few quarters or a bear market last- the bear market is that people will seems to be slowing or fading as a ing a year or so aren’t likely to become afraid of taking risks. It result of the bear market. erase three decades of progress in took more than a generation after At the same time, the direct physics and engineering. If any- the Depression of the 1930s before financing/bank route is fading in thing, the economic shakeout may most people would consider equities some places where it had been remove some financially weak play- a reasonable investment for anything strongest. In both the industrial ers and open the door to other, but the riskiest pursuits. After the nations of continental Europe and stronger competitors. 1973–75 bear market, it took anoth- the emerging markets around the Business will return to investing er 10 to 15 years for large numbers world, equities and market-based because the longer-term opportuni- of people to return to the stock mar- financing are seen as the way to ties are still there. The question is ket. Will the 2000–01 bear market, advance. Bank loans and direct whether the return will be fast even if it’s over already, scare people financing are in long-term decline. enough to avoid a recession. Here away from stocks and taking risks The growing use of market-based we see a couple of reasons for opti- for another 10 or 20 years? For the methods to allocate capital strongly mism: the role of computer technol- moment at least, the answer seems suggests that the difficulties of the ogy in the economy and continuing to be no. last year have not seriously hurt the faith in equities. If anything, many investors’ faith willingness to take risks in pursuit Two facets of computer technolo- in equities seems as unreasonably of profits. gy explain the role it has played in strong today as it did at the begin- the productivity boom of the 1990s ning of 2000 when the Nasdaq was Where we are, or the forecast and in the overall economy. One, still looking forward to crossing What does all this mean for the discussed earlier, is collapsing costs. 5,000 on the way up. Very few com- economy? A bright future and a The other is computer technology’s mentators talk of a sustained bear good chance of getting there with- general purpose and wide applicabil- market. Technology investments con- out a recession (albeit with anoth- ity. This is a fundamental difference tinue to attract money. And, most er two sluggish quarters). We have from many other new technologies: telling of all, an equity-market ori- not spent a long time on the some have limited application, while ented culture continues to spread. recently reported and surprisingly others affect only small portions of Broadly speaking, there are two strong first-quarter GDP numbers, the economy. alternatives for organizing the financ- in part because we expect them to Biotechnology, for example, is ing and capital-raising functions be revised downward and in part enjoying renewed attention currently. within an economy. The approach because they don’t change the con- While its benefits to medicine are that is on the rise in the US, even cerns about near-term weakness. very significant, biotechnology is not with the bear market, is to emphasize Looking at the forecast table on likely to change the course of the the financial markets for both equi- page 8, we still expect a slow and economy. Likewise, substantial ties and fixed-income instruments frustrating summer for the econo- improvements in automobile efficien- and to step back from non-market my and a rebound late this year. cy and durability in the last decade sources such as bank loans and pri- We do think consumer spending have changed the way people travel vate or direct placements of debt or will persevere enough to let the from place to place. However impor- equity. Furthermore, even when direct economy avoid the worst, and we tant, neither represents a truly gener- placements such as venture capital also expect investment and earn- al-purpose technological change. are done, efforts are made to replace ings to rebound in 2002. I Like electric power, computers are the funds with capital from the public general-purpose technologies that markets (IPOs) as quickly as possible. affect almost everything. Computers The last two decades have seen continue to seep into every corner of more and more kinds of financing the economy, changing the way busi- move to the public markets. ness operates and raising productivity. Mortgages, consumer loans, auto The opportunities to harness technolo- loans, and, more recently, commer- gy didn’t vanish in the last year: cial bank loans are all securitized they’re still recognized and will still be and sold in the public markets today. pursued. Business will not forget Even executive compensation is about technology. moving to the public markets The bigger worry associated with through stock options. None of this Industry Surveys
  • 37.
    8 May 17, 2001 Trends & Projections Economic Indicators Seasonally Adjusted Annual Rates — Dollar Figures in Billions Annual % Change 2000 2001 E2002 2000 E2001 E2002 2000 E2001 E2002 3Q 4Q A1Q E2Q E3Q E4Q 1Q 2Q Gross Domestic Product $9,963.1 $10,404.8 $10,876.9 7.1 4.4 4.5 GDP (current dollars) $10,039.4 $10,114.4 $10,243.6 $10,342.1 $10,466.7 $10,566.8 $10,674.5 $10,798.4 7.1 4.4 4.5 - - - Annual rate of increase (%) 3.8 3.0 5.2 3.9 4.9 3.9 4.1 4.7 5.0 2.0 2.4 - - - Annual rate of increase–real GDP (%) 2.2 1.0 2.0 1.3 2.6 1.9 1.8 2.7 2.1 2.3 2.0 - - - Annual rate of increase–GDP deflator (%) 1.6 2.0 3.2 2.2 2.2 2.0 2.2 1.9 * Components of Real GDP $6,826.6 $7,011.1 $7,204.3 6.2 2.7 2.8 Personal consumption expenditures $6,329.8 $6,373.3 $6,422.6 $6,451.7 $6,491.9 $6,539.6 $6,592.3 $6,648.9 6.2 2.7 2.8 - - - % change 4.5 2.8 3.1 1.8 2.5 3.0 3.3 3.5 896.0 915.7 958.1 9.6 2.2 4.6 Durable goods 903.2 896.0 921.5 912.8 909.2 919.4 936.3 950.9 1,869.0 1,916.1 1,972.0 5.0 2.5 2.9 Nondurable goods 1,882.6 1,887.4 1,899.6 1,905.4 1,922.2 1,937.2 1,948.9 1,963.9 3,543.9 3,658.2 3,766.4 4.5 3.2 3.0 Services 3,559.3 3,602.5 3,617.6 3,647.0 3,672.4 3,695.8 3,722.0 3,750.4 1,413.7 1,436.7 1,465.9 12.6 1.6 2.0 Nonresidental fixed investment 1,438.8 1,438.3 1,442.2 1,431.0 1,436.2 1,437.6 1,443.1 1,451.4 12.6 1.6 2.0 - - - % change 7.7 (0.1) 1.1 (3.1) 1.4 0.4 1.6 2.3 1,140.5 1,142.4 1,200.7 13.7 0.2 5.1 Producers durable equipment 1,162.4 1,152.7 1,146.7 1,126.8 1,141.9 1,154.5 1,169.3 1,186.1 366.3 355.1 345.4 (0.5) (3.1) (2.7) Residental fixed investment 362.3 359.0 361.9 358.5 353.0 347.0 343.6 343.5 (0.5) (3.1) (2.7) - - - % change (10.6) (3.6) 3.3 (3.7) (6.0) (6.7) (3.9) (0.1) 60.9 13.8 29.8 - - - Net change in business inventories 72.5 55.7 (7.1) 3.7 29.6 28.9 16.8 27.8 1,579.2 1,617.7 1,654.7 2.8 2.4 2.3 Gov't purchases of goods & services 1,578.2 1,589.6 1,605.1 1,612.6 1,622.0 1,631.2 1,641.6 1,650.6 548.2 563.6 575.5 1.5 2.8 2.1 Federal 545.8 550.9 558.6 561.3 565.8 568.7 572.2 574.4 1,030.5 1,053.6 1,078.7 3.5 2.2 2.4 State & local 1,031.9 1,038.1 1,046.0 1,050.8 1,055.7 1,062.0 1,068.9 1,075.7 (412.4) (415.8) (466.9) - - - Net exports (427.6) (441.7) (404.9) (407.5) (421.0) (429.9) (441.8) (463.8) 1,126.3 1,145.6 1,200.2 9.0 1.7 4.8 Exports 1,158.8 1,139.8 1,133.6 1,142.5 1,148.4 1,158.0 1,171.0 1,189.4 1,538.7 1,561.5 1,667.1 13.5 1.5 6.8 Imports 1,586.4 1,581.5 1,538.5 1,550.0 1,569.5 1,587.9 1,612.8 1,653.2 ** Income & Profits $8,281.7 $8,664.3 $9,040.0 6.3 4.6 4.3 Personal income $8,349.0 $8,429.7 $8,550.9 $8,622.7 $8,707.5 $8,776.3 $8,883.8 $8,981.0 6,989.8 7,358.2 7,721.8 5.3 5.3 4.9 Disposable personal income 7,040.9 7,087.0 7,179.2 7,244.2 7,524.1 7,485.3 7,582.8 7,665.9 0.8 1.5 1.7 - - - Savings rate (%) 1.0 1.1 1.4 1.4 1.5 1.6 1.8 1.8 925.6 879.6 926.6 12.5 (5.0) 5.3 Corporate profits before taxes 945.1 894.1 866.0 871.9 884.1 896.6 902.4 917.8 641.4 621.1 664.4 13.1 (3.2) 7.0 Corporate profits after taxes 654.4 626.4 601.9 617.2 627.5 637.7 644.6 657.7 50.81 45.78 46.33 5.5 (9.9) 1.2 ‡ Earnings per share (S&P 500) 53.70 50.81 47.88 46.83 45.04 45.78 47.28 46.66 † Prices & Interest Rates 3.4 3.3 2.0 - - - Consumer price index 3.5 2.9 4.2 3.7 2.6 1.8 1.9 1.9 5.8 3.8 3.3 - - - Treasury bills 6.0 6.0 4.8 3.9 3.3 3.2 3.2 3.2 6.0 5.1 5.1 - - - 10-yr notes 5.9 5.6 5.1 5.2 5.1 5.1 5.1 5.1 5.9 5.6 5.7 - - - 30-yr bonds 5.8 5.7 5.4 5.7 5.6 5.6 5.6 5.6 7.7 8.1 8.1 - - - New issue rate–corporate bonds 7.5 7.9 8.0 8.0 8.2 8.2 8.2 8.1 Other Key Indicators 146.9 146.6 150.3 5.6 (0.2) 2.5 Industrial production index (1992=100) 148.3 147.9 146.1 145.9 146.8 147.6 148.3 149.6 81.3 77.4 76.3 - - - Capacity utilization rate (%) 81.7 80.3 78.3 77.4 77.1 76.7 76.3 76.1 1,605.3 1,530.2 1,466.6 (4.2) (4.7) (4.2) Housing starts (1,000 units SAAR) 1,527.7 1,556.7 1,639.3 1,547.4 1,465.4 1,468.7 1,459.2 1,448.0 17.4 16.5 16.7 2.8 (5.1) 1.4 Auto & truck sales (1,000,000 units) 17.5 16.3 17.2 16.4 16.2 16.1 16.4 16.7 4.0 4.7 5.6 - - - Unemployment rate (%) 4.0 4.0 4.2 4.7 4.9 5.1 5.4 5.6 3.0 (2.6) (5.5) - - - § U.S. dollar 0.6 0.4 (1.6) (1.7) (1.5) (1.6) (1.5) (1.4) Note: Annual changes are from prior year and quarterly changes are from prior quarter. Figures may not add to totals because of rounding. A–Advance data. P–Preliminary. E–Estimated. R–Revised. *1992 Chain-weighted dollars. **Current dollars. ‡Trailing 4 quarters. †Average for period. §Quarterly % changes at quarterly rates. This forecast prepared by Standard & Poor‘s.
  • 38.
    Appendix II Profiles ofComparative Guideline Public Companies
  • 39.
    CENTEX CONSTRN PRODSINC TICKER: CXP ADDRESS: 3710 Rawlins St Ste 1600 EXCHANGE: New York Stock Exchange Dallas TX 75219-4258 INDUSTRY: CONCRETE,GYPSUM,PLASTER PDS CURRENT BETA 0.55 2,500.000 $50.00 $45.00 2,000.000 $40.00 $35.00 1,500.000 $30.00 Volume Price $25.00 1,000.000 $20.00 $15.00 500.000 $10.00 $5.00 0.000 $0.00 8 8 98 9 9 99 0 0 00 1 9 9 0 0 1 1 98 99 00 n9 g9 b9 r9 n9 g9 b0 r0 n0 g0 b0 r0 n0 ec ec ec ct ct ct Ap Ap Ap Ju Au Fe Ju Au Fe Ju Au Fe Ju O O O D D D 12 Mo Ended Fiscal Year End IN C OME ST A T EME N T Mar01 Mar01 Mar00 #N/AR O#N/A& N E T P R#N/AT G SS O FI Sales-Net 437.454 437.454 417.464 334.356 #N/A #N/A MARGINS Cost of Goods Sold 316.950 316.950 228.983 197.424 191.106 158.675 SG&A Expense 4.691 4.691 4.683 4.380 3.825 3.904 60 Operating Income 115.813 115.813 183.798 132.552 100.452 74.978 Depreciation & Amortization 24.871 24.871 18.589 50 16.187 15.880 13.752 Interest Expense @CF 9.046 @CF @CF @CF @CF 40 Non-Operating Income 1.321 10.367 4.968 4.762 3.761 3.180 Special Items 0.000 0.000 0.000 30 0.000 0.000 0.000 PreTax Income 92.263 92.263 170.177 121.127 88.333 64.406 20 Income Before Extra Items 59.429 59.429 108.232 77.289 56.533 41.799 Net Income 59.429 59.429 108.232 10 77.289 56.533 41.799 EPS excluding Extra Items (Primary) 3.23 3.23 5.66 3.73 2.58 1.89 0 EPS excl Extra Items (Fully Diluted) 3.22 3.22 5.63 3.71 2.56 1.89 6 6 7 7 8 8 9 9 0 0 9 9 9 9 9 9 9 9 0 0 2Y 4Y 2Y 4Y 2Y 4Y 2Y 4Y 2Y 4Y Q Q Q Q Q Q Q Q Q Q BALANCE SHEET Mar01 Mar01 Mar00 #N/A #N/A #N/A Cash & Short Term Investments 8.747 8.747 96.170 49.646 62.090 4.812 Receivables - Total 92.619 92.619 54.459 43.192 36.669r i c e / B o o k 38.700 P Inventories - Total 56.008 56.008 38.582 33.030 32.537 31.482 Total Current Assets 157.374 157.374 189.211 125.868 131.296 74.994 3 Plant, Property, Equipment - Net 583.333 583.333 235.900 228.557 212.909 224.376 Debt in Current Liabilities 0.080 0.080 0.080 2.5 0.080 0.080 2.080 Accounts Payable 42.168 42.168 22.348 18.276 18.404 16.472 Current Liabilities-Total 90.191 90.191 72.987 2 59.205 53.579 46.806 LT Debt-Total 278.748 278.748 0.320 0.400 0.480 0.560 Preferred Stock 0.000 0.000 0.000 1.5 0.000 0.000 0.000 Common Stock 0.183 0.183 0.186 0.197 0.215 0.220 Capital Surplus 14.614 14.614 20.302 1 62.376 130.413 147.212 Retained Earnings 377.523 377.523 319.984 217.347 144.175 92.004 Treasury Stock-Total $ Amt 0.000 0.000 0.000 0.5 0.000 0.000 0.000 Common Equity-Total 392.320 392.320 340.472 279.920 274.803 239.436 0 Stockholders' Equity 392.320 392.320 340.472 279.920 274.803 Mar97 Mar98 Mar99 239.436 Mar00 Mar01 Assets-Total 809.960 809.960 438.139 364.683 351.112 305.637 5- Y E A R A N N U A L S A L E S G R O W T H PER SH ARE O V ERVIEW 30% Qtr End EPS Dividends 25% Jun01 0.30 0.050 20% Mar01 0.20 0.050 15% Dec00 0.63 0.050 10% Sep00 1.14 0.050 5% Jun00 1.25 0.050 0% Mar00 1.24 0.100 Mar97 Mar98 Mar99 Mar00 Mar01 1.53 Dec99 0.050 Sep99 1.72 0.000 Jun99 1.16 0.050
  • 40.
    CONTINENTAL MATERIALS CORP TICKER: CUO ADDRESS: 225 W Wacker Dr Ste 1800 EXCHANGE: American Stock Exchange Chicago IL 60606-1274 INDUSTRY: CONCRETE,GYPSUM,PLASTER PDS CURRENT BETA 0.16 160.000 $30.00 140.000 $25.00 120.000 $20.00 100.000 Volume Price 80.000 $15.00 60.000 $10.00 40.000 $5.00 20.000 0.000 $0.00 8 8 98 9 9 99 0 0 00 1 9 9 0 0 1 1 98 99 00 n9 g9 b9 r9 n9 g9 b0 r0 n0 g0 b0 r0 n0 ec ec ec ct ct ct Ap Ap Ap Ju Au Fe Ju Au Fe Ju Au Fe Ju O O O D D D 12 Mo Ended Fiscal Year End IN C OME ST A T EME N T Mar01 Dec00 Dec99 #N/AR O#N/A& N E T P R#N/AT G SS O FI Sales-Net 113.015 110.288 118.620 108.744 #N/A #N/A MARGINS Cost of Goods Sold @SF 81.521 86.181 81.881 74.524 70.094 SG&A Expense @SF 15.158 16.146 15.056 14.451 14.483 35 Operating Income @SF 13.609 16.293 11.807 9.063 8.191 30 Depreciation & Amortization 5.718 5.419 4.998 3.992 3.493 2.614 Interest Expense @SF 0.571 0.469 25 0.585 0.921 0.584 Non-Operating Income @SF 0.691 (0.084) 20 (0.237) 0.161 (0.708) Special Items 0.000 0.000 0.000 15 0.000 0.000 (0.780) PreTax Income 7.576 8.310 10.742 10 6.993 4.810 3.505 Income Before Extra Items 4.871 5.335 6.902 4.618 3.110 2.355 5 Net Income 4.871 5.335 6.902 4.618 3.110 2.355 0 EPS excluding Extra Items (Primary) 2.63 2.86 3.39 2.15 1.41 1.07 -5 EPS excl Extra Items (Fully Diluted) 2.59 2.81 3.32 2.11 1.39 1.03 6 6 7 7 8 8 9 9 0 0 9 9 9 9 9 9 9 9 0 0 2Y 4Y 2Y 4Y 2Y 4Y 2Y 4Y 2Y 4Y Q Q Q Q Q Q Q Q Q Q BALANCE SHEET Mar01 Dec00 Dec99 #N/A #N/A #N/A Cash & Short Term Investments 2.824 6.216 0.347 7.120 1.524 0.379 Receivables - Total 18.282 16.723 20.161 16.821 13.882r i c e / B o o k 14.584 P Inventories - Total 16.733 16.014 15.966 12.050 14.293 15.184 Total Current Assets 41.308 41.525 39.066 38.686 32.042 32.834 1.2 Plant, Property, Equipment - Net 30.316 24.727 26.891 22.105 19.581 18.818 Debt in Current Liabilities 3.534 2.158 4.182 1 2.526 1.900 1.900 Accounts Payable 14.222 4.437 7.263 5.124 3.514 5.182 Current Liabilities-Total 17.824 17.280 23.057 0.8 20.492 13.449 16.213 LT Debt-Total 17.002 5.147 1.875 4.284 6.400 6.500 Preferred Stock 0.000 0.000 0.000 0.6 0.000 0.000 0.000 Common Stock 0.643 0.643 0.643 0.663 0.663 0.663 Capital Surplus 1.985 1.985 1.983 0.4 3.484 3.484 3.484 Retained Earnings 48.057 48.138 42.803 35.901 31.283 28.173 Treasury Stock-Total $ Amt 9.247 8.953 6.386 0.2 3.810 3.572 2.970 Common Equity-Total 41.438 41.813 39.043 36.238 31.858 29.350 0 Stockholders' Equity 41.438 41.813 39.043 36.238 Dec96 31.858 Dec97 Dec98 29.350 Dec99 Dec00 Assets-Total 80.398 68.250 67.751 63.617 54.355 53.893 5- Y E A R A N N U A L S A L E S G R O W T H PER SH ARE O V ERVIEW 25% Qtr End EPS Dividends 20% Mar01 -0.04 0.000 15% Dec00 1.61 0.000 10% 5% Sep00 0.50 0.000 0% Jun00 0.56 0.000 -5% Mar00 0.20 0.000 -10% Dec99 1.27 0.000 Dec96 Dec97 Dec98 Dec99 Dec00 0.80 Sep99 0.000 Jun99 0.99 0.000 Mar99 0.34 0.000
  • 41.
    FLORIDA ROCK INDS TICKER: FRK ADDRESS: 155 E 21st St EXCHANGE: New York Stock Exchange Jacksonville FL 32206-2136 INDUSTRY: CONCRETE,GYPSUM,PLASTER PDS CURRENT BETA 0.37 1,400.000 $60.00 1,200.000 $50.00 1,000.000 $40.00 Volume Price 800.000 $30.00 600.000 $20.00 400.000 200.000 $10.00 0.000 $0.00 8 8 98 9 9 99 0 0 00 1 9 9 0 0 1 1 98 99 00 n9 g9 b9 r9 n9 g9 b0 r0 n0 g0 b0 r0 n0 ec ec ec ct ct ct Ap Ap Ap Ju Au Fe Ju Au Fe Ju Au Fe Ju O O O D D D 12 Mo Ended Fiscal Year End IN C OME ST A T EME N T Mar01 Sep00 Sep99 #N/AR O#N/A& N E T P R#N/AT G SS O FI Sales-Net 666.546 647.753 579.302 492.467 #N/A #N/A MARGINS Cost of Goods Sold 448.277 448.046 408.282 350.888 326.941 290.804 SG&A Expense 71.251 65.131 54.782 47.290 43.096 36.768 40 Operating Income 147.018 134.576 116.238 94.289 86.766 71.101 35 Depreciation & Amortization 59.187 51.960 38.497 33.433 30.688 28.766 Interest Expense 11.451 10.077 4.334 30 1.803 1.110 2.012 Non-Operating Income 1.578 3.358 7.160 25 3.133 1.402 0.787 Special Items 2.014 16.256 (8.719) 20 (2.209) 0.000 0.000 PreTax Income 79.972 92.153 71.848 15 59.977 56.370 41.110 Income Before Extra Items 51.817 59.714 46.557 38.860 37.142 27.000 10 Net Income 51.817 59.714 46.557 38.860 37.142 27.000 5 EPS excluding Extra Items (Primary) 2.79 3.21 2.47 2.06 1.98 1.43 0 EPS excl Extra Items (Fully Diluted) 2.73 3.15 2.42 2.02 1.94 1.42 6 7 7 8 8 9 9 0 0 1 9 9 9 9 9 9 9 0 0 0 3Y 1Y 3Y 1Y 3Y 1Y 3Y 1Y 3Y 1Y Q Q Q Q Q Q Q Q Q Q BALANCE SHEET Mar01 Sep00 Sep99 #N/A #N/A #N/A Cash & Short Term Investments 2.560 3.372 3.726 4.457 18.433 4.995 Receivables - Total 80.777 82.468 75.386 65.334 56.723r i c e / B o o k 52.436 P Inventories - Total 33.435 32.831 23.634 25.535 22.587 23.475 Total Current Assets 125.859 123.348 122.465 100.607 104.194 87.082 2.5 Plant, Property, Equipment - Net 487.701 486.544 419.917 321.055 250.005 233.858 Debt in Current Liabilities 13.944 3.243 35.813 10.824 2.747 3.914 2 Accounts Payable 34.288 40.624 41.590 38.783 32.867 28.602 Current Liabilities-Total 76.568 80.717 107.566 74.786 55.676 51.857 LT Debt-Total 152.294 163.620 96.989 1.5 23.935 10.859 16.862 Preferred Stock 0.000 0.000 0.000 0.000 0.000 0.000 Common Stock 1.897 1.897 1.897 1 1.897 0.949 0.949 Capital Surplus 17.071 17.549 18.249 18.796 19.001 17.400 Retained Earnings 392.443 373.650 321.832 281.882 247.733 215.195 0.5 Treasury Stock-Total $ Amt 11.436 13.147 3.720 2.689 3.068 5.394 Common Equity-Total 399.975 379.949 338.258 299.886 264.615 228.150 0 Stockholders' Equity 399.975 379.949 338.258 299.886 264.615 Sep96 Sep97 Sep98 228.150 Sep99 Sep00 Assets-Total 697.191 690.045 604.168 451.556 382.616 346.709 5- Y E A R A N N U A L S A L E S G R O W T H PER SH ARE O V ERVIEW 20% Qtr End EPS Dividends Mar01 0.68 0.125 15% Dec00 0.58 0.125 10% Sep00 0.58 0.125 5% Jun00 0.95 0.100 Mar00 0.45 0.100 0% Dec99 1.23 0.100 Sep96 Sep97 Sep98 Sep99 Sep00 0.68 Sep99 0.100 Jun99 0.74 0.125 Mar99 0.51 0.000
  • 42.
    STEWART ENTERPRISES -CLA TICKER: STEI ADDRESS: 110 Veterans Memorial Blvd EXCHANGE: NASDAQ Metairie LA 70005-3027 INDUSTRY: PERSONAL SERVICES PHONE: 504-837-5880 CURRENT BETA 1.00 120,000.000 $35.00 100,000.000 $30.00 $25.00 80,000.000 Volume Price $20.00 60,000.000 $15.00 40,000.000 $10.00 20,000.000 $5.00 0.000 $0.00 8 8 98 9 9 99 0 0 00 8 9 9 0 0 1 1 98 99 00 r9 n9 g9 b9 r9 n9 g9 b0 r0 n0 g0 b0 r0 ec ec ec ct ct ct Ap Ap Ap Ap Ju Au Fe Ju Au Fe Ju Au Fe O O O D D D 12 Mo Ended Fiscal Year End INCOME STATEMENT Oct00 Oct00 Oct99 #N/A #N/A NET PROFIT GROSS & #N/A Sales-Net 734.801 734.801 756.108 648.365 #N/A #N/A MARGINS Cost of Goods Sold 501.494 507.179 500.820 416.839 357.442 293.568 SG&A Expense 19.763 19.763 19.161 16.621 15.402 14.096 40 Operating Income 213.544 207.859 236.127 214.905 159.742 125.723 Depreciation & Amortization 54.267 48.582 44.887 30 35.542 17.972 21.701 Interest Expense 56.284 56.284 52.174 43.821 38.031 26.051 20 Non-Operating Income 2.194 2.194 3.485 6.184 2.738 2.504 Special Items 0.000 0.000 0.000 10 (76.762) 0.000 1.600 PreTax Income 105.187 105.187 142.551 64.964 106.477 82.075 0 Income Before Extra Items 66.794 66.794 90.520 41.902 69.742 51.297 Net Income 66.794 66.794 40.419 -10 41.902 67.418 51.297 EPS excluding Extra Items (Primary) 0.63 0.63 0.84 0.43 0.79 0.62 -20 EPS excl Extra Items (Fully Diluted) 0.63 0.63 0.84 0.43 0.79 0.62 96 96 96 96 97 97 97 97 98 98 98 98 00 00 00 1Y 2Y 3Y 4Y 1Y 2Y 3Y 4Y 1Y 2Y 3Y 4Y 2Y 3Y 4Y Q Q Q Q Q Q Q Q Q Q Q Q Q Q Q BALANCE SHEET Oct00 Oct00 Oct99 #N/A #N/A #N/A Cash & Short Term Investments 98.868 98.868 77.426 36.853 36.255 27.094 Receivables - Total 177.474 177.474 176.215 Price/Book 109.129 171.849 129.760 Inventories - Total 60.649 60.649 51.431 48.833 43.044 31.044 Total Current Assets 341.054 341.054 311.069 261.405 213.751 171.542 3 Plant, Property, Equipment - Net 447.929 447.929 447.045 381.739 329.404 278.781 Debt in Current Liabilities 29.857 29.857 12.582 2.5 11.219 33.973 4.240 Accounts Payable 20.342 20.342 21.802 19.048 16.705 11.889 Current Liabilities-Total 134.476 134.476 133.476 2 118.782 107.137 73.482 LT Debt-Total 920.670 920.670 938.831 913.215 524.351 515.901 Preferred Stock 0.000 0.000 0.000 1.5 0.000 0.000 0.000 Common Stock 106.832 106.832 106.219 98.028 48.682 41.800 Capital Surplus 673.658 673.658 671.891 1 492.177 526.180 306.706 Retained Earnings 294.167 294.167 278.502 249.085 244.708 198.941 Treasury Stock-Total $ Amt 0.000 0.000 0.000 0.5 0.000 0.000 0.000 Common Equity-Total 1,074.657 1,074.657 1,056.612 839.290 819.570 547.447 0 Stockholders' Equity 1,074.657 1,074.657 1,056.612 839.290 819.570 Oct96 Oct97 Oct98 547.447 Oct99 Oct00 Assets-Total 2,337.008 2,337.008 2,283.880 2,071.802 ####### 1,365.941 5-YEAR ANNUAL SALES GROWTH PER SHARE OVERVIEW Qtr End EPS Dividends 25% 20% Oct00 0.10 0.000 15% Jul00 0.17 0.020 10% Apr00 0.18 0.020 5% Jan00 0.18 0.020 0% Oct99 0.15 0.020 -5% Jul99 0.21 0.020 Oct96 Oct97 Oct98 Oct99 Oct00 Apr99 0.24 0.020 Jan99 0.24 0.020 Oct98 0.22 0.020
  • 43.
    U S CONCRETEINC TICKER: RMIX ADDRESS: 1300 Post Oak Blvd Ste 1200 EXCHANGE: NASDAQ Houston TX 77056-3018 INDUSTRY: CONCRETE,GYPSUM,PLASTER PDS CURRENT BETA -1.16 3,500.000 $12.00 3,000.000 $10.00 2,500.000 $8.00 Volume Price 2,000.000 $6.00 1,500.000 $4.00 1,000.000 500.000 $2.00 0.000 $0.00 8 8 98 9 9 99 0 0 00 1 9 9 0 0 1 1 98 99 00 n9 g9 b9 r9 n9 g9 b0 r0 n0 g0 b0 r0 n0 ec ec ec ct ct ct Ap Ap Ap Ju Au Fe Ju Au Fe Ju Au Fe Ju O O O D D D 12 Mo Ended Fiscal Year End IN C OME ST A T EME N T Mar01 Dec00 Dec99 #N/AR O#N/A& N E T P R#N/AT G SS O FI Sales-Net 416.581 394.636 167.912 66.499 #N/A #N/A MARGINS Cost of Goods Sold 334.776 314.297 135.195 53.974 43.794 @NA SG&A Expense 31.207 27.741 9.491 4.712 4.265 @NA 25 Operating Income 50.598 52.598 23.226 7.813 5.572 @NA Depreciation & Amortization 12.099 11.212 3.453 20 0.930 1.330 @NA Interest Expense 16.814 14.095 1.708 15 0.165 0.226 @NA Non-Operating Income 1.291 1.319 0.663 0.036 0.026 @NA 10 Special Items 0.000 0.000 (2.880) 0.000 0.000 @NA 5 PreTax Income 22.976 28.610 15.848 6.754 4.042 @NA Income Before Extra Items 13.516 16.860 8.190 0 6.654 4.499 @NA Net Income 13.516 16.860 8.190 6.654 4.499 @NA -5 EPS excluding Extra Items (Primary) 0.63 0.78 0.70 0.43 @NA @NA -10 EPS excl Extra Items (Fully Diluted) 0.63 0.78 0.70 0.43 @NA @NA 6 6 7 7 8 8 9 9 0 0 9 9 9 9 9 9 9 9 0 0 2Y 4Y 2Y 4Y 2Y 4Y 2Y 4Y 2Y 4Y Q Q Q Q Q Q Q Q Q Q BALANCE SHEET Mar01 Dec00 Dec99 #N/A #N/A #N/A Cash & Short Term Investments 2.673 0.711 0.627 4.213 1.945 @NA Receivables - Total 69.589 62.641 45.581 10.353 8.741r i c e / B o o k P @NA Inventories - Total 11.947 9.494 4.351 0.792 0.941 @NA Total Current Assets 92.757 77.952 52.317 16.347 12.087 @NA 1.2 Plant, Property, Equipment - Net 89.505 82.993 53.949 9.138 6.784 @NA Debt in Current Liabilities 0.085 0.107 0.140 1 1.006 0.776 @NA Accounts Payable 50.706 25.283 27.473 7.042 5.427 @NA Current Liabilities-Total 50.791 36.420 37.739 0.8 8.916 7.188 @NA LT Debt-Total 176.242 157.027 57.235 2.524 1.884 @NA Preferred Stock 0.000 0.000 0.000 0.6 0.000 0.000 @NA Common Stock 0.023 0.022 0.019 0.070 0.070 @NA Capital Surplus 131.795 127.170 104.271 0.4 0.554 0.554 @NA Retained Earnings 21.536 23.363 6.503 14.530 10.107 @NA Treasury Stock-Total $ Amt 0.000 0.000 0.000 0.2 0.000 0.000 @NA Common Equity-Total 153.354 150.555 110.793 15.154 10.731 @NA 0 Stockholders' Equity 153.354 150.555 110.793 15.154 Dec96 10.731 Dec97 Dec98 @NA Dec99 Dec00 Assets-Total 394.374 355.837 212.734 26.640 19.837 @NA 5- Y E A R A N N U A L S A L E S G R O W T H PER SH ARE O V ERVIEW 200% Qtr End EPS Dividends Mar01 -0.08 0.000 150% Dec00 0.09 0.000 100% Sep00 0.31 0.000 50% Jun00 0.31 0.000 Mar00 0.08 0.000 0% Dec99 0.24 0.000 Dec96 Dec97 Dec98 Dec99 Dec00 0.30 Sep99 0.000 Jun99 -0.23 @NA Mar99 0.06 @NA
  • 44.
    Appendix III Assumptions for the Income Approach The valuation conclusions determined under the Capitalization of Earnings Method are dependent upon certain key assumptions incorporated into the analysis, such as the assumed level of risk (as embodied in the chosen capitalization rate) and the expected growth rate. The Capitalization of Earnings Method is premised upon the concept of the present value of a perpetuity, which is a cash stream that is expected to be received each year for the indefinite future. The application of this approach is widespread, and the methodology is uniformly accepted among valuation professionals and other financial practitioners. Previously in this report we presented the assumptions underlying our determination of the normalized level of annual cash flow for the subject company. This cash flow is then divided by the company’s cost of capital minus its long-term growth rate. In determining an appropriate weighted average cost of capital (“WACC”), we must consider such things as the returns investors can achieve on alternate investments, the time-value of money as well as the risks associated with the subject company actually achieving the anticipated level of cash flow. In quantifying the expected rate of growth in cash flow we must consider such things as inflation, expectations for the guideline companies and the subject industry, and input from management of the subject company. Because we are establishing a growth rate that can be achieved into perpetuity, we generally select numbers that are lower than the anticipated growth rate in the short term. Following are definitions of the key variables involved in the computation of the WACC for the subject company: Pre-tax Cost of Debt (PD) is the subject company’s marginal cost of borrowing long-term funds. After-tax Cost of Debt (AD) is the subject company’s marginal cost of borrowing long-term funds after factoring in the benefits of the deductibility of interest. Risk-free Rate of Return (RF) is the return an investor would require as of the Valuation Date to invest in a long-term security with essentially no risk. The best proxy for a risk-free long-term security is the 10-year U.S. Treasury bond. Equity Risk Premium (EP) is the premium that investors have historically required to invest in stocks over the returns that were available historically on U.S. Treasury bonds. We utilize data from relevant studies performed by Ibbotson & Associates. Beta (B) represents the volatility of an individual stock (as a result of the risks inherent in the underlying business) relative to the volatility of the overall stock market. A beta of greater than 1.0 means the subject stock is more volatile than the overall stock market; a beta of less than 1.0 means the subject stock is less volatile than the overall stock market. We analyze the betas of the comparative guideline public companies in order to estimate an appropriate beta for the subject company.
  • 45.
    Appendix III Assumptions for the Income Approach Small-Company Premium (SCP) is the incremental return historically required by investors in small stocks over the return required by investors in the overall stock market, after considering the impact of beta. We use the results of studies by Ibbotson & Associates and PriceWaterhouseCoopers when assigning a SCP. Company-Specific Premium (CSP) is the incremental return required by investors in early-stage companies and companies with extraordinary risk characteristics, after considering the small-company premium and the impact of beta. Growth (G) is the estimated growth in annual cash flows that can be sustained in perpetuity. It is important to understand that this estimated growth number is typically relatively low (i.e., 1% to 5%), because of the assumption that this growth occurs forever. Capital Structure (CS) refers to the optimal percentage of debt and equity that the company would operate with over time given its specific circumstances and the norms within its industry. This may differ from the existing capital structure of the subject company. The WACC is the after-tax cost of debt times the percentage of debt in the subject company’s optimal capital structure, plus the cost of equity (after-tax and pre-tax are the same because dividends are not tax deductible) times the percentage of equity in the subject company’s optimal capital structure. Following are the assumptions used to derive the capitalization rate for purposes of valuing the subject company: PD = 11.0% AD = 6.6% RF = 6.5% EP = 8.0% B = 0.40 SCP = 3.0% CSP = 2.0% G = 2.5% CS ( % Debt) = 20.0% CS (% Equity) = 80.0% Cost of Debt = 6.6% Cost of Equity = 14.7% WACC = 13.1% Weighted Average Cost of Capital (WACC) = (Debt% * AD) + (Equity% * (RF + SCP +CSP+ B(EP)) And the Capitalization Rate = WACC - G
  • 46.
    Appendix IV Premiums & Discounts Control Premiums A controlling interest in a company is considered to have greater value than a non-controlling (minority) interest because the holder of a controlling interest has the ability to implement changes in businesses policies, while the holder of a minority interest does not. Accordingly, when the subject interest being valued is a controlling interest, we must apply a control premium. Conversely, when the subject interest being valued is a non-controlling (minority) interest, we must apply a discount for lack of control. Control premiums can vary tremendously. Factors that affect the magnitude of a control premium include: • The nature and magnitude of non-operating assets. • The nature and magnitude of discretionary expenses. • The perceived quality of existing management. • The nature and magnitude of business opportunities which are not currently being exploited. • The ability to integrate the acquiree into the acquiror’s business or distribution channels.1 Mergerstat’s Control Premium Study defines a control premium as “the additional consideration that an investor would pay over a marketable minority equity value (i.e., current, publicly-traded stock prices) in order to own a controlling interest in the common stock of a company.”2 The primary objective of control premium studies is to measure the premium over marketable minority interest transaction prices at which controlling interests in the same class of stock of the same company have been acquired. The percentage of the per share acquisition price over the pre-announcement minority public market per share trading price is commonly called the control premium. Conversely, the percentage below the per share acquisition price at which the minority stock had been trading in the public markets is commonly called the minority interest discount. In reality, it might be more appropriate to refer to the subject premium as an acquisition premium rather than a control premium because control level transaction prices often reflect additional factors over and above the noted elements of control, such as synergistic benefits. If a controlling interest in a company is being valued using multiples derived from trading prices of minority interests in publicly-traded stocks, such as in the Guideline Public Company Method, then a control premium must be applied when determining certain comparative guideline public company stock value multiples. However, if a controlling interest in the subject company is being valued using a method that already considers the company on a control basis such as the Adjusted Net Asset Value Method, the Capitalization of Earnings Method, as applied herein, the Discounted Cash Flow Method, or the Guideline Transaction Method, then a control premium need not be applied. 1 Mergerstat Control Premium Study 3rd Quarter 2000 (Los Angeles: Mergerstat LP) 2 Ibid.
  • 47.
    Appendix IV Premiums & Discounts Mergerstat Review’s 2001 Control Premium Study for SIC codes in the 3754-3756 range (Concrete Products) yielded the following control premium data (30 transactions): Range 3.4% - 59.3% Median 19.9% Mean 21.7% We have elected to apply a median control premium from the above study as rounded to 20%. Discounts for Lack of Marketability Because the subject company is privately held, its shareholders have no access to an active, public trading market in the subject company's shares. Without market access, an investor's ability to control the timing of potential gains, to avoid losses, and to minimize the opportunity costs associated with the inability to direct funds to a more promising investment are severely impaired. Accordingly, it is appropriate to discount the value of illiquid securities to reflect this differential in marketability. If an investor in a publicly-traded company needs cash or becomes dissatisfied with the performance of the issuing company or its management team, he/she can sell his/her interest almost immediately at its market value. An investor in a publicly-traded company also enjoys a certain level of assurance that management will operate the issuing company in the best interest of the shareholders if effective governance mechanisms are in place. As a result of regulatory reporting requirements and analyst coverage, an investor in a publicly-traded company also has access to significant information concerning a company's performance. There are two categories of empirical data that assist appraisers and investors in quantifying appropriate discounts for lack of marketability: 1) discounts on sales of restricted shares of publicly- traded companies (restricted stock transactions); and 2) prices on earlier sales of privately-held company shares compared to subsequent per share prices in initial public offerings for the same or a similar class of shares of the same company (pre-IPO transactions). Studies of restricted stock transactions are generally considered to provide better data because they directly measure the difference between the prices of two otherwise identical securities at the same point in time. Restricted securities are subject to the marketability restrictions of Rule 144 of the Securities Act of 1933. Rule 144 was adopted by the Securities and Exchange Commission (“SEC”) in 1972. Under Rule 144, unregistered securities had to be held for a minimum of two years before they could be sold. After this two-year holding period expired, the restricted securities could be sold only in accord with certain volume limit provisions. To qualify for an exemption under Rule 144, the total number of restricted securities sold in any three-month period cannot exceed the greater of: 1) one percent of the total number of the issuing company’s outstanding shares, or 2) the average weekly reported trading volume during the four weeks preceding the sale (these are referred to as “dribble out” provisions).
  • 48.
    Appendix IV Premiums & Discounts Rule 144 also allowed that any person or entity who is not considered an affiliate of the issuer could sell all remaining securities, without being subject to the “dribble out” provisions, after a holding period of a minimum of three years. In 1990, Rule 144 was amended. Prior to this amendment, if a purchaser of restricted securities sold such securities in a privately-negotiated transaction, the required holding period would start anew for the new buyer. The 1990 amendment allowed the new buyer of restricted securities to “tack” the holding period of the previous owner(s) of the restricted securities onto his own holding period, but only if the previous owner was not an affiliate of the issuing company. Accordingly, the 1990 amendment effectively increased the liquidity of restricted securities. In 1997, Rule 144 was amended once again. The 1997 amendment shortened the initial holding period from two years to one year and the holding period for non-affiliates from three years to two years. Most of the studies discussed herein involve transactions taking place before the 1990 amendment and none of the studies discussed herein involve transactions taking place after the 1997 amendment. In some ways, this makes the data derived from the studies discussed herein even more relevant than data that might be derived from studies involving transactions taking place after the 1997 amendment. This is because restricted securities existing prior to the 1990 and 1997 amendments were less liquid than restricted securities existing subsequent to the 1990 and 1997 amendments and were, therefore, more similar to securities of privately-held companies, which have no trading market. The Internal Revenue Service, through Revenue Ruling 77-287, has set forth guidelines for the determination of discounts for lack of marketability for securities subject to restriction under Rule 144. Revenue Ruling 77-287 notes two primary factors that a purchaser of restricted securities must consider: • “The risk that the underlying value of the stock will change in a way that, absent the restrictive provisions, would have prompted a decision to sell.” • “The risk that the contemplated means of legally disposing of the stock may not materialize.” Revenue Ruling 77-287 sets forth that the value of a security restricted under Rule 144 is less than the value of that security’s freely-traded counterpart. Revenue Ruling 77-287 also provides the following guidelines for the determination of discounts for lack of marketability for securities subject to restriction under Rule 144: • No automatic formulas should be used to determine the discount for lack of marketability. • The discount for lack of marketability is a function of the earnings, net assets and sales of the subject entity. • The discount for lack of marketability is a function of the trading market for the equivalent freely-traded stock. • The discount for lack of marketability is a function of the resale restrictions applicable to the restricted security.
  • 49.
    Appendix IV Premiums & Discounts Institutional Investor Study Revenue Ruling 77-287 is based on the Institutional Investor Study Report4 (“SEC Study”). The SEC Study measured discounts in transactions occurring from 1966-1969 that involved securities that were restricted under provisions similar to Rule 144. Based on more than 300 such transactions, the SEC Study found the following: • Companies Sorted By Exchange Discount Range NYSE 10% - 20% ASE 20% - 30% OTC - Reporting 20% - 30% OTC - Non-reporting 30% - 40% • Companies Sorted By Sales $100 mm + 10% - 20% $20 mm - $100 mm 10% - 20% $ 5 mm - $ 20 mm 10% - 20% $ 1 mm - $ 5 mm 30% - 40% $ 0 mm - $ 1 mm 30% - 40% • Companies Sorted By Earnings $10 mm + 10% - 20% $ 1 mm - $ 10 mm 10% - 20% $ 0 mm - $ 1 mm 20% - 30% • Overall Mean Discount 24% • Overall Median Discount 26% The SEC Study includes transactions in securities with certain resale provisions, commonly referred to as registration rights. The SEC Study notes that the existence of such resale provisions “assuages, but by no means eliminates the illiquid character of restricted securities.” The SEC Study does not separate the transactions involving securities with resale provisions from those without. The SEC Study provides useful insight to appraisers and investors for quantifying appropriate discounts for lack of marketability. More particularly, securities of a privately-held firm, such as the subject company, should be considered less liquid than the Rule 144 securities of a publicly-held company that are sold in a private placement. A publicly-held company has an established trading market for its securities and its Rule 144 securities will eventually become tradable in that market, 4 Institutional Investor Study Report of the Securities and Exchange Commission, H.R. Doc. No. 64, Part 5, 92nd Congress, 1st Session, 1971, pp. 2444- 2456.
  • 50.
    Appendix IV Premiums & Discounts which generally indicates a discount for lack of marketability for private companies higher than the overall mean discount in the SEC Study. Other Studies Involving Discounts on Sales of Restricted Shares of Publicly-Traded Companies Several restricted stock studies other than the SEC Study have focused on discounts for lack of marketability. The restricted stock studies summarized in the table below typically indicate discounts for lack of marketability in the 25 to 45 percent range. The last two studies in the table below, the Solberg Study and the Moore Study, both of which surveyed court cases, reflect average discounts for lack of marketability of 37.4 percent and 24.0 percent, respectively. While the studies summarized in the table below provide less detail than the SEC Study, they can be used as benchmarks that indicate higher discounts than the SEC Study. The Standard Research Consultants study is somewhat anomalous and reflects a median discount for lack of marketability of 45 percent. Four of the other five studies (excluding the Solberg Study and the Moore Study) reflect median or average discounts for lack of marketability in a very tight range of approximately 31-35 percent. Market Study Data Date Range Average Discount Gelman Study 1968-1970 33.00% * Trout Study 1968-1972 33.45% Maher Study 1969-1973 35.43% Standard Research Consultants 1978-1982 45.00% * Willamette Management Associates Study 1981-1984 31.20% * Management Planning Study 1980-1990 24.50% Solberg Study 37.40% Moore Study 24.00% * Denotes median discounts The data indicates that companies with the largest sales volumes have the smallest discounts for lack of marketability and companies with the smallest sales volumes have the largest discounts for lack of marketability. This may be partially a result of the market on which the issuing company’s unrestricted securities trade. For example, in the SEC Study, discounts for lack of marketability on restricted securities were found to be the lowest for NYSE-listed companies, and increased, in order, for ASE- listed companies, OTC-reporting companies and OTC-non-reporting companies. A non-reporting OTC company is a company in which the stock is publicly-traded over the counter but is not subject to reporting requirements because its total assets are under $1 million or it has total stockholders numbering 500 or fewer. Non-reporting OTC companies, as opposed to reporting companies traded OTC or on the ASE or NYSE, are considered to more closely resemble privately-held companies. This would indicate that discounts for lack of marketability for privately-held companies should generally be on the higher end of the relevant range of discount for lack of marketability data.
  • 51.
    Appendix IV Premiums & Discounts Studies Involving Transactions in Closely-Held Stocks Prior to Initial Public Offerings Robert W. Baird & Co., under the direction of John O. Emory, has conducted six studies over time periods ranging from 1980 through April of 1995 comparing transaction prices in the stock of privately-held companies, at times when no public market existed for such stock, to the prices of the same or similar classes of stock when subsequently sold in an IPO transaction. Over the fifteen-year period of the study, the average discount for lack of marketability was 46.67%. THE VALUE OF MARKETABILITY AS ILLUSTRATED IN INITIAL PUBLIC OFFERINGS OF COMMON STOCK * Mean Median Study Discount Discount 1994-1995 45% 45% 1992-1993 45% 44% 1990-1992 42% 40% 1989-1990 45% 40% 1987-1989 45% 45% 1985-1986 43% 43% 1980-1981 60% 66% *Source: Emory, John D., The Value of Marketability as illustrated in Initial Public Offerings of Common Stock, Business Valuation Review, March 1994. Summary of Discount for Lack of Marketability Considerations All of the studies noted above regarding discounts for lack of marketability include transactions involving less than all of the issuing company’s outstanding shares. For most, if not all, of the transactions analyzed in the studies noted above, the subject blocks of stock constituted a minority interest in the issuing company. When we value a controlling interest, we must consider the extent to which the elements of control associated with the subject interest enhance marketability. Aside from the studies noted above, other factors that may effect the marketability of stock include associated puts and/or calls, transfer restrictions imposed by shareholder or other agreements, the history of and prospects for the continued payment of dividends, the prospects of a sale of some or all of the stock or assets of an issuing company, the prospects of a public offering of the subject stock, and an investor’s expected holding period and return, including the expected growth in value of the subject stock. After taking into consideration the above factors and empirical studies, it is our opinion that an appropriate discount for lack of marketability for the subject company is 20%.
  • 52.
    Appendix V Terms of the Engagement