The document discusses a project on the performance management system at Usha Martin Limited conducted by Shalini Pandey for her MBA program. It includes an executive summary, objectives, research methodology, background of the company, industry analysis, financial analysis, and details of the existing performance management system at Usha Martin Limited. The study analyzes various aspects of the performance management process through a survey of officers to understand its effectiveness.
Internship Report on HRM Practices at PAEC EC Chashma by Muhammad Mansha KhanMansha Khan
Internship at Education Centre at PAEC (Pakistan Atomic Energy Commission) Education Centre, Chashma, Punjab
PAEC Education Centre, Chashma providing the duties under the PAEC Federal Government in the shape of knowledge advancement study for all students who want to gain. It started its function and operations as complete Education Centre in 1996 at Chashma, Mianwali Punjab.
In this report I (Mansha Khan) divide all internship factors into various chapters. Each chapter explains the different human resource practices and administrative functions relevant to nature. In first chapter briefly explain introduction and history of EC, Chashma and also described the introduction of organizational functions. Second chapter relates to the structure and culture of organization where roles of different individuals with different mandates are explained. The overall management functions, duties and responsibilities are mention in this chapter which closely linked with management of facilities in the EC and with other departments.
Moving to next step which is related to the all activities which I perform during the internship training in this portion I described those task which I accomplish in the Office of Education Centre Chashma. At the last I explain the most significant chapter recoded in this report named as Human Resource Practices, here I describe the all Human Resource Management Practices which are perform by the organization like as (Recruitment, Promotion, PERs, Resignation of employees, Retention, Retirement etc) and different Policies.
Human resources and Administrative departments are the most vital resource of every institution to gain competitive edge over the all affective competitors which putting directly economical effects. Organization should manage these human resources there are many ways and practices that can be use to create workforce against the competitors by an organization.
This internship report contains the summary of HR & administrative exercises followed by PAEC Education Centre and how its significance to enhance their workforce. My assessments and different analysis depends on my journey as an intern at PAEC Education Centre, Chashma. In this report, I fully tried to uphold all experience and activities which I learn & perform under the supervision of Head EC.
By: Muhammad Mansha Khan (MBA 3.5 - HRM)
A well written summer training report for an IT company for its Human Resource section.
This report is developed regarding the summer training in TURT SOFTECH PVT. LTD. from 05th June 2013 for 08 weeks, on the project entitled –
“HR POLICIES AND ITS IMPLEMENTATION” at TURT SOFTECH PVT. LTD.
{ To Study the structure and function of HR policy in HCL/ICC,
{ To compare the HR policy of HCL/ICC with other companies of similar profile
{ To find out the key techniques that makes The HR Policy effective and valuable in HCL/ICC and in other organizations.
Internship Report on Square Pharmaceuticals Ltd.Mahfuz Tushar
The internship report primarily focuses on the Recruitment and Selection process of the
company. This report points out the existing conditions regarding employee recruitment and
selection that means find out the best personnel for the organization.
Prevue Guide Book: Hiring Workbook for consultants, HR, and managersIra Wolfe
The Prevue Assessment System provides business owners and human resource professionals with pre-employment assessment tests and succession planning reports that assist in hiring and promoting the right employees.
Enterprise resiliency and world-wide compliance, in-depth article.Thomas Bronack
This in-depth article will show how your company can achieve an optimized and safeguarded environment through Enterprise Resiliency and Corporate Certification.
Health Coaching Motivational Interviewing Proficiency Assessmentmkgreco
Overview and validation study of the Health Coaching Performance (HCPA) assessment and reporting tool and system for benchmarking the proficiency of health care professionals in motivational interviewing and evidence-based health coaching.
1. A Project on
Performance Management System At Usha Martin Limited
(MBA 2011-13)
NARAINI EDUCATIONAL AND CHARITABLE SOCIETY’S GROUP OF
INSTITUTIONS
A constituent of Kurukshetra University
www.kuk.ac.in
Submitted to: Mr. Vinit Kumar Sachdeva Submitted by: Shalini Pandey
(Assistant Professor) Roll no.:
2. Self Certification
I hereby certify that I, SHALINI PANDEY have successfully completed my internship with
USHA MARTIN Ltd, RANCHI from 11th June to 11th August 2012. This is also to certify
that this report is an original product and no unfair means like copying etc have been used for
its completion.
Name: SHALINI PANDEY
Date: 3rd September‘2012
3. Table of Contents
.............................................................................................................. 1
Self Certification ........................................................................................................................ 2
Table of Contents ....................................................................................................................... 3
EXECUTIVE SUMMARY ....................................................................................................... 6
Data Collection Method ......................................................................................................... 7
Primary Data Sources ........................................................................................................ 7
RESEARCH DESIGN ........................................................................................................... 7
BACKGROUND AND INCEPTION OF THE COMPANY ................................................ 9
INDUSTRY ANALYSIS ........................................................................................................ 10
INFRASTRUCTURAL FACILITIES:-........................................................................... 10
Competitors Information:- ............................................................................................... 10
Contribution to the Market Share .................................................................................... 10
Future Growth and Prospectus ............................................................................................. 10
Scope ................................................................................................................................ 11
McKINSEY‗S-7S FRAMEWORK MODEL .................................................................. 12
Skills ................................................................................................................................ 12
STYLE ............................................................................................................................. 12
Strategy ............................................................................................................................ 13
System .............................................................................................................................. 13
Swot Analysis:- ................................................................................................................ 14
FINANCIAL ANALYSIS ................................................................................................... 14
OBJECTIVE OF THE STUDY ........................................................................................... 14
SCOPE OF THE STUDY .................................................................................................... 15
RATIO ANALYSIS................................................................................................................. 15
Classification of ratios ......................................................................................................... 15
COMPARATIVE BALANCE SHEET AS ON 2010-11 & 2011-12 ...................................... 30
INTERPRETATION........................................................................................................ 30
INTERPRETATION........................................................................................................ 31
COMPARATIVE BALANCE SHEET AS ON 2008-09 &2009-10 ....................................... 32
INTERPRETATION........................................................................................................ 32
4. COMPARATIVE INCOME STATEMENT FOR THE YEAR ENDED 31st March 2011-12
.................................................................................................................................................. 33
INTERPRETATION........................................................................................................ 33
COMPARATIVE INCOME STATEMENT FOR THE YEAR ENDED 31st March 2010-11
.................................................................................................................................................. 34
INTERPRETATION........................................................................................................ 34
COMPARATIVE INCOME STATEMENT FOR THE YEAR ENDED 31st March 2009-10
.................................................................................................................................................. 35
INTERPRETATION........................................................................................................ 35
Overall Summary of Findings ................................................................................................ 36
COMPETITOR‘S FINANCIAL POSITION ........................................................................... 36
Introduction ...................................................................................................................... 36
FINANCIAL RATIOS OF TISCO AND USHA MARTIN LIMITED .......................... 36
BALANCE SHEET OF TISCO............................................................................................... 38
PROFIT AND LOSS ACCOUNT (TISCO) ............................................................................ 38
PROFIT AND LOSS ACCOUNT (USHA MARTIN LIMITED) .......................................... 39
Cash flow of TISCO AND UML ............................................................................................. 39
Position of USHA MARTIN LIMITED in the business world ........................................... 42
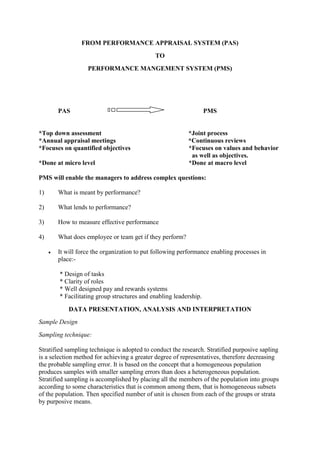
PERFORMANCE MANAGEMENT SYSTEM ..................................................................... 43
HIGHLIGHTS OF PMS:- .................................................................................................... 43
PARAMETERS YET TO BE IMPLEMENTED AT USHA MARTIN LIMITED ................ 45
FROM PERFORMANCE APPRAISAL SYSTEM (PAS) ................................................. 46
TO ........................................................................................................................................ 46
PERFORMANCE MANGEMENT SYSTEM (PMS)......................................................... 46
DATA PRESENTATION, ANALYSIS AND INTERPRETATION ............................. 46
5. ACKNOWLEDGEMENT
A project is something that could not have been materialized without co- operation of many
people involved in making this project a reality. There are a number of important people I
want to thank, whose support, guidance, encouragement, and helped me in successful
completion of my project. I would also like to give my greatest thanks to God who deserves
the ultimate praise and credit for all good things in my life.
I take this opportunity to express my profound gratitude for the personal involvement and
constructive thinking provided beyond practical knowledge during the project by Mr. V.K.
Sachdeva who channelized my raw ideas and gave me the encouragement to pursue my
goals. Without his help and constant guidance it could be difficult for me to complete my
project.
I wish to express my sincere and heartiest gratitude to Mr. A.R.Sinha (my guide at USHA
MARTIN) who was always there to give my spirit a boost. I am greatly indebted to my
faculty and staff members for the tireless hours they have spend in guiding me and providing
me the resource. As a student specializing in Human resource, I came to know about the
ground realities in topics like Performance management system. My special thanks to my
parents and friends who gave consistent and constant help and encouragement in completing
this project.
6. INTRODUCTION
Human Resource Management is the function within an organization that focuses on
recruitment of, management and providing directions for the people who work in the
organization. Human Resource Management can also be performed by line managers. It is
concerned with the development of Human Resources, i.e. knowledge, capability, skill,
potentialities & attaining and achieving employee goals, including job satisfaction.
Performance management system is a management technique intended to holistically
consider the performance of employees or machines to work towards optimum performance
of a particular task or a group of tasks. The effective performance management system
includes attracting talented people, hiring right person for the right job, setting goals and
aligning objectives, coaching to improve performance. It gives supervisors and subordinates
an equal opportunity to express themselves under structured conditions.
The major objectives of performance management are : to improve the quality of work life
by allowing the workers greater influence and involvement in work and the satisfaction
obtained from the work; to secure the mutual cooperation of employees and employers in
achieving industrial peace, greater efficiency and productivity in the interest of the
enterprise, the workers, the consumers and the nation.
Usha Martin has been efficiently and effectively running on the basis of about 413 manpower
who are well dedicated towards the management. It is essential for an institution like this to
bring up workers participation so that the workers can be more involved in their work. Usha
Martin also ensures effective participation of workers in management.
EXECUTIVE SUMMARY
The internship is a bridge between the institute and the organization. This made me to be
involved in a project that helped me to employ my theoretical knowledge about the myriad
and fascinating facets of HR and finance. And in the process I could contribute substantially
to the organization‘s growth. The experience that I gathered over the past 2 months has
certainly provided the orientation, which I believe will help me in shouldering any
responsibility in future. Performance management system is an important HRD mechanism.
It is the systematic process of planning work and setting expectations, continually monitoring
performance, developing the capacity to perform, periodically rating performance in a
summary fashion and rewarding good performance. Based on globally followed HR practices
and principles, this performance management system provides right tools to engage
employees in productive work, help employee achieve their goals, bring objectivity &
transparency in employee evaluations, manage employee trainings, manage employee
compensations, promotion and careers. To address the above, a survey was conducted to
study the different parameters of Performance Management System adopted by Usha martin
limited. A sample of 30 officers was taken. A structured questionnaire was administered to
officers of different departments to elicit the information. The criteria or measures to evaluate
an officer‘s performance are competence, achievement versus objectives key result areas set
at beginning of a specific period, forming result oriented areas, leadership skills, team work
and attitude. Target is set for officers being appraised for a period of 6 months, checklist for
carrying out appraisals and career planning is followed. The study is conducted with respect
to understand the different management systems conducted in Usha martin and their effects
thereafter in the same.
7. OBJECTIVES
*To obtain the required knowledge of subject as a student of HRM
*To study the existing performance management system of USHA MARTIN
*To know the relevance of performance management system
*Whether standards of performance are laid for the performance management system
*What steps are imperative and suggestive to maintain and improve the quality of appraisal?
*To find out the level of effectiveness of performance measurement systems.
*To know the financial position of the company
REASEARCH METHODOLOGY
Research methodology is a way to systematically solve the research problem. It may be
understood as a science of studying how research is done. We can say that research
methodology has many dimensions and research methods do constitute a part of the research
methodology. Knowledge of research methodology plays a key role in project work. It
consists of series of actions or steps necessary to effectively carry out research and the
desired sequencing of these steps.
Data Collection Method
Data can be collected by Primary as well as secondary method.
Primary Data Sources
Questionnaire methods and discussions with the HR officers were used to collect data.
Questionnaire Designed
Questionnaire was used for the survey.
Secondary Data Sources
The secondary data sources were collected from the company manuals, handbooks, and
management books and are edited to suite the purpose.
RESEARCH DESIGN
Descriptive and analytical type of research design was adopted because sources of
information are relatively few and the purpose is merely to find and to understand the
possible actions conducted under performance management system.
For the study the relevant questionnaire was prepared and circulated among a stratified
sample of 30 officers of USHA MARTIN LIMITED. The data thus obtained formed the basis
of information regarding the existing performance management system and the same is
analyzed and inferences are drawn regarding the various aspects of the process of PMS at
UML.
8.
9. BACKGROUND AND INCEPTION OF THE COMPANY
Usha Martin Limited was started in 1961 in Ranchi (Jharkhand) as a wire rope
manufacturing company. Today the Usha Martin Group is a Rs.3000 crore conglomerate with
a global presence. The products are, wire rods, bright bars, steel wires, specialty wires, wire
ropes, strand, conveyor cord, wire drawing and cable machinery.
Incorporated in 1960 Mr. B.K. Jhawar, the present chairman, pioneered it.It was
promoted to manufacture steel and wires ropes in a collaboration with Martin Black of
Scotland as a joint Indo-British venture. From 1st October 1997, this company has been
merged with Usha Beltron Ltd which has been renamed as wire and wire ropes division.
Usha Martin Limited operates in three business divisions: steel, wire and wire ropes
and others.
The steel division manufactures steel wire rods, rolled products, billets, pig iron and
allied products.
The wire and wire ropes division manufactures steel wires, strands, wire ropes, cord,
bright bar, related accessories including wire drawing and allied machines.
The Company‘s other division manufactures jelly filled telecommunication cables.
The Company has overseas manufacturing operations in United Kingdom, Dubai,
United States, Thailand, Singapore, Australia and Vietnam.
The Company‘s wholly owned subsidiaries include Usha Martin Vietnam Company
Limited (UMVCL), Usha Martin Power & Resources Limited (UMPRL) and Usha
Martin Americas Inc.
10. INDUSTRY ANALYSIS
INFRASTRUCTURAL FACILITIES:-
Usha martin is a huge conglomerate situated15km far from main city Ranchi. It has been
providing different infrastructural facility like;
Accommodation for employees at lower rates.
Officers association
Workers association
One guest house
clubs for both executives & non executives
medical facility
fooding & transportation facility etc.
Competitors Information:-
1. Tisco , Jamshedpur
2. Musco, Mumbai
3. Rinl, vizag
4. Siscol, sale
5. Facor, nagpur
6. Sun flags, Nagpur
Contribution to the Market Share
Usha Martin operates mainly in wire and wire ropes segments, which contribute about 65%
share to its total revenues. There exist no major focused competitior in domestic operations in
its wire and wire rope business, except for Tata Steel(wires). Competition from unorganised
sector doesn‘t affect demand for its products significantly as consumers prefer branded
products due to safety and quality concerns. Usha Martin competes with other steel majors in
the steel segment. Contribution from steel accounts for 30 % of its revenue.
Future Growth and Prospectus
The companies‘ business strategy is to ensure profitable growth in the future which can be
through :-
Realization of synergy gain with Usha Martin to ensure better market position.
Higher asset utilization across plant location, particularly leveraging the benefits of the
upgraded rolling mills as taking steps to optimize use of ideal physical infrastructure asset
enriched product makes for higher returns from existing needs.
Strengthening of exports with an emphasis on consolidating Usha Martin presence in existing
market while tapping new regions for export of value added products.
Cost control efforts including better logistics, higher operating efficiencies and improved
working capital management. Already flourishing in its recent foray into mining operations,
the company is planning to invest in its iron ore and coal mines, sinter plant, pellet plant,
power plants, while also enhancing its steel making and value added products capacity with
an investment of Rs 2,100 crore.
But what set Usha Martin apart is its unwavering commitment to social responsibility. For
over three decades the company has invested ample man-hours and capital on community
development projects for integrated prosperity in rural Jharkhand, through a CSR arm, Krishi
Gram Vikas Kendra (KGVK).
11. Scope
Provides all the crucial information on Tata Steel Group required for business and
competitor intelligence needs;
Contains a study of the major internal and external factors affecting USHA MARTIN
LIMITED in the form of a SWOT analysis;
Data is supplemented with details on company‘s history, key executives, business
description, locations and subsidiaries as well as a list of products and services and the latest
available statement from USHA MARTIN LIMITED.
The company‘s strengths and weaknesses and areas of development or decline are
analyzed.
The opportunities open to the company are considered and its growth potential
assessed. Competitive or technological threats are highlighted.
The report contains critical company information business structure and operations,
the company history, major products and services, key competitors, key employees and
executive biographies, different locations and important subsidiaries.
12. McKINSEY‘S-7S FRAMEWORK MODEL
‘Hard’ variables:
Strategy: plan leading to allocation of resources.
Structure: Organization reporting lines, geography, etc.
Systems: formal and informal processes used.
‘Soft’ variables:
Staff: demographics of personnel.
Style: behavior of managers when interacting with others.
Skills: core competencies of the firm.
Shared Value: culture, which is actually the core element to it all.
Skills
A skill refers to how smart an employee does his work with available source. In marketing
department various steps are taken for staff to develop appropriate new skills for marketing
their products. The company is able to manufacture over 200 grades of alloy and special
steels to meet the specific requirement of individual customers.
The steps taken to improve necessary skills of the employees:
1) On the job training.
7 days training for transferred employees.
1-year probationary period for newly recruited employees.
Induction training to promoted employee from non-executive level to executive level.
6 months probationary period for all executives who are promoted.
2) Off the job training
Lecture
Group discussions, case studies
Management games
Developing presentation skill
Conference
External training
Specific need base training etc.
STYLE
Style refers to the flow of orders or method of communication in the organization. In
Usha Martin Pvt. Ltd it is following participative style where in subordinates and their heads
will have discussions and then they will take decision. Here in Usha Martin all middle level
management employees make discussion with their heads and take decision.
The management of Usha Martin Ltd., is completely employee oriented. They
receive the feedback from the workers and decide on the change in the strategies.
1. Top Down Approach
2. Bottom Up Approach
13. Strategy
Specializing in developing and marketing special alloy steels and achieve possible
market share in this niche are has been notable strategy adopted by the company.
Market penetration by the best possible past optimization techniques and achieving
price excellence has been another strategy adopted by the company.
Smart sizing of the company through introduction of Voluntary Retirement Scheme
and leveraging most advanced production has been another major strategy adopted by the
company.
Very good selection and development systems adopted coupled with several
employee welfare measures has been a notable strategy adopted by the company for
attracting and retaining the talent.
Discharging corporate social responsibility through several society linkage programs
in the area of health, education, and training has been yet another significant strategy adopted
by the company.
Introduction of several quality systems including ISO certification has been yet
another strategy adopted by the company for maintaining highest quality standards.
System
Inventory Control System
Usually a firm has to maintain several types of inventories. The firm should, therefore
classify investors to identify which items should receive the most effort on controlling. The
firm should be selective in its approach to control investment in various types of inventories.
These analytical approaches are called ABC analysis and tend to measure the significance of
each item of inventories in terms of its value.
The high value items are classified as ‗A items‘ and would be under the tightest control, ‗C
items‘ represent relatively least value and would be under simple control. ‗B items‘ fall in
between these two categories and require reasonable attention of control.
The ABC analysis concentrates on important items and is also known as ―control by
importance and extension‖. So the items are classified as per the importance of their relative
value this approach is also known as ―proportional value analysis‖.
Staff
The staffs are graded from L. I to L I I for non-executives and E1 to E9 for Executives. The
qualification for the non-executive employees are SSLC, ITI, and for executives Diploma and
any degree or higher. There is totally around 2600 staff members are there.
Shared Value
The company has a common goal to all its concerns and shares the information available in
every concern. The Usha Martin Ltd., has implemented the following main objectives,
It has been able to build the lasting relationships with customers based on trust and mutual
benefit. It has been able to uphold highest ethical standards in conduct of the business. It has
been able to create and nurture a culture that supports flexibility, learning and is proactive to
change. It also charted a challenging career for employees with opportunities for
advancement and rewards. It values the opportunity and responsibility to make a meaningful
difference in people‘s levels.
14. Swot Analysis:-
This reflects an important issue facing strategic managers should invest more in knowing
their strength‘s to make them even stronger or should they invest in weakness to make their
competitors weak?
Strengths:-
Well equipped chemical and metallurgical laboratories.
Satisfied & loyal customers.
Location advantage with proximity to major markets (north, south, east, west).
The company is known for its quality of alloy & special steel.
Weakness:-
Out dated technology with regards to production.
Being a private sector, emphasis is more on welfare measures rather than productivity
or growth of the organization.
High overheads and fixed costs.
Adverse age mix of workers and high average wage.
Opportunity:-
Growing in iron and steel market.
Competitive environment calls for improvement and increase in productivity.
Cost advantage with the adoption of sophisticated technology.
Threats:-
Upgraded technology used by other manufacturer helps in supplying the rates which
could eat the market share.
Too many welfare activities lead to the increase in expectations of employees
this could at some point of time become a reason for dispute.
Competition.
FINANCIAL ANALYSIS
Financial statements analysis is ―A process of evaluating financial and profitable position
of an organization by comparing two or more homogeneous figures and interpreting thereof‖.
According to this definition, analysis of financial statement is a process by which
management will make an effort to draw conclusion on financial and profit position of an
organization. In order to do this process, one has to make comparison of homogeneous
figures provides certain information with which inference or conclusion can be drawn.
OBJECTIVE OF THE STUDY
The major objective of financial statement analysis is to provide decision makers information
about business enterprises for use in decision-making. Users of financial statement
information are the decision makers concerned with evaluating the economic situation of the
firm and predicting its future course. The major groups of users of financial efficiency of the
enterprises are whole subunits (e.g. Departments), lenders and creditors for determining the
creditworthiness and solvency position etc.
The different users and decision makers can use financial statement analysis:
Assessment of past performance and current position.
15. Prediction of Net income and Growth prospects.
Prediction of bankruptcy and failure.
Load decisions by financial institutions and Banks.
SCOPE OF THE STUDY
This study confines itself to the analysis of Usha Martin Ltd. On the basis of
comparative, common size and ratio analysis and the analysis covered a period of four years
from 2005-06 to 2008-09.
The data used in this analysis has been obtained from the annual reports i.e., Balance
sheets and profit & loss Account.
RATIO ANALYSIS
Ratio analysis is the most important tool of analyzing these financial statements (profit &
loss a/c and balance sheet).It helps the reader in giving tongue to the mute heaps of figures
given in financial statements. The figures then speak of liquidity, solvency, profitability etc of
the business enterprise.
Classification of ratios
(A)LIQUIDITY RATIO
CURRENT RATIO
The ratio explains the relationship between current assets and current liabilities of a business.
This ratio measures the solvency of the company in the short-term.
Current Ratio :- Current assets/ Current liabilities
Current Assets = Cash in Hand + Cash at Bank + B/R + Short-term
Investments(Marketable Securities) + Debtors(Debtors- Provision) + Stock(Stock of Finished
Goods + Raw Material + Work in Progress) + Prepaid Expenses.
Current Liabilities = Bank Overdraft + B/P + Creditors + Provision for Taxation +
Proposed Dividends + Unclaimed Dividends + Outstanding Expenses + Loans Payable within
a year
Significance
The ratio is used to assess the firm‘s ability to meet its short-term liabilities on time. A
current ratio of 1.33:1 is supposed to be an ideal ratio. The higher the ratio, the better it is. If
the current ratio is less than 1.33:1 it indicate loss of liquidity and shortage of working
capital.
TABLE NO-1. SHOWING CURRENT RATIO
(Rs. in thousand)
PARTICULARS 2008-2009 2009-2010 2010-2011 2011-2012
Current Assets
Inventories 26,21,667 33,90,551 53,24,181 40,37,100
Sundry debtors 19,82,492 22,69,104 25,63,505 32,28,548
Cash and bank 5,17,489 3,70,805 4,63,607 7,64,682
Other current 2,25,640 2,60,942 3,40,486 2,39,621
assets
Loan and 16,48,665 21,19,931 40,24,216 27,80,155
advances
16. Total current 69,95,953 84,11,333 1,27,15,995 1,10,50,106
assets(A)
Current
Liabilities
Liabilities 37,69,487 46,12,543 86,09,576 98,12,920
Provision 2,10,109 2,62,565 3,81,723 3,73,392
Total current 39,79,596 48,75,108 89,91,299 1,01,86,312
liability(B)
Ratio = A/B 1.76:1 1.73:1 1.41:1 1.08:1
CHART NO-1. SHOWING CURRENT RATIO
1.8
1.6
1.4
1.2
1
0.8
0.6
0.4
0.2
0
2008-09 2009-10 2010-11 2011-12
Comments
As it is said that the current ratio should be more than 1.33:1.The current ratio of UML is
very satisfactory in 2008-2009, 2009-2010 &2010-2011.The current assets are on an increase
in this three years, in short it means that for every one rupee of current liabilities there is 1.76
rupee of current assets in the year 2008-09. In the year 2009-10 for every one rupee of current
liabilities there is 1.73 rupee of current assets. And in the year 2009-10 for every one rupee of
current liabilities there is 1.41 rupee of current assets. But in the year 2010-11 the current
ratio has been declined to 1.08 because of decrease in current assets and increase in current
liabilities compared to year 2009-10. Obviously, in this case it should not considered to be
sign of financial weakness.
17. QUICK RATIO
It is also called acid test ratio or liquid ratio. Quick ratio indicates whether the firm is in a
position to pay its current liabilities within a month or immediately.
Quick Ratio or Acid Test Ratio =Liquid Assets/Current Liabilities
Liquid assets thus include cash, debtors, bills receivable and short-term securities.
Significance
An ideal quick ratio is said to be 1:1. If it is more, it is considered to be better .The idea is
that for every rupee of current liabilities, there should at least be one rupee of liquid assets.
TABLE NO-2. SHOWING QUICK RATIO
PARTICULARS 2008-2009 2009-2010 2010-2011 2011-2012
Current assets 6995953 84,11,333 1,27,15,995 1,10,50,106
Less:-stock 2621667 33,90,551 53,24,181 40,37,100
Liquid assets(A) 4374286 50,20,782 73,91,814 70,13,006
Current 3979596 48,75,108 89,91,299 1,01,86,312
liabilities(B)
Ratio = A/B 1.10:1 1.03:1 0.82:1 0.69:1
CHART NO-2. SHOWING QUICK RATIO
1.2
1
0.8
0.6
0.4
0.2
0
2008-09 2009-10 2010-11 2011-12
Comments
The above table and chart shows that the quick ratio of UML is very satisfactory in 2005-06
& 2006-07 because it is more than 1:1. It shows that for one rupee of current liabilities there
is 1.10 rupee of quick assets in the year 2005-06 while in the year 2006-07 UML has 1.03
rupee of quick assets for every one rupee of current liabilities. But in 2007-08 & 2008-09 it
18. has been declined to 0.82:1 & 0.69:1 respectively, because of increase in current liabilities.
But seeing the past record we can say that UML will recover its position.
(B) LEVERAGE RATIOS
DEBT EQUITY RATIO
This ratio is calculated to ascertain the soundness of the long-term financial policies of the
firm.
Debt/Equity OR
Long Term Loans/Shareholder‘s Funds or Net Worth
TABLE NO-3. SHOWING DEBT EQUITY RATIO
(Rs. in thousand)
PARTICULARS 2005-2006 2006-2007 2007-2008 2008-2009
Debt
Secured Loan 67,17,748 74,41,398 86,70,608 1,46,61,503
Unsecured Loan 1,58,367 52,340 7,61,414 -
Deferred Tax Liability 13,35,064 14,34,331 14,67,708 12,21,053
Total Debt(A) 82,11,179 89,28,069 1,08,99,730 1,58,82,556
Equity Share Capital 2,21,920 2,40,045 2,50,920 2,50,920
Reserve & Surplus 56,05,048 69,36,730 84,04,090 99,11,836
Total Equity (B) 58,26,968 71,76,775 86,55,010 1,01,62,756
Ratio = A/B 1.41:1 1.24:1 1.26:1 1.56:1
19. CHART NO-3.DEBT EQUITY RATIO
1.6
1.4
1.2
1
0.8
0.6
0.4
0.2
0
2008-09 2009-10 2010-11 2011-12
Significance
This ratio is calculated to assess the ability of the firm to meet its long term liabilities.
Generally, debt-equity ratio of 2:1 is considered safe. The ideal ratio is 2:1 , meaning that
long term liabilities of the business should be two times of the shareholders fund.
Comments
The above table and chart shows that the debt equity ratio of UML is 1.41:1 in year 2008-09
which has been declined to 1.24:1 in year 2009-10. In 2010-11 & 2011-12 it has increased to
1.26:1 & 1.56:1. The reasons being continuous increase in secured loans and reserves &
surplus and decrease in unsecured loans.
TOTAL ASSETS TO DEBT RATIO
This ratio is a variation of the debt-equity ratio and gives the same indication as the debt-
equity ratio. In this ratio, total assets are expressed in relation to long term debts. It is
calculated as under:-
Total Assets to Debt Ratio = Total Assets/ Debt or long-term Loans
Significance
This ratio expresses the relationship between the long term loans and total assets of a
business enterprise. It measures the proportion of total assets financed through long-term
loans. If the percentage of total assets financed through long-term loans is higher, it is
generally treated an indicator of risky financial position from the long-term point of view.
20. TABLE NO-4. SHOWING TOTAL ASSETS TO DEBT RATIO
(Rs. in thousand)
PARTICULARS 2008-2009 2009-2010 2010-2011 2011-2012
Assets
Current Assets 69,95,953 84,11,333 1,27,15,995 1,10,50,106
Fixed Assets 95,42,787 1,09,70,665 1,44,90,841 2,33,10,700
Total Assets(A) 1,65,38,740 1,93,81,998 2,72,06,836 3,43,60,806
Debt
Secured Loan 67,17,748 74,41,398 86,70,608 1,46,61,503
Unsecured Loan 1,58,367 52,340 7,61,414 -
Deferred Tax 13,35,064 14,34,331 14,67,708 12,21,053
Liability
Total Debt(B) 82,11,179 89,28,069 1,08,99,730 1,58,82,556
Ratio = A/B 2.01:1 2.17:1 2.50:1 2.16:1
CHART NO-4. TOTAL ASSETS TO DEBT RATIO
2.5
2
1.5
1
0.5
0
2008-09 2009-10 2010-11 2011-12
Comments
The above table and chart shows that the total assets to debt ratio is increasing from 2.01:1 to
2.50:1 in the year 2008-09 to 2009-10. But decreased to 2.16 in the year 2010-11. The fixed
assets are on an increasing trend throughout the four years. The current assets decreased in
the last year. Secured loans are on an increasing trend and unsecured loans are on an
decreasing trend throughout the four years.
21. PROPRIETARY RATIO:-
This ratio indicates the proportion of total assets funded by owners or shareholders.
Proprietary Ratio = Equity (Shareholder’s Funds)/Total Assets or Shareholder’s
Funds/Total Assets
Significance
A higher proprietary ratio is generally treated an indicator of sound financial position from
long-term point of view, because it means that a large proportion of total assets is provided
by equity and hence the firm is less dependent on external sources of finance. On the
contrary, a low proprietary ratio is a danger signal for Long-term lenders as it indicates a
lower margin of safety available to them. The lower the ratio, the less secured are the long-
term loans and they face the risk of losing their money.
TABLE NO-5. SHOWING PROPRIETORY RATIO
(Rs. in thousand)
PARTICULARS 2008-2009 2009-2010 2010-2011 2011-2012
Shareholders Funds
Capital 2,21,920 2,40,045 2,50,920 2,50,920
Equity warrants 88,740 33,278 3,34,950 -
Reserve and Surplus 56,05,048 69,36,730 84,04,090 99,11,836
Total(A) 59,15,708 72,10,053 89,89,960 1,01,62,756
Current Assets 69,95,953 84,11,333 1,27,15,995 1,10,50,106
Fixed Assets 95,42,787 1,09,70,665 1,44,90,841 2,33,10,700
Total Assets(B) 1,65,38,740 1,93,81,998 2,72,06,836 3,43,60,806
Ratio = A/B 0.36:1 0.37:1 0.33:1 0.30:1
CHART NO-5. SHOWING PROPRIETARY RATIO
0.4
0.35
0.3
0.25
0.2
0.15
0.1
0.05
0
2008-09 2009-10 2010-11 2011-12
22. Comments
The ratio shows a strong financial position of the company. The higher the ratio, the better it
is. The proprietary ratio of UML increased from 0.36:1 to 0.37:1 from year 2008-09 to 2009-
10 and decrease to 0.33:1 & 0.30:1 in year 2009-10 & 2010-11. The share capital increased in
first three years then it was stable. The reserve increased in all four years. The current assets
increased in first three years but it decreased in last year. The fixed asset shows an increasing
trend from 2008-09 to 2011-12.
RESERVE TO CAPITAL RATIO
This ratio indicates the relationship between reserves and capital. More reserve shows
financial soundness of the firm, because it will be able to meet future losses, if any out of
reserves.
Reserve to capital ratio = Reserve/Capital
TABLE NO-6. SHOWING RESERVE TO CAPITAL RATIO.
(Rs. in thousand)
PARTICULARS 2008-2009 2009-2010 2010-2011 2011-2012
Reserve(A) 56,05,048 69,36,730 84,04,090 99,11,836
Capital(B) 2,21,920 2,40,045 2,50,920 2,50,920
Ratio = A/B 25.26:1 28.90:1 33.49:1 39.50:1
CHART NO-6 . SHOWING RESERVE TO CAPITAL RATIO
40
35
30
25
20
15
10
5
0
2008-09 2009-10 2010-11 2011-12
23. Comments
The above table and chart shows that the reverse to capital ratio was 25.26 in the year 2008-
2009 which has been increased to 28.90 in next year and it has further increased to 33.49 and
39.50 in the year 2010-11 & 2011-12 respectively. It is showing increasing trend in the
reserve to capital ratio.
(C) PROFITABILITY RATIOS
NET PROFIT RATIO
This Ratio shows the relationship between Net profit and Net sales
Net profit ratio = Net profit/Net sales × 100
TABLE NO-11. SHOWING NET PROFIT RATIO
(Rs. in thousand)
PARTICULARS 2008-2009 2009-2010 2010-2011 2011-2012
Net profit(A) 6,49,641 10,14,760 14,48,327 14,65,567
Net sales(B) 1,23,17,878 1,40,86,047 1,65,58,987 2,12,72,253
Ratio = A/B×100 5% 7% 9% 7%
CHART NO-11. SHOWINGNET PROFIT RATIO
9
8
7
6
5
4
3
2
1
0
2008-09 2009-10 2010-11 2011-12
24. Comments
The above table and chart shows that net profit ratio is in the increasing order in the year
2008-09, 2009-10 & 2010-11. But it decreased to 7% in the year 2011-12 due to the increase
in the expenditure. On the basis of the first three year we can say that the company is having
sufficient profit which can be easily used at the time of crisis.
NET PROFIT TO NET WORTH RATIO
This ratio indicates the relationship between Net Profit & Net Worth
Net profit to net worth ratio = (net profit after interest but before tax/net worth)×100
Net worth ratio = Equity and preference share capital + Reserves +
Accumulated Profit
TABLE NO-12. SHOWING NET PROFIT TO NET WORTH
(Rs. in thousand)
PARTICULARS 2008-2009 2009-2010 2010-2011 2011-2012
Net profit after 10,07,385 13,83,960 20,07,127 21,40,412
interest but before
tax (A)
Net worth
Share capital 2,21,920 2,40,045 2,50,920 2,50,920
Reserve 56,05,048 69,36,730 84,04,090 99,11,836
Net worth(B) 5826968 7176775 8655010 1,01,62,756
Ratio = A/B×100 17:1 19:1 23:1 21:1
CHART NO-12. SHOWING NET PROFIT TO NET WORTH RATIO
25. 25
20
15
10
5
0
2008-20092009-20102010-20112011-2012
Comments
The above table and chart shows that the net profit to net worth ratio is an increasing trend. It
increased from 17:1 to 23:1 from 2008-09 to 2010-11. But net profit to net worth ratio
decreased to 21:1 in the year 2011-12. The net profit after interest but before tax and reserves
increased from 2008-09 to 2011-12. The share capital has increased in the year 2010-11
compare to year 2008-09. And it has remained constant in the year 2011-12.
(D) ACTIVITY RATIO
DEBTORS TURNOVER RATIO
This ratio indicates the relationship between credit sales and average debtors during the year.
Debtors Turnover Ratio = Net credit sales/Average debtors
Average debtors = (opening debtor + closing debtor)/2
SIGNIFICANCE
This ratio indicates the speed with which the amount is collected from debtor. The higher the
ratio, the better it is, since it indicates that amount from debtors being collected more quickly.
The more quickly the debtors pay, the less is the risk of bad debt and so it lower the expenses
of collection and increase the liquidity of the firm. A lower ratio will indicate the efficient
credit sales policies of the management. It means that credit sale have been made to
customers who do not decrease much credit.
26. TABLE NO-7. SHOWING DEBTORS TIRNOVER RATIO
(Rs. in thousand)
PARTICULARS 2008-2009 2009-2010 2010-2011 2011-2012
Credit sales(A) 1,23,17,878 1,40,86,047 1,65,58,987 2,12,72,253
Opening debtor 25,13,970 19,82,492 22,69,104 25,63,505
Add:-closing 19,82,492 22,69,104 25,63,505 32,28,548
debtor
Total debtor(B) 44,96,462 42,51,596 48,32,609 57,92,053
Average 22,48,231 21,25,798 24,16,305 2896027
debtor(C)= B/2
Ratio = A/C 5.48 times 6.63 times 6.85 times 7.35 times
CHART NO-7 . SHOWING DEBTORS TURNOVER RATIO
8
7
6
5
4
3
2
1
0
2008-09 2009-10 2010-11 2011-12
Comments
The above table and chart shows the increasing trend of debtors turnover ratio of UML.
Debtors turnover, which measures whether the amount of resources tied up in debtors is
reasonable and whether the company has been efficient in converting debtors into cash.
Higher the ratio, better the position. This shows that money is being quickly recovered from
the debtors. The ratio in case of UML is very high i.e. the company is in very good position.
27. WORKING CAPITAL TURNOVER RATIO
This ratio measures the relationship between working capital sales. This ratio shows the
number of times the working capital result in sales.
Working Capital = Current assets – Current Liabilities
Working Capital Turnover Ratio = Net Sales/ Working Capital
Significance
It is very significant for non manufacturing concerns where working capital is more than
fixed assets . It reflects the efficiency in the utilization of working capital. High ratio shows
Overtrading & low shows over taking.
TABLE NO-8. SHOWING WORKING CAPITAL TURNOVER RATIO.
(Rs. in thousand)
PARTICULARS 2008-2009 2009-2010 2010-2011 2011-2012
Gross sales 1,37,71,836 1,57,37,419 1,85,27,701 2,30,72,056
Less:-Excise duty 14,53,958 16,51,372 19,68,714 17,99,803
Net sales(A) 1,23,17,878 1,40,86,047 1,65,58,987 2,12,72,253
Current Assets 69,95,953 84,11,333 1,27,15,995 1,10,50,106
Less:-Current 39,79,596 48,75,108 89,91,299 1,01,86,312
liabilities
Working 30,16,357 35,36,225 37,24,696 8,63,794
Capital(B)
Ratio = A/B 4.08 times 3.98 times 4.45 times 24.63 times
CHART NO-8 .SHOWING WORKING CAPITAL TURNOVER RATIO
28. 25
20
15
10
5
0
2008-09 2009-10 2010-11 2011-12
Comments
The above table and chart shows that the working capital turnover ratio is 4.08 times in the
year 2008-09 which has been decreased to 3.98 times in the year 2009-10. The ratio increased
to 4.45 times & 24.63 times in the year 2010-11 & 2011-12 respectively. It shows the
efficient utilization of working capital.
INVENTORY TURNOVER RATIO OR STOCK TURNOVER RATIO
This ratio indicates the relationship between the cost of goods sold or sales during the year
and average stock kept during that year.
Inventory Turnover ratio= Net Sales/Average Stock or Cost of Goods Sold/Average Stock
Average Stock = Opening Stock + Closing Stock/2
Significance
This ratio indicates whether stock has been efficiently used or not. It shows the speed with
which the stock is rotated into sales or the number of times the stock is turned into sales
during the year. The higher the ratio, the better it is, since it indicates that stock is selling
quickly. In a business where stock turnover ratio is high, goods can be sold at a low margin of
profit and even then the profitability may be quite high. A low stock turnover ratio indicates
that stock does not sell quickly and remains lying in the go down for quite a long time.
TABLE NO-9. SHOWING INVENTORY TURNOVER RATIO
(Rs. in thousand)
PARTICULARS 2008-2009 2009-2010 2010-2011 2011-2012
Net sales(A) 1,23,17,878 1,40,86,047 1,65,58,987 2,12,72,253
Opening Stock 28,40,534 26,21,667 33,90,551 53,24,181
Closing Stock 26,21,667 33,90,551 53,24,181 40,37,100
Total Stock(B) 54,62,201 60,12,218 87,14,732 93,61,281
Avg stock= B/2 27,31,101 30,06,109 43,57,366 46,80,641
Ratio = A/C 4.51 times 4.69 times 3.80 times 4.54 times
29. CHART NO-9 . INVENTORY TURNOVER RATIO OR STOCK TURNOVER RATIO
5
4
3
2
1
0
2008-09 2009-10 2010-11 2011-12
Comments
The above table and chart shows that the inventory turnover ratio is 4.51 times in the year
2008-09 which has been increased to 4.69 times in the year 2009-10. In the year 2010-11
inventory turnover ratio decreased to 3.80 times and which has been increased to 4.54 times
in the year 2011-12. This ratio indicates how fast the inventory is converted into sales . here
high ratio implies good inventory management. In the year 2008-09 & 2009-10 the inventory
management is good. But it decreased in the year 2010-11 it the sign of inefficient inventory
management. But again it increased in the year 2011-12.
30. COMPARATIVE BALANCE SHEET AS ON 2010-11 & 2011-12
(Rs. in thousand)
Particulars 31-03-2012 31-03-2011 ABSOLUTE CHANGES
CHANGES In %
SOURCE OF FUNDS
Shareholders‘ Funds
Capital 2,50,920 2,50,920 - -
Equity warrants - 3,34,950 -3,34,950 -100
Reserve and Surplus 99,11,836 84,04,090 15,07,746 17.94
Loan Funds:
Secured Loans 1,46,61,503 86,70,608 59,90,895 69.09
Unsecured Loans - 7,61,414 -7,61,414 -100
Net Deferred Tax Liabilities 12,21,053 14,67,708 -2,46,655 -16.81
Total 2,60,45,312 1,98,89,690 61,55,622 30.95
APPLICATION OF FUNDS
Fixed Assets:
Gross Block 1,93,83,467 1,68,07,170 25,76,297 15.33
Less: Depreciation 80,18,284 72,09,382 8,08,902 11.22
Impairment Loss 1,40,835 1,40,835 - -
Net block 1,12,24,348 94,56,953 17,67,395 18.68
Capital Work In Progress 1,20,86,352 50,33,888 70,52,464 140.09
Investment 18,63,513 16,58,014 2,05,499 12.39
Current assets, Loans and
advances:
Inventories 40,37,100 53,24,181 -12,87,081 -24.17
Sundry Debtors 32,28,548 25,63,505 6,65,043 25.94
Cash and Bank Balance 7,64,682 4,63,607 2,71,075 58.47
Other Current Assets 2,39,621 3,40,486 -1,00,865 -29.62
Loans and Advances 27,80,155 40,24,216 -12,44,061 -30.91
Total current assets 1,10,50,106 1,27,15,995 -16,65,889 -13.10
Less: Current Liabilities and 1,01,86,312 89,91,299 11,95,013 13.29
provisions
Net Current Assets 8,63,794 37,24,696 -28,60,902 -76.81
Miscellaneous Expenditure:
Deferred Revenue Expenditure 7,305 16,139 -8,834 -54.74
Total 2,60,45,312 1,98,89,690 61,55,622 30.95
INTERPRETATION
I Sources of funds
There is no change in share capital. Equity warrants has been decreased by 100% in
the year 2012 compared to year2011. And the reserve & surplus has been increased by
17.94% in the year 2012 when compared to year 2011
There has been increased by 69.09% in secured loans and decreased by 100% in
unsecured loans and deferred tax liabilities has been also decreased by 16.81% in the year
2009 when compared to the year 2011.
II application of fund
The fixed assets has been increased by 18.68% in the year 2012 when compared to the last
year. Capital work in progress has been also increased by 140.09% in the year 2012 when
compared to the year 2011. Investment has been increased by 12.39% in the year 2012 when
compared to the year 2011. The net current assets has been decreased by 76.81% in the year
2012 when compared to the year 2011.
31. COMPARATIVE BALANCE SHEET AS ON 2009-10 &2010-11
(Rs. in thousand)
Particulars 31-03-2011 31-03-2010 ABSOLUTE CHANGES
CHANGES In %
SOURCE OF FUNDS
Shareholders‘ Funds
Capital 2,50,920 2,40,045 10,875 4.53
Equity warrants 3,34,950 33,278 3,01,672 906.52
Reserve and Surplus 84,04,090 69,36,730 14,67,360 21.15
Loan Funds:
Secured Loans 86,70,608 74,41,398 12,29,210 16.52
Unsecured Loans 7,61,414 52,340 7,09,074 1,354.75
Net Deferred Tax Liabilities 14,67,708 14,34,331 33,377 2.33
Total 1,98,89,690 1,61,38,122 37,51,568 23.25
APPLICATION OF FUNDS
Fixed Assets:
Gross Block 1,68,07,170 1,57,39,283 10,67,887 6.78
Less: Depreciation 72,09,382 65,51,753 6,57,629 10.04
Impairment Loss 1,40,835 1,87,451 -46,616 -24.86
Net block 94,56,953 90,00,079 4,56,874 5.07
Capital Work In Progress 50,33,888 19,70,586 30,63,302 155.45
Investment 16,58,014 16,00,805 57,209 3.57
Current assets, Loans and
advances:
Inventories 53,24,181 33,90,551 19,33,630 57.03
Sundry Debtors 25,63,505 22,69,104 2,94,401 12.97
Cash and Bank Balance 4,63,607 3,70,805 92,802 25.02
Other Current Assets 3,40,486 2,60,942 79,544 30.48
Loans and Advances 40,24,216 21,19,931 19,04,285 89.83
Total current assets 1,27,15,995 84,11,333 43,04,662 51.17
Less: Current Liabilities and 89,91,299 48,75,108 41,16,191 84.43
provisions
Net Current Assets 37,24,696 35,36,225 1,88,471 5.33
Miscellaneous Expenditure:
Deferred Revenue 16,139 30,427 -14,288 -46.95
Expenditure
Total 1,98,89,690 1,61,38,122 3751568 23.25
INTERPRETATION
I Sources of funds
Share capital has been increased by 4.53% in the year2011 compare to 2010. Equity warrants has been increased by 906.52% in
the year 2011 compared to year2010. And the reserve & surplus has been increased by 21.15% in the year 2011 when compared to year
2010
There has been increased by 16.52% in secured loans and also increased in unsecured loans by 1354.75% and Net deferred tax
liabilities has been increased by 2.33% in the year 2011 when compared to the year 2010.
II application of fund
The fixed assets has been increased by 5.07% in the year 2011 when compared to the last year.
Capital work in progress has been also increased by 155.45% in the year 2011 when compared to the year 2010.
Investment has been increased by 3.57% in the year 2011 when compared to the year 2010.
The net current assets have been increased by 5.33% in the year 2011 when compared to the year 2010.
Deferred revenue expenditure has been decreased by 46.95% in the year 2011 when compared to the year 2010.
32. COMPARATIVE BALANCE SHEET AS ON 2008-09 &2009-10
(Rs. in thousand)
Particulars 31-03-2010 31-03-2009 ABSOLUTE CHANGES
CHANGES In %
SOURCE OF FUNDS
Shareholders‘ Funds
Capital 2,40,045 2,21,920 18,125 8.17
Equity warrants 33,278 88,740 -55,462 -62.50
Reserve and Surplus 69,36,730 56,05,048 13,31,682 23.76
Loan Funds:
Secured Loans 74,41,398 67,17,748 7,23,650 10.77
Unsecured Loans 52,340 1,58,367 1,06,027 66.95
Net Deferred Tax Liabilities 14,34,331 13,35,064 99,267 74.35
Total 1,61,38,122 1,41,26,887 20,11,235 14.24
APPLICATION OF FUNDS
Fixed Assets:
Gross Block 1,57,39,283 1,49,14,639 8,24,644 5.53
Less: Depreciation 65,51,753 58,79,443 6,72,310 11.43
Impairment Loss 1,87,451 1,88,024 -573 -0.3
Net block 90,00,079 88,47,172 1,52,907 1.73
Capital Work In Progress 19,70,586 6,95,615 12,74,971 183.29
Investment 16,00,805 15,25,755 75,050 4.92
Current assets, Loans and advances:
Inventories 33,90,551 26,21,667 7,68,884 29.33
Sundry Debtors 22,69,104 19,82,492 2,86,610 14.45
Cash and Bank Balance 3,70,805 5,17,489 -1,46,684 -28.34
Other Current Assets 2,60,942 2,25,640 35,302 15.64
Loans and Advances 21,19,931 16,48,665 4,71,266 28.58
Total current assets 84,11,333 69,95,953 14,15,380 20.23
Less: Current Liabilities and 48,75,108 39,79,596 8,95,512 22.50
provisions
Net Current Assets 35,36,225 30,16,357 5,19,868 17.23
Miscellaneous Expenditure:
Deferred Revenue Expenditure 30,427 41,988 -11,561 -27.53
Total 1,61,38,122 1,41,26,887 20,11,235 14.24
INTERPRETATION
I Sources of funds
Share capital has been increased by 8.17% in the year2010 compare to 2009. Equity warrants has been decreased
by 62.50% in the year 2010 compared to year2009. And the reserve & surplus has been increased by 23.76% in the
year 2010 when compared to year 2009
There has been increased by 10.77% in secured loans and also increased in unsecured loans by 66.95% and Net
deferred tax liabilities has been increased by 74.35% in the year 2010 when compared to the year 2009.
II application of fund
The fixed assets has been increased by 1.73% in the year 2010 when compared to the last year.
Capital work in progress has been also increased by 183.29% in the year 2010 when compared to the year 2009.
Investment has been increased by 4.29% in the year 2010 when compared to the year 2009.
The net current assets has been increased by 17.23% in the year 2010 when compared to the year 2009.
Deferred revenue expenditure has been decreased by 27.53% in the year 2010 when compared to the year 2009.
33. COMPARATIVE INCOME STATEMENT FOR THE YEAR ENDED 31st March 2011-12
(Rs. in thousand)
Particulars 31-03-2012 31-03-2011 Increase/ CHANGES
Decrease In %
INCOME
Turnover(Gross) 2,30,72,056 1,85,27,701 45,44,355 24.53
Less: Excise Duty 17,99,803 19,68,714 -1,68,911 -8.58
Turnover(Net) 2,12,72,253 1,65,58,987 47,13,266 28.46
Other Income 1,35,315 1,56,401 -21,086 -13.48
Total 2,14,07,568 1,67,15,388 46,92,180 28.07
EXENDITURE
Purchase of General Merchandise 35,489 19,899 15,590 78.34
Raw Material Consumed 93,36,337 74,78,097 18,58,240 24.85
(increase)/ Decrease in Stock-in-Trade (2,08,849) (2,95,476) -86,627 -29.32
Manufacturing, Selling and 81,50,137 60,36,422 21,13,715 35.02
Administrative Exp.
Depreciation 8,50,402 7,59,209 91,193 12.01
Interest 12,33,483 8,03,752 4,29,731 53.46
Adjustment for items Capitalized and (1,29,843) (93,642) 36,201 38.66
Departmental orders for own
Consumption
Total 1,92,67,156 1,47,08,261 45,58,895 30.99
PROFIT BEFORE TAXATION 21,40,412 20,07,127 1,33,285 6.64
Current Tax 9,10,000 5,10,300 3,99,700 78.33
Fringe benefit tax 11,500 11,800 -300 -2.54
Deferred Tax (2,46,655) 36,700 -2,83,355 -772.08
PROFIT AFTER TAX 14,65,567 14,48,327 17,240 1.19
Debenture redemption reserve written - 8,06,050 -806050 -100
back
Profit brought forward from previous 4,20,792 2,09,186 2,11,606 101.16
year
PROFIT AVAILABLE FOR 18,86,359 24,63,563 -5,77,204 -23.43
APPROPRIATION
APPROPRIATION
Transfer to General Reserve 12,50,000 17,50,000 -5,00,000 -28.57
Proposed Dividend on Equity Shares 2,50,242 2,50,242 - -
Provision for Dividend Tax 42,529 42,529 - -
Balance carried to Balance Sheet 3,43,588 4,20,792 -77,204 -18.35
INTERPRETATION
I Income
The income of the company has been increased by 28.07% in the year 2012 compared to the year 2011. It shows that the
raise in income.
II Expenditure
The expenditure of the company has been increased by 30.99% in the year 2012 compared to the year 2011. It shows that the
company increase more expenditure cost in the year 2012when compared to 2011.
III Profit after tax
The profit after tax has been increased by 1.19% in the year 2012 when compared to 2011. It shows that the company earns
good profit by using all the resources optimally.
34. COMPARATIVE INCOME STATEMENT FOR THE YEAR ENDED 31st March 2010-11
(Rs. In thousand)
Particulars 31-03-2011 31-03-2010 Increase/ CHANGES
Decrease In %
INCOME
Turnover(Gross) 1,85,27,701 1,57,37,419 27,90,282 17.73
Less: Excise Duty 19,68,714 16,51,372 3,17,342 19.22
Turnover(Net) 1,65,58,987 1,40,86,047 24,72,940 17.56
Other Income 1,56,401 1,43,261 13,140 9.17
Total 1,67,15,388 1,42,29,308 24,86,080 17.47
EXENDITURE
Purchase of General Merchandise 19,899 15,302 4,597 30.04
Raw Material Consumed 74,78,097 58,16,061 16,62,036 28.58
(increase)/ Decrease in Stock-in-Trade (2,95,476) (2,38,579) 56,897 23.85
Manufacturing, Selling and 60,36,422 58,01,012 2,35,410 4.06
Administrative Exp.
Depreciation 7,59,209 7,62,804 -3,595 -0.47
Interest 8,03,752 7,13,016 90,736 12.72
Adjustment for items Capitalized and (93,642) (24,268) 69,374 285.87
Departmental orders for own
Consumption
Total 1,47,08,261 1,28,45,348 18,62,913 14.50
PROFIT BEFORE TAXATION 20,07,127 13,83,960 6,23,167 45.03
Current Tax 5,10,300 2,58,600 2,51,700 97.33
Fringe benefit tax 11,800 11,333 467 4.12
Deferred Tax 36,700 99,267 -62,567 -63.03
PROFIT AFTER TAX 14,48,327 10,14,760 4,33,567 42.73
Debenture redemption reserve written 8,06,050 - 8,06,050 100
back
Profit brought forward from previous 2,09,186 4,14,004 -2,04,818 -49.47
year
PROFIT AVAILABLE FOR 24,63,563 14,28,764 10,34,799 72.43
APPROPRIATION
APPROPRIATION
Transfer to General Reserve 17,50,000 10,00,000 7,50,000 75.00
Proposed Dividend on Equity Shares 2,50,242 1,87,681 62,561 33.33
Provision for Dividend Tax 42,529 31,897 10,632 33.33
Balance carried to Balance Sheet 4,20,792 2,09,186 2,11,606 101.16
INTERPRETATION
I Income
The income of the company has been increased by 17.47% in the year 2011 compared to the year 2010. It shows
that the raise in income.
II Expenditure
The expenditure of the company has been increased by 14.50% in the year 2011 compared to the year 2010. It
shows that the company increase more expenditure cost in the year 2011 when compared to 2010.
III Profit after tax
The profit after tax has been increased by 42.73% in the year 2011 when compared to 2010. It shows that the
company earns good profit by using all the resources optimally.
35. COMPARATIVE INCOME STATEMENT FOR THE YEAR ENDED 31st March 2009-10
(Rs. in thousand)
Particulars 31-03-2010 31-03-2009 Increase/ CHANGES
Decrease In %
INCOME
Turnover(Gross) 1,57,37,419 1,37,71,836 19,65,583 14.27
Less: Excise Duty 16,51,372 14,53,958 1,97,414 13.58
Turnover(Net) 1,40,86,047 1,23,17,878 17,68,169 14.35
Other Income 1,43,261 94,846 48,415 51.04
Total 1,42,29,308 1,24,12,724 18,16,584 14.63
EXENDITURE
Purchase of General Merchandise 15,302 9,616 5,686 59.13
Raw Material Consumed 58,16,061 52,50,697 5,65,364 10.77
(increase)/ Decrease in Stock-in-Trade (2,38,579) (1,55,097) 83,482 53.82
Manufacturing, Selling and 58,01,012 48,50,660 9,50,352 19.59
Administrative Exp.
Depreciation 7,62,804 7,60,996 1,808 0.24
Interest 7,13,016 7,30,603 -17,587 -2.41
Adjustment for items Capitalized and (24,268) (42,136) -17,868 -42.41
Departmental orders for own
Consumption
Total 1,28,45,348 1,14,05,339 14,40,009 12.63
PROFIT BEFORE TAXATION 13,83,960 10,07,385 3,76,575 37.38
Current Tax 2,58,600 85,000 1,73,600 204.23
Fringe benefit tax 11,333 12,200 -867 -7.11
Deferred Tax 99,267 2,60,544 -1,61,277 -61.90
PROFIT AFTER TAX 10,14,760 6,49,641 3,65,119 56.20
Debenture redemption reserve written - -
back
Profit brought forward from previous 4,14,004 4,03,112 10,892 2.70
year
PROFIT AVAILABLE FOR 14,28,764 10,52,753 3,76,011 35.72
APPROPRIATION
APPROPRIATION
Transfer to General Reserve 10,00,000 5,00,000 5,00,000 100
Proposed Dividend on Equity Shares 1,87,681 1,21,683 65,998 54.24
Provision for Dividend Tax 31,897 17,066 14,831 86.90
Balance carried to Balance Sheet 2,09,186 4,14,004 14,40,009 12.63
INTERPRETATION
I Income
The income of the company has been increased by 14.63% in the year 2010 compared to the year 2009. It shows
that the raise in income.
II Expenditure
The expenditure of the company has been increased by 12.63% in the year 2010 compared to the year 2009. It
shows that the company increase more expenditure cost in the year 2010 when compared to 2009.
III Profit after tax
The profit after tax has been increased by 56.20% in the year 2010 when compared to 2009. It shows that the
company earns good profit by using all the resources optimally.
36. Overall Summary of Findings
The liquidity ratio i.e. current ratio and quick ratio of UML are quite healthy. The
company can manage to use some portion of the current asset in other productive activities.
The company is placed comfortable to fulfil its current obligations.
Reserve to capital ratio of UML has increased from 25.26:1 to 39.50:1 from 2008-09
to 2011-12 which ensure that UML has sufficient reserves which it can use at any point of
crises in future time period.
The debtor turnover ratio of UML is also very satisfactory as it is said that higher the
ratio, the better it is for the company as it insures quick collection of money from the debtors.
It was 5.48 times in the year 2008-09 and increased to 7.35 times in the year 2011-12.
The average collection period of the company should not be more than 90 days. The
period was 66 days in 2008-09 then it decreased to 51 days in 2011-12 which is healthy sign
for a credit sale making company. It insure that UML is able to collect its debt on time.
The working capital turnover ratio of any firm should be normal. Excess ratio
indicates overtrading while a lower ratio indicates overtaking. The ratio in 2008-09 was 4.08
which increased to 24.63 which is quite high. It may result in overtrading.
The profitability ratio is also satisfactory. The net profit ratio increased in first three
years from 5% to 9% and decreased to 7% in the last year but the company will recover it in
the future.
From the comparative analysis, it was found that the test of overall profitability holds
good.
COMPETITOR’S FINANCIAL POSITION
Introduction
Tata Iron & Steel Company Ltd. (TISCO) is the iron and steel production company
associated with the Tata group of some 80 different industrial and other business enterprises
in India, founded by members of the Tata family. TISCO operates as India's largest integrated
steel works in the private sector with a market share of nearly 13 percent and is the second
largest steel company in the entire industry. Its products and services include hot and cold
rolled coils and sheets, tubes, construction bars, forging quality steel, rods, structurals, strips
and bearings, steel plant and material handling equipment, ferro alloys and other minerals,
software for process controls, and cargo handling services. Through its subsidiaries, TISCO
also offers tinplate, wires, rolls, refractories, and project management services.
Products:-
Bearings
Flat products (hot rolled, cold rolled and coated products)
Long products (Tata Tiscon rebars)
Wires
Tata pipes
FINANCIAL RATIOS OF TISCO AND USHA MARTIN LIMITED
RATIOS 10- UML 11-TISCO UML 12-TISCO UML
TISCO
Current ratio 1.77 1.73 3.92 1.41 0.97 1.08
Quick ratio 1.37 1.03 3.52 0.82 0.57 0.69
Debt equity ratio 0.67 1.24 1.07 1.26 1.31 1.56
Total assets to debt 0.69 2.17 1.08 2.50 1.34 2.16
37. ratio
Profitability ratio 0.09 0.07 0.12 0.09 0.08 0.07
Debtors turnover 7.11 6.63 5.19 6.85 6.65 7.35
ratio
Working capital 4.12 3.98 5.0 4.58 6.65 24.73*
turnover ratio
INTERPRETATION:-
*LIQUIDITY RATIO
It is generally assumed that ―Higher the CR better is the Liquidity position‖. For UML, it is
greater than 1 for all the three years whereas it is less than 1 for TISCO in the year 2012,due
to loss of liquidity and shortage of working capital. The quick ratio for both the companies
are above the ideal ratio 1,but the ratio of usha martin has declined in both the years(2011 &
2012)due to the increase in current liabilities and same is the case with TISCO.
*LEVERAGE RATIO
Debt equity ratio affects the cost of capital, earning per share and the interest coverage ratio.
For TISCO the DER is very low. This shows that the company is financing its business with
the Reserves. Along with that it could be observed that UML‘S DER is nearly the same but
is increasing.
*PROFITABILITY RATIO
The profitability ratio has been increasing for both the companies, which shows that the
companies are having sufficient profit which can easily be used at the time of crisis.
*ACTIVITY RATIOS
For UML, the debtors‘ turnover ratio is in increasing trend, in comparison to TISCO, this
shows that money is being quickly recovered from the debtors and company is in a very good
condition. Working capital turnover is very high in case of UML which shows that the
working capital are fully and efficiently utilized.
BALANCE SHEET OF UML
Particulars 2010 2011 2012
Sources of fund
Shareholder‘s equity 24.0 25.1 25.1
Reserves 718.2 882.3 1057.0
Shareholders funds 742.5 907.4 1082.3
Minority interest 11.9 11.8 16.4
Secured loans 925.5 1023.3 1644.7
Unsecured loans 37.6 114.4 26.6
Total debts 963.0 1137.5 1671.3
Net deferred tax 149.2 153.6 130.6
Total liabilities and equity 1866.7 2210.3 2900.7
Gross fixed assets 1984.8 2123.0 2383.6
Less: depreciation 816.2 895.9 1008.2
Less : impairment of assets 21.3 16.5 16.7
Net fixed assets 1174 1210.6 1358.8
Investment 0.4 0.4 0.4
Misc expense not w/f 3.0 1.6 0.7
WIP 198.8 502.3 1210.4
Current assets, loans, advance
Cash 49.0 72.1 108.8
Receivables 278.2 323.4 426.4
38. Inventories 540.3 783.6 656.6
Loans and advances 250.6 423.3 311.8
Total current assets 1181.1 1602.4 1503.5
Current liabilities and provision
Current liabilities 573.3 1065.5 1121.7
Provisions 28.8 41.5 51.3
Total current liabilities and provision 602.1 1107.0 1173.0
Net current assets 516.0 495.4 330.5
Total assets 1866.7 2210.3 2900.7
BALANCE SHEET OF TISCO
Particulars 2010 2011 2012
Sources of fund
Total share capital 580.89 6203.47 6203.14
Equity share capital 580.67 730.78 730.79
Preference share capital 0.00 5472.22 5472.63
Reserves 13368.12 21097.6 23501.23
Net worth 14096.1 27300 29740.12
Loans
Secured loans 3758.1 3520.9 3913.05
Unsecured loans 5886 14501.21 23033.1
Total liabilities 23741.23 45322.22 56650.78
Application of funds
Gross block 16029.8 16425.2 20057.09
Less:depreciation 7486.1 8223 9081.2
Net block 8543.2 8246.1 10651.2
WIP 2497.2 4317.24 3487.68
Investment 6106 4103.3 42371.2
Inventories 2332.4 2604.3 3480.7
Sundry debtors 631.31 543 635.87
Cash and bank balance 446.7 465 463.78
Total current assets 3411 3613.76 4580.2
Loans and advances 4025.65 34342.5 5884.2
Fixed deposits 7234.6 0.04 1127.02
TOTAL CA,LOANS AND ADVANCES 14671.20 38196.3 11591.5
Current liabilities 6349.24 6842.26 8965.76
Provision 1930 2913.8 2934.2
TOTAL CL,PROVISION 8279.79 9755.08 11899.95
Net current assets 6392.21 28440.05 - 308.29
Miscellaneous expenses 202.53 155.11 105.07
TOTAL ASSETS 23741.28 45322.22 56650.78
PROFIT AND LOSS ACCOUNT (TISCO)
PARTICULARS 2010 2011 2012
Income
Operating income 17857.8 19654.6 24348.32
Expenses
Material consumed 5679.45 6024.2 8279.44
Manufacturing expenses 2589.24 2693.8 3349.72
Personnel expenses 1454.01 1589.78 2305.81
Selling expenses 64.71 52.53 61.49
Administrative expenses 986.20 1224.04 1518.03
Expenses capitalized -236.5 -175.75 -343.65
Cost of sales 10538.91 11409.87 1517.88
39. Operating profit 6913.5 8144.54 9176.89
Other recurring income 485.14 347.28 305.36
Adjusted PBDIT 7398.28 8591.4 9481.8
Financial expenses 251.25 929.03 1489.50
Depreciation 819.29 834.61 973.40
Adjusted PBT 6328.3 6828.5 7018.9
Tax charges 2040.47 2380.28 2114.87
Adjusted PAT 4287.88 4447.90 4904.03
Non recurring items -123.02 239.13 297.71
Net profit 4222.15 4687.34 4222.5
Equity dividend 943.32 1168.93 1168.95
preference dividend - 22.19 109.45
Dividend tax 160.42 202.43 214.10
Retained earnings 6093.98 7887.46 10096.70
PROFIT AND LOSS ACCOUNT (USHA MARTIN LIMITED)
PARTICULARS 2010 2011 2012
INCOME
Operating income 3205.79 3773.13 4645.35
EXPENSES
Materials consumed 873.86 995.86 1195.34
Manufacturing expenses 209.67 226.02 257.38
Selling and administrative expense 123.48 134.58 186.78
Expenses capitalized 84.05 91.45 110.33
Cost of sales 1180.44 1375.92 1749.11
Operating profit 292.05 363.11 429.05
Gross profit 214.68 273.63 299.08
Depreciation 76.28 75.65 85.04
Profit before tax 138.40 200.71 214.04
Tax charge 25.86 51.03 91.00
Profit after tax 137.44 176.46 188.35
Net profit 94.99 140.90 146.41
Equity division 18.77 25.02 25.02
Cash flow of TISCO AND UML
Particulars Mar ' 10 Mar ' 11 Mar ' 12
Profit before tax 6,261.65 7,066.36 7,315.61
Net cash flow-operating activity 5,118.10 6,254.20 7,397.22
Net cash used in investing activity -5,427.60 -29,318.58 -9,428.08
Net cash used in fin. Activity 7,702.46 15,848.07 3,156.42
Cash and equivalent begin of year 288.39 7,681.35 465.04
Cash and equivalent end of year 7,681.35 465.04 1,590.60
40. USHA MARTIN LIMITED
PARTICULARS 2010 2011 2012
Profit before tax 182.9 246.8 280.6
Net cash flow from operating activities 186.09 252.0 625.9
Net cash used in investing activities 301.7 325.9 952.2
Net cash from financing activities 97.0 98.0 363.0
Cash and equivalent beginning of the year 67.7 49.0 72.1
INTERPRETATION
Net Sales / Income from Operations: Figures in Rs. crore
FY 12 FY 11 Change Change %
Sale of products 25,945 21,392 4,553 21%
Sale of power and water 566 546 20 4%
Income from town, medical and other services 41 41 (0) 0%
Other operating income 291 210 81 39%
Total Sale of products and services 26,844 22,190 4,654 21%
Less: Excise Duty 2,528 2,499 29 1%
Net sales/Income from Operations 24,316 19,691 4,625 23%
The net sales increased by 23% during FY 12 over FY 11 mainly due to higher prices realised
on Steel as well as other products during the first half of the financial year. While realisation
declined following the global economic slowdown, Steel volumes improved significantly in
the second half as can be seen from the following table:
Figures in million tonnes
Steel volume H1 H2 Change %
FY 09 2.38 2.85 20%
FY 08 2.26 2.52 12%
The divisional net sales of the Company are shown below:
Figures in Rs. crore
Net Sales FY 12 FY 11 Change Change %
Steel 20,456 16,539 3,917 24%
Tubes 1,410 1,217 193 16%
Ferroalloys
and Minerals 2,324 1,808 516 29%
Bearings 127 127 (0) 0%
Total 24,316 19,691 4,625 23%
41. As explained above net sales in the Steel division increased by 23% due to increase in prices
in the first half of FY 12 and increase in volume in the second half of FY 12.Similarly sales
of Tubes and Ferroalloys improved mainly due to higher realizations experienced during the
year on account of increase in prices with lower volumes as compared to the last year.
. Fixed Assets: Figures in Rs. crore
FY 12 FY 11 Change Change %
Gross Block 23,545 20,847 2,698 13%
Less: 100 100 — 0%
Impairment
Less: 8,962 8,123 839 10%
Depreciation
Net Block 14,482 12,624 1,859 15%
The Gross Block increased during the year primarily on account of the 1.8 million tone steel
expansion programme and the 3 million tonne steel expansion programme (commenced in the
last quarter of FY 12) at Jamshedpur.
Investments:
Figures in Rs. crore
FY 12 FY 11 Change Change %
Trade investments 1,744 1,152 592 51%
Investment in subsidiary companies 37,359 1,914 35,444 1852%
Investment in mutual funds 3,269 1,028 2,241 218%
Other current investments — 9 (9) (100%)
Total investments 42,372 4,103 38,269 933%
Increase in Investments in subsidiary companies was due to conversion of advance against
equity to Tata Steel Holdings (included in loans and advances as on 31.3.08) and also on
account of further contributions to the capital of Tata Steel Holdings apart from contributions
to equity of some subsidiary companies in India..
12. Sundry Debtors: Figures in Rs. crore
FY 12 FY 11 Change Change %
Gross Debtors 662 577 85 15%
Less: Provision for doubtful debts 26 34 (8) (23%)
Net Debtors 636 543 93 17%
The debtors as on 31st March, 2012 was higher by Rs. 93 crore than the level of 31st March,
2011. The increase is in line with the increase in turnover.
Loans and Advances: Figures in Rs. Crore
FY 12 FY 11 Change Change %
Loans and advances 4,578 33,349 (28,771) (86%)
42. The loans and advances reduced substantially as the advance against equity was converted
into investments during the financial year and accordingly there was an increase in the
investments.
Cash Flow:
Net cash flow from operating activities: The net cash from operating activities was Rs. 7,397
crore during FY 12 as compared to Rs. 6,254 crore during FY 11. The cash operating profit
before working capital changes and direct taxes during FY 12 was Rs.9,457 crore, as
compared to Rs. 8,138 crore during the previous year (Depreciation was Rs. 973 crore in FY
12, FY11: Rs. 835 crore). The change in working capital, during the financial year, was
mainly due to increase in inventories on account of volumes and prices partly offset by an
increase in creditors.
Net cash from investing activities: The net cash outflow from investing activities amounted
to Rs. 9,428 crore in FY 12. The outflow broadly represents a capex of Rs. 2,786crore,
increase in investments in mutual funds of Rs. 2,241 crore and an incremental investment in
Tata Steel Holdings of Rs. 4,286 crore.
Net cash from financing activities: The net cash from financing activities was Rs.3,156 crore
during FY 12 as compared to Rs. 15,848 crore during FY 11. The incremental borrowing of
Rs. 6,494 crore in the current year is mainly from the issue of non-convertible debentures and
term loans from Banks partly offset by interest payment of Rs. 1,214 crore and a dividend
payment of Rs. 1,187 crore.
RISKS & CONCERNS FOR BOTH THE COMPANIES:
� Any delay in the commencement of its project on time would pose a negative effect on the
operating margin.
� Lower than expected Volume growth will hamper revenues of the company.
� Lower than expected price realizations is also a major concern for the company‘s
performance.
� Any further slowdown in the economy will lead to a fall in Steel Demand, impacting the
revenues of the company.
CONCLUSIONS DRAWN BY COMPARING THE FINANCIAL POSITION OF BOTH THE COMPANY
The global steel industry has been hard hit by the global economic slowdown, with steel
production registering negative growth of 1.1 per cent. As the deceleration led to slump in
demand, international steel prices fell sharply, causing significant downward revision in the
contract prices of raw material. After an estimated decline of 9‐10 per cent in 2012, global
steel demand is expected to witness improvement in growth from 2013 to 2016. Domestic
demand is likely to be relatively flexible and recover faster, and is expected to witness growth
of 8‐9 per cent from 2012‐13 to 2014‐16.
Position of USHA MARTIN LIMITED in the business world
The Wire Ropes & Speciality Products business accounted for 41.4% of gross activity level
and 55.0% of reported turnover of the Company. This business achieved turnover of Rs.
1,191.05 Crs. as against Rs. 921.49 Crs. In previous year, registering a growth of 29.3% over
previous year. The gross profit margin improved to 21.1% from 16.1%. The export turnover
of this business has grown by 66.8% to Rs. 478.05 Crs. during year under review as against
Rs. 286.52 Crs. in previous year. But for imposition of export duty on some of products, the