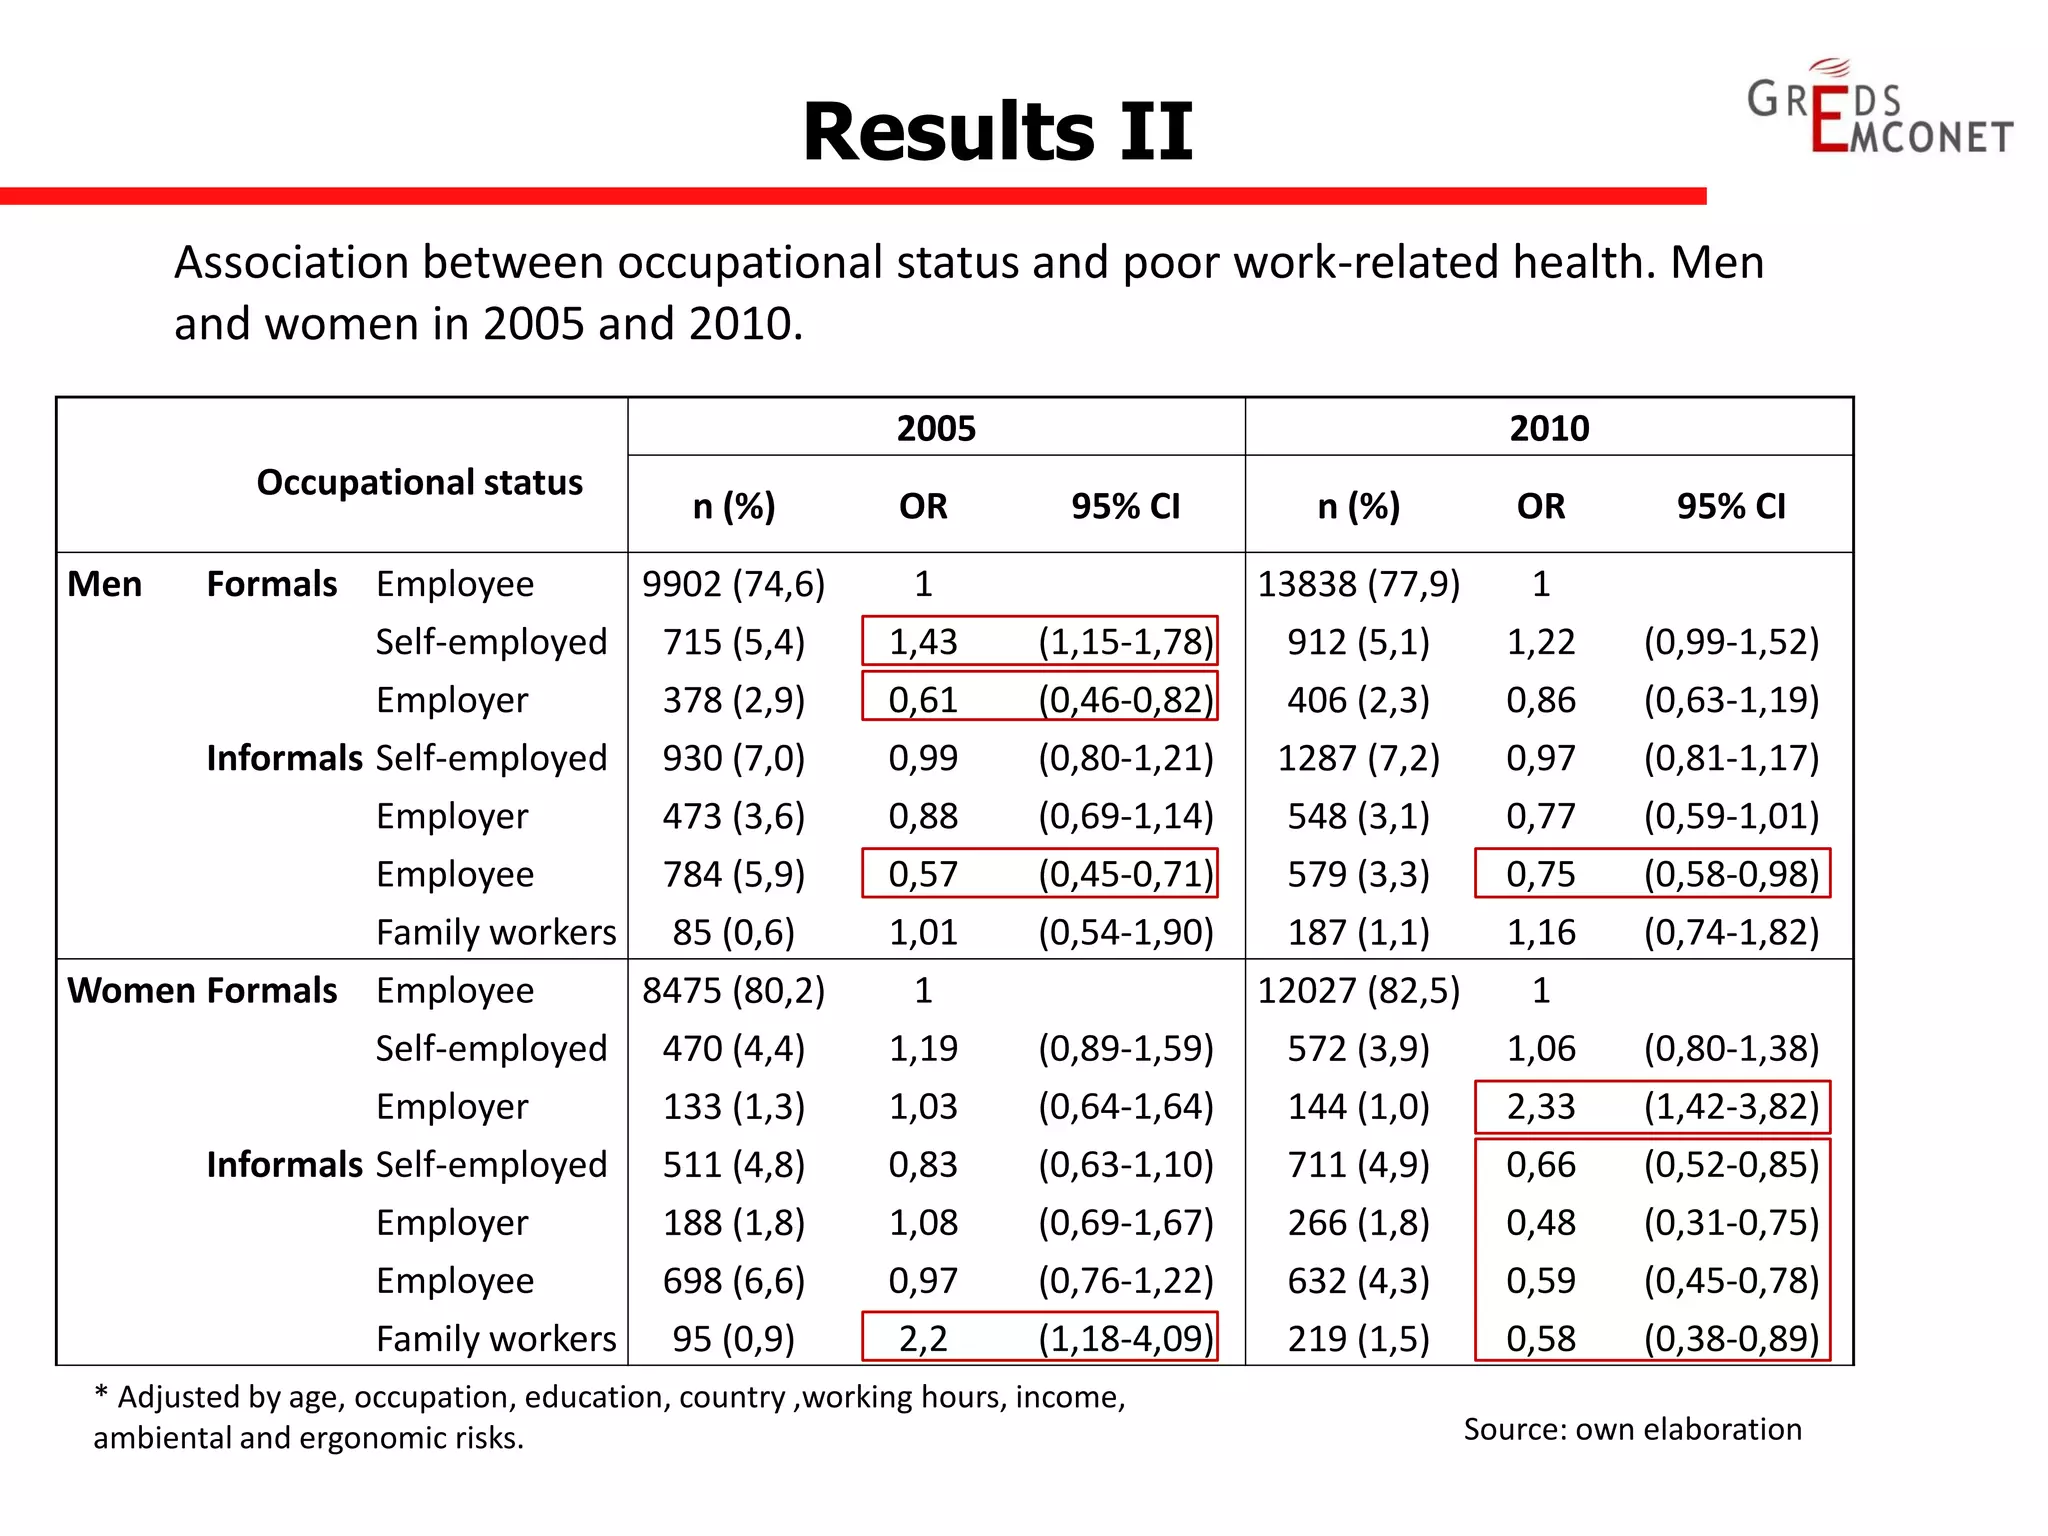
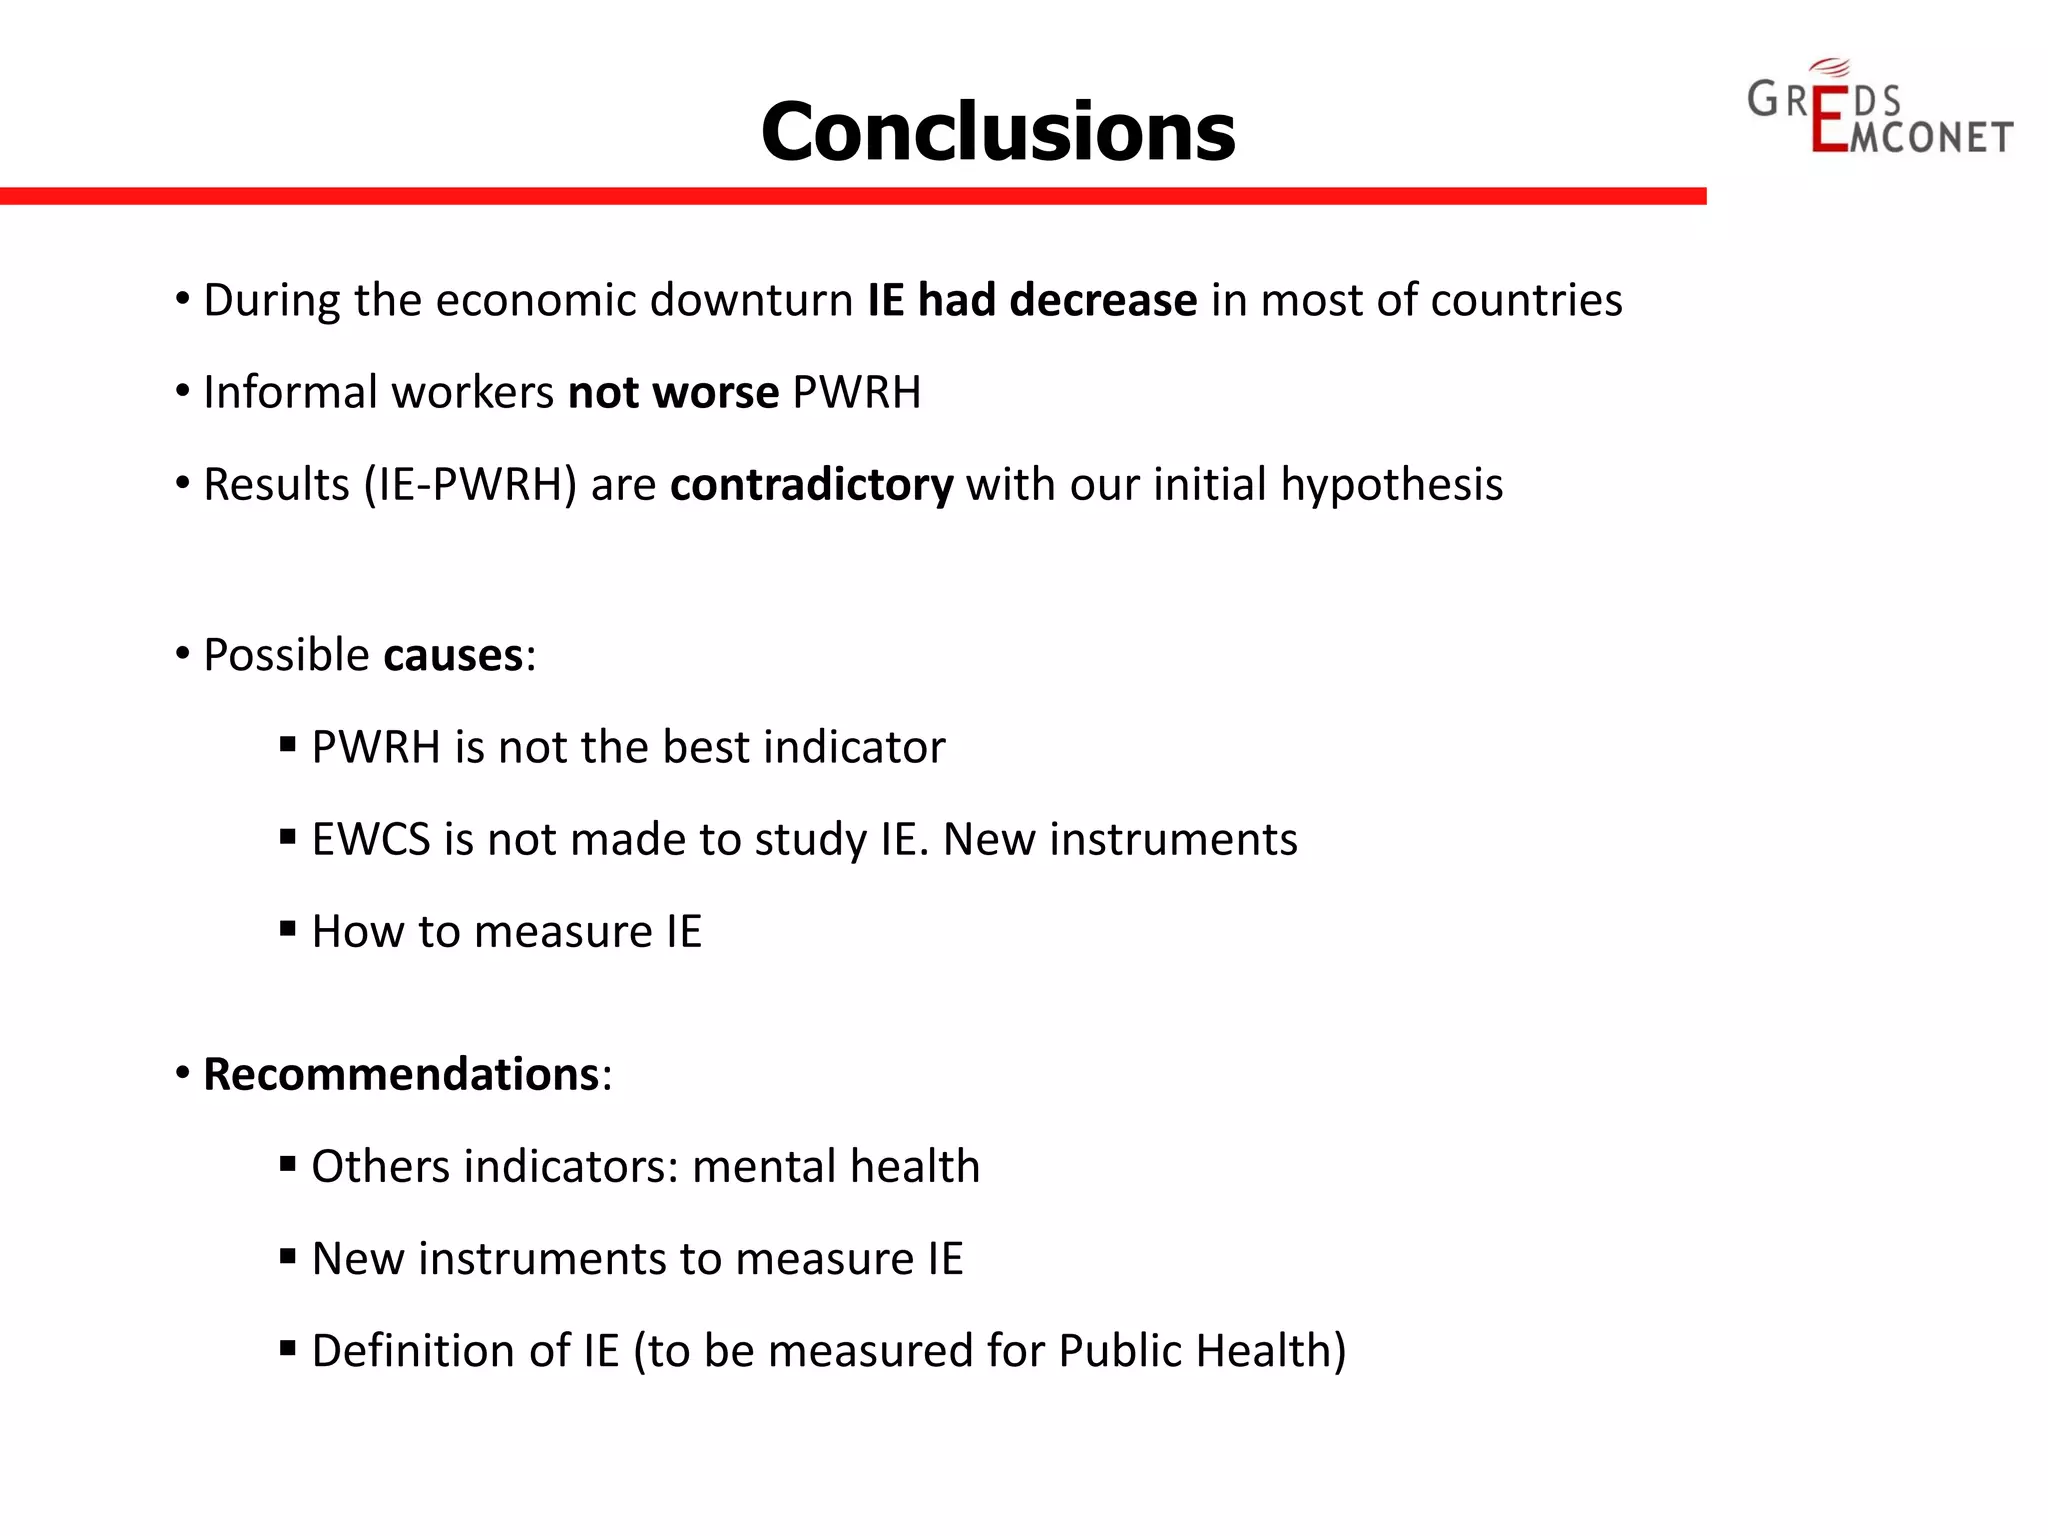
Informal employment related to health in the European Union 
M. Julià1, G. Tarafa1,2, F.Belvis1, J. Benach1,2 
1 Health Inequalities Reseach Group. Employment Conditions Network (GREDS-EMCONET). Universitat Pompeu Fabra. Barcelona 
2 Transdisciplinary Research Group on Socioecological Transitions (GinTRANS2). Universidad Autónoma Madrid, Spain
Background, objectives and methods 
• Background: 
• Objectives: 
 Informal employment (IE) scarcely studied in high income countries (our previous study) 
 Relationship between IE and health or health inequalities is not studied 
 To measure IE in EU-27 countries in 2005 and 2010 
 To know social distribution of poor work-related health (PWRH) 
 To analyse the association between IE and PWRH 
• Methods: 
 15-64 aged in the EU-27 from 2005 and 2010 EWCS 
 Prevalence of IE and social distribution of PWRH 
 Binomial logistic regression model
Results I 
Prevalence of IE in EU-27 in 2005 and 2010. 
Source: own elaboration
Results II 
2005 
2010 
Occupational status 
n (%) 
OR 
95% CI 
n (%) 
OR 
95% CI 
Men 
Formals 
Employee 
9902 (74,6) 
1 
13838 (77,9) 
1 
Self-employed 
715 (5,4) 
1,43 
(1,15-1,78) 
912 (5,1) 
1,22 
(0,99-1,52) 
Employer 
378 (2,9) 
0,61 
(0,46-0,82) 
406 (2,3) 
0,86 
(0,63-1,19) 
Informals 
Self-employed 
930 (7,0) 
0,99 
(0,80-1,21) 
1287 (7,2) 
0,97 
(0,81-1,17) 
Employer 
473 (3,6) 
0,88 
(0,69-1,14) 
548 (3,1) 
0,77 
(0,59-1,01) 
Employee 
784 (5,9) 
0,57 
(0,45-0,71) 
579 (3,3) 
0,75 
(0,58-0,98) 
Family workers 
85 (0,6) 
1,01 
(0,54-1,90) 
187 (1,1) 
1,16 
(0,74-1,82) 
Women 
Formals 
Employee 
8475 (80,2) 
1 
12027 (82,5) 
1 
Self-employed 
470 (4,4) 
1,19 
(0,89-1,59) 
572 (3,9) 
1,06 
(0,80-1,38) 
Employer 
133 (1,3) 
1,03 
(0,64-1,64) 
144 (1,0) 
2,33 
(1,42-3,82) 
Informals 
Self-employed 
511 (4,8) 
0,83 
(0,63-1,10) 
711 (4,9) 
0,66 
(0,52-0,85) 
Employer 
188 (1,8) 
1,08 
(0,69-1,67) 
266 (1,8) 
0,48 
(0,31-0,75) 
Employee 
698 (6,6) 
0,97 
(0,76-1,22) 
632 (4,3) 
0,59 
(0,45-0,78) 
Family workers 
95 (0,9) 
2,2 
(1,18-4,09) 
219 (1,5) 
0,58 
(0,38-0,89) 
Association between occupational status and poor work-related health. Men and women in 2005 and 2010. 
Source: own elaboration 
* Adjusted by age, occupation, education, country ,working hours, income, ambiental and ergonomic risks.
Conclusions 
• During the economic downturn IE had decrease in most of countries 
• Informal workers not worse PWRH 
• Results (IE-PWRH) are contradictory with our initial hypothesis 
• Recommendations: 
 Others indicators: mental health 
 New instruments to measure IE 
 Definition of IE (to be measured for Public Health) 
• Possible causes: 
 PWRH is not the best indicator 
 EWCS is not made to study IE. New instruments 
 How to measure IE

Informal employment related to health in the European Union

  • 1.
    Informal employment relatedto health in the European Union M. Julià1, G. Tarafa1,2, F.Belvis1, J. Benach1,2 1 Health Inequalities Reseach Group. Employment Conditions Network (GREDS-EMCONET). Universitat Pompeu Fabra. Barcelona 2 Transdisciplinary Research Group on Socioecological Transitions (GinTRANS2). Universidad Autónoma Madrid, Spain
  • 2.
    Background, objectives andmethods • Background: • Objectives:  Informal employment (IE) scarcely studied in high income countries (our previous study)  Relationship between IE and health or health inequalities is not studied  To measure IE in EU-27 countries in 2005 and 2010  To know social distribution of poor work-related health (PWRH)  To analyse the association between IE and PWRH • Methods:  15-64 aged in the EU-27 from 2005 and 2010 EWCS  Prevalence of IE and social distribution of PWRH  Binomial logistic regression model
  • 3.
    Results I Prevalenceof IE in EU-27 in 2005 and 2010. Source: own elaboration
  • 4.
    Results II 2005 2010 Occupational status n (%) OR 95% CI n (%) OR 95% CI Men Formals Employee 9902 (74,6) 1 13838 (77,9) 1 Self-employed 715 (5,4) 1,43 (1,15-1,78) 912 (5,1) 1,22 (0,99-1,52) Employer 378 (2,9) 0,61 (0,46-0,82) 406 (2,3) 0,86 (0,63-1,19) Informals Self-employed 930 (7,0) 0,99 (0,80-1,21) 1287 (7,2) 0,97 (0,81-1,17) Employer 473 (3,6) 0,88 (0,69-1,14) 548 (3,1) 0,77 (0,59-1,01) Employee 784 (5,9) 0,57 (0,45-0,71) 579 (3,3) 0,75 (0,58-0,98) Family workers 85 (0,6) 1,01 (0,54-1,90) 187 (1,1) 1,16 (0,74-1,82) Women Formals Employee 8475 (80,2) 1 12027 (82,5) 1 Self-employed 470 (4,4) 1,19 (0,89-1,59) 572 (3,9) 1,06 (0,80-1,38) Employer 133 (1,3) 1,03 (0,64-1,64) 144 (1,0) 2,33 (1,42-3,82) Informals Self-employed 511 (4,8) 0,83 (0,63-1,10) 711 (4,9) 0,66 (0,52-0,85) Employer 188 (1,8) 1,08 (0,69-1,67) 266 (1,8) 0,48 (0,31-0,75) Employee 698 (6,6) 0,97 (0,76-1,22) 632 (4,3) 0,59 (0,45-0,78) Family workers 95 (0,9) 2,2 (1,18-4,09) 219 (1,5) 0,58 (0,38-0,89) Association between occupational status and poor work-related health. Men and women in 2005 and 2010. Source: own elaboration * Adjusted by age, occupation, education, country ,working hours, income, ambiental and ergonomic risks.
  • 5.
    Conclusions • Duringthe economic downturn IE had decrease in most of countries • Informal workers not worse PWRH • Results (IE-PWRH) are contradictory with our initial hypothesis • Recommendations:  Others indicators: mental health  New instruments to measure IE  Definition of IE (to be measured for Public Health) • Possible causes:  PWRH is not the best indicator  EWCS is not made to study IE. New instruments  How to measure IE