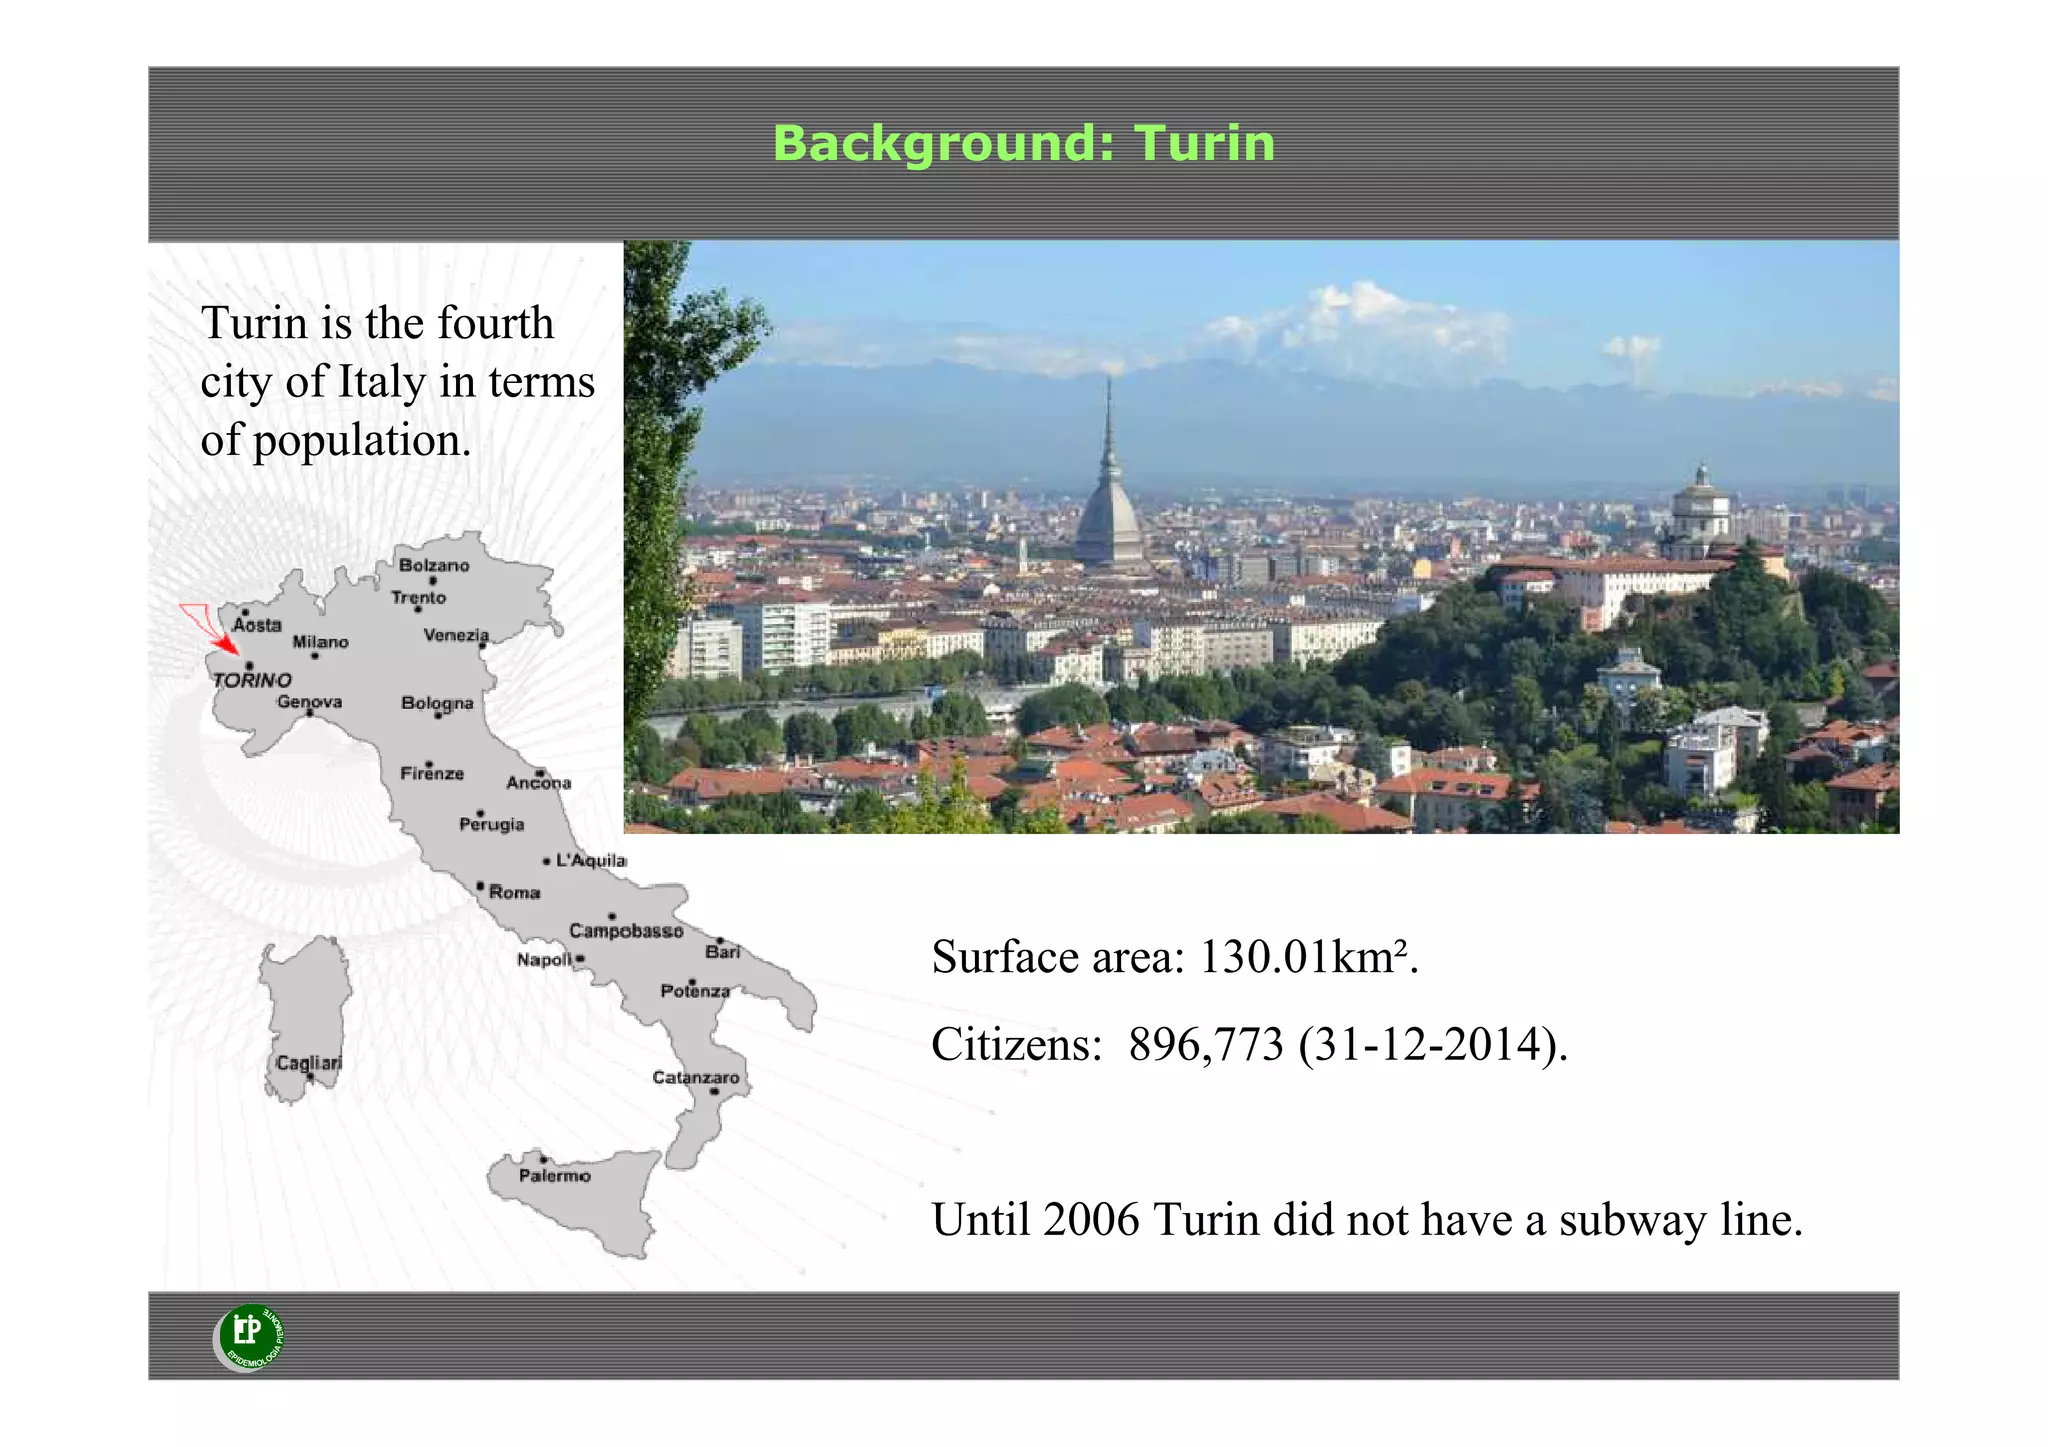
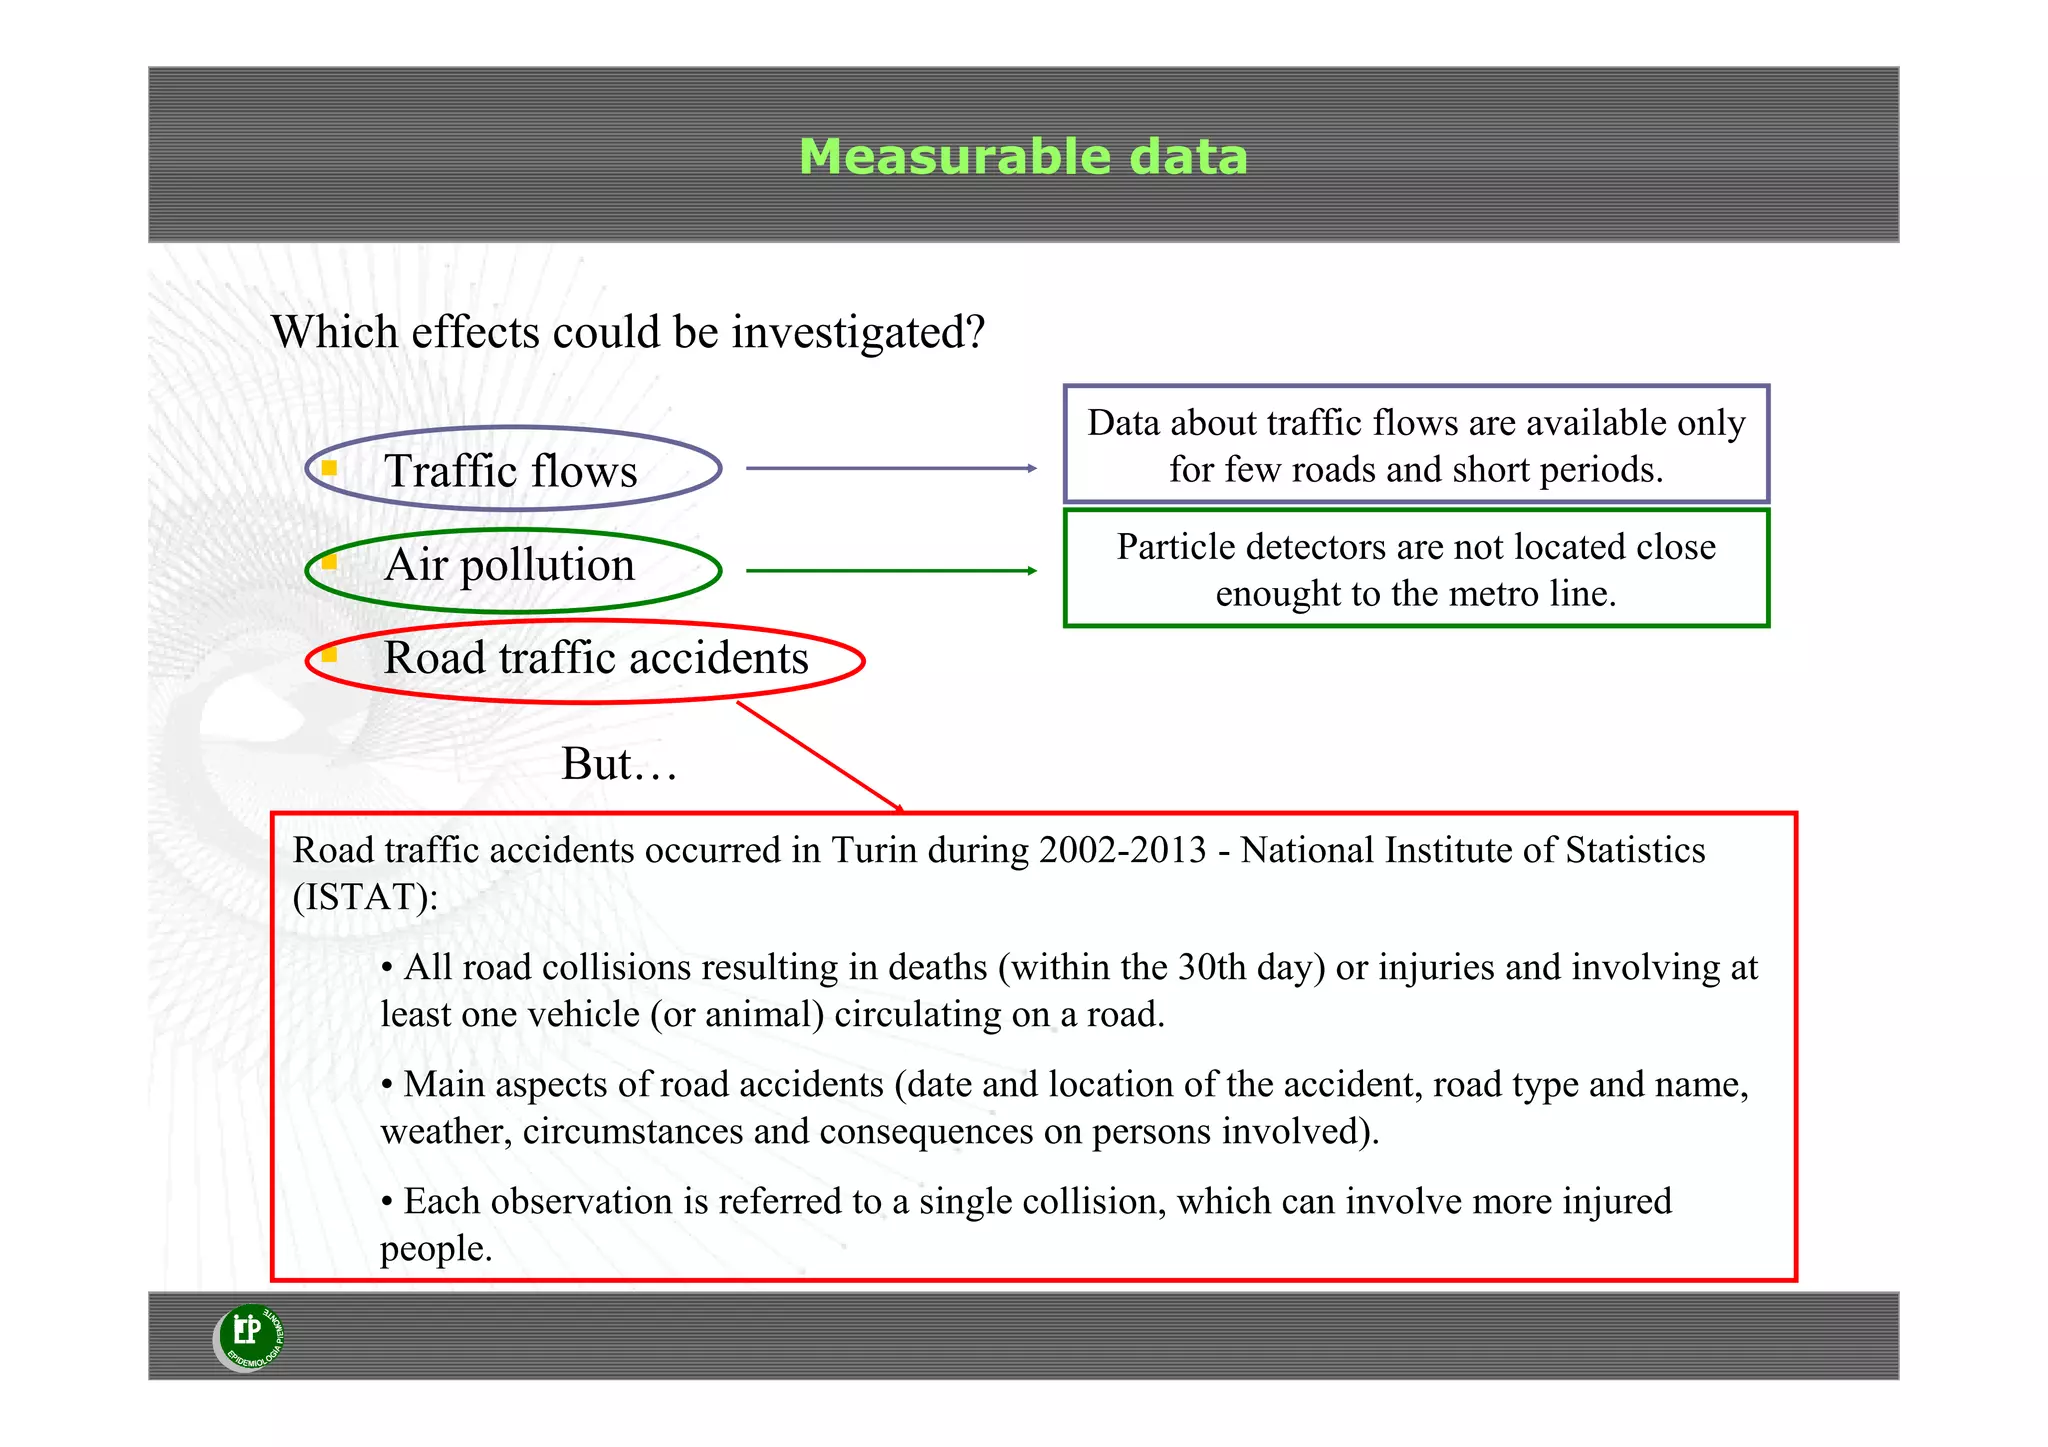
1) The document analyzes the impacts of a new metro line in Turin, Italy on road traffic accidents and local mobility.
2) An interrupted time series analysis found no significant changes in trends of traffic accidents after the opening of the new metro segments.
3) An analysis of injured road users found differences in modal shares between the metro catchment area and overall Turin, but no significant trend changes related to the metro.
Call Girls Service in Bommanahalli - 7001305949 with real photos and phone nu...
Analysis of impacts of new Turin metro line on road traffic accidents
1. New metro line in Turin: an analysis of
the impacts on road traffic accidents
and local mobility
6th July 2015
Session: Thinking Mobility - Well Being, Awareness & Technology
Selene Bianco1, G. Melis2, E. Eynard2, C. Marietta2, M.
Tabasso2, C. Mamo1, E. Gelormino1, G. Costa1
1. Epidemiology Unit, Local Health Unit TO3
2. SiTI - Higher Institute on territorial systems for innovation
2. Background: Turin
Surface area: 130.01km².
Citizens: 896,773 (31-12-2014).
Until 2006 Turin did not have a subway line.
Turin is the fourth
city of Italy in terms
of population.
3. First metro line in Turin
In Turin, the first Italian automatic underground has been built and now it moves
about 130,000 passengers per day.
Segments of the subway line:
2006: Fermi (Collegno) – Porta Susa
station (Turin)
2007: Porta Susa station (Turin) –
Porta Nuova station (Turin)
2011: Porta Nuova station (Turin) –
Lingotto (Turin)
The full path starts from the
neighbouring town of Collegno to
the south of Turin.
4. Effects of the first segment of the metro line
• The opening of the first segment of Turin subway (2006) had effects on the
modal behavior of city users:
• modal diversion from car to subway, mostly evident among richer people
with higher educational qualification (23% in comparison to 15.5% average).
(Pronello, Rappazzo, & Camusso, 2012).
We expect that the new metro segment
could
• increase quality of sustainable urban
mobility,
• reduce traffic and air pollution,
• reduce traffic accidents.
5. Measurable data
Which effects could be investigated?
Data about traffic flows are available only
for few roads and short periods.Traffic flows
Air pollution
Road traffic accidents
But…
Particle detectors are not located close
enought to the metro line.
Road traffic accidents occurred in Turin during 2002-2013 - National Institute of Statistics
(ISTAT):
• All road collisions resulting in deaths (within the 30th day) or injuries and involving at
least one vehicle (or animal) circulating on a road.
• Main aspects of road accidents (date and location of the accident, road type and name,
weather, circumstances and consequences on persons involved).
• Each observation is referred to a single collision, which can involve more injured
people.
6. Question time 1
How could it be possible to assess
the short term impacts of the new
segment of metro line on road
accidents in Turin?
7. Aim of the study
The aim of the study is to investigate if there is a causal
connection between the opening of the metro and the trend
change in traffic accidents through a pre-post intervention
analysis.
An analysis of the distribution of different typologies of
road injured has also been performed.
8. Subway catchment area
• A pre-post analysis requires a sufficient
number of observations.
• Thus, we focused on the last segment: from
the Porta Nuova Station to Lingotto.
• Catchment area:
• radius of 500m around each subway
stations,
• only the census cells covered at least by
the 50% of this area (GIS technology)
have been considered.
• 4.21 km2
(Murrey et al., 1998), (Pagliara et al., 2006),
2006 - 2007 PS - PN
2007 - 2011 PN - Lingotto
2001 - 2006 Fermi - PS
9. Traffic accidents in the subway catchment area
• In order to locate each accident from text addresses, a geocoding process (Google
geocoding) was required.
• Since the process
is long and
expensive, only
accidents within
the catchment area
were geocoded.
10. Time series decomposition: ARIMA model
Check if the series can be modelled by an ARIMA (Autoregressive integrated
moving average) process.
• The trend of road traffic accidents
is highly autocorrelated, all p values
for the test of the first 6, 12, 18 and
24 months autocorrelations are
<0.0001.
• If we use the 2002-2011 data to fit
the model and then forecast for
2012-2013, we obtain a good
approximation of observed data.
• An ARIMA autocorrelation model
can successfully be used for the ITS
analysis.
11. The following model has been used to perform ITS:
where
t is the counter of the time of the series,
δint is 0 before intervention and 1 after
t1 is the time after intervention,
the error εt represents the random variability at time t,
β0 estimates the baseline level
β1 estimates the baseline trend
β2 estimates the level change immediately after the intervention
β3 estimates the change in the trend after intervention compared with the trend prior to it.
β1 + β3 is the post-intervention slope.
Interrupted time series
• We defined as intervention period the time interval from the beginning of works
to the opening of the subway.
• This model controls for both baseline level and trend.
• All analysis have been performed by means of SAS PROC ARIMA.
12. Interrupted time series analysis: results
Regression parameters of Turin time series: the trend level change is significant
but the pre and post intervention slopes are not.
Regression analysis of subway area time series: no significant trend changes
have been detected.
13. Injured distribution, 2004-2013
Injured
Turin Subway area
N % N %
Pedestrians 6552 10.95 402 18.19
Car 39207 65.54 1201 54.34
Public transport 1693 2.83 90 4.07
Truck/Lorries 1130 1.89 21 0.95
Other heavy duty vehicles 136 0.23 5 0.23
Bikes 1833 3.06 83 3.76
Motorcycles 9084 15.19 397 17.96
Hit-and-run driver 127 0.21 7 0.32
Minicar 59 0.1 4 0.18
All 59821 100 2210 100
• Injured can be considered as a proxy of modal behavior
of road users.
• People seems to be more likely to walk, take public
transport or use two wheel means of transport in the
subway catchment area than in the rest of the city.
For both Turin and the catchment area
• the trend of injured pedestrians and
motorcyclists is slowly decreasing,
• the trend of injured cyclists is
increasing.
• However, no significant trend
changes can be detected by ITS nor by
a Chi-square test.
14. Hypothesis for the discussion
• No interchange parking facility.
• The metro segment extends parallel along
the main railway.
• Most of the private car traffic that goes
through this area flows outside the city.
• Traffic accidents density (2002-2013):
• Turin: 303.6 accidents/km2
• subway catchment area: 412.4
accidents/km2
•Average population:
• Turin: 892,700 (6,867 people/km2)
• subway catchment area: 60,630 (14,401
people/km2)
15. Question time 2
Shall we suppose that the opening of this
segment of the metro had no impact on
road users modal behaviour?
Which factors contributed to a different
road accidents trend between the
catchment area and the entire city?
UKItaly Spain Germany Bangladesh
16. Limits of this study
• Lack of data about traffic.
• Lack of environmental/pollution data.
• Only road accidents involving injured people have been analysed.
• No knowledge of socio-economic characteristics of injured people.
• No knowledge about changes in the choice of transport modes.
17. Conclusions
• The building of a transport infrastructure like a metro line can
probably impact on traffic and road accidents, but...
… other measures should be achieved in parallel.
• physical,
• socio-economic,
• environmental,
• cultural
• …
Sustainable mobility should be integrated in an urban renewal
program needing policies taking into account other aspects of a
neighbourhood: