SlideShare a Scribd company logo
1 of 25
Download to read offline
Original Article
Occupational Gradients
in Work-Related
Insecurity and Health:
Interrogating the Links
Heather Scott-Marshall1
Abstract
Traditional work-related securities that constitute the career-job model of employ-
ment have been in steep decline for several decades, affecting workers across
industries and occupations. Still, insecure employment remains unequally distributed
across the working population according to the major axes of social stratification,
namely age, gender, race, and socioeconomic class. This study investigates patterns
of exposure to work-related insecurity across the occupational hierarchy and wheth-
er these contribute to occupational gradients in health outcomes. Drawing on data
from a national panel survey of the Canadian workforce, a multilevel growth curve
modeling approach is used to examine the relationship between work-insecurity
exposures and workers’ self-rated health trajectories over 5 years. Findings show
that work-related insecurity is associated with declines in self-rated health, although
the type of insecurity as well as the magnitude, direction, and duration of the effect
varies by occupational status-position. The application of pseudo-R2
tests confirmed
this study’s central hypothesis that gradients in health outcomes across occupational
hierarchies are due, in part, to differences in exposure to work-related insecurity.
Going forward, the development of effective health promotion interventions that
can modify work-related health gradients, must work toward mitigating the risk of
exposure to adverse work circumstances that is systemic to occupational
hierarchies.
1
Dalla Lana School of Public Health, Social & Behavioural Sciences, University of Toronto, Toronto,
ON, Canada
Corresponding Author:
Heather Scott-Marshall, Dalla Lana School of Public Health, Social & Behavioural Sciences, University of
Toronto, 155 College Street, Suite 500, Toronto, ON M5T 3M7, Canada.
Email: heather.scott@utoronto.ca
International Journal of Health
Services
0(0) 1–25
! The Author(s) 2019
Article reuse guidelines:
sagepub.com/journals-permissions
DOI: 10.1177/0020731419832243
journals.sagepub.com/home/joh
Keywords
work insecurity, social stratification, health, multi-level modeling, Canadian workforce
Decades of global economic restructuring coupled with rapid technological
innovation have transformed work systems and undermined the balance of
power in work relations. For workers, most stark has been the breakdown of
the traditional quid pro quo built into employment relationships whereby work-
ers enjoyed a living wage, income security benefits, and long-term employment
stability in exchange for a lifetime of service. Formal employment protections
were the centerpiece of lives that unfolded predictably and allowed workers to
plan their long-term future regarding career, finances, and family.
The requirements of economic globalization have been mostly antithetical to
traditional work protections. Intense competition among global economic stake-
holders has given rise to an unwavering pursuit of reduced human capital
expenditures and contributed to the proliferation of precarious work arrange-
ments. A handful of studies have demonstrated the social patterning of precar-
ious work experiences according to the major axes of social stratification – i.e.,
socioeconomic class, age, gender, and race – with concomitant impacts on how
adverse health is distributed across social hierarchies.1,2
These studies suggest
that variations in health outcomes across the occupational hierarchy arise in
part due to differences in exposure to precarious employment circumstances.3,4
The present study contributes to this body of evidence by evaluating the rel-
ative impact of work-related insecurity exposures on workers’ self-rated health
trajectories based on positioning within the occupational status hierarchy.
Drawing on both a conceptual framework of work-related insecurity as a struc-
tural feature of the employment relationship1,5
and a conceptual mapping of class
locations developed by Wright,6
this study addresses the following objectives: (1)
to identify patterns of exposure to work-related insecurity across the occupation-
al status hierarchy; (2) to evaluate the impact of work-related insecurity on
self-rated health trajectories and how this impact is mitigated by occupational
status-position; and (3) to quantify the degree of variation in self-rated health
outcomes that is attributable to work-related insecurity, so as to determine its
precise contribution to occupational gradients in health.
Background
In Canada, as across the North American continent, the unprecedented eco-
nomic growth that occurred after World War II derived mainly from both
technological advances in production as well as the enormous demand from
2 International Journal of Health Services 0(0)
European countries seeking to rebuild following the war. The overwhelming
need for skilled labor required that industrial relations be stabilized, and capital
was willing to make concessions to achieve this goal. The rise of a new phase of
monopoly capitalism provided the backdrop for thriving labor markets and a
Keynesian approach to social spending. A major consequence of the unique set
of structural contingencies that existed during this period was the unprecedented
level of accord that developed between labor and capital, known to observers as
the “social contract.”7,8
A key outgrowth of the social contract that formed
between labor and capital was a new regime of industrial legality comprising
substantial improvements in both employment standards and institutionalized
bargaining rights.9
The zeitgeist of a labor-relations era built on fairness and reciprocity was
manifest at the level of the employment relationship. Many organizations struc-
tured employment relations by way of an internal labor market, a closed system
predicated on deferred rewards. The basic principle of this arrangement is that
workers provide a lifetime of service to a firm in exchange for incremental
improvements in wages, job status, and security that remained in-step with
employment tenure. Mutual benefits accrued – to workers in long-term career
and financial security, and to employers in a reliable and productive workforce.
The sociocultural impact of the internal labor market was enormous in that it
gave rise to a new standard in work relations that stipulated longevity, stability,
and prosperity as key elements of the employment exchange.8
The Brave New World of Work
It is not an overstatement to declare the postwar standard in employment as
mostly defunct in the present socioeconomic context. Canadian labor-market
data reveal key changes in the quality of work that can be viewed as commen-
surate with the decline in traditional employment securities. One important
indicator is the growing number of workers who are employed in nonstandard
work arrangements. Currently, more than 2 in 5 Canadian workers are
employed in temporary, part-time, or solo self-employment arrangements.10–12
Earnings growth has also been sluggish for Canadian workers. A recent anal-
ysis of historical earnings data concluded that after adjusting for inflation, the
average hourly wage of full-time payroll workers remained mostly unchanged
over 4 decades, from $24.00 in 1976 to $27.70 in 2016.13
Still, wage rates vary
widely across occupational groups, with management occupations earning the
highest wages, by far, on average, at $40.25 per hour, while restaurant and food
service workers remain at the lowest end of the earnings distribution, at $18.10
per hour.14
A key factor in stagnant wages is the breakdown of internal job
ladders and concomitant losses in opportunities for career advancement within
firms. As a consequence, an increasing number of workers have remained
Scott-Marshall 3
“stuck” in entry-level positions, which has contributed to rising intra-firm wage
inequality.15
Another significant shift in compensation norms has been the rate at which
workers are covered by income security benefits, such as private health insur-
ance and retirement pensions.16,17
Dramatic increases in the provision costs for
extended health coverage – particularly for pharmaceuticals – have caused
employers to cut back on health benefits.18
Pension coverage for employees
has also fallen drastically: since 1977, the proportion of Canadian workers cov-
ered by a defined benefit pension plan has declined from more than 2 in 5 (44%)
workers to less than 1 in 3 (29%).16
Losses in key provisions comprising the postwar employment standard reflect
a more fundamental process involving a shift in the balance of power away from
Canadian labor. A major indicator of this trend is the decline in organized labor
in Canada. Between 1981 and 2016, union density – the proportion of all
Canadian workers covered by a collective agreement – fell from 38% to
29%.19
In turn, the shrinking presence of unions has given rise to adverse
work changes across sectors; in particular, the loss of equity norms that
unions helped institutionalize has contributed to growing wage disparities in
non-unionized industries.20
Taken together, changes to full-time permanent work arrangements reflect a
fundamental restructuring of contemporary employment relationships in accor-
dance with contingencies inherent in an increasingly competitive globalized cap-
italism. “Post-standard employment” – characterized by instability, lack of
protection, and social and economic vulnerability – is on the rise in developed
countries and affects workers across the occupational and industry spectrum.21
The antithesis of the postwar standard in employment, post-standard employ-
ment is characterized by non-sustaining wages, a lack of benefits adequacy, and
few opportunities for job, wage, or career advancement. In addition, a concom-
itant regime of workplace restructuring emphasizing “functional flexibility” has
led to the expansion of roles and responsibilities for many workers.22
This
expansion has driven a dramatic rise in unpaid overtime hours in the last 2
decades, a trend exacerbated by the ubiquitous presence of portable communi-
cations and monitoring technologies that require workers be “always-on.”23,24
Work-Related Insecurity and Health
Early investigations into the link between work insecurity and health focused
primarily on job insecurity and the physiological effects arising from the per-
ceived threat of job loss. Risk of job loss is conceived as a classic psychological
stressor and has been linked with several adverse physical and psychological
health outcomes.25,26
More recent investigations, however, show that work-
related insecurity experiences can be attributed to a broader set of causes than
just job loss. Experiences such as financial insecurity, loss of valued job features,
4 International Journal of Health Services 0(0)
assignment of unwanted tasks or responsibilities, and diminishing career devel-
opment opportunities have each been associated with poor health outcomes in
workers.1,25,27–29
This body of literature demonstrates the importance of decom-
posing work insecurity into its constituent elements so that the impact on health
of specific work features can be evaluated.
Social Position, Work, and Health
A perennial challenge facing public health professionals has been the persistent
gradient in health outcomes arising from social position. Historically, factors
related to social position such as socioeconomic class, age, gender, and race were
treated as confounding variables that needed to be controlled so that the effects
of a given pathogen on a particular health outcome could be evaluated. More
recently, critical perspectives on the sociology of health have gained prominence,
foregrounding the basic mechanisms of inequality embedded in social structures
that give rise to differences in health exposures and related outcomes. From this
perspective, factors related to social position are viewed as key proxies of pat-
terns of exposure to risks and rewards.30
Within the domain of work, hazardous
exposures tend to be systematically related to position within the occupational
hierarchy. The Whitehall studies have repeatedly demonstrated the link between
health status and occupational position over decades.31,32
More recent investi-
gations3,4
have confirmed that inequalities fundamental to the employment rela-
tionship manifest in adverse work exposures and, as such, constitute the main
explanatory variables of social class inequalities in health.3
Conceptual Framework and Hypotheses
The postwar standard in employment collapsed because the factors that brought
it into existence were ephemeral by nature. The economic monopoly that facil-
itated an interventionist approach to labor-market policy was undermined by
the mechanics of capitalism itself, which rely on an ever-expanding sphere of
influence. By the mid-1970s, the postwar economy was showing signs of signif-
icant upheaval as the globalization juggernaut was unleashed. Survival required
that firms restructure how they did business, including how they managed
employment relationships. A central component involved tearing down internal
labor market hierarchies and inserting more flexibility into employment rela-
tionships. A major casualty of this process was the basic quid pro quo that
formed the foundation of the postwar employment relationship – the exchange
of job and income security for a lifetime of employment service. Today, even
workers employed under contracts with nominal security (full-time, full-year,
non-term) experience work-related insecurity in the form of wage insufficiency,
unpredictable job and career mobility, and the lack of social protections (e.g.,
health insurance; disability or retirement pensions) due to lack of coverage by
Scott-Marshall 5
a union or collective agreement. Work-related insecurity thus constitutes a
structural feature of contemporary post-standard employment and in turn,
a chronic occupational stressor embedded in the organization of work.
Research into hazardous exposures at work demonstrates how the distribu-
tion of physical and psychosocial risk tends to align with an occupational hier-
archy in which low status workers experience the highest amount of exposure to
adverse working conditions, and the highest status workers experience the
least.3,4
The relationship between risk exposure and occupational position is
presumed to arise from the relative degree of control that workers exercise
over the terms, conditions, and outcomes of their work.5,6
Figure 1 presents a conceptual mapping of class locations adapted from
Wright.6
The map comprises 3 status dimensions. The first dimension, control
over economic or productive resources, constitutes the basic cleavage between
owner-employers and labor. The second dimension locates workers within the
hierarchy of production relations and is expressed as degree of authority or
managerial control at work. The third dimension captures the extent to which
workers have access to specialized skills or credentials.
By superimposing this mapping of class locations onto a conceptual frame-
work that presents work-related insecurity as a structural feature of post-
standard employment, informed propositions can be made regarding patterns
of exposure to work-related insecurity across the occupational hierarchy. For
example, the first dimension of the framework implies that exposure to work-
related insecurity is germane only to the class that lacks ownership and control
over productive resources. The second dimension links workers’ exposure to
insecurity to the level of control or influence they exercise within the employ-
ment relationship, as determined by their proximity to the levers of power
Capitalists
(many employees)
Managers
(skilled/expert)
Managers
(semi-skilled)
Managers
(unskilled)
Small employers
(few employees)
Supervisors
(skilled/expert)
Supervisors
(semi-skilled)
Supervisors
(unskilled)
Petty bourgeoisie
(no employees)
Workers
(skilled/expert)
Workers
(semi-skilled)
Workers
(unskilled)
Owners Employees
Relationship to production assets
Degree
of
organizational
authority
and
control
Degree of skills/credentials
Figure 1. Conceptual map of class locations. Adapted from Wright.6
Work-related insecurity is
a structural property of work/labour-relations that derives from a lack of control over eco-
nomic and productive resources.
6 International Journal of Health Services 0(0)
(e.g., degree of control over their own work circumstances as well as the work
circumstances of others via hiring decisions, promotion opportunities, wage
increases, etc.). The third dimension is similar in that it traces exposure to
work-related insecurity to the vulnerability associated with a lack of marketable
skills or credentials.
The major hypotheses of this study are as follows:
H1: Workers with low authority and managerial control will have higher exposure
to work-related insecurity than workers with greater authority and manageri-
al control.
H2: Workers with low skills-knowledge and few credentials will have higher expo-
sure to work-related insecurity than workers with higher skills and credentials.
H3: There will be a monotonic increase in level of exposure to work-related inse-
curity across the authority-skills spectrum such that workers at the low end of each
axis (i.e., non-managers who perform low-skill tasks) will experience the highest
exposure to work-related insecurity, whereas those at the highest point of each axis
(i.e., managerial workers with specialized skills) will have the least exposure.
H4: Exposure to work-related insecurity will have a cumulative adverse effect on
self-rated health over time such that longer periods of exposure (measured in years)
will be associated with lower self-rated health; furthermore, year-to-year changes in
exposure to work-related insecurity will be inversely related to self-rated health
such that increases in work-related insecurity in a given year will be associated with
health declines.
H5: As a consequence of different patterns of exposure across the occupational
hierarchy, work-related insecurity will account for a higher proportion of the total
variation in self-rated health among workers in low-skill occupations compared to
those in higher-skill occupations, ceteris paribus (all else equal at baseline).
Methods
Data
Data for the present study were drawn from the Canadian Survey of Labour
and Income Dynamics (SLID), a nationally representative longitudinal labor-
market survey comprising 6-year overlapping panels. The sample frame for the
SLID is individuals aged 16 and older who reside in one of the 10 Canadian
provinces. The present study draws from the fourth panel of SLID, which spans
the period 2002 to 2007. In 2002, the response rate for the fourth panel was
Scott-Marshall 7
81.2%, decreasing to 71.6% by 2007. Permission to use this survey was provided
by Statistics Canada, which adheres to strict guidelines of confidentiality and
anonymity for all survey participants.
Each panel comprises approximately 15,000 households. Information is col-
lected annually from all household members, with 1 individual selected for a
more in-depth labor and income interview. The selected individual must provide
detailed information on the characteristics of up to 6 jobs annually. One of the
jobs is identified as the individual’s main job, based on the greatest number of
hours or highest earnings in the reference year. Also collected is sociodemo-
graphic information, income sources and amounts at the individual and family
level, and information on self-reported general health at the time of the survey.
Because the focus of this study is on the health consequences of employment
experiences, a subsample of workers was selected according to indicators of
close ties to the labor market. The sample included only individuals aged
25 to 54 who were not full-time students, were employed full-time for at least
9 months of the year, and were not self-employed in their main job. A final
inclusion criterion required that individuals reported being in good, very good,
or excellent health at the beginning of the year. This “healthy cohort” criterion
helped control for reverse causality, where individuals in poor health are selected
into insecure employment circumstances. The final sample comprised 2,417
individuals across 5 years of observation for a total of 12,085 observations.
Because two of the explanatory variables used in this study derive from infor-
mation collected in the prior survey year, the analysis has been restricted to 5 of
6 panel-years [2003–2007]. All information on employment experiences per-
tained to characteristics of participants’ main job.
Measures
Health. Self-reports of general health are collected annually in the SLID and are
based on a single survey item as follows:
In general, how would you describe your state of health? Would you say it is excellent,
very good, good, fair, or poor?
Responses are scored on a 5-point Likert scale ranging from excellent to poor.
The item was reverse coded such that individuals who reported excellent health
received a score of 5 and those who reported poor health received a score of 1.
This measure of self-reported general health is considered a valid and reliable
measure of acute and chronic conditions, physical functioning, as well as in
some cases, adverse health behaviors and mental health problems.33,34
Occupational status. Nine classifications of occupational status were constructed
using the conceptual mapping of class locations adapted from Wright.6
Survey
8 International Journal of Health Services 0(0)
indicators corresponding to each dimension of work status (i.e., degree of orga-
nizational authority/control and degree of skills/credentials) were used to develop
a hierarchy of occupational positions. The first dimension, degree of organiza-
tional authority/control, was measured using 2 indicators: the job is perceived as
managerial (1 ¼ yes; 0 ¼ no); and the job involves supervising employees
(1 ¼ yes; 0 ¼ no). Response patterns to these indicators produced a job-status
classification comprising 3 ranked categories: managers (highest level of author-
ity); supervisors (mid-level authority); and non-managers (lowest level of author-
ity). Categories were mutually exclusive such that respondents who performed
tasks involving managerial responsibilities were classified as managers even if
they also supervised employees (i.e., job involves supervision of employees ¼ 1).
Supervisors were respondents who indicated that their role involved supervisory
responsibilities but not managerial duties (job perceived as managerial ¼ 0).
Workers who performed tasks that required neither managerial nor supervisory
responsibilities were classified as non-managers.
The second occupational status dimension, degree of skills/credentials, was
constructed using the National Occupational Classification (NOC). The NOC
provides a standardized framework for characterizing relationships among dif-
ferent job categories based on educational requirements (i.e., university-level
training, non-university/postsecondary training, secondary school training,
and no training).35
Using the NOC framework, workers were assigned to 1 of
3 ranked categories according to level of job skill as follows: skilled-expert, semi-
skilled, and low-skilled work.
The final classification sorted participants into 1 of 9 ranked occupational status
categories: (1) worker, low-skilled; (2) worker, semi-skilled; (3) worker, skilled-expert;
(4) supervisor, low-skilled; (5) supervisor, semi-skilled; (6) supervisor, skilled-expert;
(7) manager, low-skilled; (8) manager, semi-skilled; and (9) manager, skilled-expert.
Work-related insecurity. The following 7 measures of work-related insecurity were
constructed using information about the respondent’s main job: earnings
insecurity, earnings mobility insecurity, job mobility insecurity, pension coverage
insecurity, extended health coverage insecurity, union protection insecurity, and
work-life balance insecurity.
Individuals were categorized as exposed to earnings insecurity if their hourly
wage rate fell below Statistics Canada’s average industrial wage for the reference
year (yes ¼ 1; no ¼ 0). The average industrial wage is calculated annually as
mean earnings across all sectors of the Canadian economy. For the 5-year
period between 2003 and 2007, the average industrial wage rates for full-time
permanent employees were as follows: $17.17, $17.68, $18.29, $18.74, $19.48.36
Earnings mobility insecurity was evaluated using annual inflation-adjusted
earnings data. Thresholds were calculated using adjustments provided by the
Consumer Price Index (CPI) with earnings information standardized to 2002
dollars. Respondents whose current year wage rate did not exceed the wage rate
Scott-Marshall 9
from the prior year after adjusting for inflation received a code of 1 for earnings
mobility insecurity, and 0 otherwise.
Workers were considered exposed to job mobility insecurity if they did not
experience an increase in job status during the observation period or if they
experienced a decline in job status. Classifications were based on 2 survey items
that asked respondents whether their job currently involved supervisory or man-
agement responsibilities. In turn, jobs were classified into one of the following
categories: no managerial or supervisory responsibilities, supervisory responsi-
bilities only, or managerial duties. Respondents who indicated either no change
or a negative change in job status (e.g., downward mobility trajectory, such as
from upper to lower management, or the loss of supervisory or managerial
responsibilities) received a code of 1 for job mobility insecurity and 0 otherwise.
Two measures of income protection insecurity, pension coverage insecurity
and extended health coverage insecurity, were each measured by a single item
that asked respondents whether their job provided a retirement pension or
extended health benefits (yes ¼ 1; no ¼ 0). Union protection insecurity was mea-
sured by a single indicator that asked respondents if their job was covered by a
union or collective agreement (yes ¼ 1; no ¼ 0).
A measure of work-life balance insecurity was constructed using the ratio of
paid to unpaid work hours for each respondent. Where the proportion of
unpaid work hours exceeded the average for the sample, respondents were clas-
sified as being exposed to work-life balance insecurity (yes ¼ 1; no ¼ 0).
Two sociodemographic characteristics were also included in the model due to
their potential confounding effects. Gender was measured using female as the
reference category (yes ¼ 1; no ¼ 0). Age bracket in 2002 classified workers into 1
of 3 age categories based on age at baseline (25–34 ¼ 1; 35–44 ¼ 2; 45–54 ¼ 3).
Analysis
The major objective of the analysis in the present study is to evaluate how
changes in exposure to work-related insecurity are systematically related to
changes in individuals’ self-rated health over time. The multilevel growth
model for longitudinal data provides an optimal platform to assess these rela-
tionships since it incorporates a random component that isolates any statistical
noise that might arise from time-specific variance at the individual level. This
partitioning of variance allows the covariates of interest to be more precisely
estimated.37
The linear multilevel model is as follows:
Y ¼ Xb þ Zu þ
X
(1)
where Y is the observed data vector, X is a known design matrix, b is a vector of
unknown fixed effects, Z is a known random-effects design matrix, u is a vector
10 International Journal of Health Services 0(0)
of unknown random (individual-level) effects, and R is a vector of unobserved
random errors.38
The model decomposes into 2 equations at level 1 and level 2,
representing change within and between individuals, respectively.
Level 1 within-person model. The first step in building the multilevel growth model is
to specify the shape of the trajectory for intra-individual change. Change refers to
the underlying trajectory for an individual as a function of time and a set of
growth parameters that define the change function.39
Prior research has shown
that self-rated health behaves as a latent continuous variable with a normal dis-
tribution40,41
; the present study uses a linear function to describe health change
(diagnostics of the linear assumption are available from the author upon request).
Using a single substantive predictor to represent work-related insecurity, the
level 1 within-person model is as follows:
Yij ¼ b0i þ b1iTij þ b2iWRIij þ eij (2)
where i is the index for persons, j is the index for occasions, T is an interval
measure of time (years in this study), and WRI denotes exposure to work-
related insecurity (which varies over time for at least some respondents). The
parameters are interpreted as follows: Yij is the level of self-rated health for indi-
vidual i measured at time j; b0i is the intercept (2002 value) of the health trajectory
for person i; b1i is the slope of the health trajectory for person i; Tij is time at the
jth
measurement for subject i, defined herein as the period in years since 2002 when
self-rated health is first assessed (time 1 ¼ 0); and eij is the time-specific residual
(comprising error in prediction and measurement) for each within-person regres-
sion of health on time. Against the backdrop of the basic time-trend for each
individual, self-rated health also varies as a function of exposure to work-related
insecurity with b2i capturing the magnitude of this relationship.
Level 2 between-persons model. In the multilevel for longitudinal data, the param-
eters from the level 1 (within-person) model become the dependent variables for
the level 2 (between-persons) model. Each parameter can be represented by a
separate equation as follows:
b0i ¼ c00 þ u0i (3)
b1i ¼ c10 þ u1i (4)
b2i ¼ c20 (5)
Equations 3 and 4 depict the average intercept and slope parameters for self-
rated health across all individuals (represented as c00 and c01) plus all individual
Scott-Marshall 11
deviations from the mean values (i.e., the random components, u0i and u1i). The
term u0i denotes random variation across individuals in average self-rated heath
in 2002 (the intercept), and u1i represents unexplained variation in the rate of
change in self-rated health over the trajectory period. On the other hand,
Equation 5 captures the effect of differences in average exposure to work-
related insecurity (expressed as c20). Because the effect of exposure to work-
related insecurity is considered fixed (i.e., in a given year exposure either occurs
or does not occur, and individuals are not subject to randomness in level of
exposure), Equation 5 does not include a summary term for random effects.
Within-person change. An estimate of the health impact of exposure to work-
related insecurity (c20 in Equation 5) represents the combined effect of 2 distinct
sources of variation: (1) inter-individual differences in average level of exposure;
and (2) intra-individual change over time in level of exposure. To obtain sepa-
rate estimates of the variance components, 2 modifications of the preceding
equations are required. First, the values for work-related insecurity (WRI) in
Equation 2 must be transformed into deviations from each individual’s total
average exposure (WRIi) calculated across the 5-year observation period:
WRI
ij ¼ WRIij  WRIi (6)
The WRI*ij parameter is interpreted as the effect of change in exposure to
work-related insecurity relative to an individuals’ total exposure averaged over
5 years.
Second, the individual means for exposure to work-related insecurity (WRIi)
are included as explanatory variables in Equation 3 to represent the effect of
overall differences in exposure on self-rated health over time:
b0i ¼ c00 þ c01WRIi þ u0i (7)
Thus, the time-varying exposures to work-related insecurity have been dis-
tilled into 2 estimable components: a mean that denotes each individual’s level
of exposure to WRI over 5 years (average exposure), and a deviation from the
mean that captures the year-over-year increase or decrease in exposure to WRI
(i.e., within-person change). For example, given a year-over-year exposure pat-
tern for individual “i” of 0, 0, 0, 1, 1, the data can be transformed into 2 distinct
variables: (1) WRIi, with a constant value of 0.4 for the individual (the stable
component); and (2) WRI*ij, which would take on values of 0.4, 0.4, 0.4,
0.6, and 0.6 (the change component). Based on this formulation, c01 represents
the average effect of inter-individual differences in exposure to work-related
insecurity and captures the cumulative effect on health status over time, while
c20 (Equation 5) represents the effect of within-person change.42
12 International Journal of Health Services 0(0)
Maximum efficiency in model estimation is achieved using a reduced-form
equation created by substituting the level 2 equations into the level 1 equation
as follows:
Yij ¼ c00 þ c10Tij þ c20WRIij
 
þ u0i þ u1iTij þ eij
ð Þ (8)
The composite error term (Equation 8) corrects for both autocorrelation and
heteroscedascity arising from multiple measures of the outcome across time.37,42
Statistical tests of u0,i and u1,i indicate whether individual intercepts and slopes
for self-rated health vary significantly from mean values and require addition of
inter-individual predictors to the model to account for these differences.38
In the
present study, the focus is whether differences in exposure to work-related inse-
curity arising from occupational position explain a significant proportion of the
variance in self-rated health outcomes.
Specification for the full-model is as follows:
Level-1 model:
Yij ¼ b0i þ b1i time
ð Þ þ b2i earnings insecurity
ð Þ þ b3i earnings mobility insecurity
ð Þ
þ b4i job mobility insecurity
ð Þ þ b5i pension coverage insecurity
ð Þ
þ b6i extended health coverage insecurity
ð Þ þ b7i union protection insecurity
ð Þ
þ b8i work  life balance insecurity
ð Þ þ eij
Level-2 model:
b0i ¼ c00 þ c01 female
ð Þ þ c02 age group in 2002
ð Þ þ c03 earnings insecurity average
ð Þ
þ c04 earnings mobility insecurity average
ð Þ
þ c05 job mobility insecurity average
ð Þ
þ c06 pension coverage insecurity average
ð Þ
þ c07 extended health coverage insecurity average
ð Þ
þ c08 union protection insecurity average
ð Þ
þ c09 work  life balance insecurity average
ð Þ þ u0i
b1i ¼ c10 þ c11 female
ð Þ þ c12 age group in 2002
ð Þ þ u1i
b2i ¼ c20 earnings insecurity change
ð Þ
b3i ¼ c30 earnings mobility insecurity change
ð Þ
b4i ¼ c40 job mobility insecurity change
ð Þ
b5i ¼ c50 pension coverage insecurity change
ð Þ
b6i ¼ c60 extended health coverage insecurity change
ð Þ
b7i ¼ c70 union protection insecurity change
ð Þ
b8i ¼ c80 work  life balance insecurity change
ð Þ
Scott-Marshall 13
Analyses were stratified by occupational status classification to evaluate dif-
ferences in exposure to work-related insecurity and the impact on self-rated
health across the different occupational groups. Multilevel models were estimat-
ed using SAS Proc Mixed V9.3. Use of a REPEAT statement adjusted for
correlation and non-identicalness of the residuals across multiple observations
on each person.37
Tests of different specifications of the error matrix showed
that an autoregressive structure (AR[1]) best fit the data. The AR(1) residual
matrix introduced an additional parameter, q, to accommodate nonspecific dis-
turbances in each respondent’s underlying self-rated health trajectory.
Population weights were applied to all analyses to adjust for both survey non-
response and unequal probabilities of selection into the survey.
Results
Table 1 presents characteristics of the sample by occupational position. Workers
comprised a majority of the total sample (56.3%). More than 1 in 4 (27.9%)
individuals held management positions, while 15.9% worked in a supervisory
role. A total of 26.9% respondents held jobs that required specialized skills or
training compared to 38.8% and 34.4% who held unskilled and semi-skilled
jobs, respectively. Two in 5 respondents (41.4%) were female, with the highest
percentage (40.3%) in the middle age category (35 to 44). The likelihood of
being employed in skilled work increased with level of managerial authority,
with 51.2% of managers performing skilled jobs compared to less than 1 in 5
workers (17.1%). Occupational stratification by gender and age group was also
evident. Only a third of workers with managerial responsibilities were women,
and less than one-fifth were in the youngest age group (25 to 34).
Table 2 presents average self-rated health in 2002 along with means for dura-
tion of exposure to work-related insecurity by occupational position. For each
job-status group, findings show a predominantly monotonic increase in self-
rated health across increments of job skill. Skilled supervisors reported the
best self-rated health on average (very good range: 4.0–4.9); by contrast, low-
skilled workers had the lowest self-rated health (good range: 3.0–3.9). As
expected, patterns of exposure to work-related insecurity varied across the occu-
pational hierarchy, with individuals in low-skill jobs reporting higher levels of
exposure on average. Compared to skilled managers – the highest status group –
workers who performed low-skill jobs reported 8 times more exposure to
work-life balance insecurity (0.16 years [58.4 days] versus 0.02 years [7.3 days],
respectively). Findings also showed that less skilled workers reported significant-
ly longer periods of exposure to both job mobility insecurity and earnings
insecurity compared to their counterparts in more highly skilled jobs. Among
low-skilled workers, the propensity for exposure to work-related insecurity cut
across the levels of organizational authority with low-skilled managers
experiencing longer periods of earnings mobility insecurity, retirement pension
14 International Journal of Health Services 0(0)
insecurity, and extended health coverage insecurity. By contrast, managers had
significantly greater exposure to union protection insecurity.
Table 3 presents results from the multilevel growth models for change in self-
rated health due to work-related insecurity exposures, stratified by occupational
group. Findings from the cumulative effect model show that, among workers,
exposure to earnings insecurity had an adverse impact on self-rated health for
workers in both low- and semi-skilled jobs. Each additional year of exposure to
Table 1. Sample Characteristics in 2002, SLID Panel 4 (2002–2007).a
Proportion Within
Occupational Group
Proportion of
Total Sample
Workers
Skilled 17.1 9.6
Semi-skilled 32.9 18.5
Unskilled 50.0 28.2
Female 46.7 26.3
Age group
25–34 22.4 12.6
35–44 39.8 22.4
45–54 37.8 21.3
Total 56.3
Supervisors
Skilled 18.8 3.0
Semi-skilled 40.6 6.4
Unskilled 40.6 6.4
Female 37.5 5.9
Age group
25–34 25.0 4.0
35–44 40.3 6.4
45–54 34.7 5.5
Total 15.9
Managers
Skilled 51.2 14.2
Semi-skilled 33.8 9.4
Unskilled 15.0 4.2
Female 32.8 9.1
Age group
25–34 18.5 5.2
35–44 41.4 11.5
45–54 40.1 11.2
Total 27.9
a
Weighted percentages; total n ¼ 2,417.
Scott-Marshall 15
Table
2.
Average
SRH
in
2002
and
Duration
of
Exposure
in
Years
to
Work-Related
Insecurity
by
Occupational
Position,
2003–
2007
(n
¼
2,417).
SRH
Earnings
Insecurity
SD
Earnings
Mobility
Insecurity
SD
Job
Mobility
Insecurity
SD
Pension
Coverage
Insecurity
SD
Extended
Health
Coverage
Insecurity
SD
Union
Coverage
Insecurity
SD
Work–Life
Balance
Insecurity
SD
Workers
Skilled
4.18
0.35
1.06
2.37
1.26
3.76
1.51
0.67
1.41
0.16
0.52
1.68
2.29
0.08
0.35
Semi-skilled
4.13
1.16
1.89
2.64
1.07
4.12
1.33
1.47
2.10
0.64
1.37
2.33
2.43
0.08
0.36
Unskilled
3.91
2.61
2.26
2.76
1.15
4.36
1.15
1.66
2.08
0.66
1.38
2.18
2.39
0.16
0.51
Supervisors
Skilled
4.48
0.49
1.37
2.03
1.11
3.83
1.60
0.80
1.70
0.45
1.19
1.76
2.27
0.04
0.19
Semi-skilled
4.18
1.11
1.94
2.62
1.11
3.91
1.49
1.98
2.30
1.02
1.76
3.00
2.34
0.07
0.35
Unskilled
4.10
1.97
2.25
2.67
1.11
4.30
1.24
1.76
2.12
0.63
1.37
2.96
2.41
0.13
0.48
Managers
Skilled
4.28
0.28
1.06
2.26
1.09
3.98
1.54
1.39
2.00
0.33
0.97
4.12
1.73
0.02
0.18
Semi-skilled
4.14
1.11
1.93
2.77
1.26
4.28
1.25
1.59
2.15
0.70
1.49
3.69
2.09
0.11
0.50
Unskilled
4.07
1.98
2.14
2.81
1.41
4.24
1.41
2.26
2.19
0.89
1.61
3.66
2.14
0.08
0.36
Abbreviations:
SD,
standard
deviation;
SRH,
self-rated
health.
16
Table
3.
Growth
Models
of
the
Effect
of
Work-Related
Insecurity
on
Self-Rated
Health
by
Occupational
Position,
2003–2007
(N
¼
2,417).
Fixed
Effects
Workers
Low-Skill
S.E.
Workers
Semi-
Skilled
S.E.
Workers
Skilled
S.E.
Supervisors
Low-Skill
S.E.
Supervisors
Semi-Skilled
S.E.
Supervisors
Skilled
S.E.
Managers
Low-Skill
S.E.
Managers
Semi-
Skilled
S.E.
Managers
Skilled
S.E.
For
Initial
Status,
b0,i
Intercept,
c00
4.208
0.151**
4.331
0.169**
4.338
0.188**
4.471
0.312**
4.114
0.277**
4.257
0.423**
4.106
0.423**
4.593
0.239**
4.497
0.188**
Female,
c01
0.038
0.061
0.048
0.076
0.076
0.095
0.150
0.127
0.019
0.125
0.059
0.189
0.021
0.183
0.150
0.107
0.121
0.079
Age
group
in
2002,
c02
0.159
0.042**
0.057
0.050
0.092
0.062
0.085
0.085
0.016
0.083
0.234
0.133
0.050
0.133
0.167
0.068*
0.026
0.052
Earnings
insecurity
aver-
age,
c03
0.208
0.064**
0.287
0.091**
0.031
0.167
0.111
0.131
0.075
0.152
0.397
0.362
0.007
0.203
0.020
0.111
0.084
0.129
Earnings
mobility
insecu-
rity
average,
c04
0.144
0.110
0.091
0.141
0.145
0.157
0.027
0.246
0.092
0.244
0.236
0.354
0.177
0.280
0.082
0.170
0.337
0.137**
Job
mobility
insecurity
average,
c05
0.142
0.110
0.154
0.116
0.005
0.126
0.292
0.225
0.073
0.179
0.351
0.275
0.213
0.317
0.256
0.160
0.056
0.097
Pension
coverage
insecu-
rity
average,
c06
0.043
0.082
0.028
0.103
0.027
0.149
0.057
0.165
0.274
0.164
0.106
0.324
0.174
0.238
0.041
0.121
0.039
0.088
Extended
health
cover-
age
insecurity
aver-
age,
c07
0.008
0.105
0.048
0.135
0.005
0.297
0.114
0.223
0.349
0.204
0.406
0.611
0.007
0.284
0.150
0.176
0.224
0.165
Union
protection
insecu-
rity
average,
c08
0.027
0.061
0.061
0.080
0.008
0.098
0.102
0.130
0.131
0.127
0.494
0.255*
0.049
0.204
0.142
0.106
0.098
0.088
Work-life
balance
inse-
curity
average,
c09
0.552
0.238*
0.110
0.341
0.825
0.548
0.552
0.682
1.423
0.661*
1.189
2.417
0.353
0.944
0.639
0.161
0.613
0.685
For
Linear
Change,
b1,i
Intercept,
c10
0.053
0.030
0.023
0.033
0.021
0.046
0.026
0.050
0.078
0.048
0.005
0.082
0.002
0.078
0.094
0.047*
0.068
0.039
Female,
c11
0.013
0.018
0.079
0.021**
0.011
0.029
0.014
0.033
0.001
0.033
0.011
0.053
0.021
0.045
0.020
0.032
0.040
0.025
Age
group
in
2002,
c12
0.002
0.012
0.031
0.014*
0.015
0.019
0.041
0.022
0.057
0.020**
0.023
0.035
0.029
0.032
0.016
0.020
0.044
0.016**
Earnings
insecurity
change,
c20
0.033
0.053
0.107
0.064
0.001
0.117
0.217
0.107*
0.062
0.131
0.053
0.269
0.056
0.116
0.008
0.111
0.134
0.141
Earnings
mobility
insecu-
rity
change,
c30
0.073
0.025**
0.006
0.026
0.026
0.037
0.007
0.045
0.051
0.044
0.022
0.069
0.014
0.066
0.031
0.039
0.028
0.029
Job
mobility
insecurity
change,
c40
0.042
0.046
0.011
0.043
0.064
0.052
0.097
0.082
0.179
0.072*
0.012
0.117
0.229
0.122*
0.037
0.070
0.090
0.051
(continued)
Table
3.
Continued.
Fixed
Effects
Workers
Low-Skill
S.E.
Workers
Semi-
Skilled
S.E.
Workers
Skilled
S.E.
Supervisors
Low-Skill
S.E.
Supervisors
Semi-Skilled
S.E.
Supervisors
Skilled
S.E.
Managers
Low-Skill
S.E.
Managers
Semi-
Skilled
S.E.
Managers
Skilled
S.E.
Pension
coverage
insecu-
rity
change,
c50
0.091
0.050
0.043
0.067
0.106
0.083
0.064
0.092
0.111
0.115
0.316
0.214
0.050
0.115
0.054
0.094
0.004
0.065
Extended
health
cover-
age
insecurity
change,
c60
0.051
0.055
0.061
0.063
0.045
0.109
0.218
0.106*
0.048
0.100
0.022
0.183
0.013
0.128
0.089
0.090
0.106
0.083
Union
protection
insecu-
rity
change,
c70
0.011
0.082
0.283
0.109**
0.107
0.140
0.055
0.196
0.360
0.135**
0.144
0.219
0.091
0.220
0.102
0.132
0.043
0.086
Work-life
balance
inse-
curity
change,
c80
0.209
0.076**
0.074
0.117
0.078
0.164
0.211
0.150
0.134
0.194
0.138
0.375
0.099
0.238
0.289
0.149*
0.052
0.238
Random
effect
Initial
Status,
u0i
0.342
0.030**
0.405
0.037**
0.318
0.045**
0.396
0.064**
0.319
0.058**
0.404
0.105**
0.532
0.106**
0.314
0.044**
0.275
0.035**
Linear
Change,
u1i
0.016
0.002**
0.019
0.003**
0.021
0.004**
0.014
0.004**
0.007
0.004*
0.015
0.007*
0.019
0.006**
0.017
0.004**
0.017
0.003**
Goodness
of
Fit
Deviance
7956.2
5457.8
2972.3
1796.1
1767.7
995.4
1119.9
2628.1
3804.7
AIC
7966.2
5467.8
2982.3
1806.1
1777.7
1005.4
1129.9
2638.1
3814.7
*P
.05;
**P
.01
Abbreviation:
AIC,
Akaike
information
criterion.
earnings insecurity produced an average decline in self-rated health of 25%
([0.21/0.85]  100]) and 34% ([0.29/0.85]  100) among low- and semi-
skilled workers, respectively, where 0.85 represents the standard deviation of
self-rated health in 2002. Moreover, for low-skilled workers, each annual incre-
ment of exposure to work-life balance insecurity was associated with a 65%
decline in self-rated health ([0.55/0.85]  100). Coefficients from the model
for linear change show that low-skilled workers were also adversely affected
by the onset of exposure to work-life balance insecurity, with increases in expo-
sure to this variable associated with a 25% decline in self-rated health ([0.21/
0.85]  100). By contrast, among semi-skilled workers, increases in exposure to
union protection insecurity were associated with a 33% increase in self-rated
health ([0.28/0.85]  100).
Among supervisory employees, findings from the cumulative impact model
show that increased exposure to union protection insecurity gives rise to substan-
tial declines in self-rated health in the skilled group ([0.49/0.80]  100 ¼ 61%
per year of exposure). Results from the model for linear change show that
individuals in low-skill jobs are significantly impacted by yearly changes in
both earnings insecurity and health coverage insecurity, although the effects
were not in the expected direction, with increases in both types of insecurity
giving rise to health improvements. In contrast, semi-skilled supervisors were
adversely affected by increased exposure to job mobility insecurity and union
protection insecurity, which produced declines in self-rated health of 23% and
45%, respectively.
Among managers, results from the cumulative impact model show that
longer periods of exposure to earnings mobility insecurity reduced self-rated
health among skilled managers by 49% each year ([0.34/0.70]
 100 ¼ 49%). In addition, findings from the model for linear health change
indicate that the health of low-skilled managers is adversely affected by changes
in job mobility insecurity in a given year ([0.23/0.70]  100 ¼ 33%).
Tests of the total percentage of variation in self-rated health accounted for by
the statistical model were performed for each occupational status group. In the
multilevel model for change, the pseudo-R2
statistic gives the proportional
reduction in level 2 variance from the addition of each of the covariates.
Total outcome variation is partitioned into separate variance components at
level 2, r2
0, and r2
1, used to estimate variation in both initial health status and
rate of health change.37
For parsimony, respondents were pooled across skill
levels to yield a single model for each occupational group (i.e., workers, super-
visors, and managers). Based on the difference in total variation explained by
the unconditional model compared to the fully specified model including all
predictors, the pseudo-R2
statistic was calculated as follows:
[r2
(unconditional growth model)  r2
(conditional growth model)]/r2
(uncondi-
tional growth model)
Scott-Marshall 19
Findings show that the level 2 work-related insecurity predictors accounted
for twice the variance in workers’ initial self-rated health compared to super-
visors and managers (6% compared to 3% for each of the latter groups, respec-
tively). For rate of change in health, work-related insecurity accounted for 9%
of the variance in self-rated health trajectories for each of the non-managerial
groups (both workers and supervisors) compared to just 3% for manageri-
al employees.
Discussion
This study investigated patterns of exposure to work-related insecurity across
the occupational hierarchy and its impact on workers’ health over time.
Drawing on a conceptual mapping of class developed by Wright6
and a frame-
work that presents work-related insecurity as a foundational feature of the
contemporary employment relationship,1,5
this study sought to investigate the
extent to which occupational gradients in health outcomes arise from differences
in exposure and vulnerability to work-related insecurity.
Findings from descriptive analyses largely support hypotheses 1 and 2, which
proposed that workers in low-authority, low-skill jobs would have higher
exposure to work-related insecurity than their counterparts in high-authority,
high-skill jobs. Also, in support of hypothesis 3, the analysis showed a mono-
tonic increase in exposure to work-related insecurity across the occupational
hierarchy from low-skill, low-authority jobs to high-skill, high-authority jobs.
One exception was among managerial employees, who reported longer periods
of exposure to union protection insecurity compared to their counterparts in non-
managerial positions. Prior studies have reported similar findings,5,43
which are
likely attributable to the fact that managerial employees are mostly excluded
from collective agreements.
Results from the multilevel growth models provided some support for
hypothesis 4. Aspects of work-related insecurity predictive of self-rated health
outcomes were as follows: work-life balance insecurity, earnings insecurity,
earnings-mobility insecurity, job-mobility insecurity, and union protection insecu-
rity, although the significance, magnitude, and direction of the effect varied by
occupational group. Results from the cumulative impact model show associa-
tions in the expected direction (i.e., a negative impact on self-rated health) for
exposure to earnings insecurity (among low- and semi-skilled workers); work-life
balance insecurity (low-skill workers); union protection insecurity (skilled super-
visory workers); and job-mobility insecurity (skilled managers). The effect of
unpaid overtime hours on low-skilled workers was particularly adverse, with
this group experiencing a 66% decline in self-rated health each year of exposure.
This finding dovetails other studies that demonstrate the vulnerability of low-
skilled workers to violations of employment standards particularly with respect
to uncompensated work and overtime hours.44,45
20 International Journal of Health Services 0(0)
The model for linear change revealed a negative association between self-rated
health and year-to-year increases in work-life balance insecurity (low-skill work-
ers), job mobility insecurity, union protection insecurity (semi-skilled supervisors),
and job mobility insecurity (low-skill managers). The adverse effect of a lack of job
advancement among supervisory and managerial employees corroborates prior
studies that show that economic pressures on organizations to restructure or de-
layer hierarchies can result in job and status losses in these groups.46,47
Some of the findings from the analysis were counterintuitive and warrant
discussion. First, semi-skilled workers who experienced a loss in union protec-
tion – due to reasons such as job change or a lapse in collective agreement –
reported improvements in self-rated health on average. In addition, low-skilled
supervisory employees reported increases in self-rated health subsequent to
losses in earnings security or extended health coverage. This finding may
be explained, in part, by prior work that has demonstrated that exposure to
short-term stressors can actually boost immune system function and enhance
adaptive coping behaviors.48,49
While this evidence appears to contradict studies
that demonstrate an association between chronic stress and disorders of emo-
tional and psychological health, and pathophysiology via neural, cardiovascu-
lar, autonomic, immune, and metabolic systems,48
it is possible that for some
workers certain changes in job circumstances are associated with a temporary
increase in psychological adaptivity and well-being that manifest in positive,
ephemeral changes in self-rated health. A better understanding of these relation-
ships requires further research into the perceptions of workers who experience
work-related insecurity to evaluate how the onset of certain aspects of insecurity
might impact self-rated health in the short-term.
Hypothesis 5 stated that different patterns of exposure to work-related
insecurity across occupational status groups would give rise to differences in
the proportion of variance explained by the fully specified model. Calculation of
the pseudo-R2
statistic for the multilevel models found that exposures to work-
related insecurity accounted for twice the amount of variation in initial self-
rated health for workers compared to both supervisors and managers. The
model for linear change showed that the addition of the level 2 work-related
insecurity covariates improved the predictive ability of the model to 9% for both
workers and supervisors compared to just 3% in the managerial group. These
findings are consistent with the central proposition of the present study, which
states that occupational gradients in health are due in part to differences in
exposure to work-related insecurity across the occupational status hierarchy.
The strength of the study’s method lends credence to its findings. The dura-
tion of the panel coupled with the detailed inquiry into labor-market experiences
provided a rich data source for addressing the research questions. In addition,
the application of multiple methods to control for reverse causality provides
greater confidence that the results are not attributable to the selection of
unhealthy individuals into insecure work experiences. In particular, the
Scott-Marshall 21
temporal separation of the explanatory variables from the outcome measure
represents a substantial advancement compared to studies that rely on a
cross-sectional approach.
Two limitations of this study may contribute to the modest evidence found in
support of the hypotheses. One limitation is that measures of work-related inse-
curity lacked information on individuals’ perceptions of their work circumstan-
ces. As work-related insecurity is conceived as a stressor, a central element of the
stress experience is the meaning individuals ascribe to events that precipitates
stress reactivity. It is possible that mitigating factors could render some individ-
uals mostly inured to precarious work circumstances; for example, familial
wealth may sufficiently underwrite the financial risks typically associated with
low-wage, insecure work.
Future investigations into the health impacts of work-related insecurity
should account for both the structural elements that make up job quality as
well as individuals’ perceptions of these elements based on their personal cir-
cumstances. Such an approach could provide a broader, “person-in-context”50
representation of the nature and consequences of employment experiences.
A second limitation of the present study is that the data source lacks indicators
of mental and emotional health and well-being, such as depression, self-esteem,
and job satisfaction. These measures have been found to be more highly – or at
least more immediately – affected by work experiences than physical health.25
Limitations notwithstanding, the present study contributes to a growing body
of evidence that demonstrates the adverse effects of insecure work experiences on
health. A key contribution from this study is the finding that work-related inse-
curity constitutes a significant health risk across the full spectrum of work
arrangements, including employees who work under contracts that are nominally
secure. Furthermore, by demonstrating that exposure and vulnerability to work-
related insecurity is shaped by occupational position, the study provides another
layer of evidence to the social patterning of adverse employment experiences
which shows that work stressors are distributed according to the major axes of
social stratification (i.e., age, gender, race, and socioeconomic class).1,4,29
Going
forward, the development of effective health promotion interventions that can
modify work-related health gradients must work to mitigate the risk of exposure
to adverse work circumstances that is systemic to occupational hierarchies.
Acknowledgments
The author wishes to acknowledge Ontario’s Institute for Work  Health for its assis-
tance with access to the datasource used in this project.
Declaration of Conflicting Interests
The author declared no potential conflicts of interest with respect to the research, author-
ship, and/or publication of this article.
22 International Journal of Health Services 0(0)
Funding
The author received no financial support for the research, authorship, and/or publication
of this article.
ORCID iD
Heather Scott-Marshall http://orcid.org/0000-0003-3186-3987
References
1. Scott-Marshall H. The social patterning of work-related insecurity and its health
consequences. Social Indic Res. 2010; 96: 313–337.
2. McDonough P, Walters V, Strohschein L. Chronic stress and the social patterning of
women’s health in Canada. Soc Sci Med. 2002; 54: 767–782.
3. Borrell C, Muntaner C, Benach J, Artazcoz L. Social class and self-reported
health status among men and women: what is the role of work organisation,
household material standards and household labour? Soc Sci Med. 2004;
58: 1869–1887.
4. Muntaner C, Borrell C, Sola J, et al. Capitalists, managers, professionals and mor-
tality: findings from the Barcelona social class and all cause mortality longitudinal
study. Scand J Public Health. 2009; 37: 826–838.
5. Scott-Marshall H. Work-related insecurity in the new economy: evaluating the con-
sequences for health. Res Polit Sociol. 2007; 16: 21–60.
6. Wright EO. Class Counts: Comparative Studies in Class Analysis. Cambridge,
England: Cambridge University Press; 2000.
7. Rubin BA. Shifts in the Social Contract: Understanding Change in American Society.
Thousand Oaks, CA: Pine Forge Press; 1996.
8. Osterman P. Securing Prosperity – The American Labour Market: How It Has
Changed And What To Do About It. Princeton, NJ: Princeton University Press; 1999.
9. Palmer BD. Working-Class Experience: Rethinking the History of Canadian Labour.
Toronto, Canada: McClelland  Stewart Inc.; 1992.
10. Statistics Canada. Table 14100041. Labour force survey estimates (LFS), by actual
hours worked, class of worker, National Occupational Classification for Statistics
(NOC-S) and sex, annual. 2018.
11. Statistics Canada. Table 14100029 – Part-time employment by reason, annual; 2018
12. Statistics Canada. Table 14100072 – Job permanency (permanent and temporary) by
industry, annual; 2018
13. Statistics Canada. Table 1410010301 – Average full-time hourly wage paid and pay-
roll employment by type of work, industry and occupation; 2016.
14. Statistics Canada. Wages by occupation. The Daily. June 15, 2016. https://www150.
statcan.gc.ca/n1/daily-quotidien/180626/dq180626a-eng.htm
15. Bidwell M, Briscoe F, Fernandez-Mateo I, Sterling A. The employment relationship
and inequality: how and why changes in employment practices are reshaping rewards
in organizations. Acad Manage Ann. 2017; 7(1): 61–121.
16. Drolet M, Morisette R. New Facts on Pension Coverage in Canada. Ottawa, Canada:
Statistics Canada; 2014. https://www150.statcan.gc.ca/n1/pub/75-006-x/2014001/arti
cle/14120-eng.htm
Scott-Marshall 23
17. Barnes S, Abban V, Weiss A. Low Wages, No Benefits: Expanding Access to Health
Benefits for Low Income Ontarians. Toronto, Canada: The Wellesley Institute; 2015.
18. Stewart N. Benefits Benchmarking Survey. Ottawa, Canada: The Conference Board
of Canada; 2015.
19. Statistics Canada. Unionization rates falling. The Daily. September 2016. https://
www150.statcan.gc.ca/n1/pub/11-630-x/11-630-x2015005-eng.htm
20. Western B, Rosenfeld J. Unions, norms and the rise in US wage inequality. Am Soc
Rev. 2011; 76(4): 513–537.
21. Scott-Marshall H, Tompa E. The health consequences of precarious employment
experiences. Work. 2011; 38: 369–382.
22. Kelliher C, Anderson D. Doing more with less? Flexible working practices and the
intensification of work. Hum Relat. 2010; 63(1): 83–106.
23. Angus Reid Institute. Overtime Among Canadian Employees. Vancouver, Canada:
Angus Reid Institute; 2015.
24. Statistics Canada. Average Weekly Hours of Overtime Worked by Employees in
Canada in 2017, By Permanent Status. Ottawa, Canada: Statistics Canada; 2017.
25. Sverke M, Hellgren J, Naswall K. No security: a meta-analysis and review of job
insecurity and its consequences. J Occup Health Psychol. 2002; 7: 242–264.
26. Lászl
oa KD, Pikhart H, Kopp MS, et al. Job insecurity and health: a study of 16
European countries. Soc Sci Med. 2010; 70(6): 867–874.
27. Marmot M, Ferrie J, Newman K, Stansfeld S. The Contribution of Job Insecurity to Socio-
Economic Inequalities. Lancaster, England: Economic  Social Research Council; 2001.
28. Ferrie J, Shipley M, Stansfeld S, Davey Smith G, Marmot M. Future uncertainty and
socio-economic inequalities in health: the Whitehall II study. Soc Sci Med. 2003;
57(4): 637–646.
29. Scott-Marshall H, Tompa E, Trevithick S. The social patterning of underemploy-
ment and its health consequences. Int J Contemp Sociol. 2007; 44(1): 7–34.
30. Turner RJ, Avison WR. Status variations in stress exposure: implications for the
interpretation of research on race, socioeconomic status, and gender. J Health Soc
Behav. 2003; 44(4): 488–505.
31. Marmot M, Stansfeld S, Patel C, et al. Health inequalities among British civil serv-
ants: the Whitehall II study. Lancet. 1991; 337(8754): 1387–1393.
32. Ferrie J, Shipley M, Newman K, Stansfeld S, Marmot M. Self-reported job insecurity
and health in the Whitehall II study: potential explanations of the relationship. Soc
Sci Med. 2004; 60(7): 1593–1602.
33. Cott CA, Gignac MA, Badley EM. Determinants of self-rated health for Canadians
with chronic disease and disability. J Epidemiol Commun Health. 1999; 53: 731–736.
34. Krause NM, Jay GM. What do global self-rated health items measure? Med Care.
1994; 32: 930–942.
35. Human Resources Development Canada. National Occupational Classification.
http://www23.hrdc-drhc.gc.ca/2001/e/tutorial/intro.shtml. Published 2001. Accessed
February 9, 2019.
36. Statistics Canada. Table 14100063 - Employee wages by industry, monthly, unad-
justed for seasonality, monthly; 2018.
37. Singer JD, Willett JB. Applied Longitudinal Data Analysis. New York, NY: Oxford
University Press; 2003.
24 International Journal of Health Services 0(0)
38. Diggle PJ, Heagerty P, Liang K, Zeger SL. Analysis of Longitudinal Data. Oxford,
England: Oxford University Press; 2002.
39. Collins LM, Sayer AG. Modeling growth and change processes: design measurement,
and analysis for research in social psychology. In: HT Reis, CM Judd, eds. Handbook
of Research Methods in Social and Personality Psychology. Cambridge, England:
Cambridge University Press; 2000.
40. McDonough P, Berglund P. Histories of poverty and self-rated health trajectories.
J Health Soc Behav. 2003; 44(2): 198–214.
41. Crossley TF, Kennedy S. The reliability of self-assessed health status. J. Health Econ.
2002; 21(4): 643–658.
42. Horney J, Osgoode W, Marshall IH. Criminal careers in the short-term: Intra-indi-
vudal variability in crime and its relation to local life circumstances. Am Soc Rev.
1995; 60(5): 655–673.
43. Tompa E, Scott-Marshall H, Fang M. The impact of temporary employment and job
tenure on work-related sickness absence. Occup Environ Med. 2008; 65(12): 801–807.
44. Gallatly M. Unpaid Wages, Unprotected Workers: A Survey of Employment
Standards Violations. Ontario, Canada: Workers’ Action Centre 2011.
45. Delp L, Wallace SP, Geiger-Brown J, Muntaner C. Job stress and job satisfaction: home
care workers in a consumer-directed model of care. Health Serv Res. 2010; 45(4): 922–940.
46. Thomas R, Dunkerly D. Careering downwards? Middle managers’ experiences in the
downsized organization. Br J Manage. 2002; 10(2): 157–169.
47. McCann L, Hassard J, Morris J. Restructuring of managerial labour in the USA, the
UK and Japan: challenging the salience of ‘varieties of capitalism’. Br J Indus Relat.
2010; 48(2): 347–374.
48. McEwan BS. Central effects of stress hormones in health and disease: understanding
the protective and damaging effects of stress and stress mediators. Eur J Pharmacol.
2008; 583(2–3): 174–185.
49. Mohd RS. Life events, stress and health. Malays J Med Sci. 2008; 15(4): 9–18.
50. Tompa E, Scott-Marshall H, Dolinschi R, Trevithick S, Bhattacharyya S. Precarious
employment experiences and their health consequences: towards a theoretical frame-
work. Work. 2007; 28(3): 209–224.
Author Biography
Heather Scott-Marshall holds a PhD in public health sciences from the
University of Toronto. Her background is in the political economy of occupa-
tional health with a focus on the health consequences of precarious employment
experiences. She has published several articles on changes to work arising from
economic globalization and the consequences for worker well-being. She has
held positions as postdoctoral fellow at the Social Sciences and Humanities
Research Council and associate scientist at Ontario’s Institute for Work and
Health. She currently holds an appointment as adjunct professor in the Dalla
Lana School of Public Health, Social and Behavioural Sciences Division, at the
University of Toronto. She is also the president of Mission Research, a market
research firm located in Toronto that provides a range of research services to
clients in the public, private, and not-for-profit sectors.
Scott-Marshall 25

More Related Content

Similar to seguridad .pdf

14 - Population projections revisited, part 3 (2015) (ENG)
14 - Population projections revisited, part 3 (2015) (ENG)14 - Population projections revisited, part 3 (2015) (ENG)
14 - Population projections revisited, part 3 (2015) (ENG)InstitutoBBVAdePensiones
 
Writing Sample - Honors Thesis
Writing Sample - Honors ThesisWriting Sample - Honors Thesis
Writing Sample - Honors ThesisJonathan Chernov
 
CBIZ Quarterly Manufacturing and Distribution "Hot Topics" Newsletter (May-Ju...
CBIZ Quarterly Manufacturing and Distribution "Hot Topics" Newsletter (May-Ju...CBIZ Quarterly Manufacturing and Distribution "Hot Topics" Newsletter (May-Ju...
CBIZ Quarterly Manufacturing and Distribution "Hot Topics" Newsletter (May-Ju...CBIZ, Inc.
 
J_Wojcikowski_TeamB_HCA_Healthcare_Industry_Labor_Employment_Analysis_Researc...
J_Wojcikowski_TeamB_HCA_Healthcare_Industry_Labor_Employment_Analysis_Researc...J_Wojcikowski_TeamB_HCA_Healthcare_Industry_Labor_Employment_Analysis_Researc...
J_Wojcikowski_TeamB_HCA_Healthcare_Industry_Labor_Employment_Analysis_Researc...Jared Wojcikowski
 
What makes you work while you are sick? Evidence from a survey of union members
What makes you work while you are sick? Evidence from a survey of union membersWhat makes you work while you are sick? Evidence from a survey of union members
What makes you work while you are sick? Evidence from a survey of union membersPalkansaajien tutkimuslaitos
 
The link-between-workforce-health-safety-and-the-health-of-the-bottom-...
The link-between-workforce-health-safety-and-the-health-of-the-bottom-...The link-between-workforce-health-safety-and-the-health-of-the-bottom-...
The link-between-workforce-health-safety-and-the-health-of-the-bottom-...Examinetics
 
Cost of Health Insurance Tops Employers’ Concerns, November 1, 2010
Cost of Health Insurance Tops Employers’ Concerns, November 1, 2010Cost of Health Insurance Tops Employers’ Concerns, November 1, 2010
Cost of Health Insurance Tops Employers’ Concerns, November 1, 2010Employers Association of New Jersey
 
HR Trends And Challenges Presentation
HR Trends And Challenges PresentationHR Trends And Challenges Presentation
HR Trends And Challenges PresentationBenet Heames
 
unemployment in spain, causes and remedies .pptx
unemployment in spain, causes and remedies .pptxunemployment in spain, causes and remedies .pptx
unemployment in spain, causes and remedies .pptxMgirehBryan
 
INFORMATION TECHNOLOGY, PRODUCTIVITYGROWTH, AND REDUCED LEIS.docx
INFORMATION TECHNOLOGY, PRODUCTIVITYGROWTH, AND REDUCED LEIS.docxINFORMATION TECHNOLOGY, PRODUCTIVITYGROWTH, AND REDUCED LEIS.docx
INFORMATION TECHNOLOGY, PRODUCTIVITYGROWTH, AND REDUCED LEIS.docxdirkrplav
 
health-on-demand-report pdf relatório saúde 2023
health-on-demand-report pdf relatório saúde 2023health-on-demand-report pdf relatório saúde 2023
health-on-demand-report pdf relatório saúde 2023InesLourenco6
 
Trends in the Health Care ScenePrepared by Altonice Cox1.docx
Trends in the Health Care ScenePrepared by Altonice Cox1.docxTrends in the Health Care ScenePrepared by Altonice Cox1.docx
Trends in the Health Care ScenePrepared by Altonice Cox1.docxjuliennehar
 
industrial psychology , employee health and well being
industrial psychology , employee health and well being industrial psychology , employee health and well being
industrial psychology , employee health and well being Preeti Bhaskar
 
Human Resources Challenges July 2010
Human Resources Challenges July 2010Human Resources Challenges July 2010
Human Resources Challenges July 2010atkinr1
 
Cea Health Care Report
Cea Health Care ReportCea Health Care Report
Cea Health Care Reportguesta138c59
 
Cea Health Care Report
Cea Health Care ReportCea Health Care Report
Cea Health Care ReportDocJess
 
Workplaceforecast
WorkplaceforecastWorkplaceforecast
WorkplaceforecastAnaSaeeda
 
1 3Project ProposalRigina CochranMPA593August 12, 2.docx
1     3Project ProposalRigina CochranMPA593August 12, 2.docx1     3Project ProposalRigina CochranMPA593August 12, 2.docx
1 3Project ProposalRigina CochranMPA593August 12, 2.docxsmithhedwards48727
 
People at Work 2022: A Global Workforce View" del ADP Research Institute
People at Work 2022: A Global Workforce View" del ADP Research InstitutePeople at Work 2022: A Global Workforce View" del ADP Research Institute
People at Work 2022: A Global Workforce View" del ADP Research InstituteAproximacionAlFuturo
 

Similar to seguridad .pdf (20)

14 - Population projections revisited, part 3 (2015) (ENG)
14 - Population projections revisited, part 3 (2015) (ENG)14 - Population projections revisited, part 3 (2015) (ENG)
14 - Population projections revisited, part 3 (2015) (ENG)
 
Writing Sample - Honors Thesis
Writing Sample - Honors ThesisWriting Sample - Honors Thesis
Writing Sample - Honors Thesis
 
CBIZ Quarterly Manufacturing and Distribution "Hot Topics" Newsletter (May-Ju...
CBIZ Quarterly Manufacturing and Distribution "Hot Topics" Newsletter (May-Ju...CBIZ Quarterly Manufacturing and Distribution "Hot Topics" Newsletter (May-Ju...
CBIZ Quarterly Manufacturing and Distribution "Hot Topics" Newsletter (May-Ju...
 
J_Wojcikowski_TeamB_HCA_Healthcare_Industry_Labor_Employment_Analysis_Researc...
J_Wojcikowski_TeamB_HCA_Healthcare_Industry_Labor_Employment_Analysis_Researc...J_Wojcikowski_TeamB_HCA_Healthcare_Industry_Labor_Employment_Analysis_Researc...
J_Wojcikowski_TeamB_HCA_Healthcare_Industry_Labor_Employment_Analysis_Researc...
 
What makes you work while you are sick? Evidence from a survey of union members
What makes you work while you are sick? Evidence from a survey of union membersWhat makes you work while you are sick? Evidence from a survey of union members
What makes you work while you are sick? Evidence from a survey of union members
 
January2012
January2012January2012
January2012
 
The link-between-workforce-health-safety-and-the-health-of-the-bottom-...
The link-between-workforce-health-safety-and-the-health-of-the-bottom-...The link-between-workforce-health-safety-and-the-health-of-the-bottom-...
The link-between-workforce-health-safety-and-the-health-of-the-bottom-...
 
Cost of Health Insurance Tops Employers’ Concerns, November 1, 2010
Cost of Health Insurance Tops Employers’ Concerns, November 1, 2010Cost of Health Insurance Tops Employers’ Concerns, November 1, 2010
Cost of Health Insurance Tops Employers’ Concerns, November 1, 2010
 
HR Trends And Challenges Presentation
HR Trends And Challenges PresentationHR Trends And Challenges Presentation
HR Trends And Challenges Presentation
 
unemployment in spain, causes and remedies .pptx
unemployment in spain, causes and remedies .pptxunemployment in spain, causes and remedies .pptx
unemployment in spain, causes and remedies .pptx
 
INFORMATION TECHNOLOGY, PRODUCTIVITYGROWTH, AND REDUCED LEIS.docx
INFORMATION TECHNOLOGY, PRODUCTIVITYGROWTH, AND REDUCED LEIS.docxINFORMATION TECHNOLOGY, PRODUCTIVITYGROWTH, AND REDUCED LEIS.docx
INFORMATION TECHNOLOGY, PRODUCTIVITYGROWTH, AND REDUCED LEIS.docx
 
health-on-demand-report pdf relatório saúde 2023
health-on-demand-report pdf relatório saúde 2023health-on-demand-report pdf relatório saúde 2023
health-on-demand-report pdf relatório saúde 2023
 
Trends in the Health Care ScenePrepared by Altonice Cox1.docx
Trends in the Health Care ScenePrepared by Altonice Cox1.docxTrends in the Health Care ScenePrepared by Altonice Cox1.docx
Trends in the Health Care ScenePrepared by Altonice Cox1.docx
 
industrial psychology , employee health and well being
industrial psychology , employee health and well being industrial psychology , employee health and well being
industrial psychology , employee health and well being
 
Human Resources Challenges July 2010
Human Resources Challenges July 2010Human Resources Challenges July 2010
Human Resources Challenges July 2010
 
Cea Health Care Report
Cea Health Care ReportCea Health Care Report
Cea Health Care Report
 
Cea Health Care Report
Cea Health Care ReportCea Health Care Report
Cea Health Care Report
 
Workplaceforecast
WorkplaceforecastWorkplaceforecast
Workplaceforecast
 
1 3Project ProposalRigina CochranMPA593August 12, 2.docx
1     3Project ProposalRigina CochranMPA593August 12, 2.docx1     3Project ProposalRigina CochranMPA593August 12, 2.docx
1 3Project ProposalRigina CochranMPA593August 12, 2.docx
 
People at Work 2022: A Global Workforce View" del ADP Research Institute
People at Work 2022: A Global Workforce View" del ADP Research InstitutePeople at Work 2022: A Global Workforce View" del ADP Research Institute
People at Work 2022: A Global Workforce View" del ADP Research Institute
 

Recently uploaded

A305_A2_file_Batkhuu progress report.pdf
A305_A2_file_Batkhuu progress report.pdfA305_A2_file_Batkhuu progress report.pdf
A305_A2_file_Batkhuu progress report.pdftbatkhuu1
 
9599632723 Top Call Girls in Delhi at your Door Step Available 24x7 Delhi
9599632723 Top Call Girls in Delhi at your Door Step Available 24x7 Delhi9599632723 Top Call Girls in Delhi at your Door Step Available 24x7 Delhi
9599632723 Top Call Girls in Delhi at your Door Step Available 24x7 DelhiCall Girls in Delhi
 
Call Girls Jp Nagar Just Call 👗 7737669865 👗 Top Class Call Girl Service Bang...
Call Girls Jp Nagar Just Call 👗 7737669865 👗 Top Class Call Girl Service Bang...Call Girls Jp Nagar Just Call 👗 7737669865 👗 Top Class Call Girl Service Bang...
Call Girls Jp Nagar Just Call 👗 7737669865 👗 Top Class Call Girl Service Bang...amitlee9823
 
Pharma Works Profile of Karan Communications
Pharma Works Profile of Karan CommunicationsPharma Works Profile of Karan Communications
Pharma Works Profile of Karan Communicationskarancommunications
 
Best Basmati Rice Manufacturers in India
Best Basmati Rice Manufacturers in IndiaBest Basmati Rice Manufacturers in India
Best Basmati Rice Manufacturers in IndiaShree Krishna Exports
 
Monthly Social Media Update April 2024 pptx.pptx
Monthly Social Media Update April 2024 pptx.pptxMonthly Social Media Update April 2024 pptx.pptx
Monthly Social Media Update April 2024 pptx.pptxAndy Lambert
 
Mondelez State of Snacking and Future Trends 2023
Mondelez State of Snacking and Future Trends 2023Mondelez State of Snacking and Future Trends 2023
Mondelez State of Snacking and Future Trends 2023Neil Kimberley
 
Yaroslav Rozhankivskyy: Три складові і три передумови максимальної продуктивн...
Yaroslav Rozhankivskyy: Три складові і три передумови максимальної продуктивн...Yaroslav Rozhankivskyy: Три складові і три передумови максимальної продуктивн...
Yaroslav Rozhankivskyy: Три складові і три передумови максимальної продуктивн...Lviv Startup Club
 
KYC-Verified Accounts: Helping Companies Handle Challenging Regulatory Enviro...
KYC-Verified Accounts: Helping Companies Handle Challenging Regulatory Enviro...KYC-Verified Accounts: Helping Companies Handle Challenging Regulatory Enviro...
KYC-Verified Accounts: Helping Companies Handle Challenging Regulatory Enviro...Any kyc Account
 
Monte Carlo simulation : Simulation using MCSM
Monte Carlo simulation : Simulation using MCSMMonte Carlo simulation : Simulation using MCSM
Monte Carlo simulation : Simulation using MCSMRavindra Nath Shukla
 
Call Girls In Holiday Inn Express Gurugram➥99902@11544 ( Best price)100% Genu...
Call Girls In Holiday Inn Express Gurugram➥99902@11544 ( Best price)100% Genu...Call Girls In Holiday Inn Express Gurugram➥99902@11544 ( Best price)100% Genu...
Call Girls In Holiday Inn Express Gurugram➥99902@11544 ( Best price)100% Genu...lizamodels9
 
Progress Report - Oracle Database Analyst Summit
Progress  Report - Oracle Database Analyst SummitProgress  Report - Oracle Database Analyst Summit
Progress Report - Oracle Database Analyst SummitHolger Mueller
 
Event mailer assignment progress report .pdf
Event mailer assignment progress report .pdfEvent mailer assignment progress report .pdf
Event mailer assignment progress report .pdftbatkhuu1
 
Regression analysis: Simple Linear Regression Multiple Linear Regression
Regression analysis:  Simple Linear Regression Multiple Linear RegressionRegression analysis:  Simple Linear Regression Multiple Linear Regression
Regression analysis: Simple Linear Regression Multiple Linear RegressionRavindra Nath Shukla
 
Cracking the Cultural Competence Code.pptx
Cracking the Cultural Competence Code.pptxCracking the Cultural Competence Code.pptx
Cracking the Cultural Competence Code.pptxWorkforce Group
 
Call Girls Pune Just Call 9907093804 Top Class Call Girl Service Available
Call Girls Pune Just Call 9907093804 Top Class Call Girl Service AvailableCall Girls Pune Just Call 9907093804 Top Class Call Girl Service Available
Call Girls Pune Just Call 9907093804 Top Class Call Girl Service AvailableDipal Arora
 
7.pdf This presentation captures many uses and the significance of the number...
7.pdf This presentation captures many uses and the significance of the number...7.pdf This presentation captures many uses and the significance of the number...
7.pdf This presentation captures many uses and the significance of the number...Paul Menig
 

Recently uploaded (20)

A305_A2_file_Batkhuu progress report.pdf
A305_A2_file_Batkhuu progress report.pdfA305_A2_file_Batkhuu progress report.pdf
A305_A2_file_Batkhuu progress report.pdf
 
9599632723 Top Call Girls in Delhi at your Door Step Available 24x7 Delhi
9599632723 Top Call Girls in Delhi at your Door Step Available 24x7 Delhi9599632723 Top Call Girls in Delhi at your Door Step Available 24x7 Delhi
9599632723 Top Call Girls in Delhi at your Door Step Available 24x7 Delhi
 
Call Girls Jp Nagar Just Call 👗 7737669865 👗 Top Class Call Girl Service Bang...
Call Girls Jp Nagar Just Call 👗 7737669865 👗 Top Class Call Girl Service Bang...Call Girls Jp Nagar Just Call 👗 7737669865 👗 Top Class Call Girl Service Bang...
Call Girls Jp Nagar Just Call 👗 7737669865 👗 Top Class Call Girl Service Bang...
 
Pharma Works Profile of Karan Communications
Pharma Works Profile of Karan CommunicationsPharma Works Profile of Karan Communications
Pharma Works Profile of Karan Communications
 
Best Basmati Rice Manufacturers in India
Best Basmati Rice Manufacturers in IndiaBest Basmati Rice Manufacturers in India
Best Basmati Rice Manufacturers in India
 
Monthly Social Media Update April 2024 pptx.pptx
Monthly Social Media Update April 2024 pptx.pptxMonthly Social Media Update April 2024 pptx.pptx
Monthly Social Media Update April 2024 pptx.pptx
 
Mondelez State of Snacking and Future Trends 2023
Mondelez State of Snacking and Future Trends 2023Mondelez State of Snacking and Future Trends 2023
Mondelez State of Snacking and Future Trends 2023
 
Yaroslav Rozhankivskyy: Три складові і три передумови максимальної продуктивн...
Yaroslav Rozhankivskyy: Три складові і три передумови максимальної продуктивн...Yaroslav Rozhankivskyy: Три складові і три передумови максимальної продуктивн...
Yaroslav Rozhankivskyy: Три складові і три передумови максимальної продуктивн...
 
KYC-Verified Accounts: Helping Companies Handle Challenging Regulatory Enviro...
KYC-Verified Accounts: Helping Companies Handle Challenging Regulatory Enviro...KYC-Verified Accounts: Helping Companies Handle Challenging Regulatory Enviro...
KYC-Verified Accounts: Helping Companies Handle Challenging Regulatory Enviro...
 
Monte Carlo simulation : Simulation using MCSM
Monte Carlo simulation : Simulation using MCSMMonte Carlo simulation : Simulation using MCSM
Monte Carlo simulation : Simulation using MCSM
 
Forklift Operations: Safety through Cartoons
Forklift Operations: Safety through CartoonsForklift Operations: Safety through Cartoons
Forklift Operations: Safety through Cartoons
 
Call Girls In Holiday Inn Express Gurugram➥99902@11544 ( Best price)100% Genu...
Call Girls In Holiday Inn Express Gurugram➥99902@11544 ( Best price)100% Genu...Call Girls In Holiday Inn Express Gurugram➥99902@11544 ( Best price)100% Genu...
Call Girls In Holiday Inn Express Gurugram➥99902@11544 ( Best price)100% Genu...
 
Progress Report - Oracle Database Analyst Summit
Progress  Report - Oracle Database Analyst SummitProgress  Report - Oracle Database Analyst Summit
Progress Report - Oracle Database Analyst Summit
 
Event mailer assignment progress report .pdf
Event mailer assignment progress report .pdfEvent mailer assignment progress report .pdf
Event mailer assignment progress report .pdf
 
Regression analysis: Simple Linear Regression Multiple Linear Regression
Regression analysis:  Simple Linear Regression Multiple Linear RegressionRegression analysis:  Simple Linear Regression Multiple Linear Regression
Regression analysis: Simple Linear Regression Multiple Linear Regression
 
Cracking the Cultural Competence Code.pptx
Cracking the Cultural Competence Code.pptxCracking the Cultural Competence Code.pptx
Cracking the Cultural Competence Code.pptx
 
Call Girls Pune Just Call 9907093804 Top Class Call Girl Service Available
Call Girls Pune Just Call 9907093804 Top Class Call Girl Service AvailableCall Girls Pune Just Call 9907093804 Top Class Call Girl Service Available
Call Girls Pune Just Call 9907093804 Top Class Call Girl Service Available
 
7.pdf This presentation captures many uses and the significance of the number...
7.pdf This presentation captures many uses and the significance of the number...7.pdf This presentation captures many uses and the significance of the number...
7.pdf This presentation captures many uses and the significance of the number...
 
VVVIP Call Girls In Greater Kailash ➡️ Delhi ➡️ 9999965857 🚀 No Advance 24HRS...
VVVIP Call Girls In Greater Kailash ➡️ Delhi ➡️ 9999965857 🚀 No Advance 24HRS...VVVIP Call Girls In Greater Kailash ➡️ Delhi ➡️ 9999965857 🚀 No Advance 24HRS...
VVVIP Call Girls In Greater Kailash ➡️ Delhi ➡️ 9999965857 🚀 No Advance 24HRS...
 
unwanted pregnancy Kit [+918133066128] Abortion Pills IN Dubai UAE Abudhabi
unwanted pregnancy Kit [+918133066128] Abortion Pills IN Dubai UAE Abudhabiunwanted pregnancy Kit [+918133066128] Abortion Pills IN Dubai UAE Abudhabi
unwanted pregnancy Kit [+918133066128] Abortion Pills IN Dubai UAE Abudhabi
 

seguridad .pdf

  • 1. Original Article Occupational Gradients in Work-Related Insecurity and Health: Interrogating the Links Heather Scott-Marshall1 Abstract Traditional work-related securities that constitute the career-job model of employ- ment have been in steep decline for several decades, affecting workers across industries and occupations. Still, insecure employment remains unequally distributed across the working population according to the major axes of social stratification, namely age, gender, race, and socioeconomic class. This study investigates patterns of exposure to work-related insecurity across the occupational hierarchy and wheth- er these contribute to occupational gradients in health outcomes. Drawing on data from a national panel survey of the Canadian workforce, a multilevel growth curve modeling approach is used to examine the relationship between work-insecurity exposures and workers’ self-rated health trajectories over 5 years. Findings show that work-related insecurity is associated with declines in self-rated health, although the type of insecurity as well as the magnitude, direction, and duration of the effect varies by occupational status-position. The application of pseudo-R2 tests confirmed this study’s central hypothesis that gradients in health outcomes across occupational hierarchies are due, in part, to differences in exposure to work-related insecurity. Going forward, the development of effective health promotion interventions that can modify work-related health gradients, must work toward mitigating the risk of exposure to adverse work circumstances that is systemic to occupational hierarchies. 1 Dalla Lana School of Public Health, Social & Behavioural Sciences, University of Toronto, Toronto, ON, Canada Corresponding Author: Heather Scott-Marshall, Dalla Lana School of Public Health, Social & Behavioural Sciences, University of Toronto, 155 College Street, Suite 500, Toronto, ON M5T 3M7, Canada. Email: heather.scott@utoronto.ca International Journal of Health Services 0(0) 1–25 ! The Author(s) 2019 Article reuse guidelines: sagepub.com/journals-permissions DOI: 10.1177/0020731419832243 journals.sagepub.com/home/joh
  • 2. Keywords work insecurity, social stratification, health, multi-level modeling, Canadian workforce Decades of global economic restructuring coupled with rapid technological innovation have transformed work systems and undermined the balance of power in work relations. For workers, most stark has been the breakdown of the traditional quid pro quo built into employment relationships whereby work- ers enjoyed a living wage, income security benefits, and long-term employment stability in exchange for a lifetime of service. Formal employment protections were the centerpiece of lives that unfolded predictably and allowed workers to plan their long-term future regarding career, finances, and family. The requirements of economic globalization have been mostly antithetical to traditional work protections. Intense competition among global economic stake- holders has given rise to an unwavering pursuit of reduced human capital expenditures and contributed to the proliferation of precarious work arrange- ments. A handful of studies have demonstrated the social patterning of precar- ious work experiences according to the major axes of social stratification – i.e., socioeconomic class, age, gender, and race – with concomitant impacts on how adverse health is distributed across social hierarchies.1,2 These studies suggest that variations in health outcomes across the occupational hierarchy arise in part due to differences in exposure to precarious employment circumstances.3,4 The present study contributes to this body of evidence by evaluating the rel- ative impact of work-related insecurity exposures on workers’ self-rated health trajectories based on positioning within the occupational status hierarchy. Drawing on both a conceptual framework of work-related insecurity as a struc- tural feature of the employment relationship1,5 and a conceptual mapping of class locations developed by Wright,6 this study addresses the following objectives: (1) to identify patterns of exposure to work-related insecurity across the occupation- al status hierarchy; (2) to evaluate the impact of work-related insecurity on self-rated health trajectories and how this impact is mitigated by occupational status-position; and (3) to quantify the degree of variation in self-rated health outcomes that is attributable to work-related insecurity, so as to determine its precise contribution to occupational gradients in health. Background In Canada, as across the North American continent, the unprecedented eco- nomic growth that occurred after World War II derived mainly from both technological advances in production as well as the enormous demand from 2 International Journal of Health Services 0(0)
  • 3. European countries seeking to rebuild following the war. The overwhelming need for skilled labor required that industrial relations be stabilized, and capital was willing to make concessions to achieve this goal. The rise of a new phase of monopoly capitalism provided the backdrop for thriving labor markets and a Keynesian approach to social spending. A major consequence of the unique set of structural contingencies that existed during this period was the unprecedented level of accord that developed between labor and capital, known to observers as the “social contract.”7,8 A key outgrowth of the social contract that formed between labor and capital was a new regime of industrial legality comprising substantial improvements in both employment standards and institutionalized bargaining rights.9 The zeitgeist of a labor-relations era built on fairness and reciprocity was manifest at the level of the employment relationship. Many organizations struc- tured employment relations by way of an internal labor market, a closed system predicated on deferred rewards. The basic principle of this arrangement is that workers provide a lifetime of service to a firm in exchange for incremental improvements in wages, job status, and security that remained in-step with employment tenure. Mutual benefits accrued – to workers in long-term career and financial security, and to employers in a reliable and productive workforce. The sociocultural impact of the internal labor market was enormous in that it gave rise to a new standard in work relations that stipulated longevity, stability, and prosperity as key elements of the employment exchange.8 The Brave New World of Work It is not an overstatement to declare the postwar standard in employment as mostly defunct in the present socioeconomic context. Canadian labor-market data reveal key changes in the quality of work that can be viewed as commen- surate with the decline in traditional employment securities. One important indicator is the growing number of workers who are employed in nonstandard work arrangements. Currently, more than 2 in 5 Canadian workers are employed in temporary, part-time, or solo self-employment arrangements.10–12 Earnings growth has also been sluggish for Canadian workers. A recent anal- ysis of historical earnings data concluded that after adjusting for inflation, the average hourly wage of full-time payroll workers remained mostly unchanged over 4 decades, from $24.00 in 1976 to $27.70 in 2016.13 Still, wage rates vary widely across occupational groups, with management occupations earning the highest wages, by far, on average, at $40.25 per hour, while restaurant and food service workers remain at the lowest end of the earnings distribution, at $18.10 per hour.14 A key factor in stagnant wages is the breakdown of internal job ladders and concomitant losses in opportunities for career advancement within firms. As a consequence, an increasing number of workers have remained Scott-Marshall 3
  • 4. “stuck” in entry-level positions, which has contributed to rising intra-firm wage inequality.15 Another significant shift in compensation norms has been the rate at which workers are covered by income security benefits, such as private health insur- ance and retirement pensions.16,17 Dramatic increases in the provision costs for extended health coverage – particularly for pharmaceuticals – have caused employers to cut back on health benefits.18 Pension coverage for employees has also fallen drastically: since 1977, the proportion of Canadian workers cov- ered by a defined benefit pension plan has declined from more than 2 in 5 (44%) workers to less than 1 in 3 (29%).16 Losses in key provisions comprising the postwar employment standard reflect a more fundamental process involving a shift in the balance of power away from Canadian labor. A major indicator of this trend is the decline in organized labor in Canada. Between 1981 and 2016, union density – the proportion of all Canadian workers covered by a collective agreement – fell from 38% to 29%.19 In turn, the shrinking presence of unions has given rise to adverse work changes across sectors; in particular, the loss of equity norms that unions helped institutionalize has contributed to growing wage disparities in non-unionized industries.20 Taken together, changes to full-time permanent work arrangements reflect a fundamental restructuring of contemporary employment relationships in accor- dance with contingencies inherent in an increasingly competitive globalized cap- italism. “Post-standard employment” – characterized by instability, lack of protection, and social and economic vulnerability – is on the rise in developed countries and affects workers across the occupational and industry spectrum.21 The antithesis of the postwar standard in employment, post-standard employ- ment is characterized by non-sustaining wages, a lack of benefits adequacy, and few opportunities for job, wage, or career advancement. In addition, a concom- itant regime of workplace restructuring emphasizing “functional flexibility” has led to the expansion of roles and responsibilities for many workers.22 This expansion has driven a dramatic rise in unpaid overtime hours in the last 2 decades, a trend exacerbated by the ubiquitous presence of portable communi- cations and monitoring technologies that require workers be “always-on.”23,24 Work-Related Insecurity and Health Early investigations into the link between work insecurity and health focused primarily on job insecurity and the physiological effects arising from the per- ceived threat of job loss. Risk of job loss is conceived as a classic psychological stressor and has been linked with several adverse physical and psychological health outcomes.25,26 More recent investigations, however, show that work- related insecurity experiences can be attributed to a broader set of causes than just job loss. Experiences such as financial insecurity, loss of valued job features, 4 International Journal of Health Services 0(0)
  • 5. assignment of unwanted tasks or responsibilities, and diminishing career devel- opment opportunities have each been associated with poor health outcomes in workers.1,25,27–29 This body of literature demonstrates the importance of decom- posing work insecurity into its constituent elements so that the impact on health of specific work features can be evaluated. Social Position, Work, and Health A perennial challenge facing public health professionals has been the persistent gradient in health outcomes arising from social position. Historically, factors related to social position such as socioeconomic class, age, gender, and race were treated as confounding variables that needed to be controlled so that the effects of a given pathogen on a particular health outcome could be evaluated. More recently, critical perspectives on the sociology of health have gained prominence, foregrounding the basic mechanisms of inequality embedded in social structures that give rise to differences in health exposures and related outcomes. From this perspective, factors related to social position are viewed as key proxies of pat- terns of exposure to risks and rewards.30 Within the domain of work, hazardous exposures tend to be systematically related to position within the occupational hierarchy. The Whitehall studies have repeatedly demonstrated the link between health status and occupational position over decades.31,32 More recent investi- gations3,4 have confirmed that inequalities fundamental to the employment rela- tionship manifest in adverse work exposures and, as such, constitute the main explanatory variables of social class inequalities in health.3 Conceptual Framework and Hypotheses The postwar standard in employment collapsed because the factors that brought it into existence were ephemeral by nature. The economic monopoly that facil- itated an interventionist approach to labor-market policy was undermined by the mechanics of capitalism itself, which rely on an ever-expanding sphere of influence. By the mid-1970s, the postwar economy was showing signs of signif- icant upheaval as the globalization juggernaut was unleashed. Survival required that firms restructure how they did business, including how they managed employment relationships. A central component involved tearing down internal labor market hierarchies and inserting more flexibility into employment rela- tionships. A major casualty of this process was the basic quid pro quo that formed the foundation of the postwar employment relationship – the exchange of job and income security for a lifetime of employment service. Today, even workers employed under contracts with nominal security (full-time, full-year, non-term) experience work-related insecurity in the form of wage insufficiency, unpredictable job and career mobility, and the lack of social protections (e.g., health insurance; disability or retirement pensions) due to lack of coverage by Scott-Marshall 5
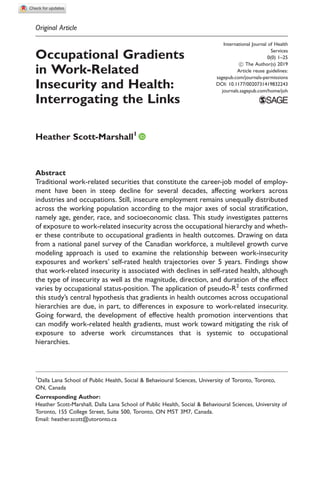
  • 6. a union or collective agreement. Work-related insecurity thus constitutes a structural feature of contemporary post-standard employment and in turn, a chronic occupational stressor embedded in the organization of work. Research into hazardous exposures at work demonstrates how the distribu- tion of physical and psychosocial risk tends to align with an occupational hier- archy in which low status workers experience the highest amount of exposure to adverse working conditions, and the highest status workers experience the least.3,4 The relationship between risk exposure and occupational position is presumed to arise from the relative degree of control that workers exercise over the terms, conditions, and outcomes of their work.5,6 Figure 1 presents a conceptual mapping of class locations adapted from Wright.6 The map comprises 3 status dimensions. The first dimension, control over economic or productive resources, constitutes the basic cleavage between owner-employers and labor. The second dimension locates workers within the hierarchy of production relations and is expressed as degree of authority or managerial control at work. The third dimension captures the extent to which workers have access to specialized skills or credentials. By superimposing this mapping of class locations onto a conceptual frame- work that presents work-related insecurity as a structural feature of post- standard employment, informed propositions can be made regarding patterns of exposure to work-related insecurity across the occupational hierarchy. For example, the first dimension of the framework implies that exposure to work- related insecurity is germane only to the class that lacks ownership and control over productive resources. The second dimension links workers’ exposure to insecurity to the level of control or influence they exercise within the employ- ment relationship, as determined by their proximity to the levers of power Capitalists (many employees) Managers (skilled/expert) Managers (semi-skilled) Managers (unskilled) Small employers (few employees) Supervisors (skilled/expert) Supervisors (semi-skilled) Supervisors (unskilled) Petty bourgeoisie (no employees) Workers (skilled/expert) Workers (semi-skilled) Workers (unskilled) Owners Employees Relationship to production assets Degree of organizational authority and control Degree of skills/credentials Figure 1. Conceptual map of class locations. Adapted from Wright.6 Work-related insecurity is a structural property of work/labour-relations that derives from a lack of control over eco- nomic and productive resources. 6 International Journal of Health Services 0(0)
  • 7. (e.g., degree of control over their own work circumstances as well as the work circumstances of others via hiring decisions, promotion opportunities, wage increases, etc.). The third dimension is similar in that it traces exposure to work-related insecurity to the vulnerability associated with a lack of marketable skills or credentials. The major hypotheses of this study are as follows: H1: Workers with low authority and managerial control will have higher exposure to work-related insecurity than workers with greater authority and manageri- al control. H2: Workers with low skills-knowledge and few credentials will have higher expo- sure to work-related insecurity than workers with higher skills and credentials. H3: There will be a monotonic increase in level of exposure to work-related inse- curity across the authority-skills spectrum such that workers at the low end of each axis (i.e., non-managers who perform low-skill tasks) will experience the highest exposure to work-related insecurity, whereas those at the highest point of each axis (i.e., managerial workers with specialized skills) will have the least exposure. H4: Exposure to work-related insecurity will have a cumulative adverse effect on self-rated health over time such that longer periods of exposure (measured in years) will be associated with lower self-rated health; furthermore, year-to-year changes in exposure to work-related insecurity will be inversely related to self-rated health such that increases in work-related insecurity in a given year will be associated with health declines. H5: As a consequence of different patterns of exposure across the occupational hierarchy, work-related insecurity will account for a higher proportion of the total variation in self-rated health among workers in low-skill occupations compared to those in higher-skill occupations, ceteris paribus (all else equal at baseline). Methods Data Data for the present study were drawn from the Canadian Survey of Labour and Income Dynamics (SLID), a nationally representative longitudinal labor- market survey comprising 6-year overlapping panels. The sample frame for the SLID is individuals aged 16 and older who reside in one of the 10 Canadian provinces. The present study draws from the fourth panel of SLID, which spans the period 2002 to 2007. In 2002, the response rate for the fourth panel was Scott-Marshall 7
  • 8. 81.2%, decreasing to 71.6% by 2007. Permission to use this survey was provided by Statistics Canada, which adheres to strict guidelines of confidentiality and anonymity for all survey participants. Each panel comprises approximately 15,000 households. Information is col- lected annually from all household members, with 1 individual selected for a more in-depth labor and income interview. The selected individual must provide detailed information on the characteristics of up to 6 jobs annually. One of the jobs is identified as the individual’s main job, based on the greatest number of hours or highest earnings in the reference year. Also collected is sociodemo- graphic information, income sources and amounts at the individual and family level, and information on self-reported general health at the time of the survey. Because the focus of this study is on the health consequences of employment experiences, a subsample of workers was selected according to indicators of close ties to the labor market. The sample included only individuals aged 25 to 54 who were not full-time students, were employed full-time for at least 9 months of the year, and were not self-employed in their main job. A final inclusion criterion required that individuals reported being in good, very good, or excellent health at the beginning of the year. This “healthy cohort” criterion helped control for reverse causality, where individuals in poor health are selected into insecure employment circumstances. The final sample comprised 2,417 individuals across 5 years of observation for a total of 12,085 observations. Because two of the explanatory variables used in this study derive from infor- mation collected in the prior survey year, the analysis has been restricted to 5 of 6 panel-years [2003–2007]. All information on employment experiences per- tained to characteristics of participants’ main job. Measures Health. Self-reports of general health are collected annually in the SLID and are based on a single survey item as follows: In general, how would you describe your state of health? Would you say it is excellent, very good, good, fair, or poor? Responses are scored on a 5-point Likert scale ranging from excellent to poor. The item was reverse coded such that individuals who reported excellent health received a score of 5 and those who reported poor health received a score of 1. This measure of self-reported general health is considered a valid and reliable measure of acute and chronic conditions, physical functioning, as well as in some cases, adverse health behaviors and mental health problems.33,34 Occupational status. Nine classifications of occupational status were constructed using the conceptual mapping of class locations adapted from Wright.6 Survey 8 International Journal of Health Services 0(0)
  • 9. indicators corresponding to each dimension of work status (i.e., degree of orga- nizational authority/control and degree of skills/credentials) were used to develop a hierarchy of occupational positions. The first dimension, degree of organiza- tional authority/control, was measured using 2 indicators: the job is perceived as managerial (1 ¼ yes; 0 ¼ no); and the job involves supervising employees (1 ¼ yes; 0 ¼ no). Response patterns to these indicators produced a job-status classification comprising 3 ranked categories: managers (highest level of author- ity); supervisors (mid-level authority); and non-managers (lowest level of author- ity). Categories were mutually exclusive such that respondents who performed tasks involving managerial responsibilities were classified as managers even if they also supervised employees (i.e., job involves supervision of employees ¼ 1). Supervisors were respondents who indicated that their role involved supervisory responsibilities but not managerial duties (job perceived as managerial ¼ 0). Workers who performed tasks that required neither managerial nor supervisory responsibilities were classified as non-managers. The second occupational status dimension, degree of skills/credentials, was constructed using the National Occupational Classification (NOC). The NOC provides a standardized framework for characterizing relationships among dif- ferent job categories based on educational requirements (i.e., university-level training, non-university/postsecondary training, secondary school training, and no training).35 Using the NOC framework, workers were assigned to 1 of 3 ranked categories according to level of job skill as follows: skilled-expert, semi- skilled, and low-skilled work. The final classification sorted participants into 1 of 9 ranked occupational status categories: (1) worker, low-skilled; (2) worker, semi-skilled; (3) worker, skilled-expert; (4) supervisor, low-skilled; (5) supervisor, semi-skilled; (6) supervisor, skilled-expert; (7) manager, low-skilled; (8) manager, semi-skilled; and (9) manager, skilled-expert. Work-related insecurity. The following 7 measures of work-related insecurity were constructed using information about the respondent’s main job: earnings insecurity, earnings mobility insecurity, job mobility insecurity, pension coverage insecurity, extended health coverage insecurity, union protection insecurity, and work-life balance insecurity. Individuals were categorized as exposed to earnings insecurity if their hourly wage rate fell below Statistics Canada’s average industrial wage for the reference year (yes ¼ 1; no ¼ 0). The average industrial wage is calculated annually as mean earnings across all sectors of the Canadian economy. For the 5-year period between 2003 and 2007, the average industrial wage rates for full-time permanent employees were as follows: $17.17, $17.68, $18.29, $18.74, $19.48.36 Earnings mobility insecurity was evaluated using annual inflation-adjusted earnings data. Thresholds were calculated using adjustments provided by the Consumer Price Index (CPI) with earnings information standardized to 2002 dollars. Respondents whose current year wage rate did not exceed the wage rate Scott-Marshall 9
  • 10. from the prior year after adjusting for inflation received a code of 1 for earnings mobility insecurity, and 0 otherwise. Workers were considered exposed to job mobility insecurity if they did not experience an increase in job status during the observation period or if they experienced a decline in job status. Classifications were based on 2 survey items that asked respondents whether their job currently involved supervisory or man- agement responsibilities. In turn, jobs were classified into one of the following categories: no managerial or supervisory responsibilities, supervisory responsi- bilities only, or managerial duties. Respondents who indicated either no change or a negative change in job status (e.g., downward mobility trajectory, such as from upper to lower management, or the loss of supervisory or managerial responsibilities) received a code of 1 for job mobility insecurity and 0 otherwise. Two measures of income protection insecurity, pension coverage insecurity and extended health coverage insecurity, were each measured by a single item that asked respondents whether their job provided a retirement pension or extended health benefits (yes ¼ 1; no ¼ 0). Union protection insecurity was mea- sured by a single indicator that asked respondents if their job was covered by a union or collective agreement (yes ¼ 1; no ¼ 0). A measure of work-life balance insecurity was constructed using the ratio of paid to unpaid work hours for each respondent. Where the proportion of unpaid work hours exceeded the average for the sample, respondents were clas- sified as being exposed to work-life balance insecurity (yes ¼ 1; no ¼ 0). Two sociodemographic characteristics were also included in the model due to their potential confounding effects. Gender was measured using female as the reference category (yes ¼ 1; no ¼ 0). Age bracket in 2002 classified workers into 1 of 3 age categories based on age at baseline (25–34 ¼ 1; 35–44 ¼ 2; 45–54 ¼ 3). Analysis The major objective of the analysis in the present study is to evaluate how changes in exposure to work-related insecurity are systematically related to changes in individuals’ self-rated health over time. The multilevel growth model for longitudinal data provides an optimal platform to assess these rela- tionships since it incorporates a random component that isolates any statistical noise that might arise from time-specific variance at the individual level. This partitioning of variance allows the covariates of interest to be more precisely estimated.37 The linear multilevel model is as follows: Y ¼ Xb þ Zu þ X (1) where Y is the observed data vector, X is a known design matrix, b is a vector of unknown fixed effects, Z is a known random-effects design matrix, u is a vector 10 International Journal of Health Services 0(0)
  • 11. of unknown random (individual-level) effects, and R is a vector of unobserved random errors.38 The model decomposes into 2 equations at level 1 and level 2, representing change within and between individuals, respectively. Level 1 within-person model. The first step in building the multilevel growth model is to specify the shape of the trajectory for intra-individual change. Change refers to the underlying trajectory for an individual as a function of time and a set of growth parameters that define the change function.39 Prior research has shown that self-rated health behaves as a latent continuous variable with a normal dis- tribution40,41 ; the present study uses a linear function to describe health change (diagnostics of the linear assumption are available from the author upon request). Using a single substantive predictor to represent work-related insecurity, the level 1 within-person model is as follows: Yij ¼ b0i þ b1iTij þ b2iWRIij þ eij (2) where i is the index for persons, j is the index for occasions, T is an interval measure of time (years in this study), and WRI denotes exposure to work- related insecurity (which varies over time for at least some respondents). The parameters are interpreted as follows: Yij is the level of self-rated health for indi- vidual i measured at time j; b0i is the intercept (2002 value) of the health trajectory for person i; b1i is the slope of the health trajectory for person i; Tij is time at the jth measurement for subject i, defined herein as the period in years since 2002 when self-rated health is first assessed (time 1 ¼ 0); and eij is the time-specific residual (comprising error in prediction and measurement) for each within-person regres- sion of health on time. Against the backdrop of the basic time-trend for each individual, self-rated health also varies as a function of exposure to work-related insecurity with b2i capturing the magnitude of this relationship. Level 2 between-persons model. In the multilevel for longitudinal data, the param- eters from the level 1 (within-person) model become the dependent variables for the level 2 (between-persons) model. Each parameter can be represented by a separate equation as follows: b0i ¼ c00 þ u0i (3) b1i ¼ c10 þ u1i (4) b2i ¼ c20 (5) Equations 3 and 4 depict the average intercept and slope parameters for self- rated health across all individuals (represented as c00 and c01) plus all individual Scott-Marshall 11
  • 12. deviations from the mean values (i.e., the random components, u0i and u1i). The term u0i denotes random variation across individuals in average self-rated heath in 2002 (the intercept), and u1i represents unexplained variation in the rate of change in self-rated health over the trajectory period. On the other hand, Equation 5 captures the effect of differences in average exposure to work- related insecurity (expressed as c20). Because the effect of exposure to work- related insecurity is considered fixed (i.e., in a given year exposure either occurs or does not occur, and individuals are not subject to randomness in level of exposure), Equation 5 does not include a summary term for random effects. Within-person change. An estimate of the health impact of exposure to work- related insecurity (c20 in Equation 5) represents the combined effect of 2 distinct sources of variation: (1) inter-individual differences in average level of exposure; and (2) intra-individual change over time in level of exposure. To obtain sepa- rate estimates of the variance components, 2 modifications of the preceding equations are required. First, the values for work-related insecurity (WRI) in Equation 2 must be transformed into deviations from each individual’s total average exposure (WRIi) calculated across the 5-year observation period: WRI ij ¼ WRIij WRIi (6) The WRI*ij parameter is interpreted as the effect of change in exposure to work-related insecurity relative to an individuals’ total exposure averaged over 5 years. Second, the individual means for exposure to work-related insecurity (WRIi) are included as explanatory variables in Equation 3 to represent the effect of overall differences in exposure on self-rated health over time: b0i ¼ c00 þ c01WRIi þ u0i (7) Thus, the time-varying exposures to work-related insecurity have been dis- tilled into 2 estimable components: a mean that denotes each individual’s level of exposure to WRI over 5 years (average exposure), and a deviation from the mean that captures the year-over-year increase or decrease in exposure to WRI (i.e., within-person change). For example, given a year-over-year exposure pat- tern for individual “i” of 0, 0, 0, 1, 1, the data can be transformed into 2 distinct variables: (1) WRIi, with a constant value of 0.4 for the individual (the stable component); and (2) WRI*ij, which would take on values of 0.4, 0.4, 0.4, 0.6, and 0.6 (the change component). Based on this formulation, c01 represents the average effect of inter-individual differences in exposure to work-related insecurity and captures the cumulative effect on health status over time, while c20 (Equation 5) represents the effect of within-person change.42 12 International Journal of Health Services 0(0)
  • 13. Maximum efficiency in model estimation is achieved using a reduced-form equation created by substituting the level 2 equations into the level 1 equation as follows: Yij ¼ c00 þ c10Tij þ c20WRIij þ u0i þ u1iTij þ eij ð Þ (8) The composite error term (Equation 8) corrects for both autocorrelation and heteroscedascity arising from multiple measures of the outcome across time.37,42 Statistical tests of u0,i and u1,i indicate whether individual intercepts and slopes for self-rated health vary significantly from mean values and require addition of inter-individual predictors to the model to account for these differences.38 In the present study, the focus is whether differences in exposure to work-related inse- curity arising from occupational position explain a significant proportion of the variance in self-rated health outcomes. Specification for the full-model is as follows: Level-1 model: Yij ¼ b0i þ b1i time ð Þ þ b2i earnings insecurity ð Þ þ b3i earnings mobility insecurity ð Þ þ b4i job mobility insecurity ð Þ þ b5i pension coverage insecurity ð Þ þ b6i extended health coverage insecurity ð Þ þ b7i union protection insecurity ð Þ þ b8i work life balance insecurity ð Þ þ eij Level-2 model: b0i ¼ c00 þ c01 female ð Þ þ c02 age group in 2002 ð Þ þ c03 earnings insecurity average ð Þ þ c04 earnings mobility insecurity average ð Þ þ c05 job mobility insecurity average ð Þ þ c06 pension coverage insecurity average ð Þ þ c07 extended health coverage insecurity average ð Þ þ c08 union protection insecurity average ð Þ þ c09 work life balance insecurity average ð Þ þ u0i b1i ¼ c10 þ c11 female ð Þ þ c12 age group in 2002 ð Þ þ u1i b2i ¼ c20 earnings insecurity change ð Þ b3i ¼ c30 earnings mobility insecurity change ð Þ b4i ¼ c40 job mobility insecurity change ð Þ b5i ¼ c50 pension coverage insecurity change ð Þ b6i ¼ c60 extended health coverage insecurity change ð Þ b7i ¼ c70 union protection insecurity change ð Þ b8i ¼ c80 work life balance insecurity change ð Þ Scott-Marshall 13
  • 14. Analyses were stratified by occupational status classification to evaluate dif- ferences in exposure to work-related insecurity and the impact on self-rated health across the different occupational groups. Multilevel models were estimat- ed using SAS Proc Mixed V9.3. Use of a REPEAT statement adjusted for correlation and non-identicalness of the residuals across multiple observations on each person.37 Tests of different specifications of the error matrix showed that an autoregressive structure (AR[1]) best fit the data. The AR(1) residual matrix introduced an additional parameter, q, to accommodate nonspecific dis- turbances in each respondent’s underlying self-rated health trajectory. Population weights were applied to all analyses to adjust for both survey non- response and unequal probabilities of selection into the survey. Results Table 1 presents characteristics of the sample by occupational position. Workers comprised a majority of the total sample (56.3%). More than 1 in 4 (27.9%) individuals held management positions, while 15.9% worked in a supervisory role. A total of 26.9% respondents held jobs that required specialized skills or training compared to 38.8% and 34.4% who held unskilled and semi-skilled jobs, respectively. Two in 5 respondents (41.4%) were female, with the highest percentage (40.3%) in the middle age category (35 to 44). The likelihood of being employed in skilled work increased with level of managerial authority, with 51.2% of managers performing skilled jobs compared to less than 1 in 5 workers (17.1%). Occupational stratification by gender and age group was also evident. Only a third of workers with managerial responsibilities were women, and less than one-fifth were in the youngest age group (25 to 34). Table 2 presents average self-rated health in 2002 along with means for dura- tion of exposure to work-related insecurity by occupational position. For each job-status group, findings show a predominantly monotonic increase in self- rated health across increments of job skill. Skilled supervisors reported the best self-rated health on average (very good range: 4.0–4.9); by contrast, low- skilled workers had the lowest self-rated health (good range: 3.0–3.9). As expected, patterns of exposure to work-related insecurity varied across the occu- pational hierarchy, with individuals in low-skill jobs reporting higher levels of exposure on average. Compared to skilled managers – the highest status group – workers who performed low-skill jobs reported 8 times more exposure to work-life balance insecurity (0.16 years [58.4 days] versus 0.02 years [7.3 days], respectively). Findings also showed that less skilled workers reported significant- ly longer periods of exposure to both job mobility insecurity and earnings insecurity compared to their counterparts in more highly skilled jobs. Among low-skilled workers, the propensity for exposure to work-related insecurity cut across the levels of organizational authority with low-skilled managers experiencing longer periods of earnings mobility insecurity, retirement pension 14 International Journal of Health Services 0(0)
  • 15. insecurity, and extended health coverage insecurity. By contrast, managers had significantly greater exposure to union protection insecurity. Table 3 presents results from the multilevel growth models for change in self- rated health due to work-related insecurity exposures, stratified by occupational group. Findings from the cumulative effect model show that, among workers, exposure to earnings insecurity had an adverse impact on self-rated health for workers in both low- and semi-skilled jobs. Each additional year of exposure to Table 1. Sample Characteristics in 2002, SLID Panel 4 (2002–2007).a Proportion Within Occupational Group Proportion of Total Sample Workers Skilled 17.1 9.6 Semi-skilled 32.9 18.5 Unskilled 50.0 28.2 Female 46.7 26.3 Age group 25–34 22.4 12.6 35–44 39.8 22.4 45–54 37.8 21.3 Total 56.3 Supervisors Skilled 18.8 3.0 Semi-skilled 40.6 6.4 Unskilled 40.6 6.4 Female 37.5 5.9 Age group 25–34 25.0 4.0 35–44 40.3 6.4 45–54 34.7 5.5 Total 15.9 Managers Skilled 51.2 14.2 Semi-skilled 33.8 9.4 Unskilled 15.0 4.2 Female 32.8 9.1 Age group 25–34 18.5 5.2 35–44 41.4 11.5 45–54 40.1 11.2 Total 27.9 a Weighted percentages; total n ¼ 2,417. Scott-Marshall 15
  • 16. Table 2. Average SRH in 2002 and Duration of Exposure in Years to Work-Related Insecurity by Occupational Position, 2003– 2007 (n ¼ 2,417). SRH Earnings Insecurity SD Earnings Mobility Insecurity SD Job Mobility Insecurity SD Pension Coverage Insecurity SD Extended Health Coverage Insecurity SD Union Coverage Insecurity SD Work–Life Balance Insecurity SD Workers Skilled 4.18 0.35 1.06 2.37 1.26 3.76 1.51 0.67 1.41 0.16 0.52 1.68 2.29 0.08 0.35 Semi-skilled 4.13 1.16 1.89 2.64 1.07 4.12 1.33 1.47 2.10 0.64 1.37 2.33 2.43 0.08 0.36 Unskilled 3.91 2.61 2.26 2.76 1.15 4.36 1.15 1.66 2.08 0.66 1.38 2.18 2.39 0.16 0.51 Supervisors Skilled 4.48 0.49 1.37 2.03 1.11 3.83 1.60 0.80 1.70 0.45 1.19 1.76 2.27 0.04 0.19 Semi-skilled 4.18 1.11 1.94 2.62 1.11 3.91 1.49 1.98 2.30 1.02 1.76 3.00 2.34 0.07 0.35 Unskilled 4.10 1.97 2.25 2.67 1.11 4.30 1.24 1.76 2.12 0.63 1.37 2.96 2.41 0.13 0.48 Managers Skilled 4.28 0.28 1.06 2.26 1.09 3.98 1.54 1.39 2.00 0.33 0.97 4.12 1.73 0.02 0.18 Semi-skilled 4.14 1.11 1.93 2.77 1.26 4.28 1.25 1.59 2.15 0.70 1.49 3.69 2.09 0.11 0.50 Unskilled 4.07 1.98 2.14 2.81 1.41 4.24 1.41 2.26 2.19 0.89 1.61 3.66 2.14 0.08 0.36 Abbreviations: SD, standard deviation; SRH, self-rated health. 16
  • 17. Table 3. Growth Models of the Effect of Work-Related Insecurity on Self-Rated Health by Occupational Position, 2003–2007 (N ¼ 2,417). Fixed Effects Workers Low-Skill S.E. Workers Semi- Skilled S.E. Workers Skilled S.E. Supervisors Low-Skill S.E. Supervisors Semi-Skilled S.E. Supervisors Skilled S.E. Managers Low-Skill S.E. Managers Semi- Skilled S.E. Managers Skilled S.E. For Initial Status, b0,i Intercept, c00 4.208 0.151** 4.331 0.169** 4.338 0.188** 4.471 0.312** 4.114 0.277** 4.257 0.423** 4.106 0.423** 4.593 0.239** 4.497 0.188** Female, c01 0.038 0.061 0.048 0.076 0.076 0.095 0.150 0.127 0.019 0.125 0.059 0.189 0.021 0.183 0.150 0.107 0.121 0.079 Age group in 2002, c02 0.159 0.042** 0.057 0.050 0.092 0.062 0.085 0.085 0.016 0.083 0.234 0.133 0.050 0.133 0.167 0.068* 0.026 0.052 Earnings insecurity aver- age, c03 0.208 0.064** 0.287 0.091** 0.031 0.167 0.111 0.131 0.075 0.152 0.397 0.362 0.007 0.203 0.020 0.111 0.084 0.129 Earnings mobility insecu- rity average, c04 0.144 0.110 0.091 0.141 0.145 0.157 0.027 0.246 0.092 0.244 0.236 0.354 0.177 0.280 0.082 0.170 0.337 0.137** Job mobility insecurity average, c05 0.142 0.110 0.154 0.116 0.005 0.126 0.292 0.225 0.073 0.179 0.351 0.275 0.213 0.317 0.256 0.160 0.056 0.097 Pension coverage insecu- rity average, c06 0.043 0.082 0.028 0.103 0.027 0.149 0.057 0.165 0.274 0.164 0.106 0.324 0.174 0.238 0.041 0.121 0.039 0.088 Extended health cover- age insecurity aver- age, c07 0.008 0.105 0.048 0.135 0.005 0.297 0.114 0.223 0.349 0.204 0.406 0.611 0.007 0.284 0.150 0.176 0.224 0.165 Union protection insecu- rity average, c08 0.027 0.061 0.061 0.080 0.008 0.098 0.102 0.130 0.131 0.127 0.494 0.255* 0.049 0.204 0.142 0.106 0.098 0.088 Work-life balance inse- curity average, c09 0.552 0.238* 0.110 0.341 0.825 0.548 0.552 0.682 1.423 0.661* 1.189 2.417 0.353 0.944 0.639 0.161 0.613 0.685 For Linear Change, b1,i Intercept, c10 0.053 0.030 0.023 0.033 0.021 0.046 0.026 0.050 0.078 0.048 0.005 0.082 0.002 0.078 0.094 0.047* 0.068 0.039 Female, c11 0.013 0.018 0.079 0.021** 0.011 0.029 0.014 0.033 0.001 0.033 0.011 0.053 0.021 0.045 0.020 0.032 0.040 0.025 Age group in 2002, c12 0.002 0.012 0.031 0.014* 0.015 0.019 0.041 0.022 0.057 0.020** 0.023 0.035 0.029 0.032 0.016 0.020 0.044 0.016** Earnings insecurity change, c20 0.033 0.053 0.107 0.064 0.001 0.117 0.217 0.107* 0.062 0.131 0.053 0.269 0.056 0.116 0.008 0.111 0.134 0.141 Earnings mobility insecu- rity change, c30 0.073 0.025** 0.006 0.026 0.026 0.037 0.007 0.045 0.051 0.044 0.022 0.069 0.014 0.066 0.031 0.039 0.028 0.029 Job mobility insecurity change, c40 0.042 0.046 0.011 0.043 0.064 0.052 0.097 0.082 0.179 0.072* 0.012 0.117 0.229 0.122* 0.037 0.070 0.090 0.051 (continued)
  • 18. Table 3. Continued. Fixed Effects Workers Low-Skill S.E. Workers Semi- Skilled S.E. Workers Skilled S.E. Supervisors Low-Skill S.E. Supervisors Semi-Skilled S.E. Supervisors Skilled S.E. Managers Low-Skill S.E. Managers Semi- Skilled S.E. Managers Skilled S.E. Pension coverage insecu- rity change, c50 0.091 0.050 0.043 0.067 0.106 0.083 0.064 0.092 0.111 0.115 0.316 0.214 0.050 0.115 0.054 0.094 0.004 0.065 Extended health cover- age insecurity change, c60 0.051 0.055 0.061 0.063 0.045 0.109 0.218 0.106* 0.048 0.100 0.022 0.183 0.013 0.128 0.089 0.090 0.106 0.083 Union protection insecu- rity change, c70 0.011 0.082 0.283 0.109** 0.107 0.140 0.055 0.196 0.360 0.135** 0.144 0.219 0.091 0.220 0.102 0.132 0.043 0.086 Work-life balance inse- curity change, c80 0.209 0.076** 0.074 0.117 0.078 0.164 0.211 0.150 0.134 0.194 0.138 0.375 0.099 0.238 0.289 0.149* 0.052 0.238 Random effect Initial Status, u0i 0.342 0.030** 0.405 0.037** 0.318 0.045** 0.396 0.064** 0.319 0.058** 0.404 0.105** 0.532 0.106** 0.314 0.044** 0.275 0.035** Linear Change, u1i 0.016 0.002** 0.019 0.003** 0.021 0.004** 0.014 0.004** 0.007 0.004* 0.015 0.007* 0.019 0.006** 0.017 0.004** 0.017 0.003** Goodness of Fit Deviance 7956.2 5457.8 2972.3 1796.1 1767.7 995.4 1119.9 2628.1 3804.7 AIC 7966.2 5467.8 2982.3 1806.1 1777.7 1005.4 1129.9 2638.1 3814.7 *P .05; **P .01 Abbreviation: AIC, Akaike information criterion.
  • 19. earnings insecurity produced an average decline in self-rated health of 25% ([0.21/0.85] 100]) and 34% ([0.29/0.85] 100) among low- and semi- skilled workers, respectively, where 0.85 represents the standard deviation of self-rated health in 2002. Moreover, for low-skilled workers, each annual incre- ment of exposure to work-life balance insecurity was associated with a 65% decline in self-rated health ([0.55/0.85] 100). Coefficients from the model for linear change show that low-skilled workers were also adversely affected by the onset of exposure to work-life balance insecurity, with increases in expo- sure to this variable associated with a 25% decline in self-rated health ([0.21/ 0.85] 100). By contrast, among semi-skilled workers, increases in exposure to union protection insecurity were associated with a 33% increase in self-rated health ([0.28/0.85] 100). Among supervisory employees, findings from the cumulative impact model show that increased exposure to union protection insecurity gives rise to substan- tial declines in self-rated health in the skilled group ([0.49/0.80] 100 ¼ 61% per year of exposure). Results from the model for linear change show that individuals in low-skill jobs are significantly impacted by yearly changes in both earnings insecurity and health coverage insecurity, although the effects were not in the expected direction, with increases in both types of insecurity giving rise to health improvements. In contrast, semi-skilled supervisors were adversely affected by increased exposure to job mobility insecurity and union protection insecurity, which produced declines in self-rated health of 23% and 45%, respectively. Among managers, results from the cumulative impact model show that longer periods of exposure to earnings mobility insecurity reduced self-rated health among skilled managers by 49% each year ([0.34/0.70] 100 ¼ 49%). In addition, findings from the model for linear health change indicate that the health of low-skilled managers is adversely affected by changes in job mobility insecurity in a given year ([0.23/0.70] 100 ¼ 33%). Tests of the total percentage of variation in self-rated health accounted for by the statistical model were performed for each occupational status group. In the multilevel model for change, the pseudo-R2 statistic gives the proportional reduction in level 2 variance from the addition of each of the covariates. Total outcome variation is partitioned into separate variance components at level 2, r2 0, and r2 1, used to estimate variation in both initial health status and rate of health change.37 For parsimony, respondents were pooled across skill levels to yield a single model for each occupational group (i.e., workers, super- visors, and managers). Based on the difference in total variation explained by the unconditional model compared to the fully specified model including all predictors, the pseudo-R2 statistic was calculated as follows: [r2 (unconditional growth model) r2 (conditional growth model)]/r2 (uncondi- tional growth model) Scott-Marshall 19
  • 20. Findings show that the level 2 work-related insecurity predictors accounted for twice the variance in workers’ initial self-rated health compared to super- visors and managers (6% compared to 3% for each of the latter groups, respec- tively). For rate of change in health, work-related insecurity accounted for 9% of the variance in self-rated health trajectories for each of the non-managerial groups (both workers and supervisors) compared to just 3% for manageri- al employees. Discussion This study investigated patterns of exposure to work-related insecurity across the occupational hierarchy and its impact on workers’ health over time. Drawing on a conceptual mapping of class developed by Wright6 and a frame- work that presents work-related insecurity as a foundational feature of the contemporary employment relationship,1,5 this study sought to investigate the extent to which occupational gradients in health outcomes arise from differences in exposure and vulnerability to work-related insecurity. Findings from descriptive analyses largely support hypotheses 1 and 2, which proposed that workers in low-authority, low-skill jobs would have higher exposure to work-related insecurity than their counterparts in high-authority, high-skill jobs. Also, in support of hypothesis 3, the analysis showed a mono- tonic increase in exposure to work-related insecurity across the occupational hierarchy from low-skill, low-authority jobs to high-skill, high-authority jobs. One exception was among managerial employees, who reported longer periods of exposure to union protection insecurity compared to their counterparts in non- managerial positions. Prior studies have reported similar findings,5,43 which are likely attributable to the fact that managerial employees are mostly excluded from collective agreements. Results from the multilevel growth models provided some support for hypothesis 4. Aspects of work-related insecurity predictive of self-rated health outcomes were as follows: work-life balance insecurity, earnings insecurity, earnings-mobility insecurity, job-mobility insecurity, and union protection insecu- rity, although the significance, magnitude, and direction of the effect varied by occupational group. Results from the cumulative impact model show associa- tions in the expected direction (i.e., a negative impact on self-rated health) for exposure to earnings insecurity (among low- and semi-skilled workers); work-life balance insecurity (low-skill workers); union protection insecurity (skilled super- visory workers); and job-mobility insecurity (skilled managers). The effect of unpaid overtime hours on low-skilled workers was particularly adverse, with this group experiencing a 66% decline in self-rated health each year of exposure. This finding dovetails other studies that demonstrate the vulnerability of low- skilled workers to violations of employment standards particularly with respect to uncompensated work and overtime hours.44,45 20 International Journal of Health Services 0(0)
  • 21. The model for linear change revealed a negative association between self-rated health and year-to-year increases in work-life balance insecurity (low-skill work- ers), job mobility insecurity, union protection insecurity (semi-skilled supervisors), and job mobility insecurity (low-skill managers). The adverse effect of a lack of job advancement among supervisory and managerial employees corroborates prior studies that show that economic pressures on organizations to restructure or de- layer hierarchies can result in job and status losses in these groups.46,47 Some of the findings from the analysis were counterintuitive and warrant discussion. First, semi-skilled workers who experienced a loss in union protec- tion – due to reasons such as job change or a lapse in collective agreement – reported improvements in self-rated health on average. In addition, low-skilled supervisory employees reported increases in self-rated health subsequent to losses in earnings security or extended health coverage. This finding may be explained, in part, by prior work that has demonstrated that exposure to short-term stressors can actually boost immune system function and enhance adaptive coping behaviors.48,49 While this evidence appears to contradict studies that demonstrate an association between chronic stress and disorders of emo- tional and psychological health, and pathophysiology via neural, cardiovascu- lar, autonomic, immune, and metabolic systems,48 it is possible that for some workers certain changes in job circumstances are associated with a temporary increase in psychological adaptivity and well-being that manifest in positive, ephemeral changes in self-rated health. A better understanding of these relation- ships requires further research into the perceptions of workers who experience work-related insecurity to evaluate how the onset of certain aspects of insecurity might impact self-rated health in the short-term. Hypothesis 5 stated that different patterns of exposure to work-related insecurity across occupational status groups would give rise to differences in the proportion of variance explained by the fully specified model. Calculation of the pseudo-R2 statistic for the multilevel models found that exposures to work- related insecurity accounted for twice the amount of variation in initial self- rated health for workers compared to both supervisors and managers. The model for linear change showed that the addition of the level 2 work-related insecurity covariates improved the predictive ability of the model to 9% for both workers and supervisors compared to just 3% in the managerial group. These findings are consistent with the central proposition of the present study, which states that occupational gradients in health are due in part to differences in exposure to work-related insecurity across the occupational status hierarchy. The strength of the study’s method lends credence to its findings. The dura- tion of the panel coupled with the detailed inquiry into labor-market experiences provided a rich data source for addressing the research questions. In addition, the application of multiple methods to control for reverse causality provides greater confidence that the results are not attributable to the selection of unhealthy individuals into insecure work experiences. In particular, the Scott-Marshall 21
  • 22. temporal separation of the explanatory variables from the outcome measure represents a substantial advancement compared to studies that rely on a cross-sectional approach. Two limitations of this study may contribute to the modest evidence found in support of the hypotheses. One limitation is that measures of work-related inse- curity lacked information on individuals’ perceptions of their work circumstan- ces. As work-related insecurity is conceived as a stressor, a central element of the stress experience is the meaning individuals ascribe to events that precipitates stress reactivity. It is possible that mitigating factors could render some individ- uals mostly inured to precarious work circumstances; for example, familial wealth may sufficiently underwrite the financial risks typically associated with low-wage, insecure work. Future investigations into the health impacts of work-related insecurity should account for both the structural elements that make up job quality as well as individuals’ perceptions of these elements based on their personal cir- cumstances. Such an approach could provide a broader, “person-in-context”50 representation of the nature and consequences of employment experiences. A second limitation of the present study is that the data source lacks indicators of mental and emotional health and well-being, such as depression, self-esteem, and job satisfaction. These measures have been found to be more highly – or at least more immediately – affected by work experiences than physical health.25 Limitations notwithstanding, the present study contributes to a growing body of evidence that demonstrates the adverse effects of insecure work experiences on health. A key contribution from this study is the finding that work-related inse- curity constitutes a significant health risk across the full spectrum of work arrangements, including employees who work under contracts that are nominally secure. Furthermore, by demonstrating that exposure and vulnerability to work- related insecurity is shaped by occupational position, the study provides another layer of evidence to the social patterning of adverse employment experiences which shows that work stressors are distributed according to the major axes of social stratification (i.e., age, gender, race, and socioeconomic class).1,4,29 Going forward, the development of effective health promotion interventions that can modify work-related health gradients must work to mitigate the risk of exposure to adverse work circumstances that is systemic to occupational hierarchies. Acknowledgments The author wishes to acknowledge Ontario’s Institute for Work Health for its assis- tance with access to the datasource used in this project. Declaration of Conflicting Interests The author declared no potential conflicts of interest with respect to the research, author- ship, and/or publication of this article. 22 International Journal of Health Services 0(0)
  • 23. Funding The author received no financial support for the research, authorship, and/or publication of this article. ORCID iD Heather Scott-Marshall http://orcid.org/0000-0003-3186-3987 References 1. Scott-Marshall H. The social patterning of work-related insecurity and its health consequences. Social Indic Res. 2010; 96: 313–337. 2. McDonough P, Walters V, Strohschein L. Chronic stress and the social patterning of women’s health in Canada. Soc Sci Med. 2002; 54: 767–782. 3. Borrell C, Muntaner C, Benach J, Artazcoz L. Social class and self-reported health status among men and women: what is the role of work organisation, household material standards and household labour? Soc Sci Med. 2004; 58: 1869–1887. 4. Muntaner C, Borrell C, Sola J, et al. Capitalists, managers, professionals and mor- tality: findings from the Barcelona social class and all cause mortality longitudinal study. Scand J Public Health. 2009; 37: 826–838. 5. Scott-Marshall H. Work-related insecurity in the new economy: evaluating the con- sequences for health. Res Polit Sociol. 2007; 16: 21–60. 6. Wright EO. Class Counts: Comparative Studies in Class Analysis. Cambridge, England: Cambridge University Press; 2000. 7. Rubin BA. Shifts in the Social Contract: Understanding Change in American Society. Thousand Oaks, CA: Pine Forge Press; 1996. 8. Osterman P. Securing Prosperity – The American Labour Market: How It Has Changed And What To Do About It. Princeton, NJ: Princeton University Press; 1999. 9. Palmer BD. Working-Class Experience: Rethinking the History of Canadian Labour. Toronto, Canada: McClelland Stewart Inc.; 1992. 10. Statistics Canada. Table 14100041. Labour force survey estimates (LFS), by actual hours worked, class of worker, National Occupational Classification for Statistics (NOC-S) and sex, annual. 2018. 11. Statistics Canada. Table 14100029 – Part-time employment by reason, annual; 2018 12. Statistics Canada. Table 14100072 – Job permanency (permanent and temporary) by industry, annual; 2018 13. Statistics Canada. Table 1410010301 – Average full-time hourly wage paid and pay- roll employment by type of work, industry and occupation; 2016. 14. Statistics Canada. Wages by occupation. The Daily. June 15, 2016. https://www150. statcan.gc.ca/n1/daily-quotidien/180626/dq180626a-eng.htm 15. Bidwell M, Briscoe F, Fernandez-Mateo I, Sterling A. The employment relationship and inequality: how and why changes in employment practices are reshaping rewards in organizations. Acad Manage Ann. 2017; 7(1): 61–121. 16. Drolet M, Morisette R. New Facts on Pension Coverage in Canada. Ottawa, Canada: Statistics Canada; 2014. https://www150.statcan.gc.ca/n1/pub/75-006-x/2014001/arti cle/14120-eng.htm Scott-Marshall 23
  • 24. 17. Barnes S, Abban V, Weiss A. Low Wages, No Benefits: Expanding Access to Health Benefits for Low Income Ontarians. Toronto, Canada: The Wellesley Institute; 2015. 18. Stewart N. Benefits Benchmarking Survey. Ottawa, Canada: The Conference Board of Canada; 2015. 19. Statistics Canada. Unionization rates falling. The Daily. September 2016. https:// www150.statcan.gc.ca/n1/pub/11-630-x/11-630-x2015005-eng.htm 20. Western B, Rosenfeld J. Unions, norms and the rise in US wage inequality. Am Soc Rev. 2011; 76(4): 513–537. 21. Scott-Marshall H, Tompa E. The health consequences of precarious employment experiences. Work. 2011; 38: 369–382. 22. Kelliher C, Anderson D. Doing more with less? Flexible working practices and the intensification of work. Hum Relat. 2010; 63(1): 83–106. 23. Angus Reid Institute. Overtime Among Canadian Employees. Vancouver, Canada: Angus Reid Institute; 2015. 24. Statistics Canada. Average Weekly Hours of Overtime Worked by Employees in Canada in 2017, By Permanent Status. Ottawa, Canada: Statistics Canada; 2017. 25. Sverke M, Hellgren J, Naswall K. No security: a meta-analysis and review of job insecurity and its consequences. J Occup Health Psychol. 2002; 7: 242–264. 26. Lászl oa KD, Pikhart H, Kopp MS, et al. Job insecurity and health: a study of 16 European countries. Soc Sci Med. 2010; 70(6): 867–874. 27. Marmot M, Ferrie J, Newman K, Stansfeld S. The Contribution of Job Insecurity to Socio- Economic Inequalities. Lancaster, England: Economic Social Research Council; 2001. 28. Ferrie J, Shipley M, Stansfeld S, Davey Smith G, Marmot M. Future uncertainty and socio-economic inequalities in health: the Whitehall II study. Soc Sci Med. 2003; 57(4): 637–646. 29. Scott-Marshall H, Tompa E, Trevithick S. The social patterning of underemploy- ment and its health consequences. Int J Contemp Sociol. 2007; 44(1): 7–34. 30. Turner RJ, Avison WR. Status variations in stress exposure: implications for the interpretation of research on race, socioeconomic status, and gender. J Health Soc Behav. 2003; 44(4): 488–505. 31. Marmot M, Stansfeld S, Patel C, et al. Health inequalities among British civil serv- ants: the Whitehall II study. Lancet. 1991; 337(8754): 1387–1393. 32. Ferrie J, Shipley M, Newman K, Stansfeld S, Marmot M. Self-reported job insecurity and health in the Whitehall II study: potential explanations of the relationship. Soc Sci Med. 2004; 60(7): 1593–1602. 33. Cott CA, Gignac MA, Badley EM. Determinants of self-rated health for Canadians with chronic disease and disability. J Epidemiol Commun Health. 1999; 53: 731–736. 34. Krause NM, Jay GM. What do global self-rated health items measure? Med Care. 1994; 32: 930–942. 35. Human Resources Development Canada. National Occupational Classification. http://www23.hrdc-drhc.gc.ca/2001/e/tutorial/intro.shtml. Published 2001. Accessed February 9, 2019. 36. Statistics Canada. Table 14100063 - Employee wages by industry, monthly, unad- justed for seasonality, monthly; 2018. 37. Singer JD, Willett JB. Applied Longitudinal Data Analysis. New York, NY: Oxford University Press; 2003. 24 International Journal of Health Services 0(0)
  • 25. 38. Diggle PJ, Heagerty P, Liang K, Zeger SL. Analysis of Longitudinal Data. Oxford, England: Oxford University Press; 2002. 39. Collins LM, Sayer AG. Modeling growth and change processes: design measurement, and analysis for research in social psychology. In: HT Reis, CM Judd, eds. Handbook of Research Methods in Social and Personality Psychology. Cambridge, England: Cambridge University Press; 2000. 40. McDonough P, Berglund P. Histories of poverty and self-rated health trajectories. J Health Soc Behav. 2003; 44(2): 198–214. 41. Crossley TF, Kennedy S. The reliability of self-assessed health status. J. Health Econ. 2002; 21(4): 643–658. 42. Horney J, Osgoode W, Marshall IH. Criminal careers in the short-term: Intra-indi- vudal variability in crime and its relation to local life circumstances. Am Soc Rev. 1995; 60(5): 655–673. 43. Tompa E, Scott-Marshall H, Fang M. The impact of temporary employment and job tenure on work-related sickness absence. Occup Environ Med. 2008; 65(12): 801–807. 44. Gallatly M. Unpaid Wages, Unprotected Workers: A Survey of Employment Standards Violations. Ontario, Canada: Workers’ Action Centre 2011. 45. Delp L, Wallace SP, Geiger-Brown J, Muntaner C. Job stress and job satisfaction: home care workers in a consumer-directed model of care. Health Serv Res. 2010; 45(4): 922–940. 46. Thomas R, Dunkerly D. Careering downwards? Middle managers’ experiences in the downsized organization. Br J Manage. 2002; 10(2): 157–169. 47. McCann L, Hassard J, Morris J. Restructuring of managerial labour in the USA, the UK and Japan: challenging the salience of ‘varieties of capitalism’. Br J Indus Relat. 2010; 48(2): 347–374. 48. McEwan BS. Central effects of stress hormones in health and disease: understanding the protective and damaging effects of stress and stress mediators. Eur J Pharmacol. 2008; 583(2–3): 174–185. 49. Mohd RS. Life events, stress and health. Malays J Med Sci. 2008; 15(4): 9–18. 50. Tompa E, Scott-Marshall H, Dolinschi R, Trevithick S, Bhattacharyya S. Precarious employment experiences and their health consequences: towards a theoretical frame- work. Work. 2007; 28(3): 209–224. Author Biography Heather Scott-Marshall holds a PhD in public health sciences from the University of Toronto. Her background is in the political economy of occupa- tional health with a focus on the health consequences of precarious employment experiences. She has published several articles on changes to work arising from economic globalization and the consequences for worker well-being. She has held positions as postdoctoral fellow at the Social Sciences and Humanities Research Council and associate scientist at Ontario’s Institute for Work and Health. She currently holds an appointment as adjunct professor in the Dalla Lana School of Public Health, Social and Behavioural Sciences Division, at the University of Toronto. She is also the president of Mission Research, a market research firm located in Toronto that provides a range of research services to clients in the public, private, and not-for-profit sectors. Scott-Marshall 25