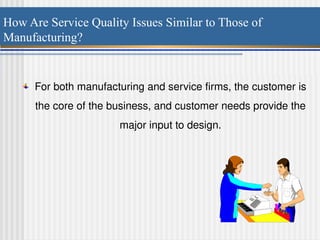
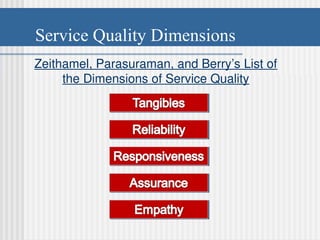
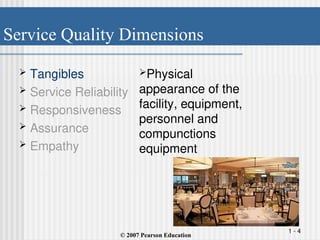
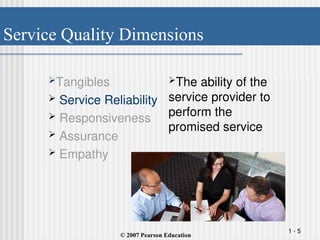
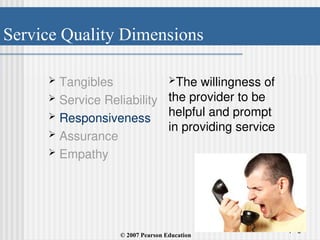
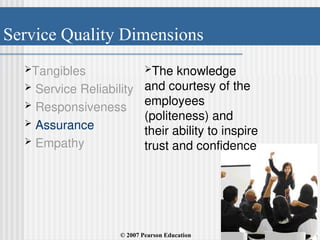
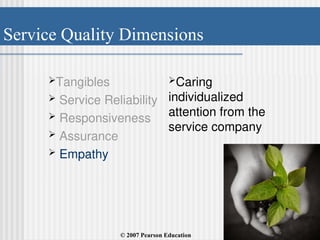
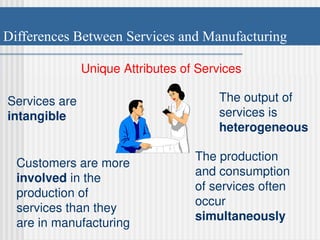
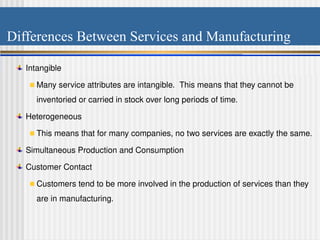
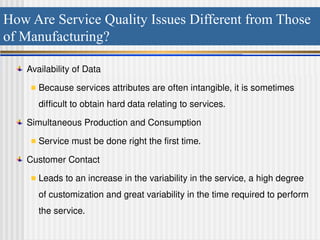
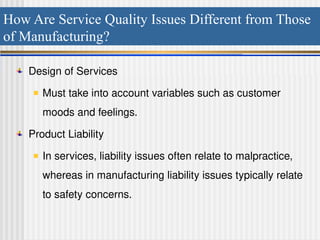
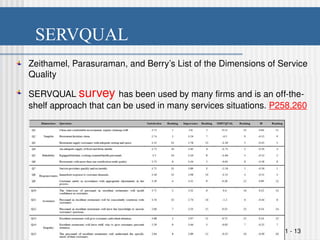
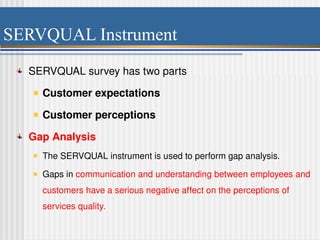
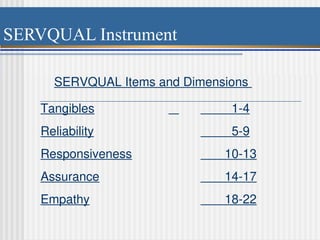
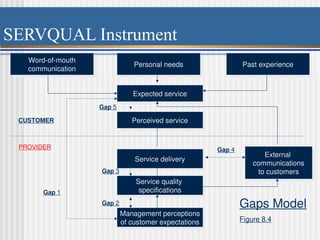
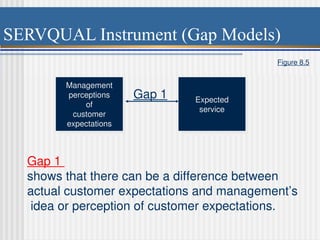
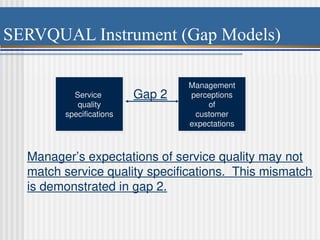
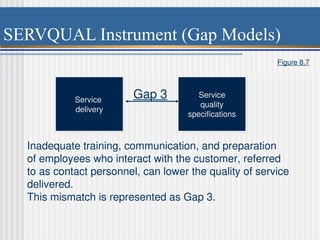
Chapter 8
Chapter 8
Designing Quality Services
1
Managing Quality
Integrating the Supply Chain
S. Thomas Foster
How Are Service Quality Issues Similar to Those of
Manufacturing?
For both manufacturing and service firms, the customer is
the core of the business, and customer needs provide the
major input to design.
Zeithamel, Parasuraman, and Berry’s List of
the Dimensions of Service Quality
Service Quality Dimensions
1 - 4
 Tangibles
 Service Reliability
 Responsiveness
 Assurance
 Empathy
Physical
appearance of the
facility, equipment,
personnel and
compunctions
equipment
© 2007 Pearson Education
Service Quality Dimensions
1 - 5
Tangibles
 Service Reliability
 Responsiveness
 Assurance
 Empathy
The ability of the
service provider to
perform the
promised service
© 2007 Pearson Education
Service Quality Dimensions
1 - 6
 Tangibles
 Service Reliability
 Responsiveness
 Assurance
 Empathy
The willingness of
the provider to be
helpful and prompt
in providing service
© 2007 Pearson Education
Service Quality Dimensions
1 - 7
© 2007 Pearson Education
Tangibles
 Service Reliability
 Responsiveness
 Assurance
 Empathy
The knowledge
and courtesy of the
employees
(politeness) and
their ability to inspire
trust and confidence
Service Quality Dimensions
1 - 8
Tangibles
 Service Reliability
 Responsiveness
 Assurance
 Empathy
Caring
individualized
attention from the
service company
© 2007 Pearson Education
Differences Between Services and Manufacturing
Unique Attributes of Services
Services are
intangible
The output of
services is
heterogeneous
The production
and consumption
of services often
occur
simultaneously
Customers are more
involved in the
production of
services than they
are in manufacturing
Differences Between Services and Manufacturing
Intangible
Many service attributes are intangible. This means that they cannot be
inventoried or carried in stock over long periods of time.
Heterogeneous
This means that for many companies, no two services are exactly the same.
Simultaneous Production and Consumption
Customer Contact
Customers tend to be more involved in the production of services than they
are in manufacturing.
How Are Service Quality Issues Different from Those
of Manufacturing?
Availability of Data
Because services attributes are often intangible, it is sometimes
difficult to obtain hard data relating to services.
Simultaneous Production and Consumption
Service must be done right the first time.
Customer Contact
Leads to an increase in the variability in the service, a high degree
of customization and great variability in the time required to perform
the service.
How Are Service Quality Issues Different from Those
of Manufacturing?
Design of Services
Must take into account variables such as customer
moods and feelings.
Product Liability
In services, liability issues often relate to malpractice,
whereas in manufacturing liability issues typically relate
to safety concerns.
SERVQUAL
Zeithamel, Parasuraman, and Berry’s List of the Dimensions of Service
Quality
SERVQUAL survey has been used by many firms and is an off-the-
shelf approach that can be used in many services situations. P258,260
1 - 13
Advantages of SERVQUAL
Accepted as a standard for assessing different dimensions of
services quality.
Shown to be valid for a number of different service situations.
Demonstrated to be reliable, meaning that different readers interpret
the questions similarly.
Only has 22 items making it thrifty. It can be filled out quickly by
customers and employees.
Has a standardized analysis procedure to aid interpretation and
results.
1 - 14
SERVQUAL Instrument
SERVQUAL survey has two parts
Customer expectations
Customer perceptions
Gap Analysis
The SERVQUAL instrument is used to perform gap analysis.
Gaps in communication and understanding between employees and
customers have a serious negative affect on the perceptions of
services quality.
SERVQUAL Instrument
SERVQUAL Items and Dimensions
Tangibles 1-4
Reliability 5-9
Responsiveness 10-13
Assurance 14-17
Empathy 18-22
SERVQUAL Instrument
Management perceptions
of customer expectations
Service quality
specifications
Service delivery
Perceived service
Expected service
Personal needs Past experience
Word-of-mouth
communication
External
communications
to customers
CUSTOMER
PROVIDER Gap 4
Gap 1
Gap 2
Gap 3
Gap 5
Gaps Model
Figure 8.4
SERVQUAL Instrument (Gap Models)
Management
perceptions
of
customer
expectations
Expected
service
Gap 1
Gap 1
shows that there can be a difference between
actual customer expectations and management’s
idea or perception of customer expectations.
Figure 8.5
SERVQUAL Instrument (Gap Models)
Service
quality
specifications
Management
perceptions
of
customer
expectations
Gap 2
Manager’s expectations of service quality may not
match service quality specifications. This mismatch
is demonstrated in gap 2.
SERVQUAL Instrument (Gap Models)
Service
delivery
Service
quality
specifications
Gap 3
Inadequate training, communication, and preparation
of employees who interact with the customer, referred
to as contact personnel, can lower the quality of service
delivered.
This mismatch is represented as Gap 3.
Figure 8.7
SERVQUAL Instrument (Gap Models)
Service
delivery
External
communications
to customers
Gap 4
Gap 4 shows the differences between services
delivery and external communications
with the customer.
Figure 8.8
SERVQUAL Instrument (Gap Models)
Expected
service
Perceived
service
Gap 5
Gap 5 is the difference between perceived and expected
services.
The key to closing this gap is to first close gaps 1 through 4
through thoughtful system design, careful communication
with the customer, and a workforce trained to provide
consistently outstanding customer service.
Figure 8.9
Assessing differences in Expectation and
Perception by using the differencing Techniques
Select a service (bank, restaurant, education, hosptial….)
Sample size 50< n<100
The customer rates perceptions and expectations
Determine average perceptions
Determine average expections
Determine the difference
Identify Gaps
Area of Improvement
1 - 23

ServQual for quality management in supply.ppt

  • 1.
    Chapter 8 Chapter 8 DesigningQuality Services Designing Quality Services 1 Managing Quality Integrating the Supply Chain S. Thomas Foster
  • 2.
    How Are ServiceQuality Issues Similar to Those of Manufacturing? For both manufacturing and service firms, the customer is the core of the business, and customer needs provide the major input to design.
  • 3.
    Zeithamel, Parasuraman, andBerry’s List of the Dimensions of Service Quality Service Quality Dimensions
  • 4.
    Service Quality Dimensions 1- 4  Tangibles  Service Reliability  Responsiveness  Assurance  Empathy Physical appearance of the facility, equipment, personnel and compunctions equipment © 2007 Pearson Education
  • 5.
    Service Quality Dimensions 1- 5 Tangibles  Service Reliability  Responsiveness  Assurance  Empathy The ability of the service provider to perform the promised service © 2007 Pearson Education
  • 6.
    Service Quality Dimensions 1- 6  Tangibles  Service Reliability  Responsiveness  Assurance  Empathy The willingness of the provider to be helpful and prompt in providing service © 2007 Pearson Education
  • 7.
    Service Quality Dimensions 1- 7 © 2007 Pearson Education Tangibles  Service Reliability  Responsiveness  Assurance  Empathy The knowledge and courtesy of the employees (politeness) and their ability to inspire trust and confidence
  • 8.
    Service Quality Dimensions 1- 8 Tangibles  Service Reliability  Responsiveness  Assurance  Empathy Caring individualized attention from the service company © 2007 Pearson Education
  • 9.
    Differences Between Servicesand Manufacturing Unique Attributes of Services Services are intangible The output of services is heterogeneous The production and consumption of services often occur simultaneously Customers are more involved in the production of services than they are in manufacturing
  • 10.
    Differences Between Servicesand Manufacturing Intangible Many service attributes are intangible. This means that they cannot be inventoried or carried in stock over long periods of time. Heterogeneous This means that for many companies, no two services are exactly the same. Simultaneous Production and Consumption Customer Contact Customers tend to be more involved in the production of services than they are in manufacturing.
  • 11.
    How Are ServiceQuality Issues Different from Those of Manufacturing? Availability of Data Because services attributes are often intangible, it is sometimes difficult to obtain hard data relating to services. Simultaneous Production and Consumption Service must be done right the first time. Customer Contact Leads to an increase in the variability in the service, a high degree of customization and great variability in the time required to perform the service.
  • 12.
    How Are ServiceQuality Issues Different from Those of Manufacturing? Design of Services Must take into account variables such as customer moods and feelings. Product Liability In services, liability issues often relate to malpractice, whereas in manufacturing liability issues typically relate to safety concerns.
  • 13.
    SERVQUAL Zeithamel, Parasuraman, andBerry’s List of the Dimensions of Service Quality SERVQUAL survey has been used by many firms and is an off-the- shelf approach that can be used in many services situations. P258,260 1 - 13
  • 14.
    Advantages of SERVQUAL Acceptedas a standard for assessing different dimensions of services quality. Shown to be valid for a number of different service situations. Demonstrated to be reliable, meaning that different readers interpret the questions similarly. Only has 22 items making it thrifty. It can be filled out quickly by customers and employees. Has a standardized analysis procedure to aid interpretation and results. 1 - 14
  • 15.
    SERVQUAL Instrument SERVQUAL surveyhas two parts Customer expectations Customer perceptions Gap Analysis The SERVQUAL instrument is used to perform gap analysis. Gaps in communication and understanding between employees and customers have a serious negative affect on the perceptions of services quality.
  • 16.
    SERVQUAL Instrument SERVQUAL Itemsand Dimensions Tangibles 1-4 Reliability 5-9 Responsiveness 10-13 Assurance 14-17 Empathy 18-22
  • 17.
    SERVQUAL Instrument Management perceptions ofcustomer expectations Service quality specifications Service delivery Perceived service Expected service Personal needs Past experience Word-of-mouth communication External communications to customers CUSTOMER PROVIDER Gap 4 Gap 1 Gap 2 Gap 3 Gap 5 Gaps Model Figure 8.4
  • 18.
    SERVQUAL Instrument (GapModels) Management perceptions of customer expectations Expected service Gap 1 Gap 1 shows that there can be a difference between actual customer expectations and management’s idea or perception of customer expectations. Figure 8.5
  • 19.
    SERVQUAL Instrument (GapModels) Service quality specifications Management perceptions of customer expectations Gap 2 Manager’s expectations of service quality may not match service quality specifications. This mismatch is demonstrated in gap 2.
  • 20.
    SERVQUAL Instrument (GapModels) Service delivery Service quality specifications Gap 3 Inadequate training, communication, and preparation of employees who interact with the customer, referred to as contact personnel, can lower the quality of service delivered. This mismatch is represented as Gap 3. Figure 8.7
  • 21.
    SERVQUAL Instrument (GapModels) Service delivery External communications to customers Gap 4 Gap 4 shows the differences between services delivery and external communications with the customer. Figure 8.8
  • 22.
    SERVQUAL Instrument (GapModels) Expected service Perceived service Gap 5 Gap 5 is the difference between perceived and expected services. The key to closing this gap is to first close gaps 1 through 4 through thoughtful system design, careful communication with the customer, and a workforce trained to provide consistently outstanding customer service. Figure 8.9
  • 23.
    Assessing differences inExpectation and Perception by using the differencing Techniques Select a service (bank, restaurant, education, hosptial….) Sample size 50< n<100 The customer rates perceptions and expectations Determine average perceptions Determine average expections Determine the difference Identify Gaps Area of Improvement 1 - 23