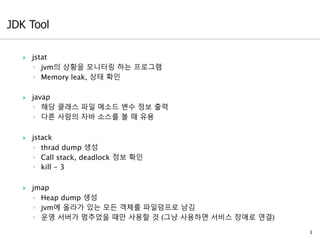
jstat
◦ jvm의상황을 모니터링 하는 프로그램
◦ Memory leak, 상태 확인
javap
◦ 해당 클래스 파일 메소드 변수 정보 출력
◦ 다른 사람의 자바 소스를 볼 때 유용
jstack
◦ thrad dump 생성
◦ Call stack, deadlock 정보 확인
◦ kill - 3
jmap
◦ Heap dump 생성
◦ jvm에 올라가 있는 모든 객체를 파일덤프로 남김
◦ 운영 서버가 멈추었을 때만 사용할 것 (그냥 사용하면 서비스 장애로 연결)
3
9
Profiling 정보는대개가 프로그램 최적화를 보조하기 위해 사용
프로그램의 성능, 메모리 사용량, 코드 커버리지 등을 확인 가능
많은 성능 저하를 발생시켜서 로컬 개발자 PC 및 개발 서버에서 사용해야 함
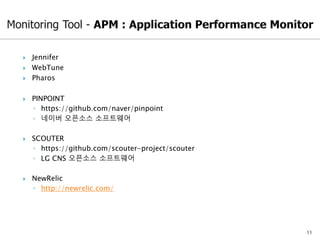
Profiling tool
◦ Jprofiler (ej-technologies)
◦ Java mission control
◦ YourKit
◦ Netbeans profiler
◦ XRebel
◦ DevPartner for Java
◦ Jprobe (Quest)
13
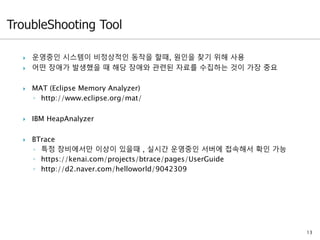
운영중인 시스템이비정상적인 동작을 할때, 원인을 찾기 위해 사용
어떤 장애가 발생했을 때 해당 장애와 관련된 자료를 수집하는 것이 가장 중요
MAT (Eclipse Memory Analyzer)
◦ http://www.eclipse.org/mat/
IBM HeapAnalyzer
BTrace
◦ 특정 장비에서만 이상이 있을때 , 실시간 운영중인 서버에 접속해서 확인 가능
◦ https://kenai.com/projects/btrace/pages/UserGuide
◦ http://d2.naver.com/helloworld/9042309
14.
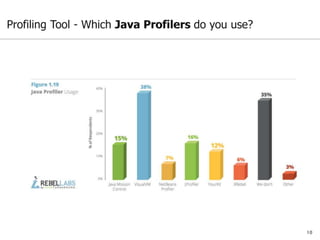
1. Top 5Java Profilers Revealed: Real world data with
VisualVM, JProfiler, Java Mission Control, YourKit and
Custom
tooling.(https://zeroturnaround.com/rebellabs/top-5-
java-profilers-revealed-real-world-data-with-visualvm-
jprofiler-java-mission-control-yourkit-and-custom-
tooling/)
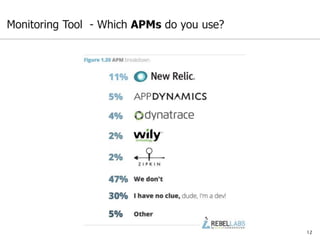
2. Java Tools and Technologies Landscape Report 2016
(https://zeroturnaround.com/rebellabs/java-tools-and-
technologies-landscape-2016/)
14
Editor's Notes
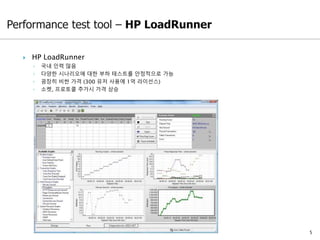
#5 어느 정도 틀이 갖춰진 조직이나, 예산이 충분한 경우에는 뒤도 안 돌아보고 파트너 불러다가 Load Runner돌린다.- 조대협 블로그에서.. -


![[Hello world 오픈세미나]n grinder helloworld발표자료_저작권free](https://cdn.slidesharecdn.com/ss_thumbnails/helloworldngrinderhelloworldfree-130717011906-phpapp01-thumbnail.jpg?width=640&height=640&fit=bounds)


![[오픈소스컨설팅]Java Performance Tuning](https://cdn.slidesharecdn.com/ss_thumbnails/javaperformanetuning-150408192031-conversion-gate01-thumbnail.jpg?width=640&height=640&fit=bounds)


![[D2] java 애플리케이션 트러블 슈팅 사례 & pinpoint](https://cdn.slidesharecdn.com/ss_thumbnails/d2javapinpoint-150522091509-lva1-app6891-thumbnail.jpg?width=640&height=640&fit=bounds)


![[오픈소스컨설팅]스카우터엑스 소개](https://cdn.slidesharecdn.com/ss_thumbnails/scouter-170208020005-thumbnail.jpg?width=640&height=640&fit=bounds)


![[2018] Java를 위한, Java에 의한 도구들](https://cdn.slidesharecdn.com/ss_thumbnails/webapp02-190201070214-thumbnail.jpg?width=640&height=640&fit=bounds)


![[오픈소스컨설팅] 스카우터 사용자 가이드 2020](https://cdn.slidesharecdn.com/ss_thumbnails/2020scouteruserguide-200122014357-thumbnail.jpg?width=640&height=640&fit=bounds)
![[213]monitoringwithscouter 이건희](https://cdn.slidesharecdn.com/ss_thumbnails/213monitoringwithscouter-161025011551-thumbnail.jpg?width=640&height=640&fit=bounds)


![[NDC2015] 언제 어디서나 프로파일링 가능한 코드네임 JYP 작성기 - 라이브 게임 배포 후에도 프로파일링 하기](https://cdn.slidesharecdn.com/ss_thumbnails/ndc2015jypv3-150529000151-lva1-app6892-thumbnail.jpg?width=640&height=640&fit=bounds)


![[경북] I'mcloud openlight](https://cdn.slidesharecdn.com/ss_thumbnails/imcloudopenlight-151105091914-lva1-app6891-thumbnail.jpg?width=640&height=640&fit=bounds)