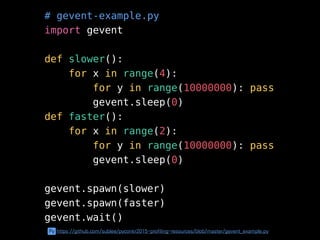
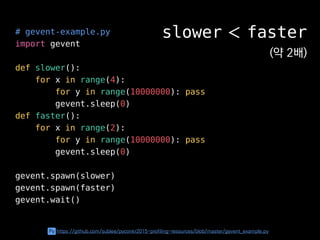
# gevent-example.py
import gevent
defslower():
for x in range(4):
for y in range(10000000): pass
gevent.sleep(0)
def faster():
for x in range(2):
for y in range(10000000): pass
gevent.sleep(0)
gevent.spawn(slower)
gevent.spawn(faster)
gevent.wait()
Py https://github.com/sublee/pyconkr2015-profiling-resources/blob/master/gevent_example.py
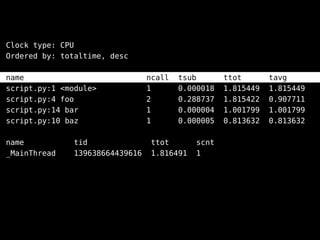
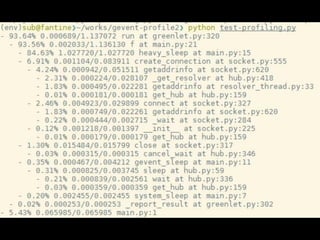
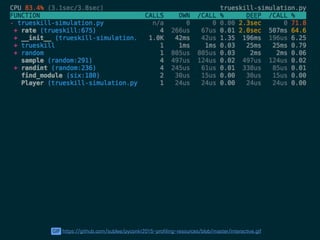
Clock type: CPU
Orderedby: totaltime, desc
name ncall tsub ttot tavg
script.py:1 <module> 1 0.000018 1.815449 1.815449
script.py:4 foo 2 0.288737 1.815422 0.907711
script.py:14 bar 1 0.000004 1.001799 1.001799
script.py:10 baz 1 0.000005 0.813632 0.813632
name tid ttot scnt
_MainThread 139638664439616 1.816491 1
38.
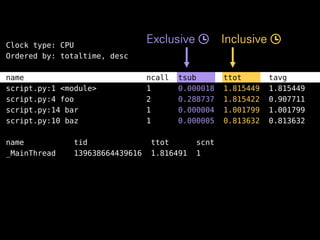
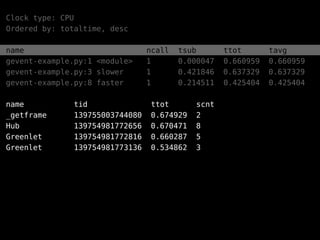
Clock type: CPU
Orderedby: totaltime, desc
name ncall tsub ttot tavg
script.py:1 <module> 1 0.000018 1.815449 1.815449
script.py:4 foo 2 0.288737 1.815422 0.907711
script.py:14 bar 1 0.000004 1.001799 1.001799
script.py:10 baz 1 0.000005 0.813632 0.813632
name tid ttot scnt
_MainThread 139638664439616 1.816491 1
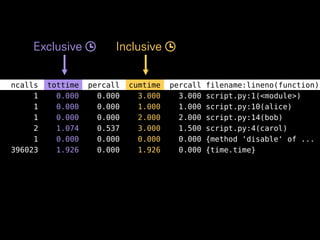
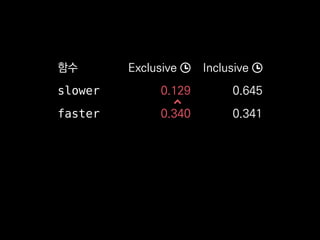
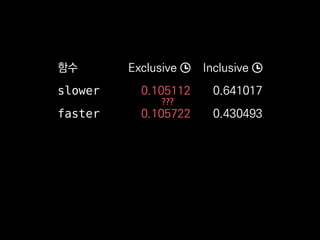
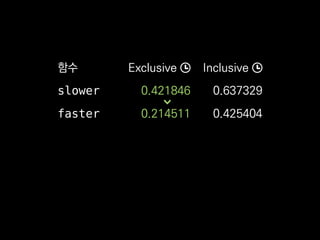
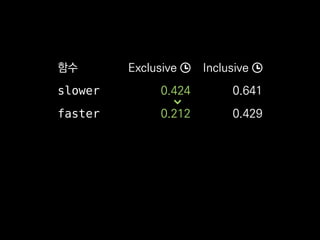
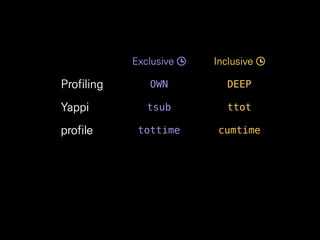
Exclusive Inclusive
39.
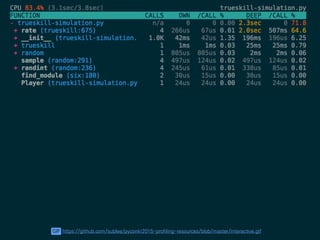
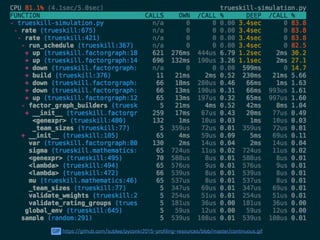
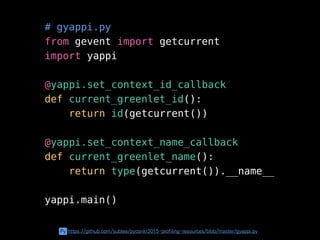
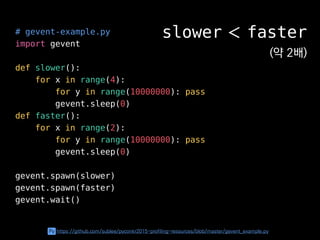
# gevent-example.py
import gevent
defslower():
for x in range(4):
for y in range(10000000): pass
gevent.sleep(0)
def faster():
for x in range(2):
for y in range(10000000): pass
gevent.sleep(0)
gevent.spawn(slower)
gevent.spawn(faster)
gevent.wait()
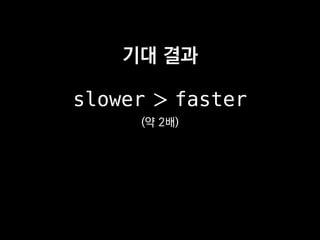
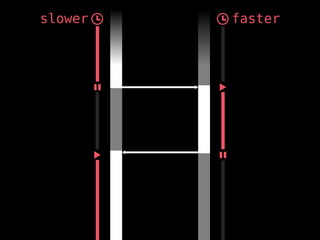
slower < faster
(약 2배)
Py https://github.com/sublee/pyconkr2015-profiling-resources/blob/master/gevent_example.py
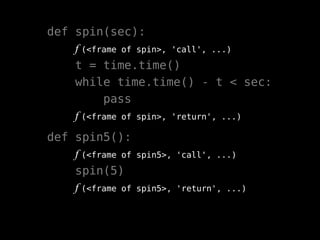
def spin(sec):
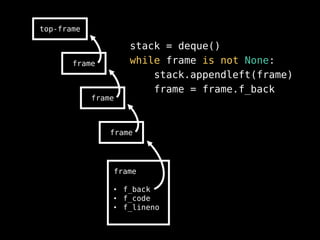
f (<frameof spin>, 'call', ...)
t = time.time()
while time.time() - t < sec:
pass
f (<frame of spin>, 'return', ...)
def spin5():
f (<frame of spin5>, 'call', ...)
spin(5)
f (<frame of spin5>, 'return', ...)
# gevent-example.py
import gevent
defslower():
for x in range(4):
for y in range(10000000): pass
gevent.sleep(0)
def faster():
for x in range(2):
for y in range(10000000): pass
gevent.sleep(0)
gevent.spawn(slower)
gevent.spawn(faster)
gevent.wait()
slower < faster
(약 2배)
Py https://github.com/sublee/pyconkr2015-profiling-resources/blob/master/gevent_example.py
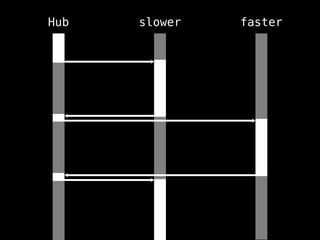
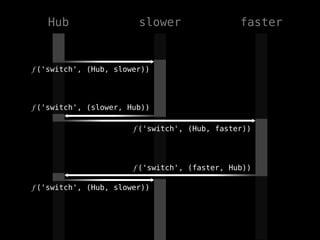
slowerHub faster
f ('switch',(Hub, slower))
f ('switch', (slower, Hub))
f ('switch', (Hub, faster))
f ('switch', (faster, Hub))
f ('switch', (Hub, slower))
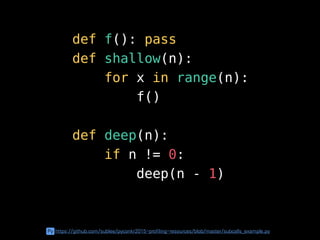
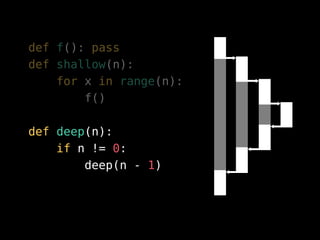
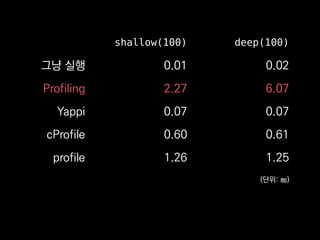
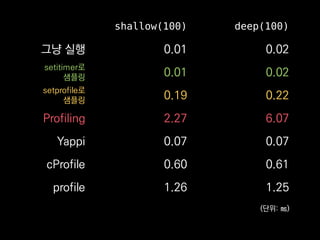
def f(): pass
defshallow(n):
for x in range(n):
f()
def deep(n):
if n != 0:
deep(n - 1)
Py https://github.com/sublee/pyconkr2015-profiling-resources/blob/master/subcalls_example.py
86.
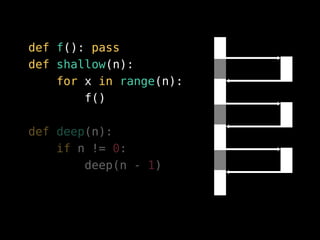
def f(): pass
defshallow(n):
for x in range(n):
f()
def deep(n):
if n != 0:
deep(n - 1)
87.
def f(): pass
defshallow(n):
for x in range(n):
f()
def deep(n):
if n != 0:
deep(n - 1)
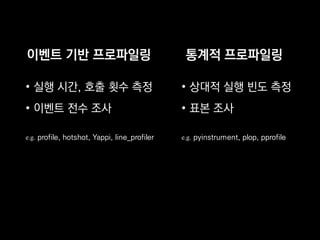
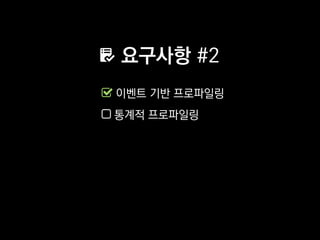
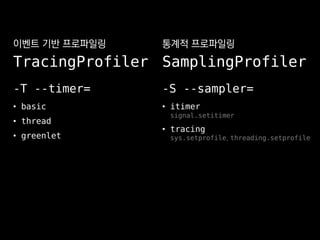
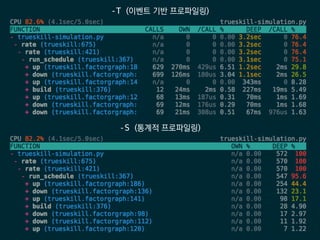
이벤트 기반 프로파일링
•실행 시간, 호출 횟수 측정
• 이벤트 전수 조사
e.g. profile, hotshot, Yappi, line_profiler
통계적 프로파일링
• 상대적 실행 빈도 측정
• 표본 조사
e.g. pyinstrument, plop, pprofile
92.
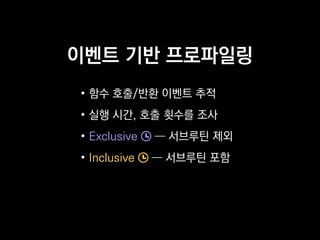
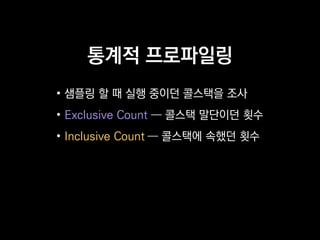
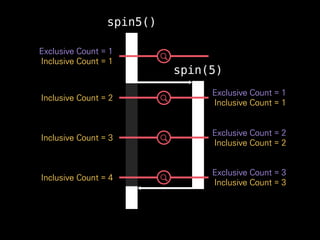
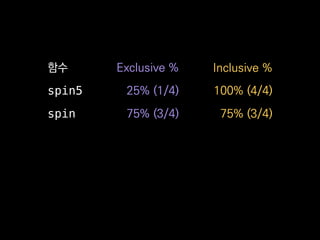
통계적 프로파일링
• 샘플링할 때 실행 중이던 콜스택을 조사
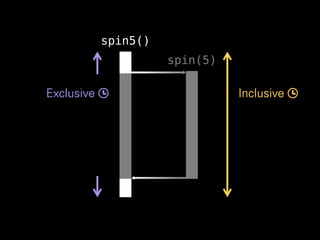
• Exclusive Count ― 콜스택 말단이던 횟수
• Inclusive Count ― 콜스택에 속했던 횟수
93.
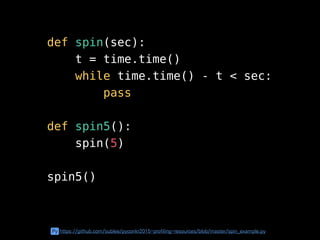
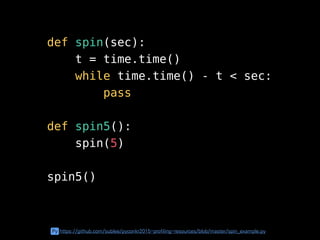
def spin(sec):
t =time.time()
while time.time() - t < sec:
pass
def spin5():
spin(5)
spin5()
Py https://github.com/sublee/pyconkr2015-profiling-resources/blob/master/spin_example.py
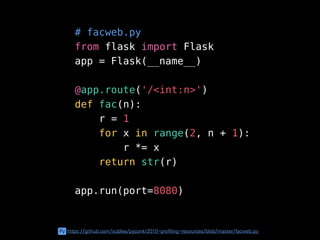
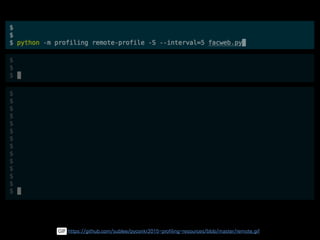
# facweb.py
from flaskimport Flask
app = Flask(__name__)
@app.route('/<int:n>')
def fac(n):
r = 1
for x in range(2, n + 1):
r *= x
return str(r)
app.run(port=8080)
Py https://github.com/sublee/pyconkr2015-profiling-resources/blob/master/facweb.py
그밖에
• <Profiling (computerprogramming)>
Wikipedia • http://goo.gl/qeblxo
• <What are Exclusive and Inclusive?>
Steve Carroll • http://goo.gl/KCysud
• <What are Exclusive and Inclusive?>
Steve Carroll • http://goo.gl/KCysud
• <Beginners Guide to Performance Profiling>
MSDN • https://goo.gl/f9Oej9
• <Profiling tools>
Alain Leufroy • https://goo.gl/YxcVWF
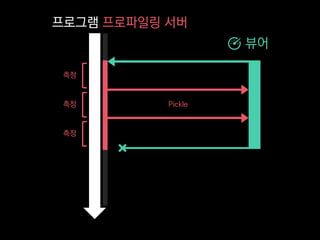
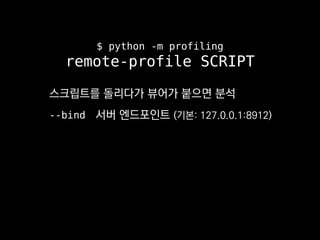
실시간으로 프로파일링 할때
갱신주기 내 함수 호출만 측정되나요?
네, 현재는 그렇습니다. 분명 갱신주기와 측정주기가 같아서 불편한
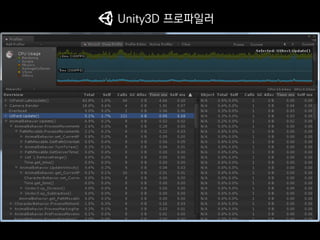
경우가 있는데요, Unity3D 프로파일러처럼 실시간 분석결과뿐 아니
라 과거의 분석결과도 탐색할 수 있게 해 해소할 계획입니다.
Q.
A.
130.
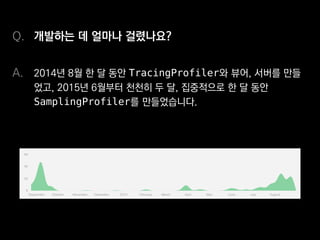
개발하는 데 얼마나걸렸나요?
2014년 8월 한 달 동안 TracingProfiler와 뷰어, 서버를 만들
었고, 2015년 6월부터 천천히 두 달, 집중적으로 한 달 동안
SamplingProfiler를 만들었습니다.
Q.
A.
131.
Python 3의 asyncio와호환되나요?
https://github.com/what-studio/profiling/issues/26
해당 이슈가 올라와 있지만, 아직 확인해보지 못했습니다.
Q.
A.
132.
분석결과에서 특정 함수를필터링할 수 있나요?
https://github.com/what-studio/profiling/issues/30
지금은 불가능하지만 마침 제안받은 게 있어 구현할 예정입니다.
Q.
A.
133.
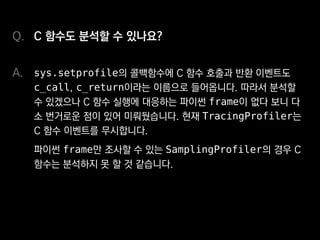
C 함수도 분석할수 있나요?
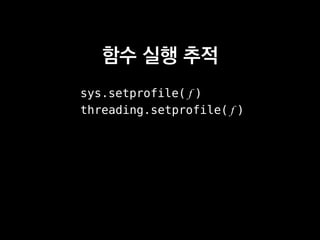
sys.setprofile의 콜백함수에 C 함수 호출과 반환 이벤트도
c_call, c_return이라는 이름으로 들어옵니다. 따라서 분석할
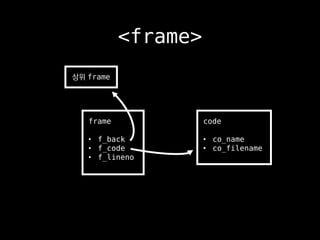
수 있겠으나 C 함수 실행에 대응하는 파이썬 frame이 없다 보니 다
소 번거로운 점이 있어 미뤄뒀습니다. 현재 TracingProfiler는
C 함수 이벤트를 무시합니다.
파이썬 frame만 조사할 수 있는 SamplingProfiler의 경우 C
함수는 분석하지 못할 것 같습니다.
Q.
A.
134.
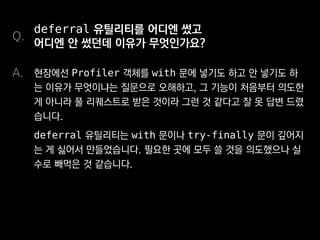
deferral 유틸리티를 어디엔썼고
어디엔 안 썼던데 이유가 무엇인가요?
현장에선 Profiler 객체를 with 문에 넣기도 하고 안 넣기도 하
는 이유가 무엇이냐는 질문으로 오해하고, 그 기능이 처음부터 의도한
게 아니라 풀 리퀘스트로 받은 것이라 그런 것 같다고 잘 못 답변 드렸
습니다.
deferral 유틸리티는 with 문이나 try-finally 문이 깊어지
는 게 싫어서 만들었습니다. 필요한 곳에 모두 쓸 것을 의도했으나 실
수로 빼먹은 것 같습니다.
Q.
A.
135.
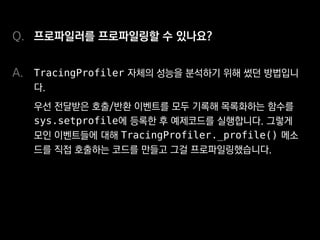
프로파일러를 프로파일링할 수있나요?
TracingProfiler 자체의 성능을 분석하기 위해 썼던 방법입니
다.
우선 전달받은 호출/반환 이벤트를 모두 기록해 목록화하는 함수를
sys.setprofile에 등록한 후 예제코드를 실행합니다. 그렇게
모인 이벤트들에 대해 TracingProfiler._profile() 메소
드를 직접 호출하는 코드를 만들고 그걸 프로파일링했습니다.
Q.
A.








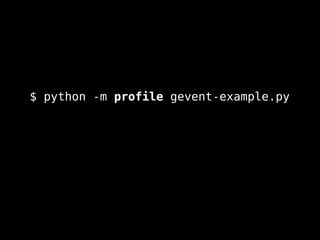
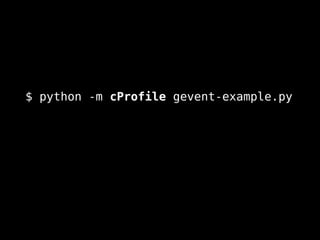
:
File ".../profile.py", line 283, in trace_dispatch_call
frame, frame.f_back)
AssertionError: ('Bad call', ('.../gevent/hub.py', 386, 'switch'), ...)](https://image.slidesharecdn.com/sublee-pyconkr2015-profiling-shared-150830185328-lva1-app6892/85/Profiling-30-320.jpg)









![H
J K
L
Q
^C
[ ]
종료
탐색 (포커스 이동)
접기/펼치기
정렬 기준 변경
갱신 중지/재개
조작법](https://image.slidesharecdn.com/sublee-pyconkr2015-profiling-shared-150830185328-lva1-app6892/85/Profiling-112-320.jpg)





![[0903 구경원] recast 네비메쉬](https://cdn.slidesharecdn.com/ss_thumbnails/0903recast-111221053315-phpapp01-thumbnail.jpg?width=640&height=640&fit=bounds)
![[야생의 땅: 듀랑고] 서버 아키텍처 Vol. 2 (자막)](https://cdn.slidesharecdn.com/ss_thumbnails/vol2-160427160825-thumbnail.jpg?width=640&height=640&fit=bounds)


![[야생의 땅: 듀랑고] 서버 아키텍처 - SPOF 없는 분산 MMORPG 서버](https://cdn.slidesharecdn.com/ss_thumbnails/public-140529222503-phpapp01-thumbnail.jpg?width=640&height=640&fit=bounds)


![[NDC2017] 딥러닝으로 게임 콘텐츠 제작하기 - VAE를 이용한 콘텐츠 생성 기법 연구 사례](https://cdn.slidesharecdn.com/ss_thumbnails/v072-170426075401-thumbnail.jpg?width=640&height=640&fit=bounds)


![[NDC 14] 가죽 장화를 먹게 해달라니 - <야생의>의 자유도 높은 아이템 시스템 구현](https://cdn.slidesharecdn.com/ss_thumbnails/random-140529034900-phpapp01-thumbnail.jpg?width=640&height=640&fit=bounds)


![[IGC 2017] 블루홀 최준혁 - '플레이어언노운스 배틀그라운드' DEV 스토리](https://cdn.slidesharecdn.com/ss_thumbnails/igcpubgdevstoryfinalforsharing-170906062941-thumbnail.jpg?width=640&height=640&fit=bounds)


![PyCon 2017 프로그래머가 이사하는 법 2 [천원경매]](https://cdn.slidesharecdn.com/ss_thumbnails/pycon20172-170813134610-thumbnail.jpg?width=640&height=640&fit=bounds)


![[야생의 땅: 듀랑고] 지형 관리 완전 자동화 - 생생한 AWS와 Docker 체험기](https://cdn.slidesharecdn.com/ss_thumbnails/ndc2016-160426115105-thumbnail.jpg?width=640&height=640&fit=bounds)


![[MGDC] 리눅스 게임 서버 성능 분석하기 - 아이펀팩토리 김진욱 CTO](https://cdn.slidesharecdn.com/ss_thumbnails/mgdcifunfactoryjinukkim-181018053904-thumbnail.jpg?width=640&height=640&fit=bounds)
![[NDC2015] 언제 어디서나 프로파일링 가능한 코드네임 JYP 작성기 - 라이브 게임 배포 후에도 프로파일링 하기](https://cdn.slidesharecdn.com/ss_thumbnails/ndc2015jypv3-150529000151-lva1-app6892-thumbnail.jpg?width=640&height=640&fit=bounds)
![[NDC08] 최적화와 프로파일링 - 송창규](https://cdn.slidesharecdn.com/ss_thumbnails/ndc08-130427235822-phpapp01-thumbnail.jpg?width=640&height=640&fit=bounds)


![[232] 성능어디까지쥐어짜봤니 송태웅](https://cdn.slidesharecdn.com/ss_thumbnails/232-161025013504-thumbnail.jpg?width=640&height=640&fit=bounds)


![[2B2]기계 친화성을 중심으로 접근한 최적화 기법](https://cdn.slidesharecdn.com/ss_thumbnails/2b2-140929202533-phpapp01-thumbnail.jpg?width=640&height=640&fit=bounds)
![[2014 CodeEngn Conference 11] 이경식 - 동적 추적 프레임워크를 이용한 OS X 바이너리 분석](https://cdn.slidesharecdn.com/ss_thumbnails/2014codeengnconference11dtrace-141202123836-conversion-gate01-thumbnail.jpg?width=640&height=640&fit=bounds)


