Download to read offline


![The Divorce Experience: A Study of Divorce at Midlife and Beyond, AARP, May 2004
‐ 23 ‐
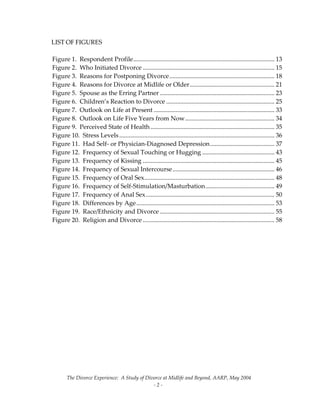
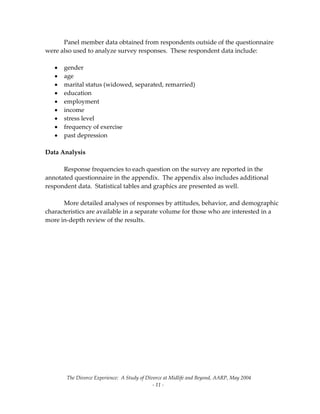
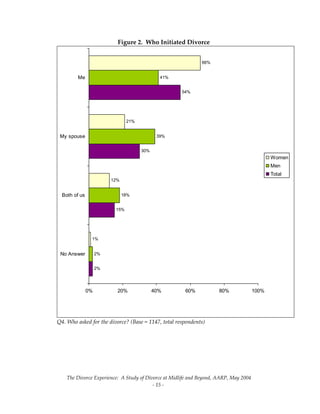
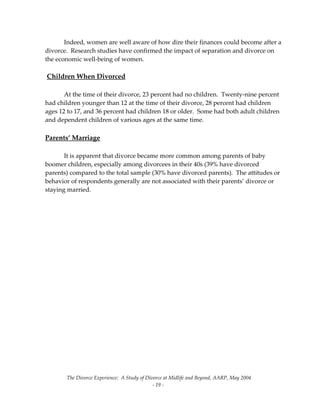
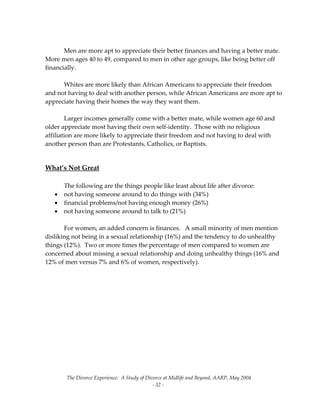
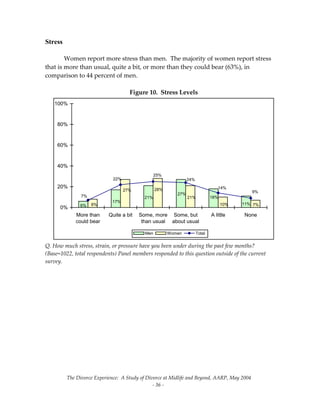
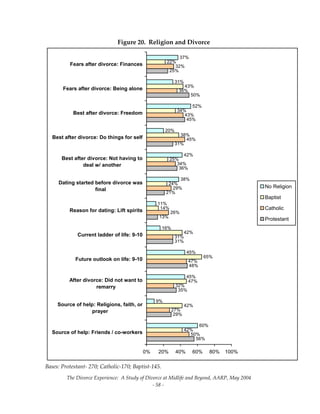
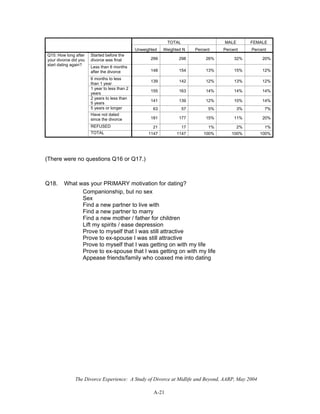
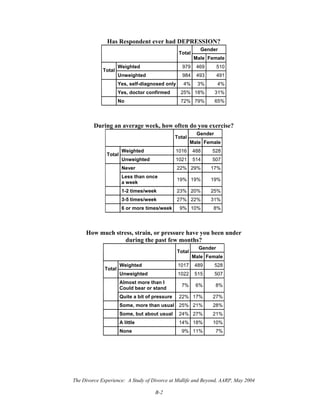
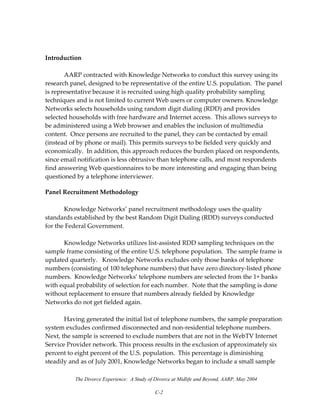
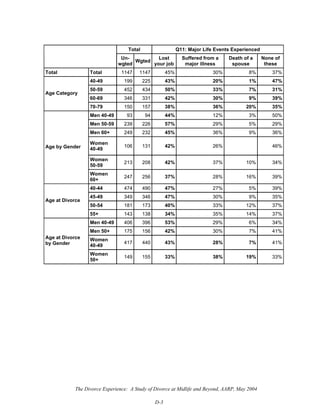
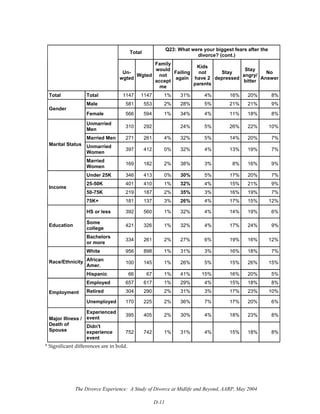
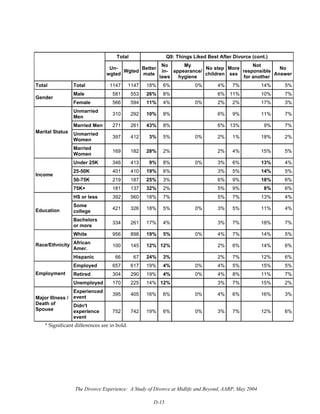
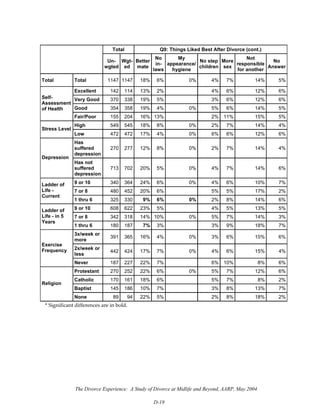
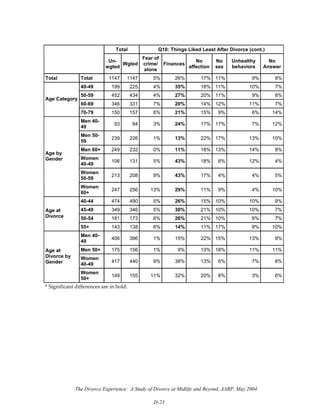
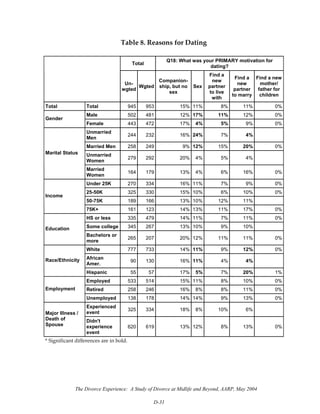
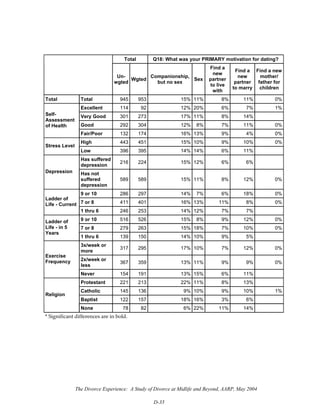
Figure 5. Spouse as the Erring Partner
(Percent Saying Reason Applied to Spouse)
29%
49%
77%
78%
83%
86%
28%
44%
46%
60%
72%
75%
30%
53%
92%
86%
88%
91%
0% 20% 40% 60% 80% 100%
Different values,
lifestyles
Money problems
Alcohol or drug
abuse
Verbal, physical, or
emotional abuse
Not carrying weight
Control freak
Women
Men
Total
Q3a‐g. For these top reasons, please indicate if the reason applied mostly to you, mostly to your
spouse, or to both of you equally. [Applied mostly to spouse] (Base = 154 to 378, respondents who
selected each reason.)](https://image.slidesharecdn.com/divorce-150221141831-conversion-gate02/85/Senior-Divorce-26-320.jpg)
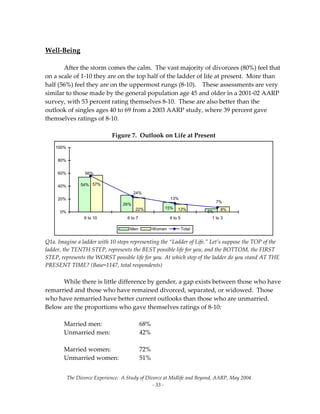
![The Divorce Experience: A Study of Divorce at Midlife and Beyond, AARP, May 2004
‐ 43 ‐
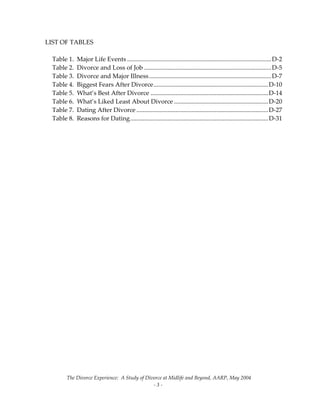
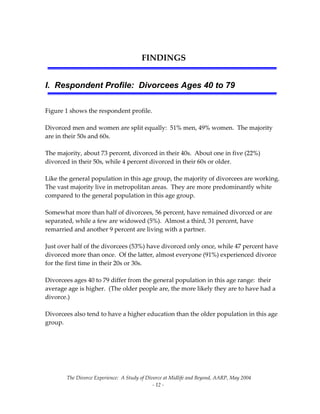
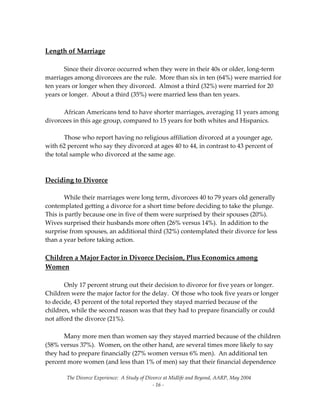
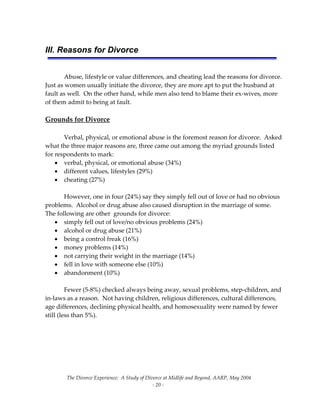
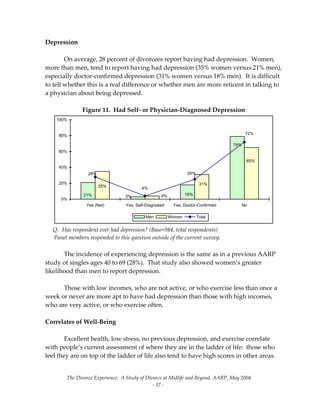
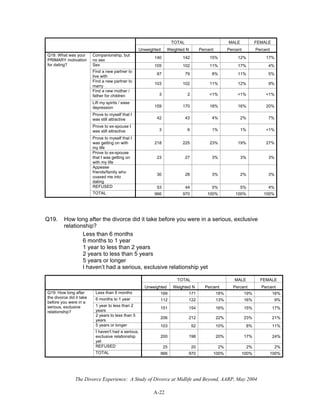
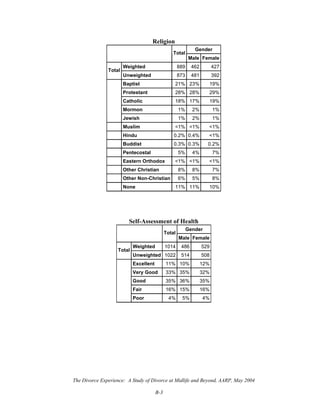
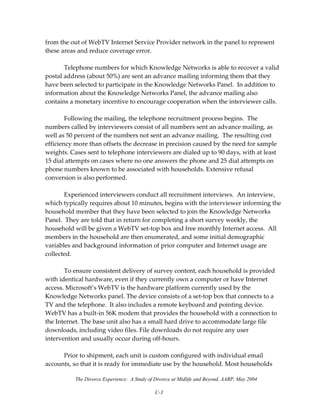
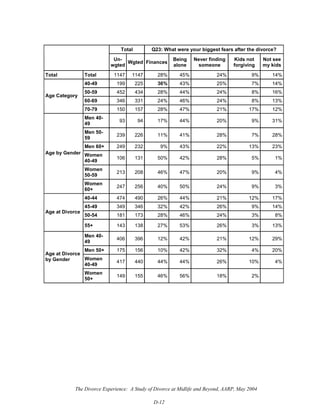
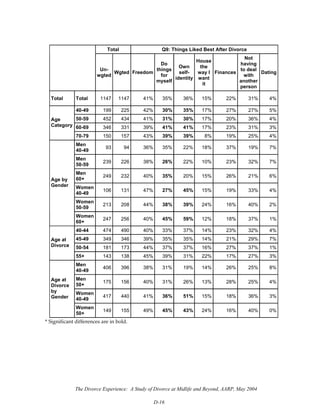
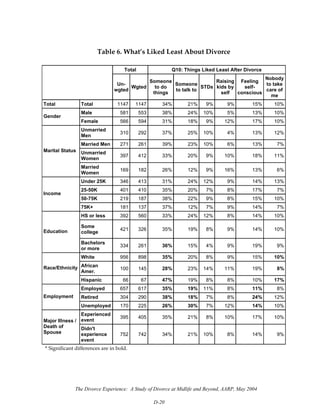
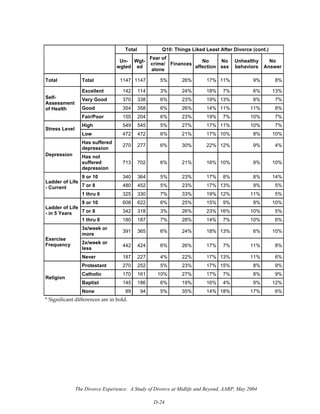
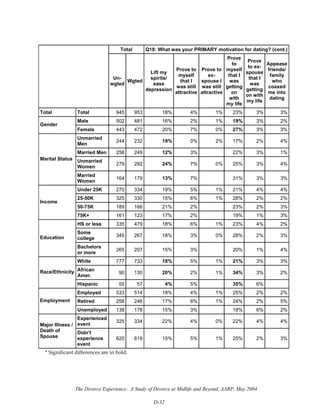
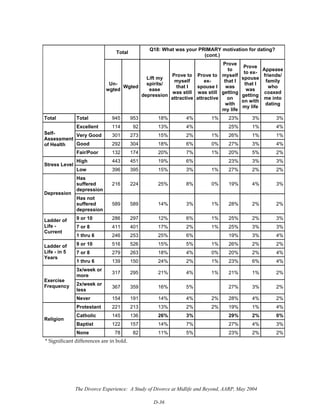
Figure 12. Frequency of Sexual Touching or Hugging
6%
38%
13%
8%
15%
20%
6%
39%
20%
13%
17%
5%
5%
69%
11%
4%
6%
4%
7%
7%
14%
6%
21%
45%
5%
10%
6%
9%
23%
47%
0% 20% 40% 60% 80% 100%
No answer
Not at all
Once or twice a month
About once a week
More than once a week
Daily
Women (Married/with partner)
Men (Married/with partner)
Women (Un-
Married/Separated/Widowed)
Men (Un-
Married/Separated/Widowed)
Total
Q31a‐f. During the past 6 months, how often, on average, have you engaged in [Sexual touching or
hugging]? (Base=1147, total respondents)](https://image.slidesharecdn.com/divorce-150221141831-conversion-gate02/85/Senior-Divorce-46-320.jpg)
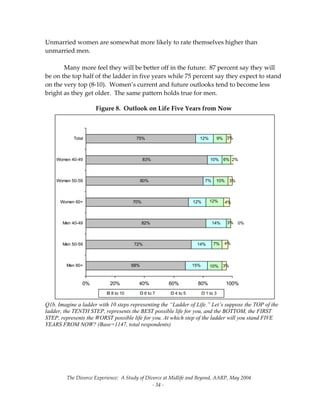
![The Divorce Experience: A Study of Divorce at Midlife and Beyond, AARP, May 2004
‐ 45 ‐
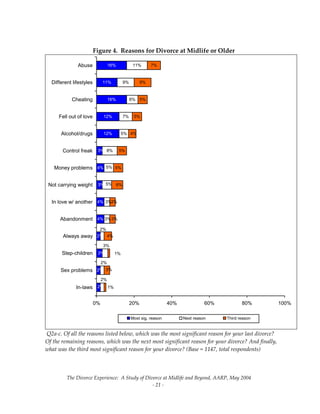
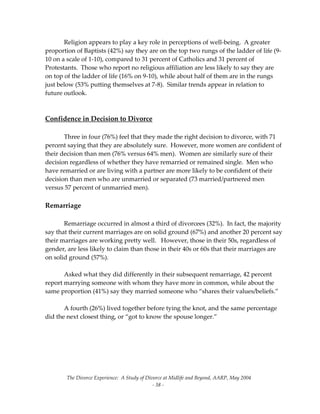
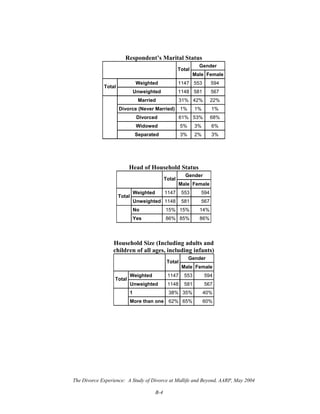
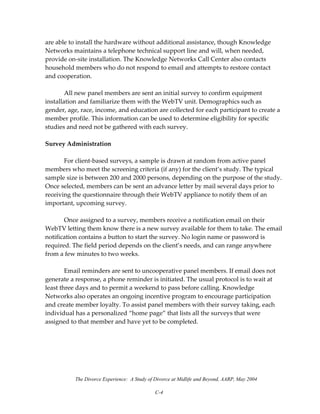
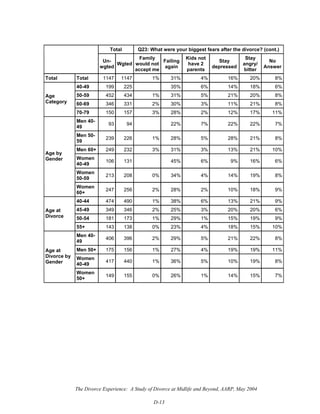
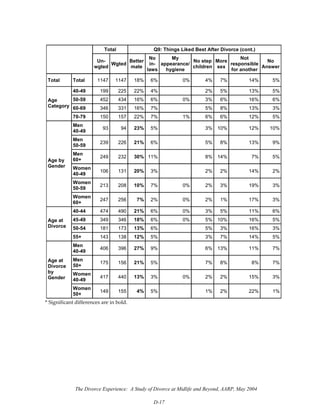
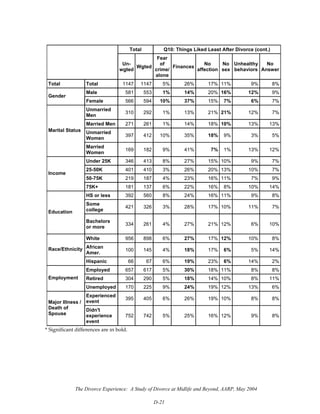
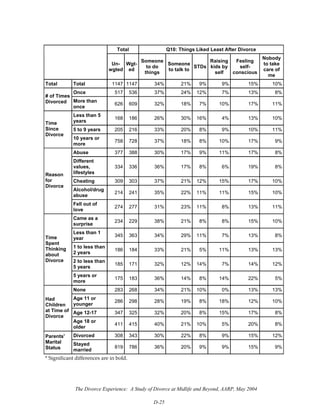
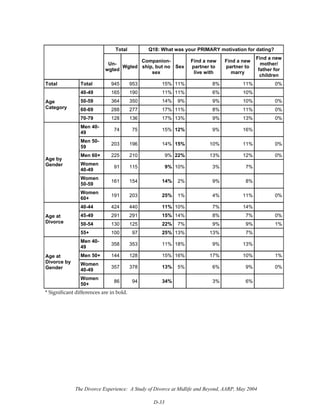
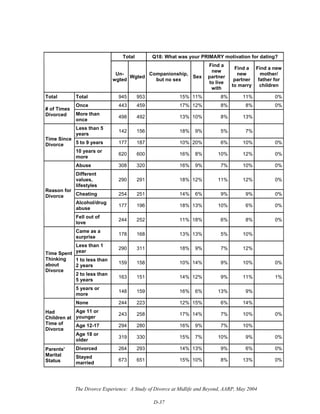
Figure 13. Frequency of Kissing
6%
35%
11%
5%
13%
30%
6%
39%
20%
5%
22%
8%
5%
67%
10%
5%
7%
6%
7%
2%
7%
3%
15%
67%
5%
3%
4%
8%
11%
69%
0% 20% 40% 60% 80% 100%
No answer
Not at all
Once or twice a month
About once a week
More than once a week
Daily
Women (Married/with partner)
Men (Married/with partner)
Women (Un-
Married/Separated/Widowed)
Men (Un-
Married/Separated/Widowed)
Total
Q31a‐f. During the past 6 months, how often, on average, have you engaged in [Kissing]?
(Base=1147, total respondents)](https://image.slidesharecdn.com/divorce-150221141831-conversion-gate02/85/Senior-Divorce-48-320.jpg)
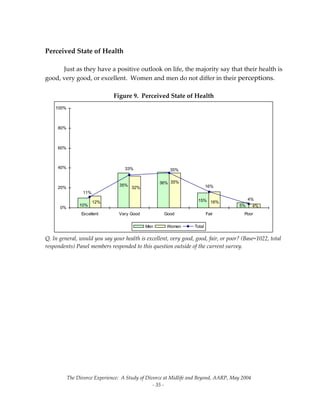
![The Divorce Experience: A Study of Divorce at Midlife and Beyond, AARP, May 2004
‐ 46 ‐
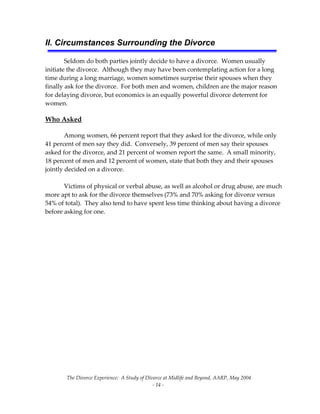
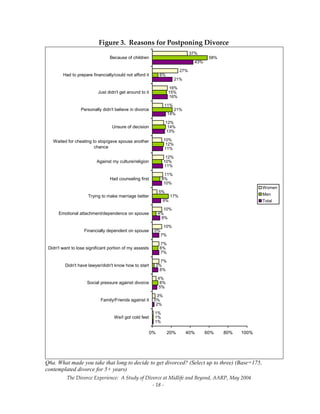
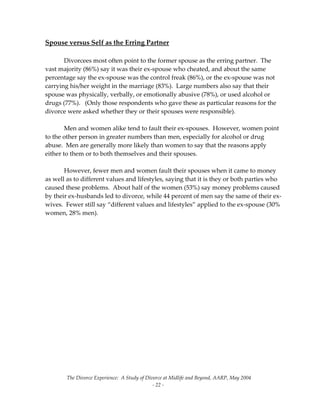
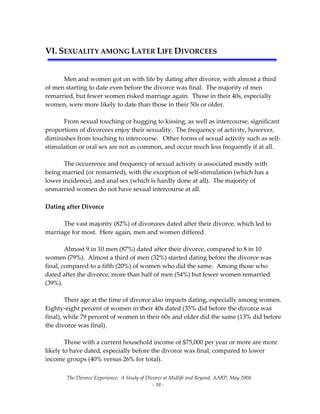
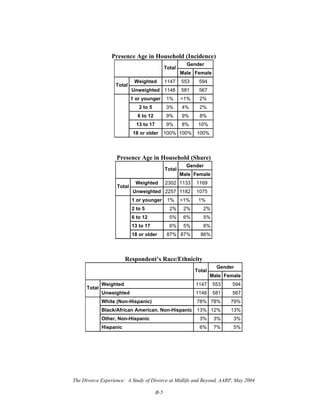
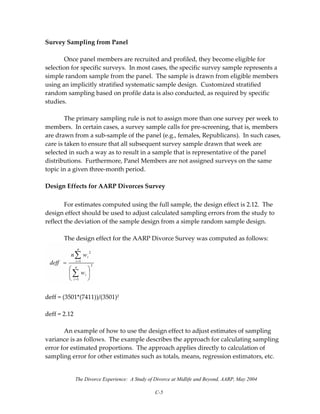
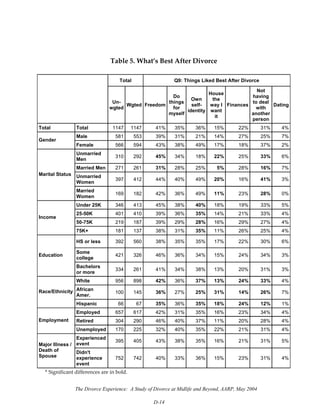
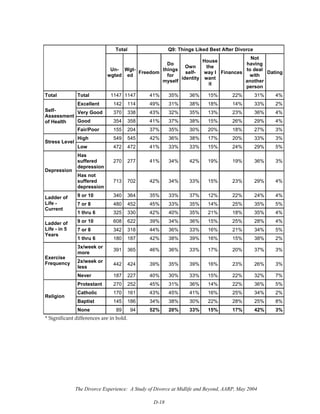
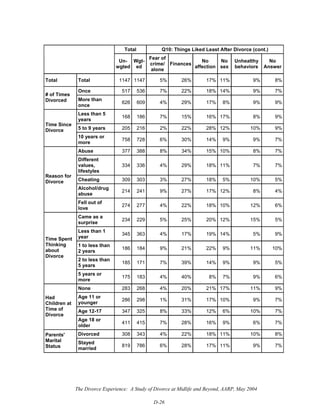
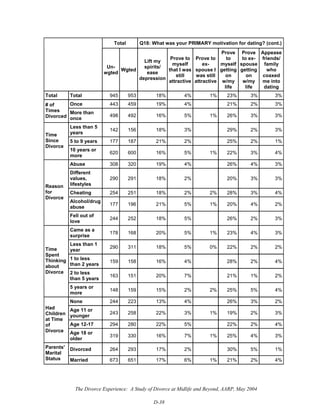
Figure 14. Frequency of Sexual Intercourse
6%
46%
16%
15%
14%
2%
7%
49%
18%
13%
14%
0%
6%
77%
8%
2%
6%
1%
6%
16%
22%
29%
24%
4%
6%
17%
23%
25%
21%
8%
0% 20% 40% 60% 80% 100%
No answer
Not at all
Once or twice a month
About once a week
More than once a week
Daily
Women (Married/with partner)
Men (Married/with partner)
Women (Un-
Married/Separated/Widowed)
Men (Un-
Married/Separated/Widowed)
Total
Q31a‐f. During the past 6 months, how often, on average, have you engaged in [Sexual intercourse]?
(Base=1147, Total respondents)](https://image.slidesharecdn.com/divorce-150221141831-conversion-gate02/85/Senior-Divorce-49-320.jpg)
![The Divorce Experience: A Study of Divorce at Midlife and Beyond, AARP, May 2004
‐ 48 ‐
Figure 15. Frequency of Oral Sex
9%
60%
17%
8%
6%
2%
8%
57%
17%
10%
8%
0%
7%
81%
7%
2%
2%
1%
12%
41%
23%
14%
7%
3%
7%
42%
29%
8%
10%
4%
0% 20% 40% 60% 80% 100%
No answer
Not at all
Once or twice a month
About once a week
More than once a week
Daily
Women (Married/with partner)
Men (Married/with partner)
Women (Un-
Married/Separated/Widowed)
Men (Un-
Married/Separated/Widowed)
Total
Q31a‐f. During the past 6 months, how often, on average, have you engaged in [Oral sex]?
(Base=1147, Total respondents)](https://image.slidesharecdn.com/divorce-150221141831-conversion-gate02/85/Senior-Divorce-51-320.jpg)
![The Divorce Experience: A Study of Divorce at Midlife and Beyond, AARP, May 2004
‐ 49 ‐
Figure 16. Frequency of Self‐Stimulation/Masturbation
10%
58%
19%
6%
6%
2%
11%
39%
22%
12%
13%
3%
7%
68%
18%
3%
3%
1%
13%
56%
17%
5%
6%
3%
7%
68%
18%
3%
4%
0%
0% 20% 40% 60% 80% 100%
No answer
Not at all
Once or twice a month
About once a week
More than once a week
Daily
Women (Married/with partner)
Men (Married/with partner)
Women (Un-
Married/Separated/Widowed)
Men (Un-
Married/Separated/Widowed)
Total
Q31a‐f. During the past 6 months, how often, on average, have you engaged in [Self‐
Stimulation/Masturbation]? (Base=1147, Total respondents)](https://image.slidesharecdn.com/divorce-150221141831-conversion-gate02/85/Senior-Divorce-52-320.jpg)
![The Divorce Experience: A Study of Divorce at Midlife and Beyond, AARP, May 2004
‐ 50 ‐
Figure 17. Frequency of Anal Sex
10%
86%
3%
0%
0%
0%
11%
83%
4%
1%
0%
0%
8%
90%
1%
0%
0%
1%
14%
83%
3%
0%
0%
0%
9%
85%
5%
1%
0%
0%
0% 20% 40% 60% 80% 100%
No answer
Not at all
Once or twice a month
About once a week
More than once a week
Daily
Women (Married/with partner)
Men (Married/with partner)
Women (Un-
Married/Separated/Widowed)
Men (Un-
Married/Separated/Widowed)
Total
Q31a‐f. During the past 6 months, how often, on average, have you engaged in [Anal sex]?
(Base=1147, Total respondents)](https://image.slidesharecdn.com/divorce-150221141831-conversion-gate02/85/Senior-Divorce-53-320.jpg)
![The Divorce Experience: A Study of Divorce at Midlife and Beyond, AARP, May 2004
A-2
AARP Divorce Survey
December 2003
S1. Which of these best describes your current marital status?
Divorce, never married
Divorce, divorced
Divorce, widow/widower
Married
Married but separated
Living with partner (not married or registered partnership)
Living with registered domestic partner
[IF NEVER MARRIED, TERMINATE. IF DIVORCED, SKIP TO S3. OTHERWISE CONTINUE TO S2.]
TOTAL MALE FEMALE
Unweighted Weighted N Percent Percent Percent
Divorce, never
married
0 0 0% 0% 0%
Divorce, divorced 644 636 55% 48% 62%
Divorce,
widow/widower
51 57 5% 3% 6%
Married 350 350 31% 40% 22%
Married but
separated
12 11 1% 1% 1%
Living with partner
(not married or
registered
partnership)
86 86 8% 6% 9%
Living with
registered domestic
partner
4 6 1% 1% <1%
S1: Which of these
best describes your
current marital
status?
TOTAL 1147 1147 100% 100% 100%
S2. Have you ever been divorced?
Yes [PROCEED TO S3]
No [TERMINATE]
TOTAL MALE FEMALE
Unweighted Weighted N Percent Percent Percent
Yes 503 511 100% 100% 100%
No 0 0 0% 0% 0%
S2: Have you
ever been
divorced?
TOTAL 503 511 100% 100% 100%](https://image.slidesharecdn.com/divorce-150221141831-conversion-gate02/85/Senior-Divorce-65-320.jpg)
![The Divorce Experience: A Study of Divorce at Midlife and Beyond, AARP, May 2004
A-3
S3. Have you been divorced more than once?
No, just once
Yes, more than once
TOTAL MALE FEMALE
Unweighted Weighted N Percent Percent Percent
No, just once 626 609 53% 54% 52%
Yes, more than
once
517 536 47% 46% 47%
REFUSED 4 2 <1% <1% <1%
S3: Have you been
divorced more than
once?
TOTAL 1147 1147 100% 100% 100%
S4. At what age did you [“MOST RECENTLY” IF MORE THAN ONCE IN S3] get divorced?
________
[S4 RESPONSE MUST BE 40 OR GREATER TO CONTINUE.]
TOTAL MALE FEMALE
Unweighted Weighted N Percent Percent Percent
40 to 44 474 490 43% 41% 45%
45 to 49 349 346 30% 31% 29%
50 to 54 181 173 15% 14% 16%
55 to 59 92 85 7% 8% 7%
60 to 69 47 49 4% 5% 3%
70 to 79 4 4 <1% 1% <1%
S4: Age
at last
divorce -
categories
TOTAL 1147 1147 100% 100% 100%
[MAIN SURVEY BEGINS HERE]
Imagine a ladder with 10 steps representing the “ladder of life.” Let’s suppose the top
of the ladder, the TENTH STEP, represents the BEST possible life for you, and the
bottom, the FIRST step, represents the WORST possible life for you.
At which step of the ladder do you stand AT THE PRESENT TIME, and where do you
think you still stand FIVE YEARS FROM NOW? Click on the number that best
represents where you think you stand on the ladder.
Q1a. Present Time
10
9
8
7
6
5
4
3
2
1
Q1b. 5 years from now
10
9
8
7
6
5
4
3
2
1](https://image.slidesharecdn.com/divorce-150221141831-conversion-gate02/85/Senior-Divorce-66-320.jpg)
![The Divorce Experience: A Study of Divorce at Midlife and Beyond, AARP, May 2004
A-6
Q2b. Of the remaining reasons, which was the next most significant reason for your
divorce?
[SAME LIST EXCEPT FOR FIRST REASON CHOSEN]
No other reason
[IF ‘NO OTHER REASON’, SKIP TO Q3]
TOTAL MALE FEMALE
Unweighted Weighted N Percent Percent Percent
Cheating 73 68 6% 5% 6%
Verbal, physical or
emotional abuse 135 127 11% 7% 14%
Control freak 65 87 8% 5% 10%
Step-children got in
the way
37 33 3% 4% 2%
In-laws 12 21 2% 3% 1%
Homosexuality 5 5 <1% 1% <1%
Sexual incompatibility
/ poor sexual
performance
30 24 2% 2% 2%
Inability to have
children
3 4 <1% <1% 1%
Didn't want to have
children
4 6 1% 1% <1%
Always away at work
or business 28 28 2% 2% 2%
Fell in love with
someone else
34 31 3% 3% 2%
Not carrying weight in
marriage (sharing
chores, etc.)
56 54 5% 2% 7%
Physical appearance
declining 10 9 1% 1% 1%
Different values,
lifestyles
99 102 9% 9% 9%
Money problems 62 59 5% 6% 5%
Major age difference 13 14 1% 1% 1%
Religious differences
became intolerable 13 14 1% <1% 2%
Cultural differences
became intolerable 11 10 1% 1% <1%
Alcohol or drug
abuse
65 61 5% 4% 7%
Abandonment 25 40 3% 3% 4%
No obvious problems,
simply fell out of love 84 82 7% 9% 5%
No other reason 79 68 6% 7% 5%
REFUSED 5 5 <1% <1% 1%
Not asked 199 196 17% 23% 12%
Q2b: Of the
remaining reasons,
which was the next
most significant
reason for your
divorce?
TOTAL 1147 1147 100% 100% 100%](https://image.slidesharecdn.com/divorce-150221141831-conversion-gate02/85/Senior-Divorce-69-320.jpg)
![The Divorce Experience: A Study of Divorce at Midlife and Beyond, AARP, May 2004
A-7
Q2c. And finally, what was the third most significant reason for your divorce?
[SAME LIST EXCEPT FOR FIRST TWO REASONS CHOSEN]
TOTAL MALE FEMALE
Unweighted Weighted N Percent Percent Percent
Cheating 54 56 5% 3% 7%
Verbal, physical or
emotional abuse 68 76 7% 6% 7%
Control freak 54 53 5% 2% 7%
Step-children got in
the way
16 16 1% 1% 1%
In-laws 14 15 1% 1% 1%
Homosexuality 1 1 <1% <1% <1%
Sexual incompatibility
/ poor sexual
performance
36 34 3% 3% 3%
Inability to have
children
1 1 <1% <1% <1%
Didn't want to have
children
3 4 <1% <1% <1%
Always away at work
or business 39 42 4% 4% 3%
Fell in love with
someone else
29 33 3% 2% 3%
Not carrying weight in
marriage (sharing
chores, etc.)
60 69 6% 4% 8%
Physical appearance
declining 11 7 1% 1% 1%
Different values,
lifestyles
101 107 9% 7% 11%
Money problems 71 56 5% 4% 5%
Major age difference 13 12 1% 1% 1%
Religious differences
became intolerable 9 9 1% 1% 1%
Cultural differences
became intolerable 8 9 1% 1% <1%
Alcohol or drug
abuse
38 43 4% 4% 3%
Abandonment 29 32 3% 2% 4%
No obvious problems,
simply fell out of love 55 59 5% 6% 5%
No other reason 148 139 12% 13% 11%
REFUSED 6 6 1% 1% <1%
Not asked 283 269 23% 31% 17%
Q2c: And finally, what
was the third most
significant reason for
your divorce?
TOTAL 1147 1147 100% 100% 100%](https://image.slidesharecdn.com/divorce-150221141831-conversion-gate02/85/Senior-Divorce-70-320.jpg)
![The Divorce Experience: A Study of Divorce at Midlife and Beyond, AARP, May 2004
A-8
NET: ALL REASONS MENTIONED IN Q2a-Q2c
TOTAL MALE FEMALE
Unweighted Weighted N Percent Percent Percent
Cheating 309 303 28% 23% 32%
Verbal, physical or
emotional abuse 377 388 36% 24% 47%
Control freak 154 171 16% 11% 20%
Step-children got in
the way
84 80 7% 10% 5%
In-laws 43 52 5% 7% 2%
Homosexuality 10 9 1% 1% 1%
Sexual incompatibility
/ poor sexual
performance
87 81 7% 8% 7%
Inability to have
children
4 5 <1% <1% 1%
Didn't want to have
children
10 14 1% 2% 1%
Always away at work
or business 98 94 9% 11% 7%
Fell in love with
someone else
115 110 10% 12% 8%
Not carrying weight in
marriage (sharing
chores, etc.)
154 157 14% 10% 18%
Physical appearance
declining 24 19 2% 2% 2%
Different values,
lifestyles
334 336 31% 31% 31%
Money problems 178 155 14% 15% 13%
Major age difference 32 34 3% 3% 3%
Religious differences
became intolerable 32 30 3% 2% 3%
Cultural differences
became intolerable 28 28 3% 4% 2%
Alcohol or drug
abuse
214 241 22% 15% 29%
Abandonment 96 111 10% 7% 13%
No obvious problems,
simply fell out of love 274 277 25% 34% 18%
Q2a-Q2c: Net
Reasons for Last
Divorce
Total Responses 2657
Q3. For these top reasons, please indicate if the reason applied mostly to you, mostly to
your spouse, or to both of you equally.
Applied
mostly to
me
Applied
mostly to
spouse
Applied to
both of us
equally
[REASON 1]
[REASON 2]
[REASON 3]](https://image.slidesharecdn.com/divorce-150221141831-conversion-gate02/85/Senior-Divorce-71-320.jpg)
![The Divorce Experience: A Study of Divorce at Midlife and Beyond, AARP, May 2004
A-9
TOTAL MALE FEMALE
Unweighted Weighted N Percent Percent Percent
Applied mostly to me 21 22 7% 13% 4%
Applied mostly to spouse 268 259 86% 76% 92%
Applied to both of us equally 17 18 6% 11% 3%
REFUSED 3 4 1% <1% 2%
Q3: [Cheating]
TOTAL 309 303 100% 100% 100%
TOTAL MALE FEMALE
Unweighted Weighted N Percent Percent Percent
Applied mostly to me 46 47 12% 16% 10%
Applied mostly to spouse 295 303 78% 60% 86%
Applied to both of us equally 36 38 10% 24% 3%
REFUSED 0 0 <1% <1% <1%
Q3: [Verbal,
physical or
emotional abuse]
TOTAL 377 388 100% 100% 100%
TOTAL MALE FEMALE
Unweighted Weighted N Percent Percent Percent
Applied mostly to me 10 15 8% 21% 2%
Applied mostly to spouse 137 147 86% 75% 91%
Applied to both of us equally 7 10 6% 4% 7%
REFUSED 0 0 <1% <1% <1%
Q3: [Control
freak]
TOTAL 154 171 100% 100% 100%
TOTAL MALE FEMALE
Unweighted Weighted N Percent Percent Percent
Applied mostly to me 25 23 29% 31% 25%
Applied mostly to spouse 37 36 45% 44% 47%
Applied to both of us equally 19 16 20% 21% 19%
REFUSED 3 5 6% 4% 9%
Q3: [Step-
children got in the
way]
TOTAL 84 80 100% 100% 100%
TOTAL MALE FEMALE
Unweighted Weighted N Percent Percent Percent
Applied mostly to me 10 8 14% 17% 8%
Applied mostly to spouse 26 36 68% 64% 81%
Applied to both of us equally 6 8 16% 17% 11%
REFUSED 1 1 2% 2% <1%
Q3: [In-laws]
TOTAL 43 52 100% 100% 100%
TOTAL MALE FEMALE
Unweighted Weighted N Percent Percent Percent
Applied mostly to me 1 1 6% 18% <1%
Applied mostly to spouse 8 7 84% 82% 85%
Applied to both of us equally 0 0 <1% <1% <1%
REFUSED 1 1 10% <1% 15%
Q3:
[Homosexuality]
TOTAL 10 9 100% 100% 100%](https://image.slidesharecdn.com/divorce-150221141831-conversion-gate02/85/Senior-Divorce-72-320.jpg)
![The Divorce Experience: A Study of Divorce at Midlife and Beyond, AARP, May 2004
A-10
TOTAL MALE FEMALE
Unweighted Weighted N Percent Percent Percent
Applied mostly to me 14 13 16% 12% 20%
Applied mostly to spouse 56 51 64% 75% 52%
Applied to both of us equally 16 14 18% 13% 23%
REFUSED 1 2 2% <1% 5%
Q3: [Sexual
incompatibility /
poor sexual
performance]
TOTAL 87 81 100% 100% 100%
TOTAL MALE FEMALE
Unweighted Weighted N Percent Percent Percent
Applied mostly to me 0 0 <1% <1% <1%
Applied mostly to spouse 3 5 92% 100% 89%
Applied to both of us equally 1 0 8% <1% 11%
REFUSED 0 0 <1% <1% <1%
Q3: [Inability to
have children]
TOTAL 4 5 100% 100% 100%
TOTAL MALE FEMALE
Unweighted Weighted N Percent Percent Percent
Applied mostly to me 8 10 73% 100% <1%
Applied mostly to spouse 1 2 17% <1% 61%
Applied to both of us equally 0 0 <1% <1% <1%
REFUSED 1 2 11% <1% 39%
Q3: [Didn't want
to have children]
TOTAL 10 14 100% 100% 100%
TOTAL MALE FEMALE
Unweighted Weighted N Percent Percent Percent
Applied mostly to me 42 42 45% 68% 9%
Applied mostly to spouse 43 38 41% 20% 72%
Applied to both of us equally 12 14 14% 11% 20%
REFUSED 1 1 1% 1% <1%
Q3: [Always
away at work or
business]
TOTAL 98 94 100% 100% 100%
TOTAL MALE FEMALE
Unweighted Weighted N Percent Percent Percent
Applied mostly to me 52 48 44% 42% 46%
Applied mostly to spouse 58 57 52% 50% 54%
Applied to both of us equally 5 5 5% 8% <1%
REFUSED 0 0 <1% <1% <1%
Q3: [Fell in love
with someone
else]
TOTAL 115 110 100% 100% 100%
TOTAL MALE FEMALE
Unweighted Weighted N Percent Percent Percent
Applied mostly to me 20 19 12% 17% 10%
Applied mostly to spouse 123 130 83% 72% 88%
Applied to both of us equally 11 8 5% 11% 2%
REFUSED 0 0 <1% <1% <1%
Q3: [Not carrying
weight in
marriage
(sharing chores,
etc.)]
TOTAL
154 157 100% 100% 100%](https://image.slidesharecdn.com/divorce-150221141831-conversion-gate02/85/Senior-Divorce-73-320.jpg)
![The Divorce Experience: A Study of Divorce at Midlife and Beyond, AARP, May 2004
A-11
TOTAL MALE FEMALE
Unweighted Weighted N Percent Percent Percent
Applied mostly to me 2 1 4% <1% 10%
Applied mostly to spouse 18 15 80% 93% 65%
Applied to both of us equally 2 1 6% <1% 13%
REFUSED 2 2 9% 7% 12%
Q3: [Physical
appearance
declining]
TOTAL 24 19 100% 100% 100%
TOTAL MALE FEMALE
Unweighted Weighted N Percent Percent Percent
Applied mostly to me 59 63 19% 19% 19%
Applied mostly to spouse 96 98 29% 28% 30%
Applied to both of us equally 177 170 51% 53% 48%
REFUSED 2 5 1% <1% 3%
Q3: [Different
values, lifestyles]
TOTAL 334 336 100% 100% 100%
TOTAL MALE FEMALE
Unweighted Weighted N Percent Percent Percent
Applied mostly to me 21 20 13% 13% 14%
Applied mostly to spouse 97 75 48% 44% 53%
Applied to both of us equally 59 59 38% 42% 33%
REFUSED 1 1 1% 1% <1%
Q3: [Money
problems]
TOTAL 178 155 100% 100% 100%
TOTAL MALE FEMALE
Unweighted Weighted N Percent Percent Percent
Applied mostly to me 8 11 34% 28% 38%
Applied mostly to spouse 15 14 41% 32% 50%
Applied to both of us equally 9 8 25% 40% 12%
REFUSED 0 0 <1% <1% <1%
Q3: [Major age
difference]
TOTAL 32 34 100% 100% 100%
TOTAL MALE FEMALE
Unweighted Weighted N Percent Percent Percent
Applied mostly to me 13 11 39% 31% 44%
Applied mostly to spouse 13 10 33% 39% 28%
Applied to both of us equally 6 8 28% 29% 27%
REFUSED 0 0 <1% <1% <1%
Q3: [Religious
differences
became
intolerable]
TOTAL 32 30 100% 100% 100%
TOTAL MALE FEMALE
Unweighted Weighted N Percent Percent Percent
Applied mostly to me 7 5 19% 16% 26%
Applied mostly to spouse 8 10 37% 29% 54%
Applied to both of us equally 12 10 37% 45% 20%
REFUSED 1 2 7% 10% <1%
Q3: [Cultural
differences
became
intolerable]
TOTAL 28 28 100% 100% 100%](https://image.slidesharecdn.com/divorce-150221141831-conversion-gate02/85/Senior-Divorce-74-320.jpg)
![The Divorce Experience: A Study of Divorce at Midlife and Beyond, AARP, May 2004
A-12
TOTAL MALE FEMALE
Unweighted Weighted N Percent Percent Percent
Applied mostly to me 28 31 13% 33% 3%
Applied mostly to spouse 170 186 77% 46% 92%
Applied to both of us equally 15 21 9% 21% 3%
REFUSED 1 2 1% <1% 1%
Q3: [Alcohol or
drug abuse]
TOTAL 214 241 100% 100% 100%
TOTAL MALE FEMALE
Unweighted Weighted N Percent Percent Percent
Applied mostly to me 11 13 12% 26% 5%
Applied mostly to spouse 81 93 83% 70% 90%
Applied to both of us equally 4 5 5% 4% 5%
REFUSED 0 0 <1% <1% <1%
Q3:
[Abandonment]
TOTAL 96 111 100% 100% 100%
Q4. Who asked for the divorce?
Me
My spouse
Both of us jointly
TOTAL MALE FEMALE
Unweighted Weighted N Percent Percent Percent
Me 600 617 54% 41% 66%
My spouse 359 343 30% 39% 21%
Both of us
jointly
167 170 15% 18% 12%
REFUSED 21 17 1% 2% 1%
Q4: Who asked
for the divorce?
TOTAL 1147 1147 100% 100% 100%
Q5. How long were you married before you filed for divorce?
_____ Years
TOTAL MALE FEMALE
Unweighted Weighted N Percent Percent Percent
Less than 5
years
168 186 16% 16% 17%
5 to 9 years 205 216 19% 22% 16%
10 to 14 years 193 194 17% 18% 16%
15 to 19 years 170 167 15% 13% 16%
20 to 24 years 201 197 17% 16% 19%
25 to 29 years 128 108 9% 9% 10%
30 to 34 years 45 44 4% 4% 4%
35 years or
more
21 18 2% 1% 2%
REFUSED 16 17 1% 1% 2%
Q5: How long
were you
married before
you filed for
divorce?
(categories)
TOTAL 1147 1147 100% 100% 100%](https://image.slidesharecdn.com/divorce-150221141831-conversion-gate02/85/Senior-Divorce-75-320.jpg)
![The Divorce Experience: A Study of Divorce at Midlife and Beyond, AARP, May 2004
A-13
Q6 How long did you contemplate getting a divorce before finally deciding to do so?
Not my decision; came as a surprise from my spouse
Less than 1 month
1 month to less than 6 months
6 months to less than 1 year
1 year to less than 2 years
2 years to less than 5 years
5 years to less than 10 years
10 years to less than 15 years
15 years to less than 20 years
20 years or longer
TOTAL MALE FEMALE
Unweighted Weighted N Percent Percent Percent
Not my decision; came
as a surprise from my
spouse
234 229 20% 26% 14%
Less than 1 month 62 76 7% 6% 7%
1 month to less than 6
months
122 120 10% 12% 9%
6 months to less than 1
year
161 167 15% 16% 13%
1 year to less than 2
years
186 184 16% 14% 18%
2 years to less than 5
years
185 171 15% 13% 16%
5 years to less than 10
years
90 101 9% 7% 10%
10 years to less than 15
years
53 54 5% 2% 8%
15 years to less than 20
years
18 19 2% <1% 3%
20 years or longer 14 9 1% <1% 1%
REFUSED 22 17 2% 2% 1%
Q6: How long did you
contemplate getting a
divorce before finally
deciding to do so?
TOTAL 1147 1147 100% 100% 100%
[ASK Q6A ONLY IF 5 YEARS OR LONGER IN Q6]
Q6a. What made you take that long to decide to get divorced? (select up to three)
We had counseling first
Personally didn’t believe in divorce
We were trying to make the marriage better
We/I got cold feet
Waited for cheating to stop / gave spouse another chance
Unsure of decision
We stayed married because of children
Had to prepare financially; could not afford it
Just didn’t get around to it
Did not have a lawyer, didn’t know how to start
Family and friends were against it
Social pressure against divorce
Dependent on spouse financially](https://image.slidesharecdn.com/divorce-150221141831-conversion-gate02/85/Senior-Divorce-76-320.jpg)
![The Divorce Experience: A Study of Divorce at Midlife and Beyond, AARP, May 2004
A-14
Need spouse to take care of me physically
Emotional attachment/dependence on spouse
Didn’t want to lose significant portion of my assets
Against my culture or religion
TOTAL MALE FEMALE
Unweighted Weighted N Percent Percent Percent
We had counseling
first
22 19 10% 8% 11%
Personally didn’t
believe in divorce 29 26 14% 21% 11%
We were trying to
make the marriage
better
18 16 9% 17% 5%
We/I got cold feet 4 2 1% 1% 1%
Waited for cheating
to stop / gave spouse
another chance
16 19 11% 12% 10%
Unsure of decision 20 23 13% 14% 12%
We stayed married
because of children 85 78 43% 58% 37%
Had to prepare
financially; could not
afford it
41 39 21% 6% 27%
Just didn’t get around
to it
23 29 16% 15% 16%
Did not have a
lawyer, didn’t know
how to start
10 10 6% 2% 7%
Family and friends
were against it
2 4 2% <1% 3%
Social pressure
against divorce 11 9 5% 6% 4%
Dependent on
spouse financially 17 12 7% <1% 10%
Need spouse to take
care of me physically
0 0 <1% <1% <1%
Emotional attachment
/ dependence on
spouse
15 15 8% 4% 10%
Didn’t want to lose
significant portion of
my assets
12 12 7% 6% 7%
Against my culture or
religion 26 21 11% 10% 12%
Total Respondents 175 183 100% 100% 100%
Q6a: What made you
take that long to
decide to get
divorced?
Total Responses 351
Q7. How old were your children, if any, when you got a divorce? (check all that apply)
Had no children
Less than 2 years old
2 to 5 years old
5 to 11 years old
12 to 17 years old
18 years or older
[IF ‘HAD NO CHILDREN’, SKIP TO Q8]](https://image.slidesharecdn.com/divorce-150221141831-conversion-gate02/85/Senior-Divorce-77-320.jpg)
![The Divorce Experience: A Study of Divorce at Midlife and Beyond, AARP, May 2004
A-15
TOTAL MALE FEMALE
Unweighted Weighted N Percent Percent Percent
Had no children 283 268 23% 26% 21%
Less than 2 years old
21 31 3% 3% 2%
2 to 5 years old
80 85 7% 8% 7%
5 to 11 years old
216 215 19% 22% 15%
12 to 17 years old 347 325 28% 24% 32%
Q7: How old you’re
your children, if any,
when you got a
divorce?
18 years or older 411 415 36% 30% 42%
REFUSED 18 14 1% 2% 1%
TOTAL 1147 1147 100% 100% 100%
Q7a. What do you think was your children’s reaction to the divorce?
Children were supportive of it
Children did not support but were OK with it
Children were somewhat upset about it
Children were very upset about it
TOTAL MALE FEMALE
Unweighted Weighted N Percent Percent Percent
Children were
supportive of it
296 321 37% 21% 50%
Children did not
support but were OK
with it
149 146 17% 21% 13%
Children were
somewhat upset about
it
237 239 27% 34% 21%
Children were very
upset about it 158 154 18% 21% 15%
REFUSED 24 18 2% 3% 1%
Q7a: What do you
think was your
children's reaction to
the divorce?
TOTAL 864 879 100% 100% 100%
[ASK Q7B IF “SOMEWHAT UPSET” OR “VERY UPSET” IN Q7A]](https://image.slidesharecdn.com/divorce-150221141831-conversion-gate02/85/Senior-Divorce-78-320.jpg)
![The Divorce Experience: A Study of Divorce at Midlife and Beyond, AARP, May 2004
A-18
TOTAL MALE FEMALE
Unweighted Weighted N Percent Percent Percent
Not having someone
around with whom to
do things
410 393 34 38 31
Not having someone to
talk to 216 238 21 24 18
Fear of sexually
transmitted diseases /
HIV
88 106 9 10 9
Raising children by
myself 108 100 9 5 12
Feeling self-conscious
about being divorced in
a world of mostly
couples
185 173 15 13 17
Nobody around to take
care of me when I’m
sick or need help
110 109 10 10 10
Fear of crime / being
alone
53 62 5 1 10
Financial problems /
not having enough
money
292 294 26 14 37
No getting affection
from someone
203 197 17 20 15
Not being in a sexual
relationship
120 125 11 16 7
Tendency to do
unhealthy things (e.g.
eating poorly, drinking,
etc.)
100 104 9 12 6
REFUSED 103 94 8 9 7
Q10: What TWO things
did you like LEAST
about life after
divorce?
TOTAL 1147 1147 100% 100% 100%
Q11. Have you ever experienced any of these major personal life events? (check all that
apply)
Lost your job
Suffered from a major illness
Death of a spouse
None of these
TOTAL MALE FEMALE
Unweighted Weighted N Percent Percent Percent
Lost your job 539 512 45% 50% 40%
Suffered from a major
illness 338 343 30% 29% 31%
Death of a spouse
91 96 8% 6% 10%
None of these
436 428 37% 36% 39%
REFUSED 19 18 2% 1% 2%
Q11: Have you ever
experienced any of
these major personal
life events?
TOTAL 1147 1147 100% 100% 100%
[ASK Q12A IF ‘LOST YOUR JOB’ SELECTED IN Q11]](https://image.slidesharecdn.com/divorce-150221141831-conversion-gate02/85/Senior-Divorce-81-320.jpg)
![The Divorce Experience: A Study of Divorce at Midlife and Beyond, AARP, May 2004
A-19
Q12a. Comparing your last divorce to the loss of a job, which was more difficult for you to
handle emotionally?
Job loss was more difficult
About the same
Divorce was more difficult
TOTAL MALE FEMALE
Unweighted Weighted N Percent Percent Percent
Job loss was more
difficult
138 142 28% 30% 26%
About the same 129 122 24% 22% 26%
Divorce was more
difficult
265 243 47% 48% 47%
REFUSED 7 5 1% 1% 2%
Q12a: Comparing your
last divorce to the loss of
a job, which was more
difficult for you to handle
emotionally?
TOTAL
539 512 100% 100% 100%
[ASK Q12B IF ‘SUFFERED FROM MAJOR ILLNESS’ IN Q11]
Q12b. Comparing your last divorce to a major illness, which was more difficult for you to
handle emotionally?
Major illness was more difficult
About the same
Divorce was more difficult
TOTAL MALE FEMALE
Unweighted Weighted N Percent Percent Percent
Major illness was more
difficult
131 141 41% 48% 35%
About the same 78 95 28% 19% 35%
Divorce was more
difficult
124 104 30% 31% 30%
REFUSED 5 3 1% 2% <1%
Q12b: Comparing your
last divorce to a major
illness, which was more
difficult for you to handle
emotionally?
TOTAL
338 343 100% 100% 100%
[ASK Q12C IF ‘DEATH OF A SPOUSE’ SELECTED IN Q11]
Q12c. Comparing your last divorce to the death of a spouse, which was more difficult for you
to handle emotionally?
Spouse’s death was more difficult
About the same
Divorce was more difficult
TOTAL MALE FEMALE
Unweighted Weighted N Percent Percent Percent
Spouse's death was
more difficult 55 63 65% 58% 70%
About the same 16 15 16% 32% 7%
Divorce was more
difficult
20 18 18% 11% 23%
REFUSED 0 0 <1% <1% <1%
Q12c: Comparing your
last divorce to the death
of a spouse, which was
more difficult for you to
handle emotionally?
TOTAL 91 96 100% 100% 100%](https://image.slidesharecdn.com/divorce-150221141831-conversion-gate02/85/Senior-Divorce-82-320.jpg)
![The Divorce Experience: A Study of Divorce at Midlife and Beyond, AARP, May 2004
A-20
Q13. Do you think having a happy marriage is a matter of luck, work in finding the right
person, hard work during marriage, or a combination of these?
Luck
Work in finding the right person
Hard work during marriage
Combination of luck and work
TOTAL MALE FEMALE
Unweighted Weighted N Percent Percent Percent
Luck 20 26 2% 3% 2%
Work in finding the right
person 188 212 18% 18% 19%
Hard work during
marriage
285 281 24% 23% 26%
Combination of luck and
work
634 612 53% 55% 52%
REFUSED 20 16 1% 2% 1%
Q13: Do you think having
a happy marriage is a
matter of luck, work in
finding the right person,
hard work during
marriage, or a
combination of these?
TOTAL
1147 1147 100% 100% 100%
Q14. Were your parents divorced, or did they stay married throughout their adult lives?
Parents divorced
Parents stayed married
TOTAL MALE FEMALE
Unweighted Weighted N Percent Percent Percent
Parents divorced 308 343 30% 29% 30%
Parents stayed married 819 786 69% 69% 68%
REFUSED 20 18 2% 2% 1%
Q14: Were your parents
divorced, or did they stay
married throughout their
adult lives?
TOTAL 1147 1147 100% 100% 100%
Q15. How long after your divorce did you start dating again?
Started before the divorce was final
Less than 6 months after the divorce
6 months to less than 1 year
1 year to less than 2 years
2 years to less than 5 years
5 years or longer
Have not dated since the divorce
[IF “HAVE NOT DATED” IN Q15, SKIP TO Q20]](https://image.slidesharecdn.com/divorce-150221141831-conversion-gate02/85/Senior-Divorce-83-320.jpg)
![The Divorce Experience: A Study of Divorce at Midlife and Beyond, AARP, May 2004
A-23
Q20. After your divorce, how did you feel about re-marrying?
I wanted to remarry
I was reluctant to remarry
I did not want to remarry
I was not sure
TOTAL MALE FEMALE
Unweighted Weighted N Percent Percent Percent
I wanted to remarry 252 251 22% 27% 17%
I was reluctant to
remarry
167 156 14% 14% 13%
I did not want to
remarry
424 438 38% 33% 43%
I was not sure 281 285 25% 24% 26%
REFUSED 23 16 1% 2% 1%
Q20: After your
divorce, how did
you feel about re-
marrying?
TOTAL 1147 1147 100% 100% 100%
[ASK Q21A ONLY IF ‘WANTED TO REMARRY’ IN Q20]
Q21a. If you wanted to remarry, what were you looking for this time around? (select up to 3)
Someone who could satisfy my sexual needs
Someone who was more physically attractive
A personality compatible with mine
Someone with no baggage (previous relationships, spouse, children)
Someone to take care of me
Someone with good character, would be nice to me
Someone with more money, financially stable
Someone who will simply be a good companion
TOTAL MALE FEMALE
Unweighted Weighted N Percent Percent Percent
Someone who could
satisfy my sexual
needs
47 40 16% 19% 12%
Someone who was
more physically
attractive
19 21 8% 11% 4%
A personality
compatible with mine 151 142 57% 62% 49%
Someone with no
baggage (previous
relationships, spouse,
children)
21 18 7% 8% 6%
Someone to take care
of me
20 27 11% 7% 15%
Someone with good
character, would be
nice to me
143 142 57% 47% 47%
Someone with more
money, financially
stable
29 25 10% 4% 4%
Someone who will
simply be a good
companion
133 135 54% 57% 57%
REFUSED 2 2 1% 1% 1%
Q21a: If you wanted to
remarry, what were
you looking for this
time around?
TOTAL 252 251 100% 100% 100%](https://image.slidesharecdn.com/divorce-150221141831-conversion-gate02/85/Senior-Divorce-86-320.jpg)
![The Divorce Experience: A Study of Divorce at Midlife and Beyond, AARP, May 2004
A-24
[ASK Q21B ONLY IF ‘RELUCTANT’ OR ‘DID NOT WANT TO REMARRY’ IN Q17]
Q21b. If you were reluctant or didn’t want to marry, why not? (select up to 3)
Having too much fun being divorce
Did not want to have another bad marriage
Sexual orientation, can’t really get married
Feel bitter / didn’t want to have much to do with the opposite sex
I would not be able to make it work
Children were against it
It would be bad for my finances
It’s too much work finding someone
Lifestyle or work/career would make it difficult
Culture or religion does not allow remarriage if spouse is still alive
TOTAL MALE FEMALE
Unweighted Weighted N Percent Percent Percent
Having too much fun
being divorce
107 96 16% 19% 14%
Did not want to have
another bad marriage 378 386 65% 67% 63%
Sexual orientation,
can’t really get married 2 1 <1% <1% <1%
Feel bitter / didn’t want
to have much to do
with the opposite sex
78 82 14% 10% 17%
I would not be able to
make it work
69 70 12% 14% 10%
Children were against
it
25 29 5% 3% 7%
It would be bad for my
finances
57 58 10% 11% 9%
It’s too much work
finding someone
113 113 19% 18% 19%
Lifestyle or work/career
would make it difficult
73 71 12% 18% 8%
Culture or religion does
not allow remarriage if
spouse is still alive
31 26 4% 3% 5%
REFUSED 19 19 3% 2% 4%
Q21b: If you were
reluctant or didn’t want
to marry, why not?
TOTAL 591 595 100% 100% 100%
Q22. What were the most difficult things you had to go through during the divorce process?
(select up to 3)
Loneliness, depression
Little or no sex
Dealing with lawyers
Not having someone to love or to love me
Dealing with uncertainty, not knowing what’s ahead for me
Being a divorce parent
Dealing with my children
Not being with my children
Working for / fighting for custody of my children](https://image.slidesharecdn.com/divorce-150221141831-conversion-gate02/85/Senior-Divorce-87-320.jpg)
![The Divorce Experience: A Study of Divorce at Midlife and Beyond, AARP, May 2004
A-29
[ASK Q27-Q29 ONLY IF S3 = WIDOW/WIDOWER, MARRIED, OR MARRIED/SEPARATED. ELSE SKIP
TO Q30.]
Q27. If you remarried (to the same person or another person), what did you do THIS TIME
that you didn’t do LAST TIME? (select up to 3)
Lived together before marriage
Got to know spouse longer before getting married
Had pre-marital counseling
Married someone closer to my age
Married someone much younger
Married someone much older
Got a pre-nuptial agreement
Chose a partner with whom I had more in common
Chose a partner who shares my values / beliefs
Chose a partner who shared my political orientation
Chose a partner who shared my ethnicity
Chose a partner who was more fun / adventurous
Chose a partner that my family / children liked
TOTAL MALE FEMALE
Unweighted Weighted N Percent Percent Percent
Lived together before
marriage
107 108 26% 32% 18%
Got to know spouse
longer before getting
married
111 110 26% 27% 26%
Had pre-marital
counseling 20 20 5% 3% 8%
Married someone
closer to my age 31 32 8% 10% 4%
Married someone
much younger
60 59 14% 17% 10%
Married someone
much older
14 23 5% 2% 10%
Got a pre-nuptial
agreement
15 13 3% 3% 3%
Chose a partner with
whom I had more in
common
167 174 42% 43% 40%
Chose a partner who
shares my values/
beliefs
182 170 41% 39% 43%
Chose a partner who
shared my political
orientation
5 3 1% 1% 1%
Chose a partner who
shared my ethnicity
11 12 3% 3% 4%
Chose a partner who
was more fun /
adventurous
76 83 20% 21% 19%
Chose a partner that
my family/children liked
41 52 12% 8% 18%
REFUSED 51 51 12% 10% 15%
Q27: If you remarried
(to the same person or
another person), what
did you do THIS TIME
that you didn’t do
LAST TIME?
TOTAL 413 418 100% 100% 100%](https://image.slidesharecdn.com/divorce-150221141831-conversion-gate02/85/Senior-Divorce-92-320.jpg)
![The Divorce Experience: A Study of Divorce at Midlife and Beyond, AARP, May 2004
A-30
[SKIP Q28 IF WIDOW/WIDOWER IN S3]
Q28. If you remarried (to the same person or another person), what are you doing NOW to
prevent another divorce? Check no more than three.
Go to marital counseling
Don’t cheat on my spouse
Make more money
Handle finances better
Meet my spouse’s sexual needs
Put more effort into staying physically attractive
Be more affectionate day to day
Manage the home better
Have better relationship with in-laws
Give my spouse more freedom
Strike a better balance between work and home life
Not doing anything in particular
TOTAL MALE FEMALE
Unweighted Weighted N Percent Percent Percent
Go to marital
counseling
10 9 2% 3% 2%
Don’t cheat on my
spouse 53 55 15% 19% 9%
Make more money
10 12 3% 5% 1%
Handle finances better
36 39 11% 10% 13%
Meet my spouse’s
sexual needs
39 45 13% 10% 17%
Put more effort into
staying physically
attractive
20 22 6% 2% 12%
Be more affectionate
day to day
118 124 34% 38% 28%
Manage the home
better
36 42 12% 15% 7%
Have better
relationship with in-
laws
10 14 4% 5% 2%
Give my spouse more
freedom
35 39 11% 12% 9%
Strike a better balance
between work and
home life
64 62 17% 20% 12%
Not doing anything in
particular
131 119 33% 27% 43%
REFUSED 29 28 8% 7% 9%
Q28: If you remarried
(to the same person or
another person), what
are you doing NOW to
prevent another
divorce? Check no
more than three.
TOTAL 362 361 100% 100% 100%
[SKIP Q29 IF WIDOW/WIDOWER IN S3]
Q29. If remarried (to the same person or another person), what general feeling do you
have about your current marriage?
It’s on solid ground; I expect it to last all my life
It’s working pretty well, and I’m optimistic about the future
Overall, not much better or worse than my previous marriage](https://image.slidesharecdn.com/divorce-150221141831-conversion-gate02/85/Senior-Divorce-93-320.jpg)
![The Divorce Experience: A Study of Divorce at Midlife and Beyond, AARP, May 2004
A-31
It’s not working well, and I’m not optimistic about the future
I think this marriage may also end in divorce
TOTAL MALE FEMALE
Unweighted Weighted N Percent Percent Percent
It's on solid ground; I
expect it to last all my
life
232 241 67% 68% 65%
It's working pretty well,
and I'm optimistic
about the futur
80 74 20% 19% 23%
Overall, not much
better or worse than
my previous marriage
13 9 2% 3% 1%
It's not working well,
and I'm not optimistic
about the futu
4 4 1% 1% <1%
I think this marriage
may also end in
divorce
14 14 4% 3% 5%
REFUSED 19 20 5% 5% 6%
Q29: If remarried,
what general feeling
do you have about
your current
marriage?
TOTAL 362 361 100% 100% 100%
[ASK Q30 ONLY IF ‘YES’ IN S3]
Q30. While your last divorce was in your 40s or older, did you also experience a divorce
when you were younger, in your 20s or 30s?
Yes
No
TOTAL MALE FEMALE
Unweighted Weighted N Percent Percent Percent
Yes 462 486 91% 89% 92%
No 52 48 9% 10% 8%
REFUSED 3 2 <1% <1% <1%
Q30: While your last
divorce was in your
40s or older, did you
also experience a
divorce when you
were younger, in
your 20s or 30s?
TOTAL
517 536 100% 100% 100%
[ASK Q30A ONLY IF ‘YES’ IN Q30; ELSE SKIP TO Q31]
Q30a. Was it more difficult or devastating to divorce when you were younger (in your 20s or
30s) or when you were older (40 or older)?
Much more difficult when I was younger
Slightly more difficult when I was younger
About the same each time
Slightly more difficult when I was older
Much more difficult when I was older](https://image.slidesharecdn.com/divorce-150221141831-conversion-gate02/85/Senior-Divorce-94-320.jpg)
![The Divorce Experience: A Study of Divorce at Midlife and Beyond, AARP, May 2004
A-32
TOTAL MALE FEMALE
Unweighted Weighted N Percent Percent Percent
Much more difficult
when I was younger 192 194 40% 46% 35%
Slightly more difficult
when I was younger 27 33 7% 7% 7%
About the same each
time
82 100 21% 18% 23%
Slightly more difficult
when I was older 44 44 9% 7% 11%
Much more difficult
when I was older 114 112 23% 21% 24%
REFUSED 3 3 1% <1% 1%
Q30a: Was it more
difficult or devastating
to divorce when you
were younger or when
you were older?
TOTAL 462 486 100% 100% 100%
Q30b. Why do you feel this way? Please explain your reasons below.
FILTERED ON “MORE DIFFICULT WHEN YOUNGER” FROM Q30A
TOTAL MALE FEMALE
Unweighted Weighted N Percent Percent Percent
Child / Children
involved
106 112 57% 48% 65%
Deeper emotional
bond 21 24 12% 6% 18%
Married longer 13 12 6% 6% 6%
Financially difficult 21 25 13% 8% 17%
Expected to be
married forever
12 11 6% 8% 3%
Spouse wanted
divorce
8 8 4% 4% 5%
Too young / lacked
maturity 25 28 14% 15% 14%
Felt betrayed / marital
infidelity
13 13 7% 8% 6%
Fearful of spouse 7 6 3% 0% 5%
Feelings of failure or
rejection 8 5 3% 1% 4%
Harder to find
someone new
1 2 1% 0% 2%
Wiser / more aware
of difficulties 4 7 3% 3% 4%
Neither was
particularly difficult 1 1 1% 1% 0%
Other misc. 9 4 3% 4% 0%
Don’t Know 3 4 2% 4% 0%
TOTAL 189 198 100% 100% 100%
Q30b: Why do you
feel this way? (open-
end response to
Q30a)
[Base = those who
said divorce was
more difficult when
they were
YOUNGER]](https://image.slidesharecdn.com/divorce-150221141831-conversion-gate02/85/Senior-Divorce-95-320.jpg)
![The Divorce Experience: A Study of Divorce at Midlife and Beyond, AARP, May 2004
A-33
FILTERED ON “MORE DIFFICULT WHEN OLDER” FROM Q30A
TOTAL MALE FEMALE
Unweighted Weighted N Percent Percent Percent
Child / Children
involved
28 30 22% 25% 20%
Deeper emotional
bond 12 11 8% 14% 5%
Married longer 12 12 9% 5% 11%
Financially difficult 11 11 8% 2% 12%
Expected to be
married forever
9 7 5% 6% 5%
Spouse wanted
divorce
7 3 3% 4% 2%
Too young / lacked
maturity 5 5 4% 5% 3%
Felt betrayed / marital
infidelity
9 10 7% 1% 12%
Fearful of spouse 6 8 6% 0% 10%
Feelings of failure or
rejection 7 6 4% 8% 1%
Harder to find
someone new
23 19 14% 16% 12%
Wiser / more aware
of difficulties 16 20 15% 12% 16%
Older / more difficulty
to adjust 18 20 15% 15% 15%
Neither was
particularly difficult
1 1 1% 2% 0%
Both were equally
difficult
1 1 1% 1% 0%
Other misc. 8 7 5% 2% 8%
Don’t Know 1 1 1% 1% 0%
Q30b: Why do you
feel this way? (open-
end response to
Q30a)
[Base = those who
said divorce was
more difficult when
they were OLDER]
TOTAL
135 135 100% 100% 100%](https://image.slidesharecdn.com/divorce-150221141831-conversion-gate02/85/Senior-Divorce-96-320.jpg)
![The Divorce Experience: A Study of Divorce at Midlife and Beyond, AARP, May 2004
A-35
Not at all
Once or
twice a
month
About
once a
week
More
than
once a
week Daily
Sexual touching or
hugging
Kissing
Sexual intercourse
Oral sex
Self-stimulation /
masturbation
Anal sex
TOTAL MALE FEMALE
Unweighted Weighted N Percent Percent Percent
Not at all 413 433 38% 23% 51%
Once or twice a month 161 152 13% 17% 10%
About once a week 88 88 8% 10% 6%
More than once a week 171 173 15% 19% 11%
Daily 241 234 20% 24% 17%
REFUSED 73 67 6% 7% 5%
Q31: During the past 6
months, how often, on
average, have you
engaged in [Sexual
touching or hugging]
TOTAL
1147 1147 100% 100% 100%
TOTAL MALE FEMALE
Unweighted Weighted N Percent Percent Percent
Not at all 381 401 35% 22% 47%
Once or twice a month 131 124 11% 14% 8%
About once a week 61 57 5% 4% 6%
More than once a week 158 152 13% 19% 8%
Daily 347 349 30% 36% 25%
REFUSED 69 64 6% 6% 5%
Q31: During the past 6
months, how often, on
average, have you
engaged in [Kissing]
TOTAL 1147 1147 100% 100% 100%
TOTAL MALE FEMALE
Unweighted Weighted N Percent Percent Percent
Not at all 522 532 46% 33% 59%
Once or twice a month 197 184 16% 19% 13%
About once a week 172 168 15% 21% 9%
More than once a
week
157 163 14% 18% 10%
Daily 18 27 2% 2% 3%
REFUSED 81 73 6% 6% 6%
Q31: During the past 6
months, how often, on
average, have you
engaged in [Sexual
intercourse]
TOTAL 1147 1147 100% 100% 100%](https://image.slidesharecdn.com/divorce-150221141831-conversion-gate02/85/Senior-Divorce-98-320.jpg)
![The Divorce Experience: A Study of Divorce at Midlife and Beyond, AARP, May 2004
A-36
TOTAL MALE FEMALE
Unweighted Weighted N Percent Percent Percent
Not at all 683 683 60% 49% 69%
Once or twice a month 187 189 17% 20% 14%
About once a week 97 91 8% 12% 4%
More than once a week 74 67 6% 7% 4%
Daily 11 19 2% 2% 2%
REFUSED 95 98 9% 10% 7%
Q31: During the past 6
months, how often, on
average, have you
engaged in [Oral sex]
TOTAL 1147 1147 100% 100% 100%
TOTAL MALE FEMALE
Unweighted Weighted N Percent Percent Percent
Not at all 620 663 58% 47% 68%
Once or twice a month 239 216 19% 20% 18%
About once a week 79 66 6% 9% 3%
More than once a week 77 71 6% 9% 3%
Daily 19 20 2% 3% 1%
REFUSED 113 111 10% 12% 7%
Q31: During the past 6
months, how often, on
average, have you
engaged in [Self-
stimulation /
masturbation]
TOTAL 1147 1147 100% 100% 100%
TOTAL MALE FEMALE
Unweighted Weighted N Percent Percent Percent
Not at all 993 985 86% 83% 89%
Once or twice a month 29 33 3% 4% 2%
About once a week 4 4 <1% <1% <1%
More than once a week 5 4 <1% <1% <1%
Daily 2 3 <1% <1% 1%
REFUSED 114 119 10% 12% 8%
Q31: During the past 6
months, how often, on
average, have you
engaged in [Anal sex]
TOTAL 1147 1147 100% 100% 100%
[END]](https://image.slidesharecdn.com/divorce-150221141831-conversion-gate02/85/Senior-Divorce-99-320.jpg)

This study summarizes the results of a survey of over 1,000 Americans ages 40-79 who divorced during midlife or later. Key findings include: 1) Divorce had a major emotional and financial impact, with top concerns being uncertainty about the future, loneliness, and fear of being alone. 2) Over three-quarters had children at the time, many of whom were upset by the divorce. Staying married for the sake of children was a top reason for delaying divorce. 3) While divorce was difficult, most felt they coped fairly well over time, with improved outlooks on life compared to other groups. Freedom and fulfillment were commonly cited positives.


