Download to read offline
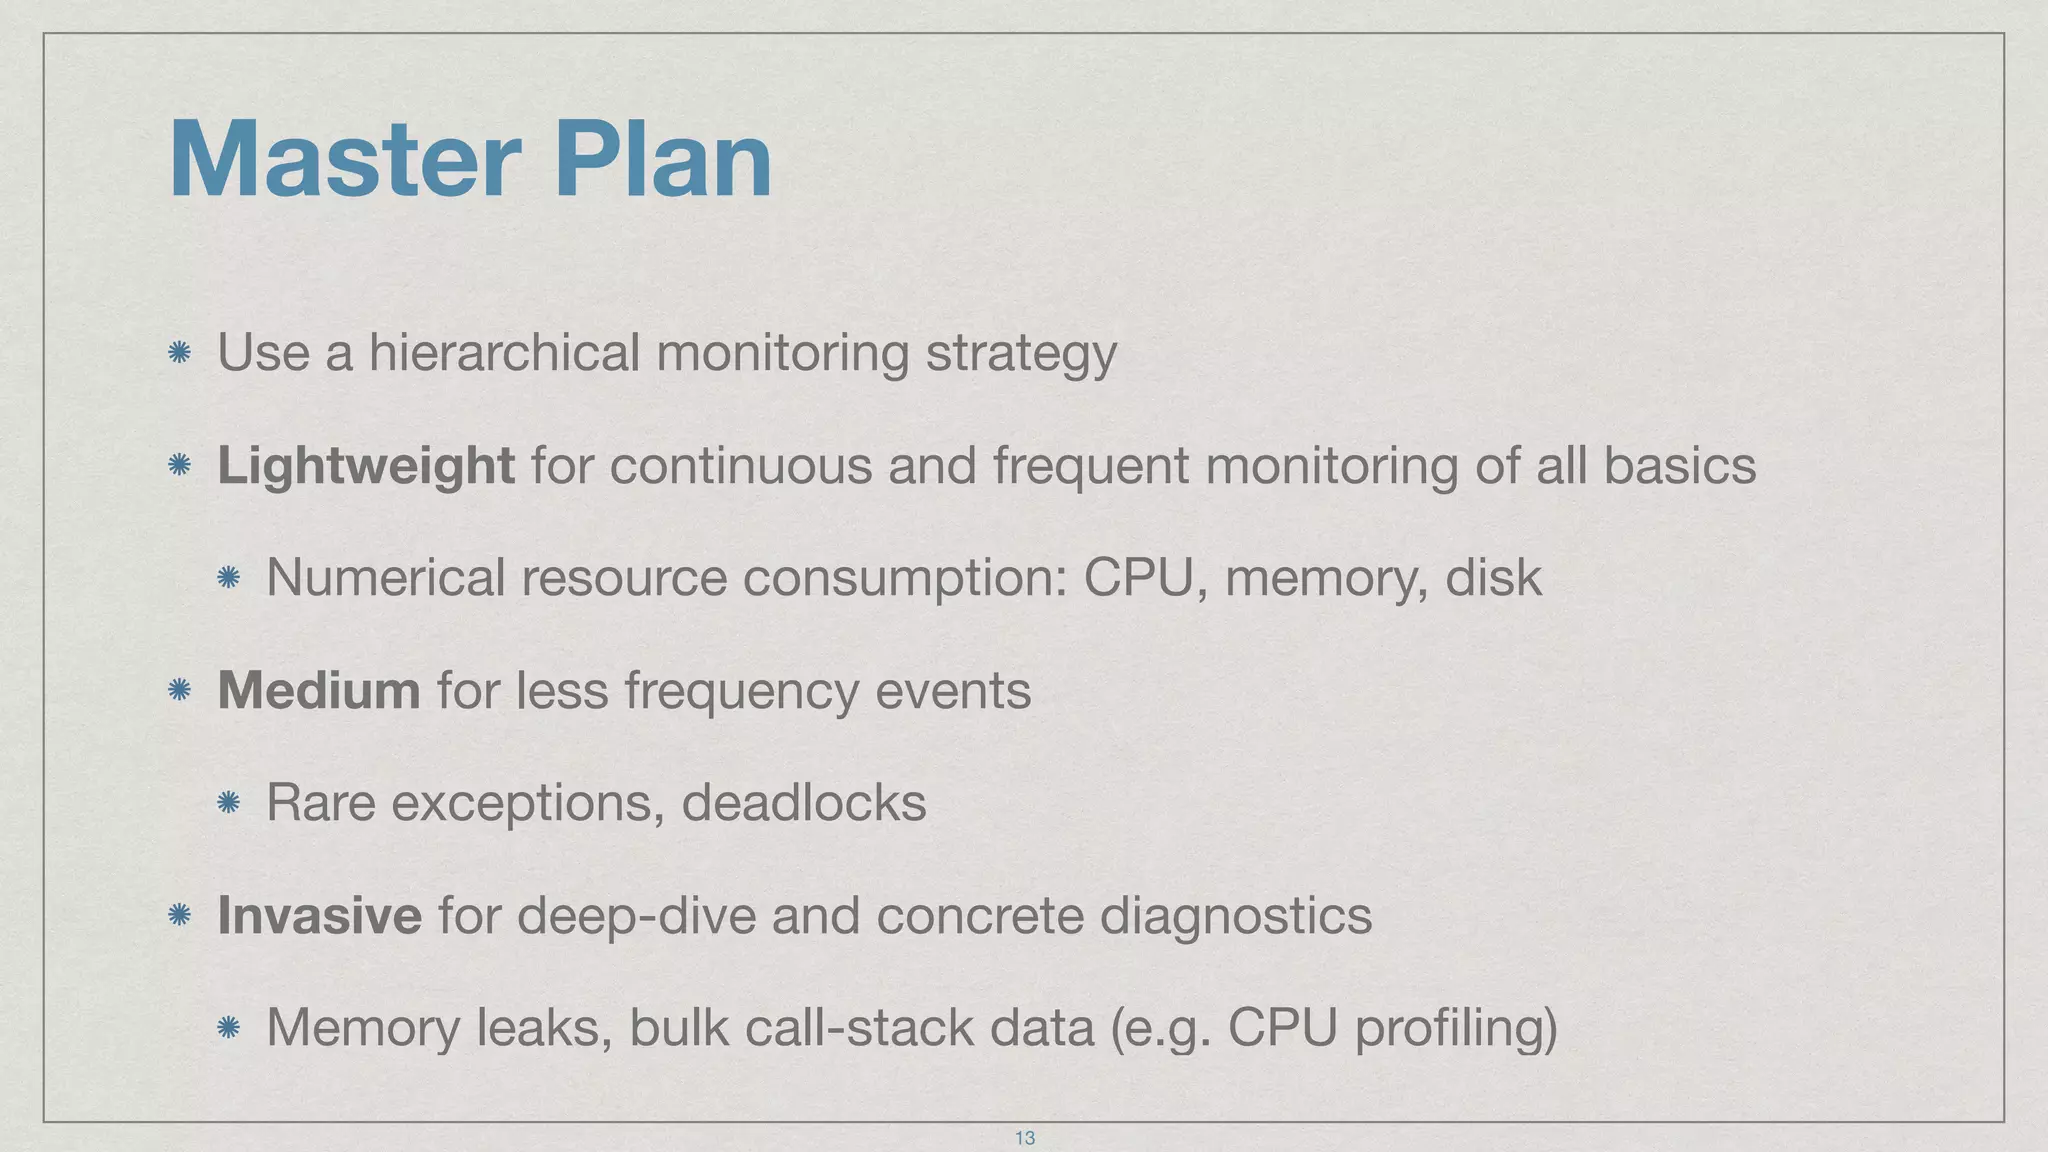

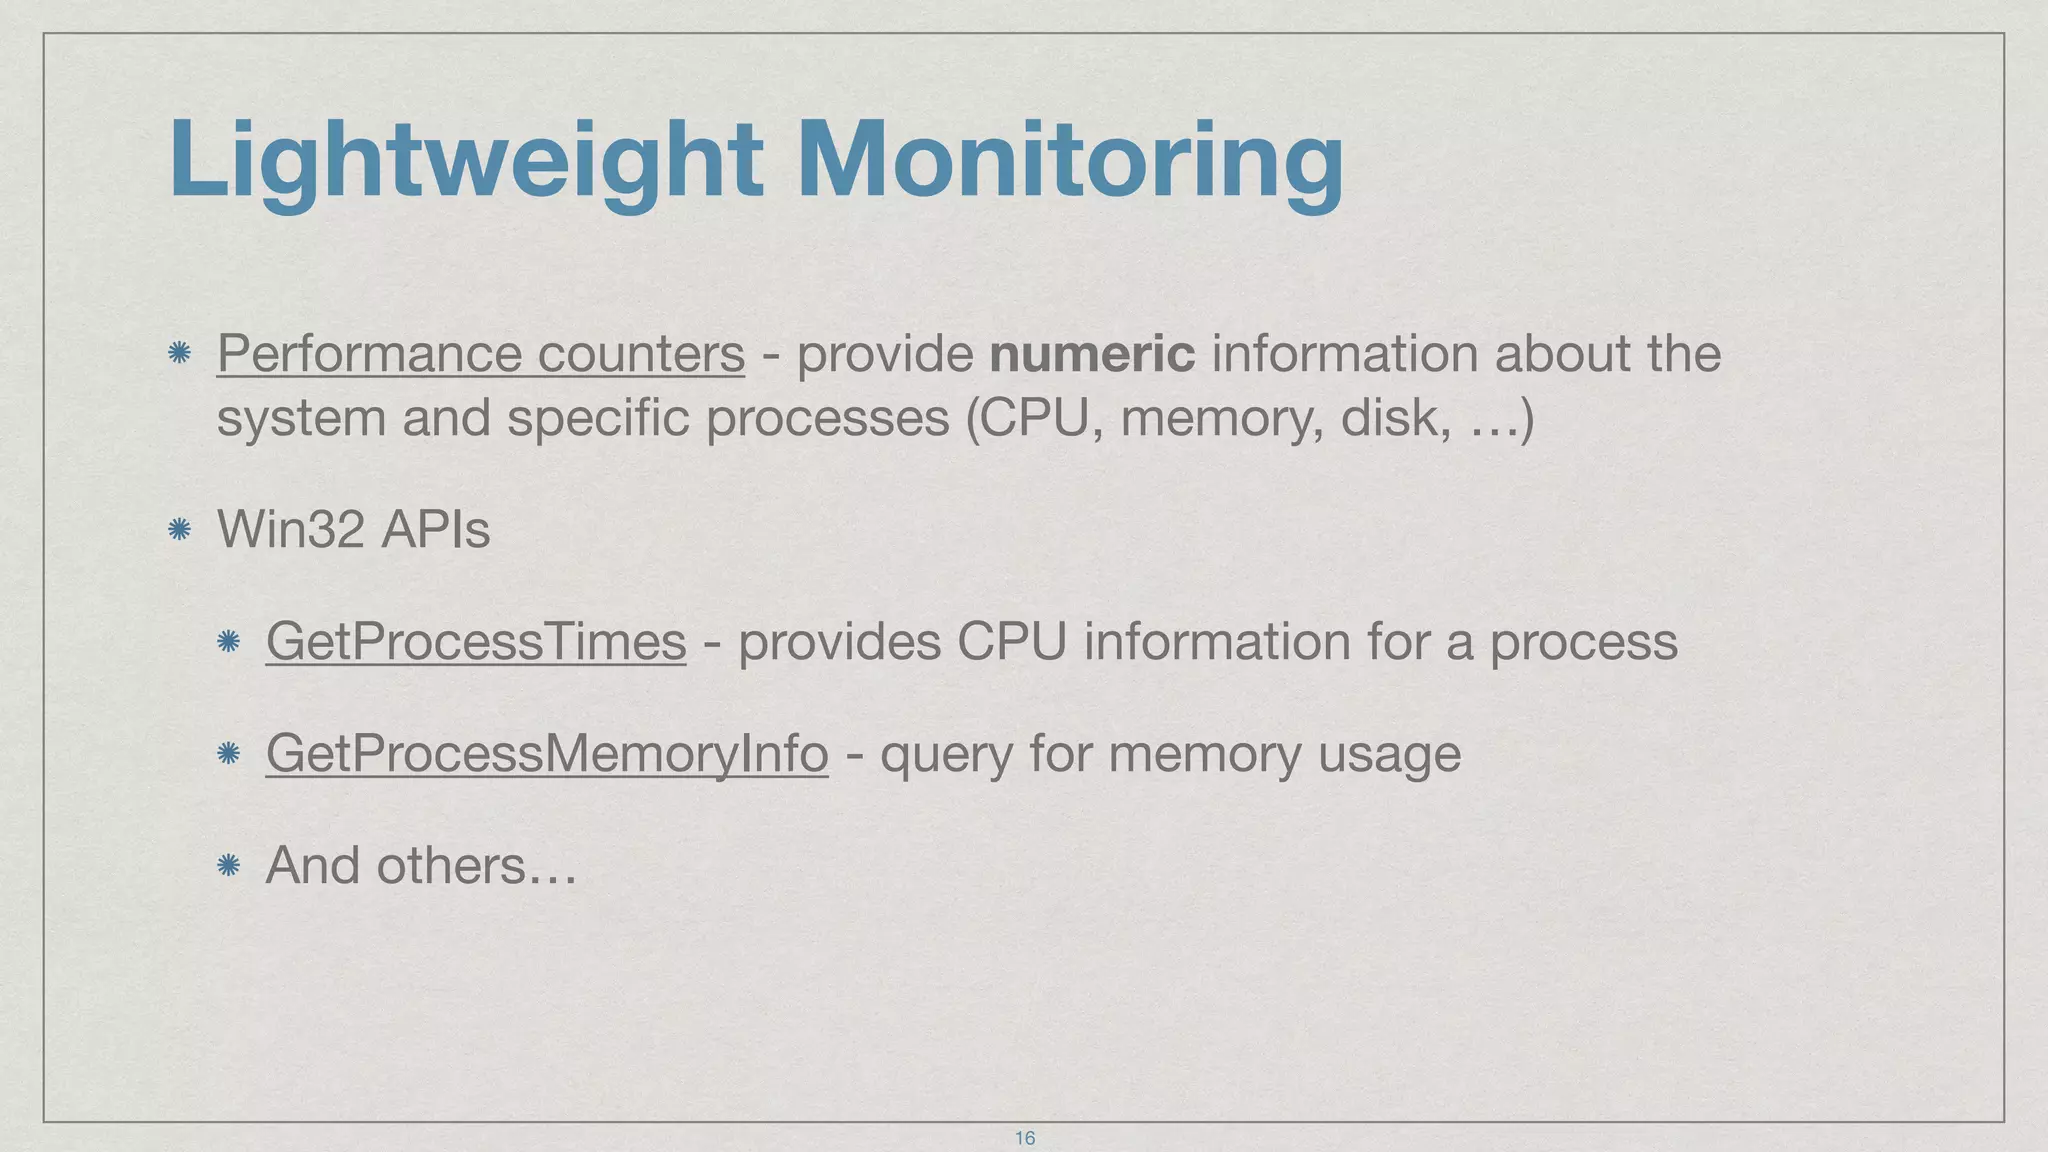
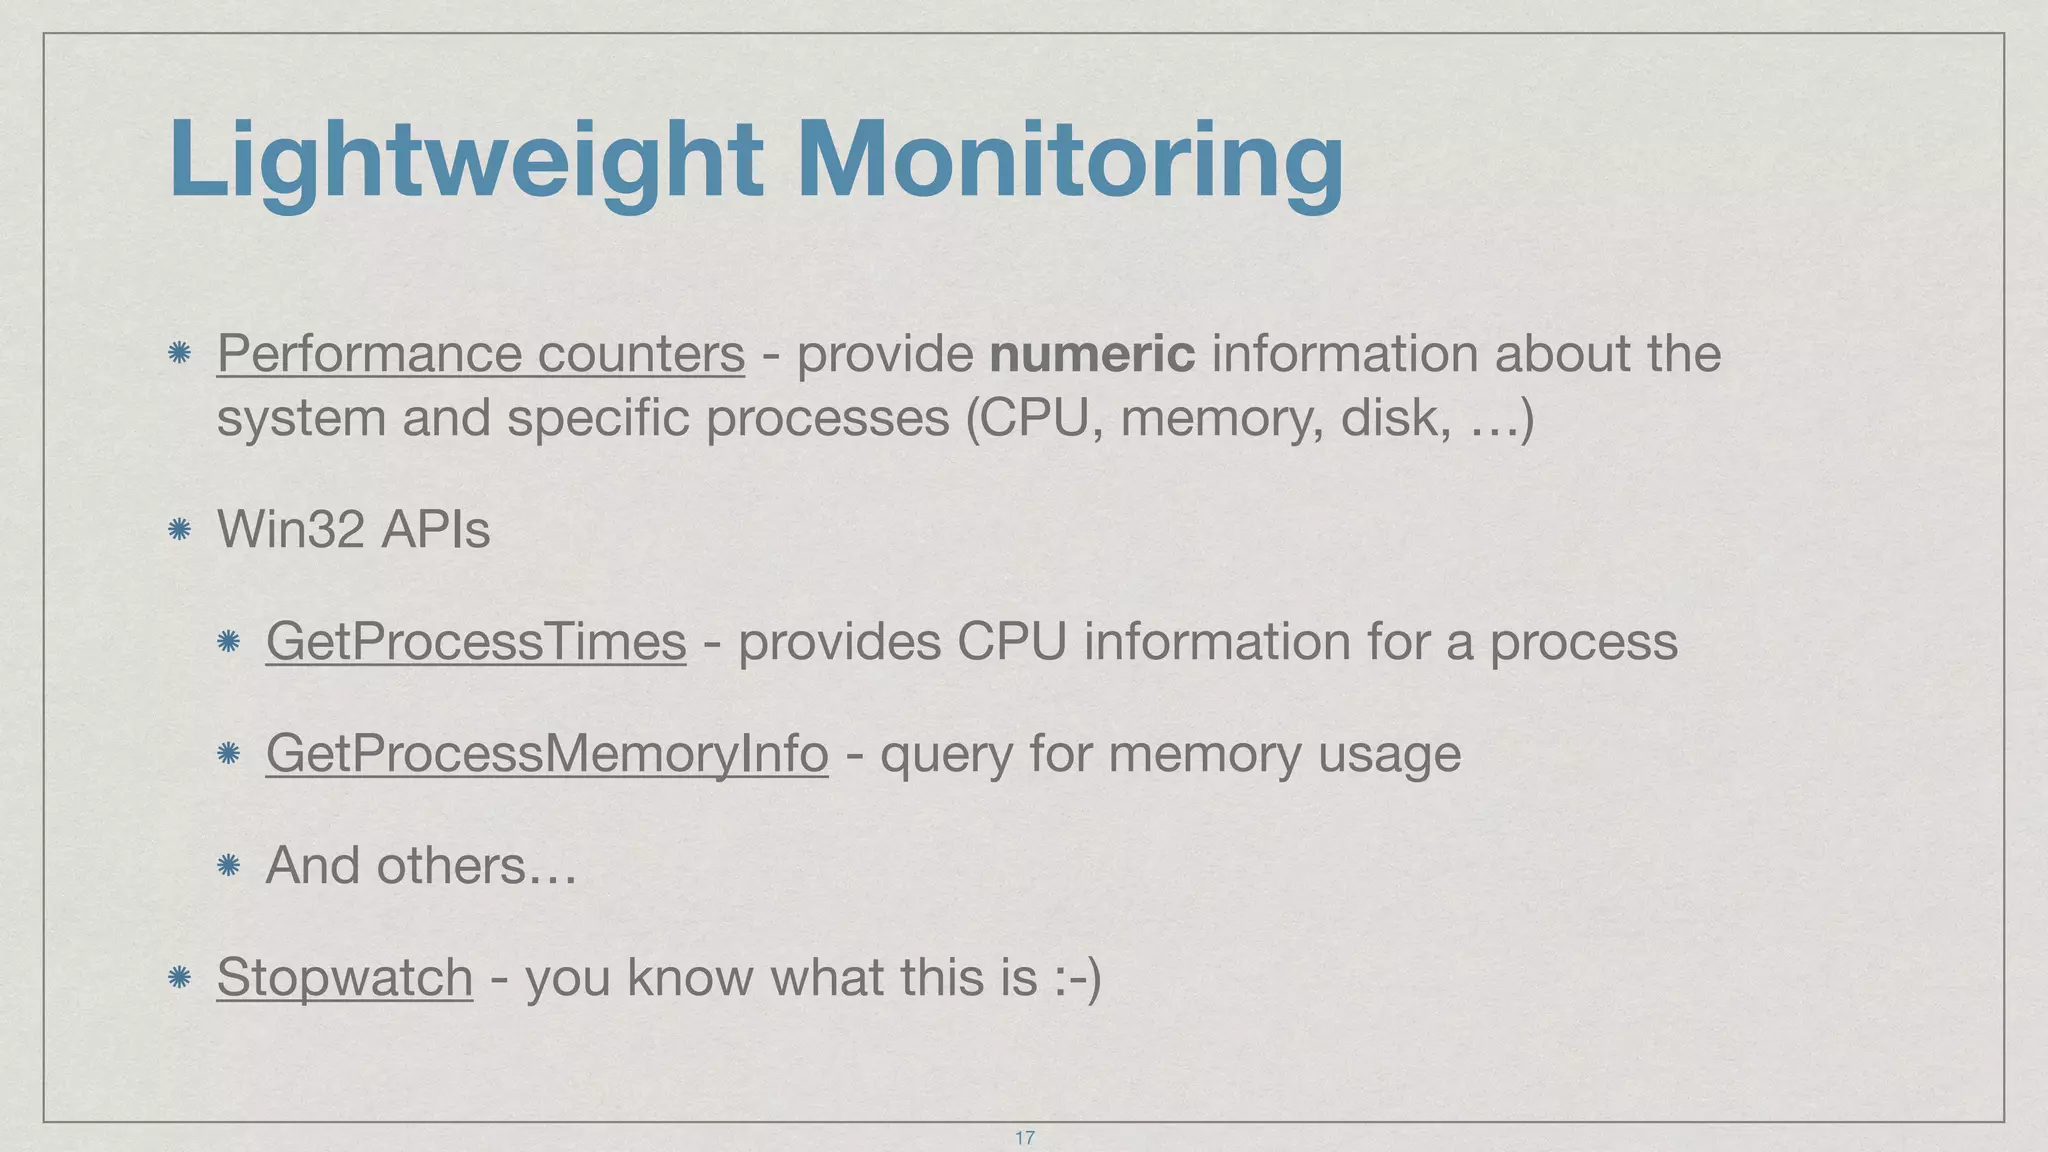
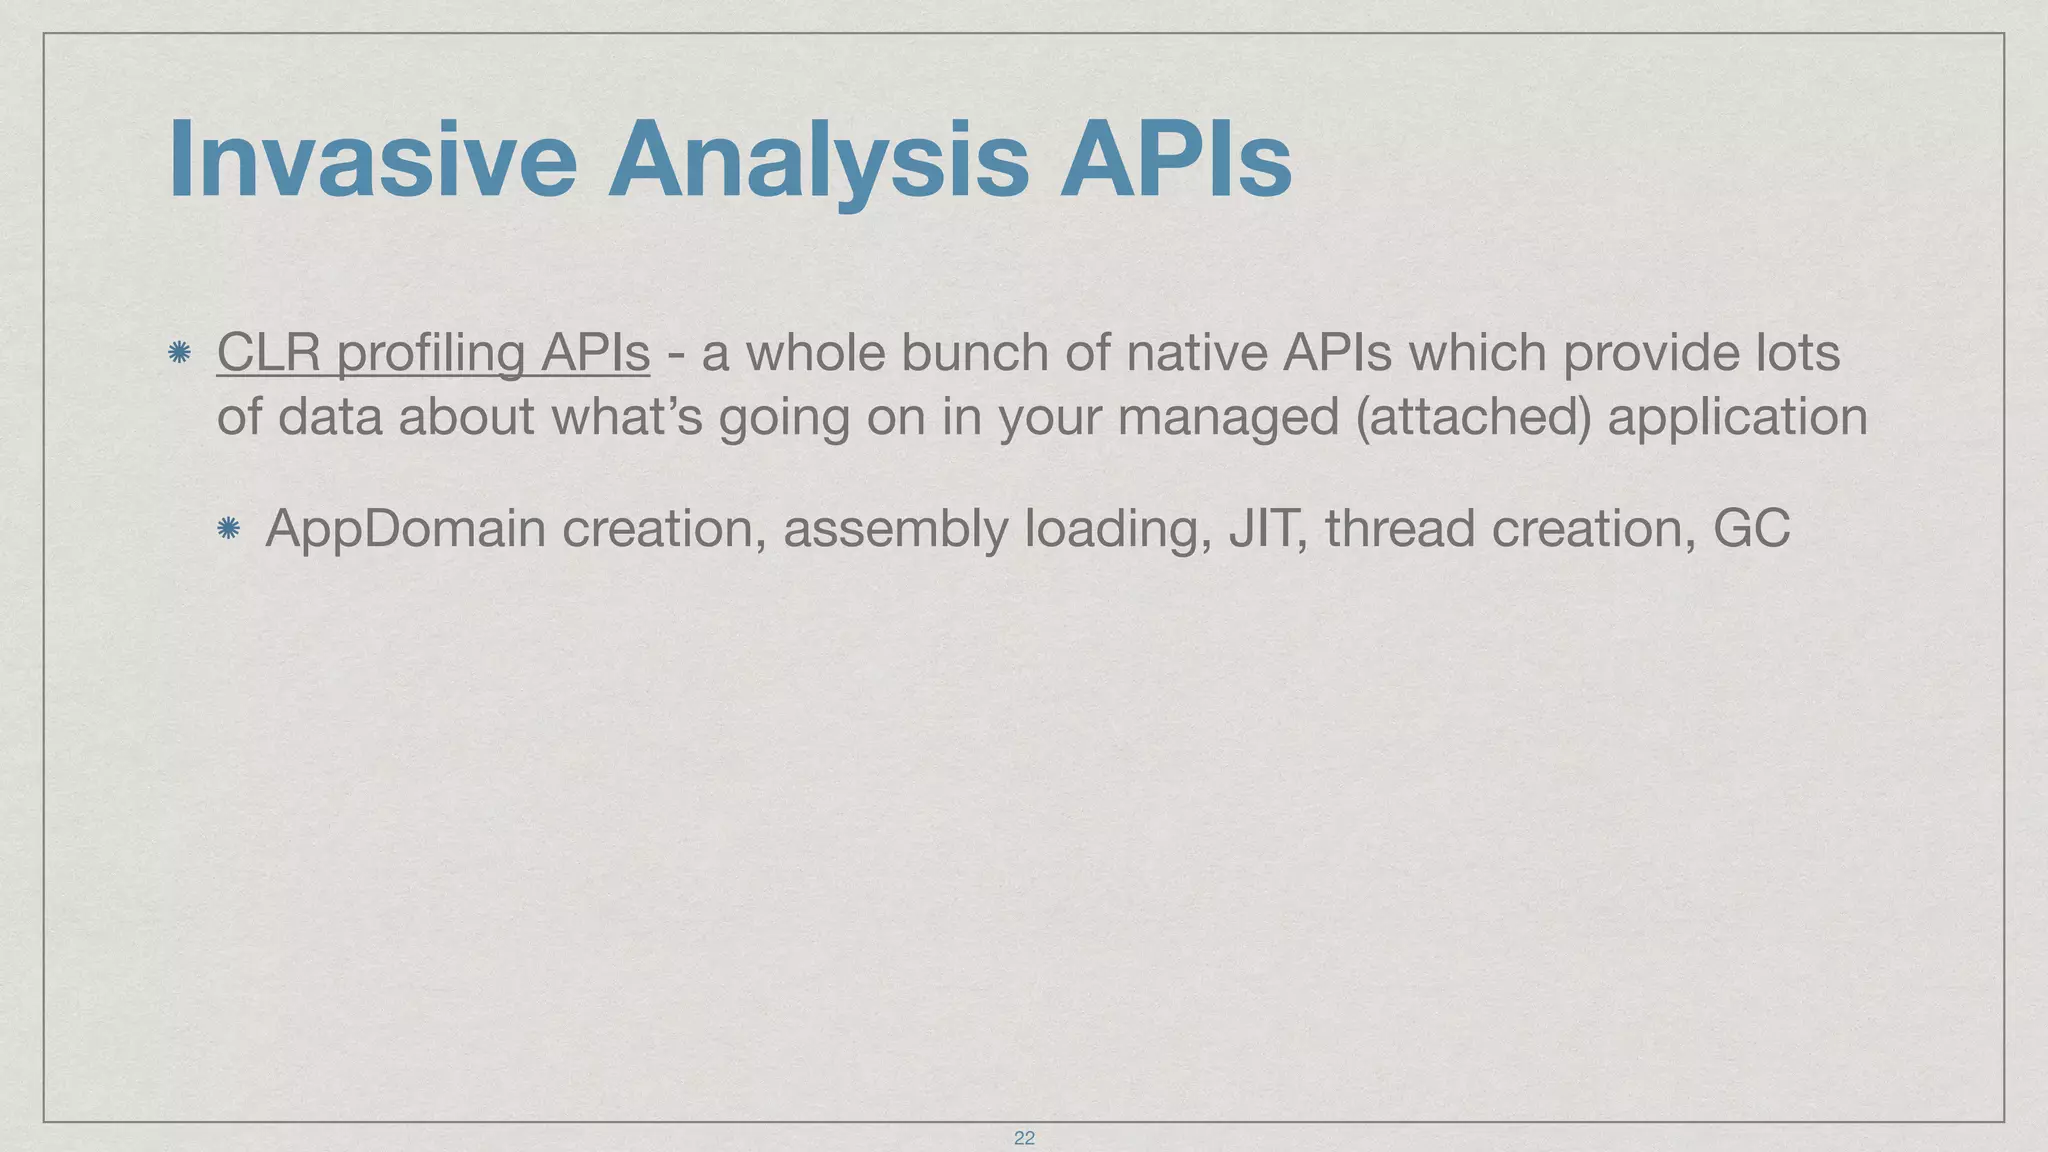
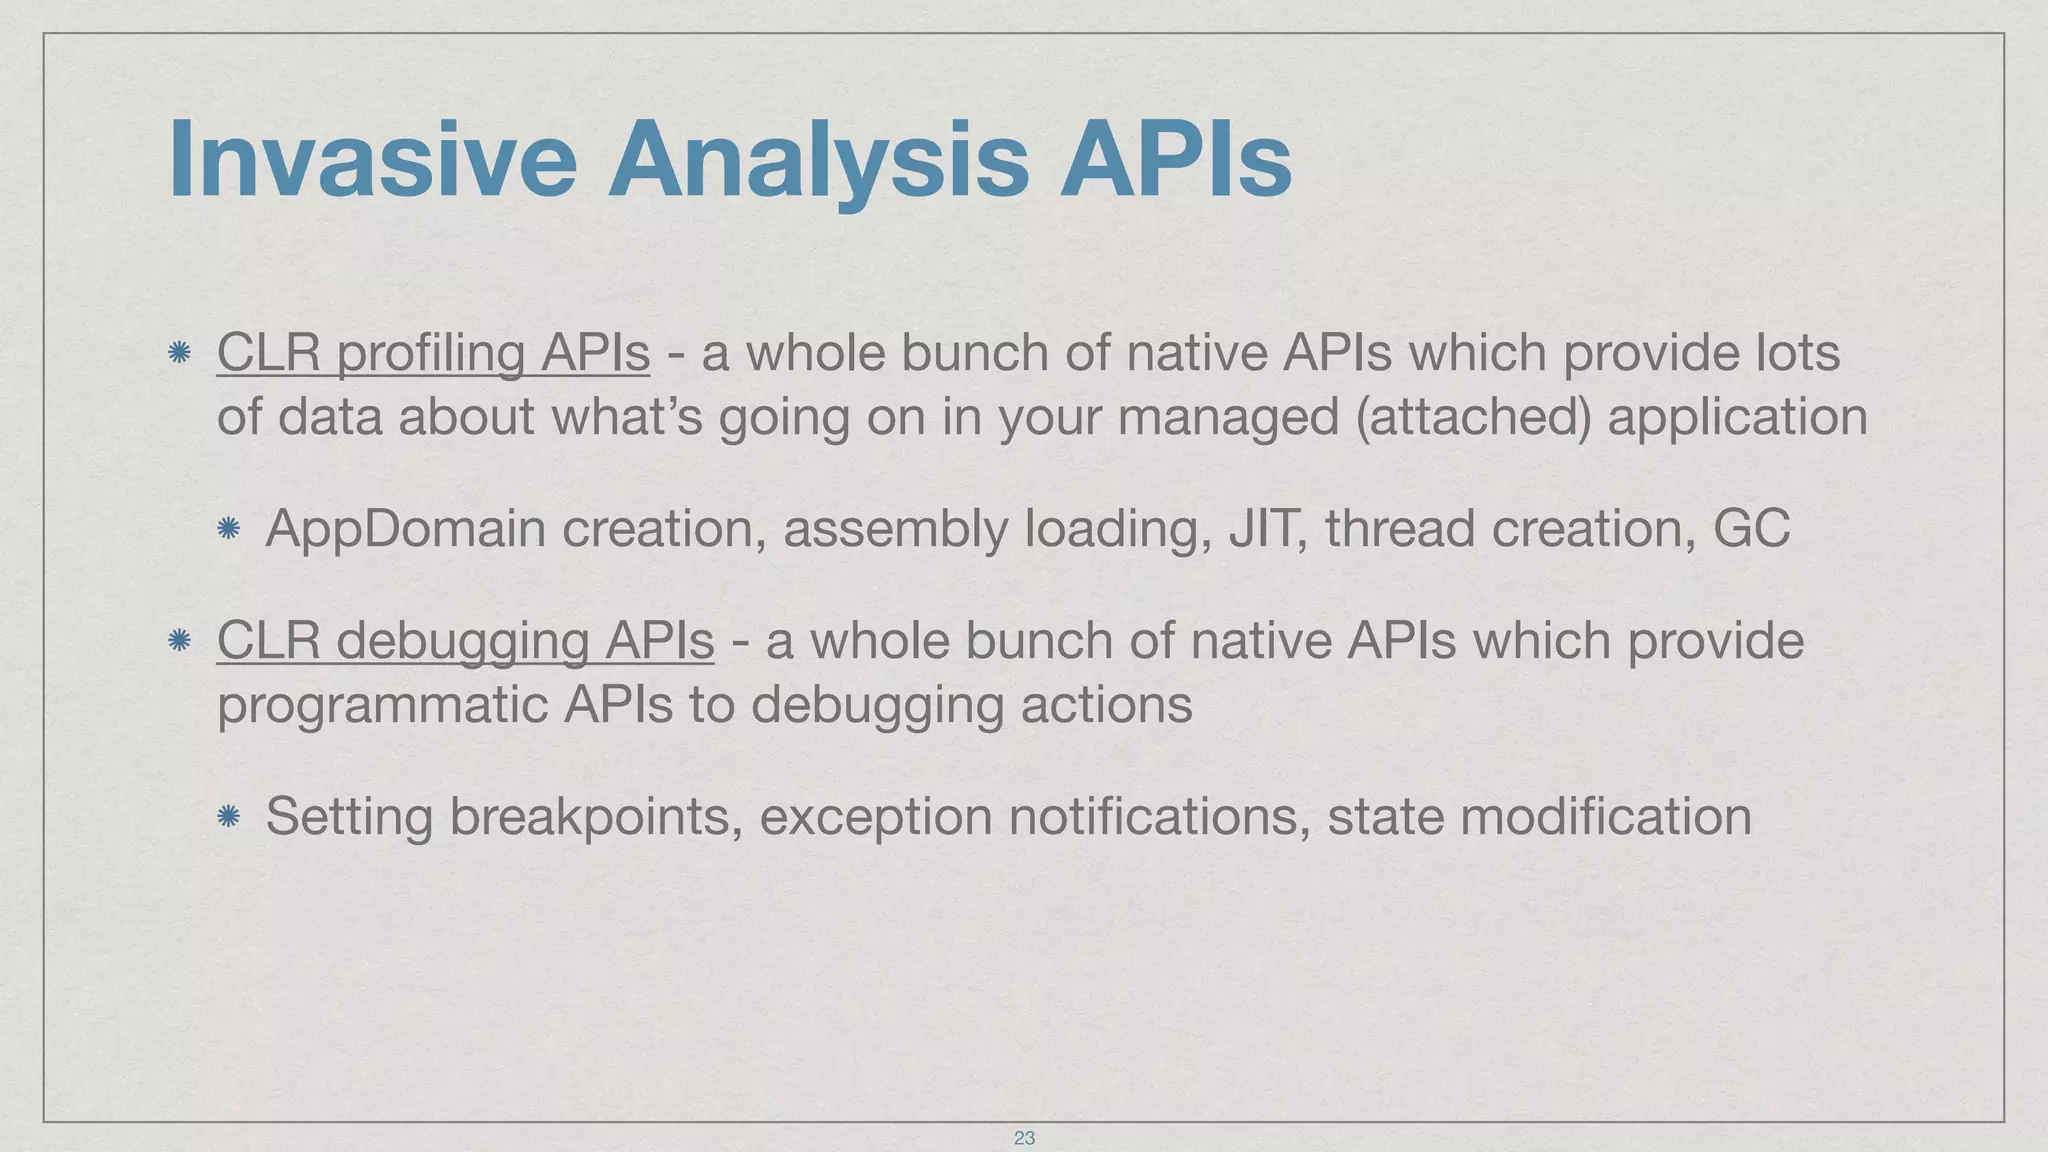
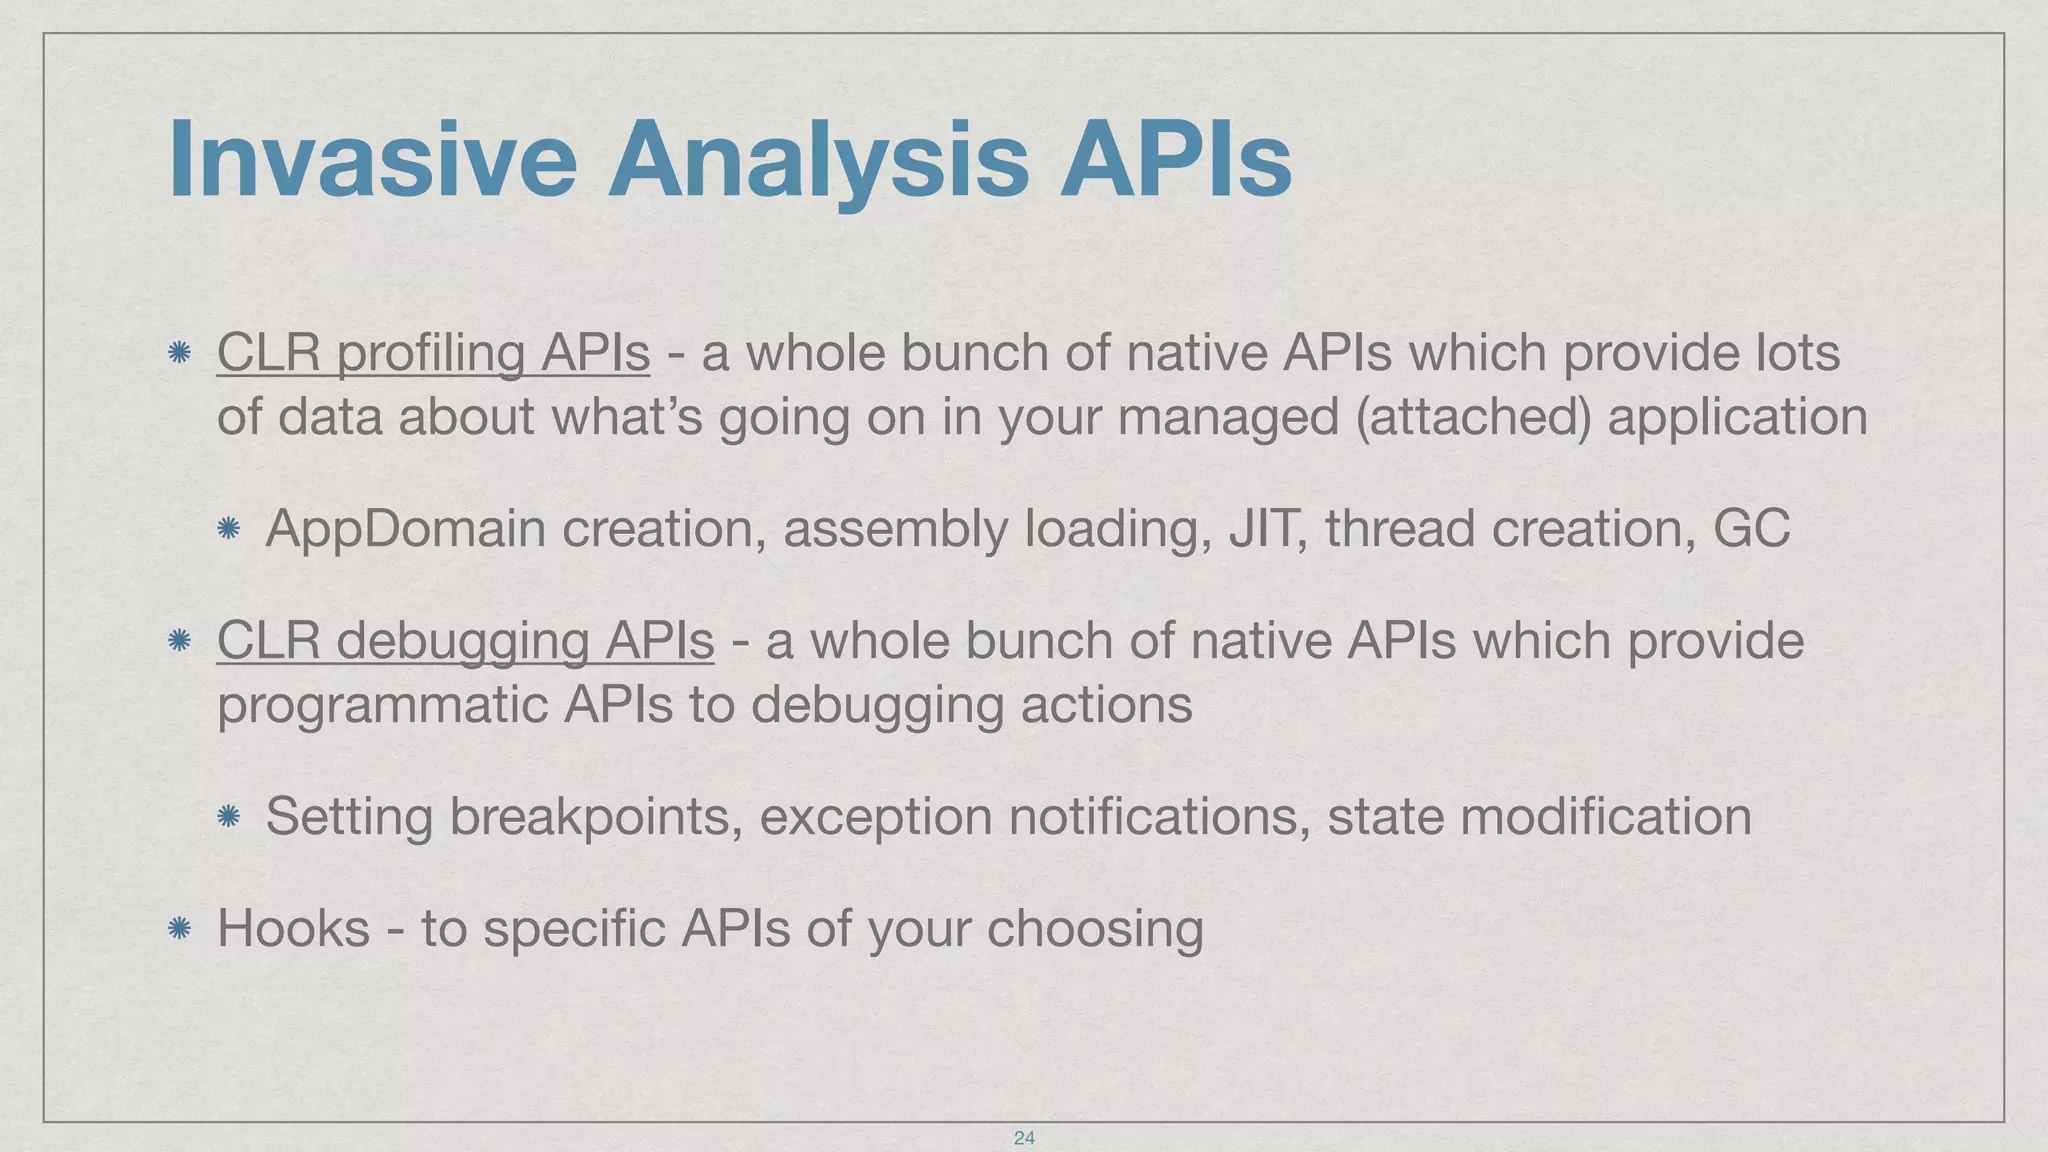

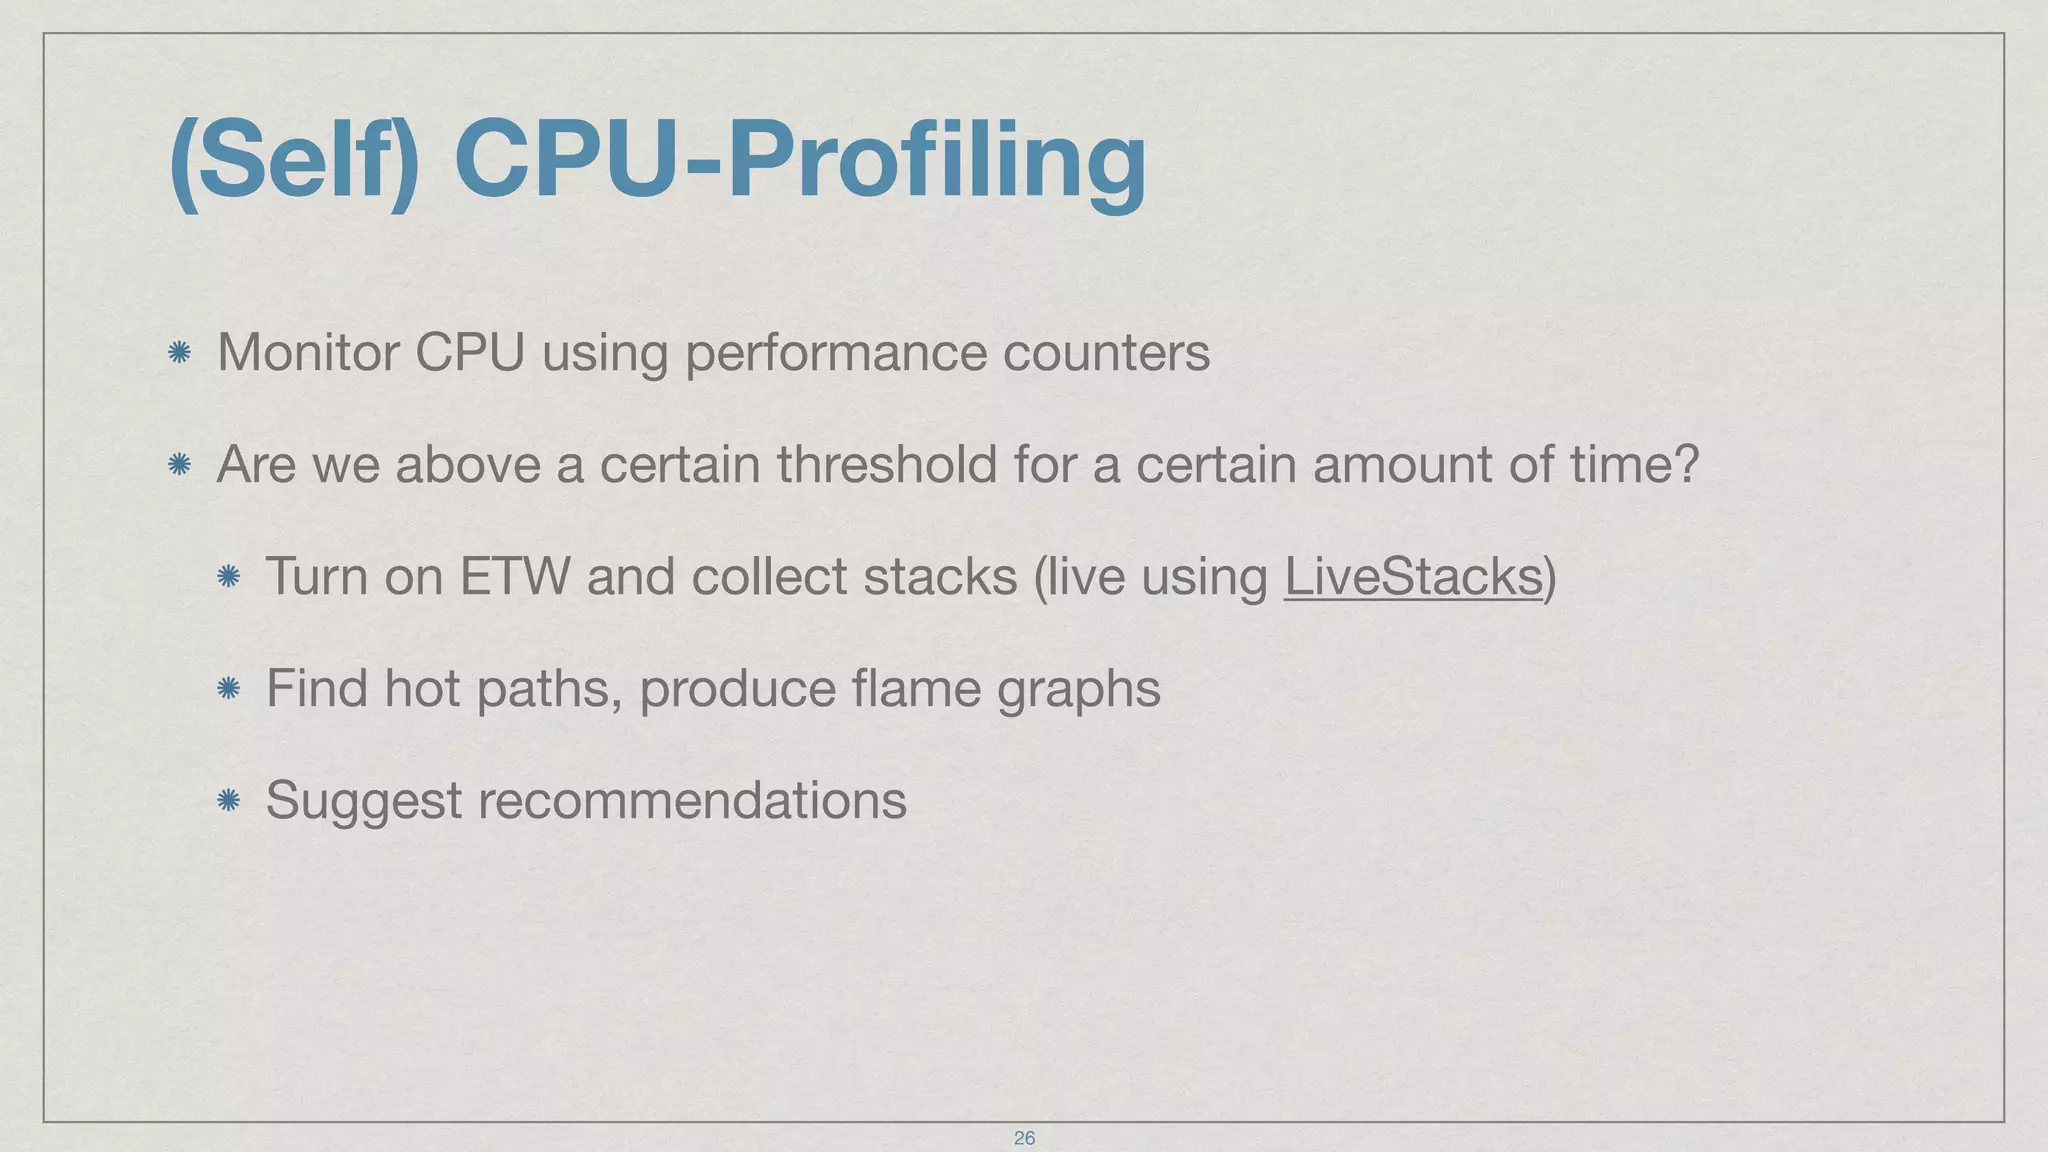
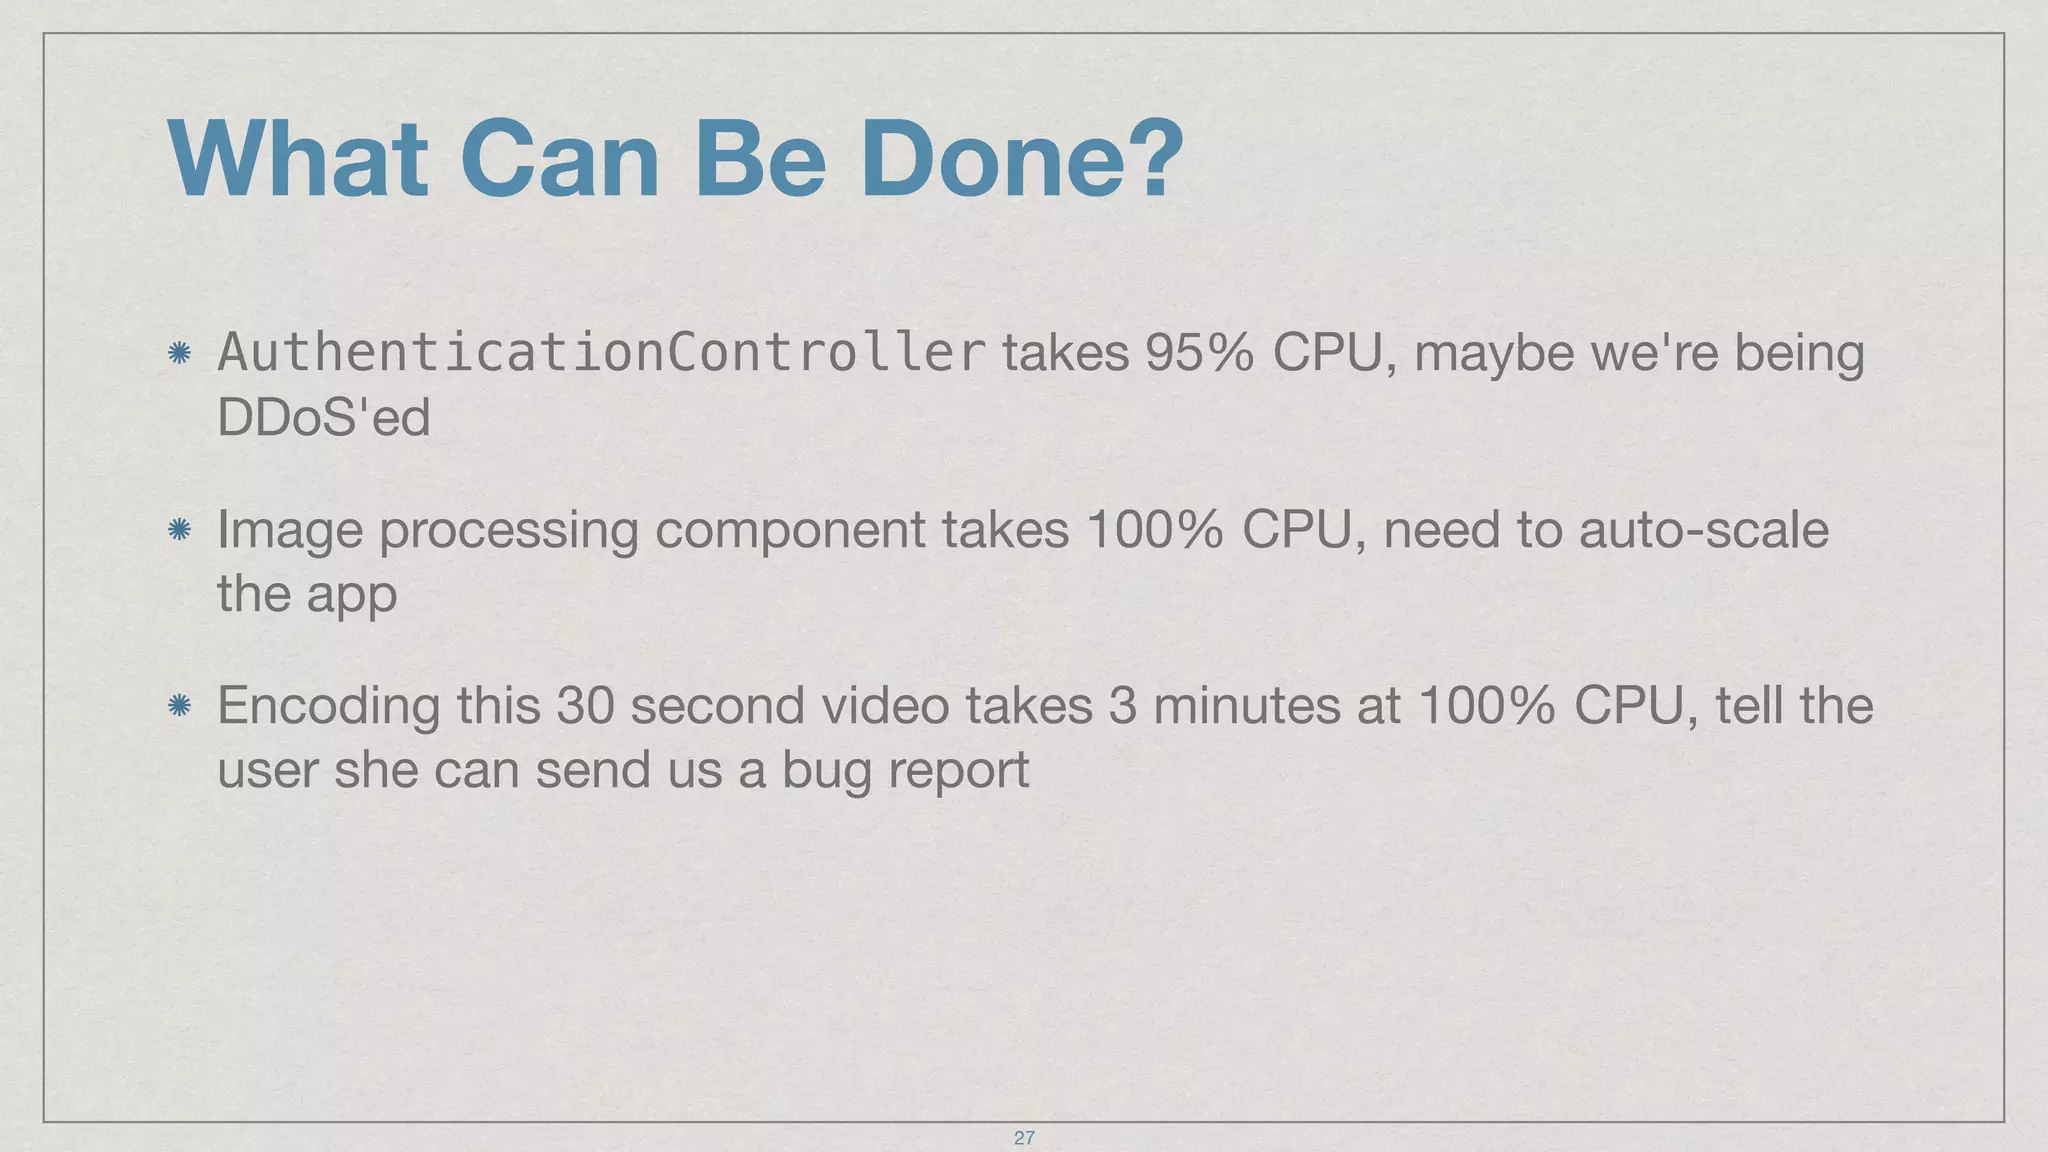
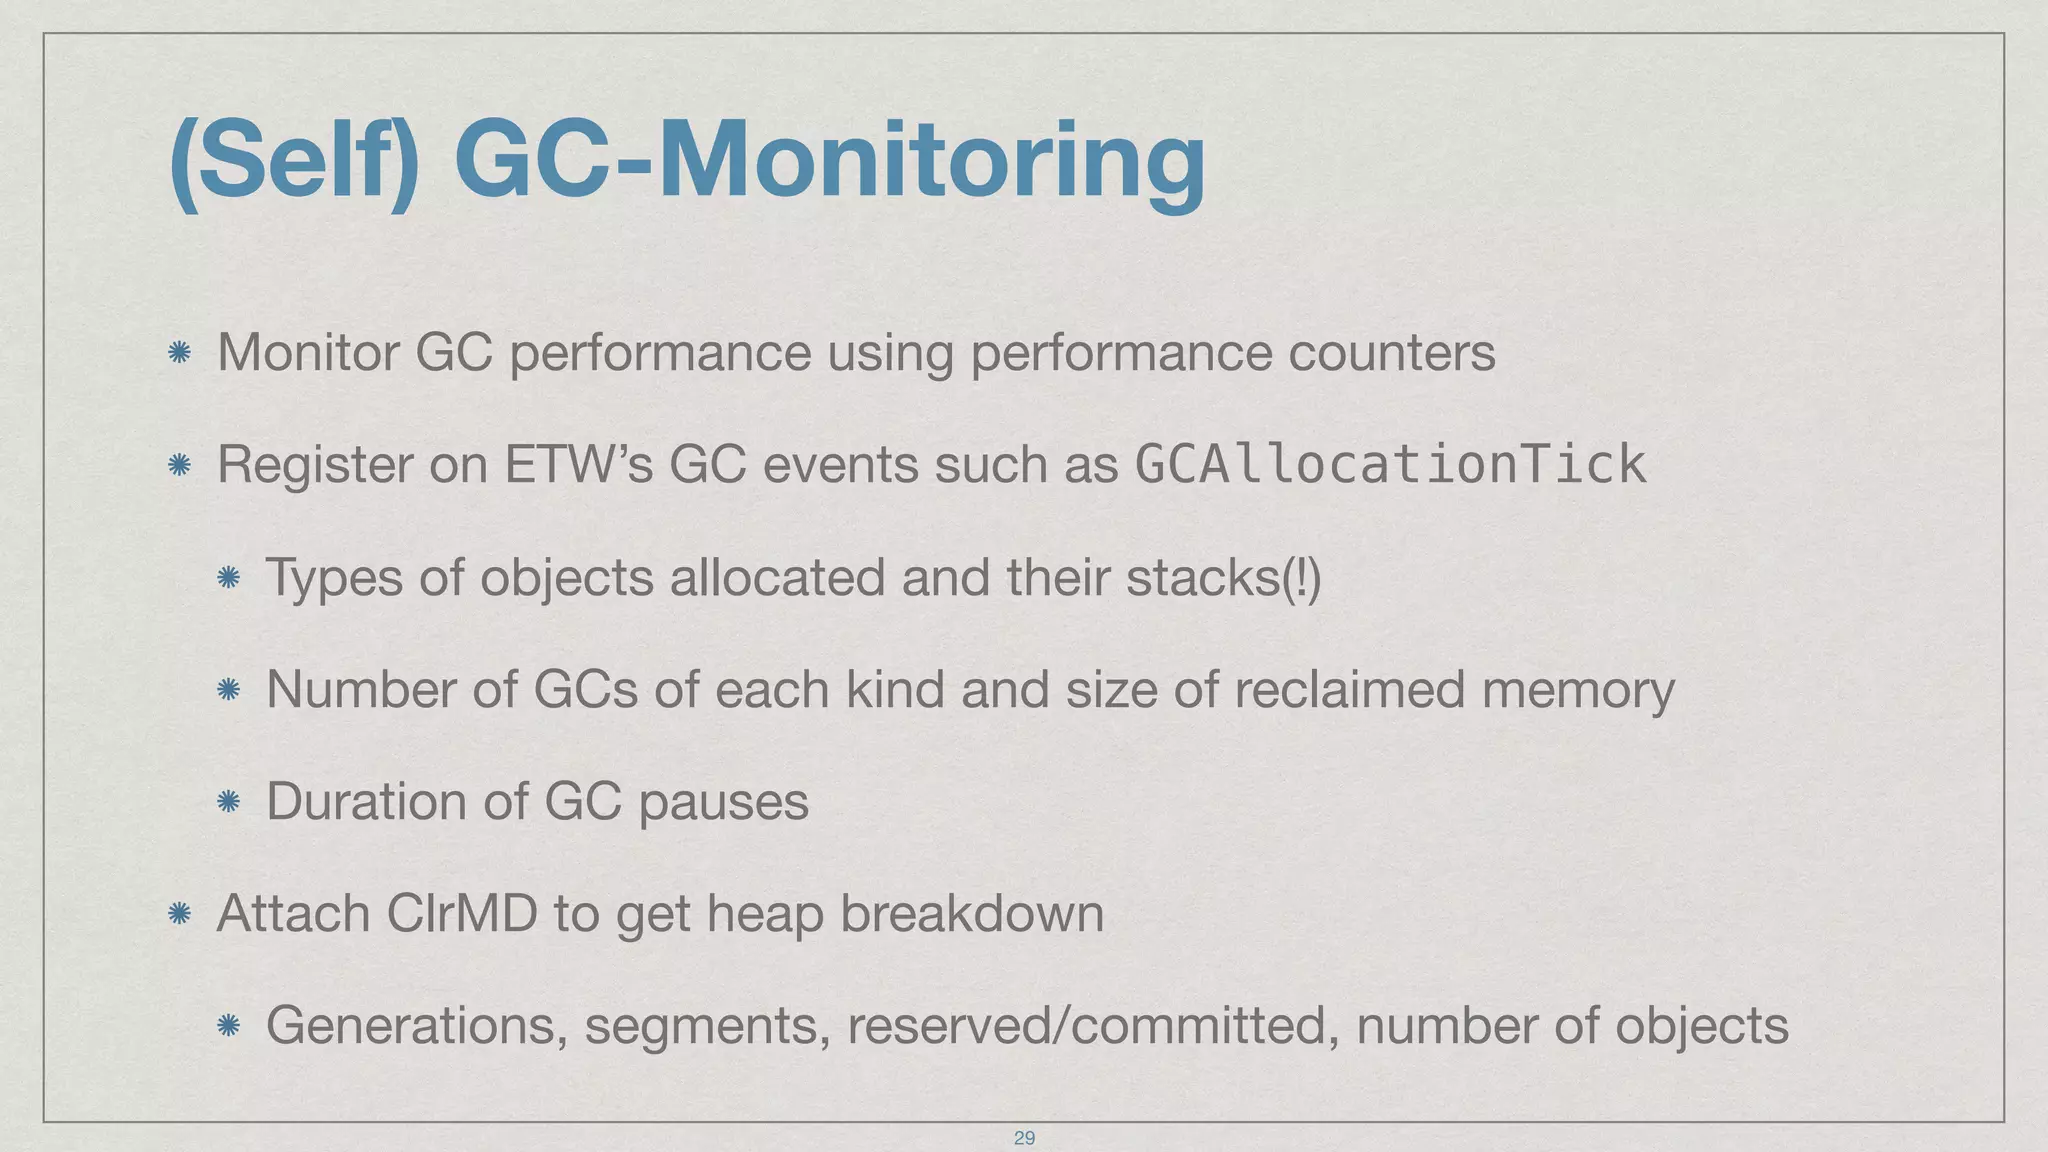
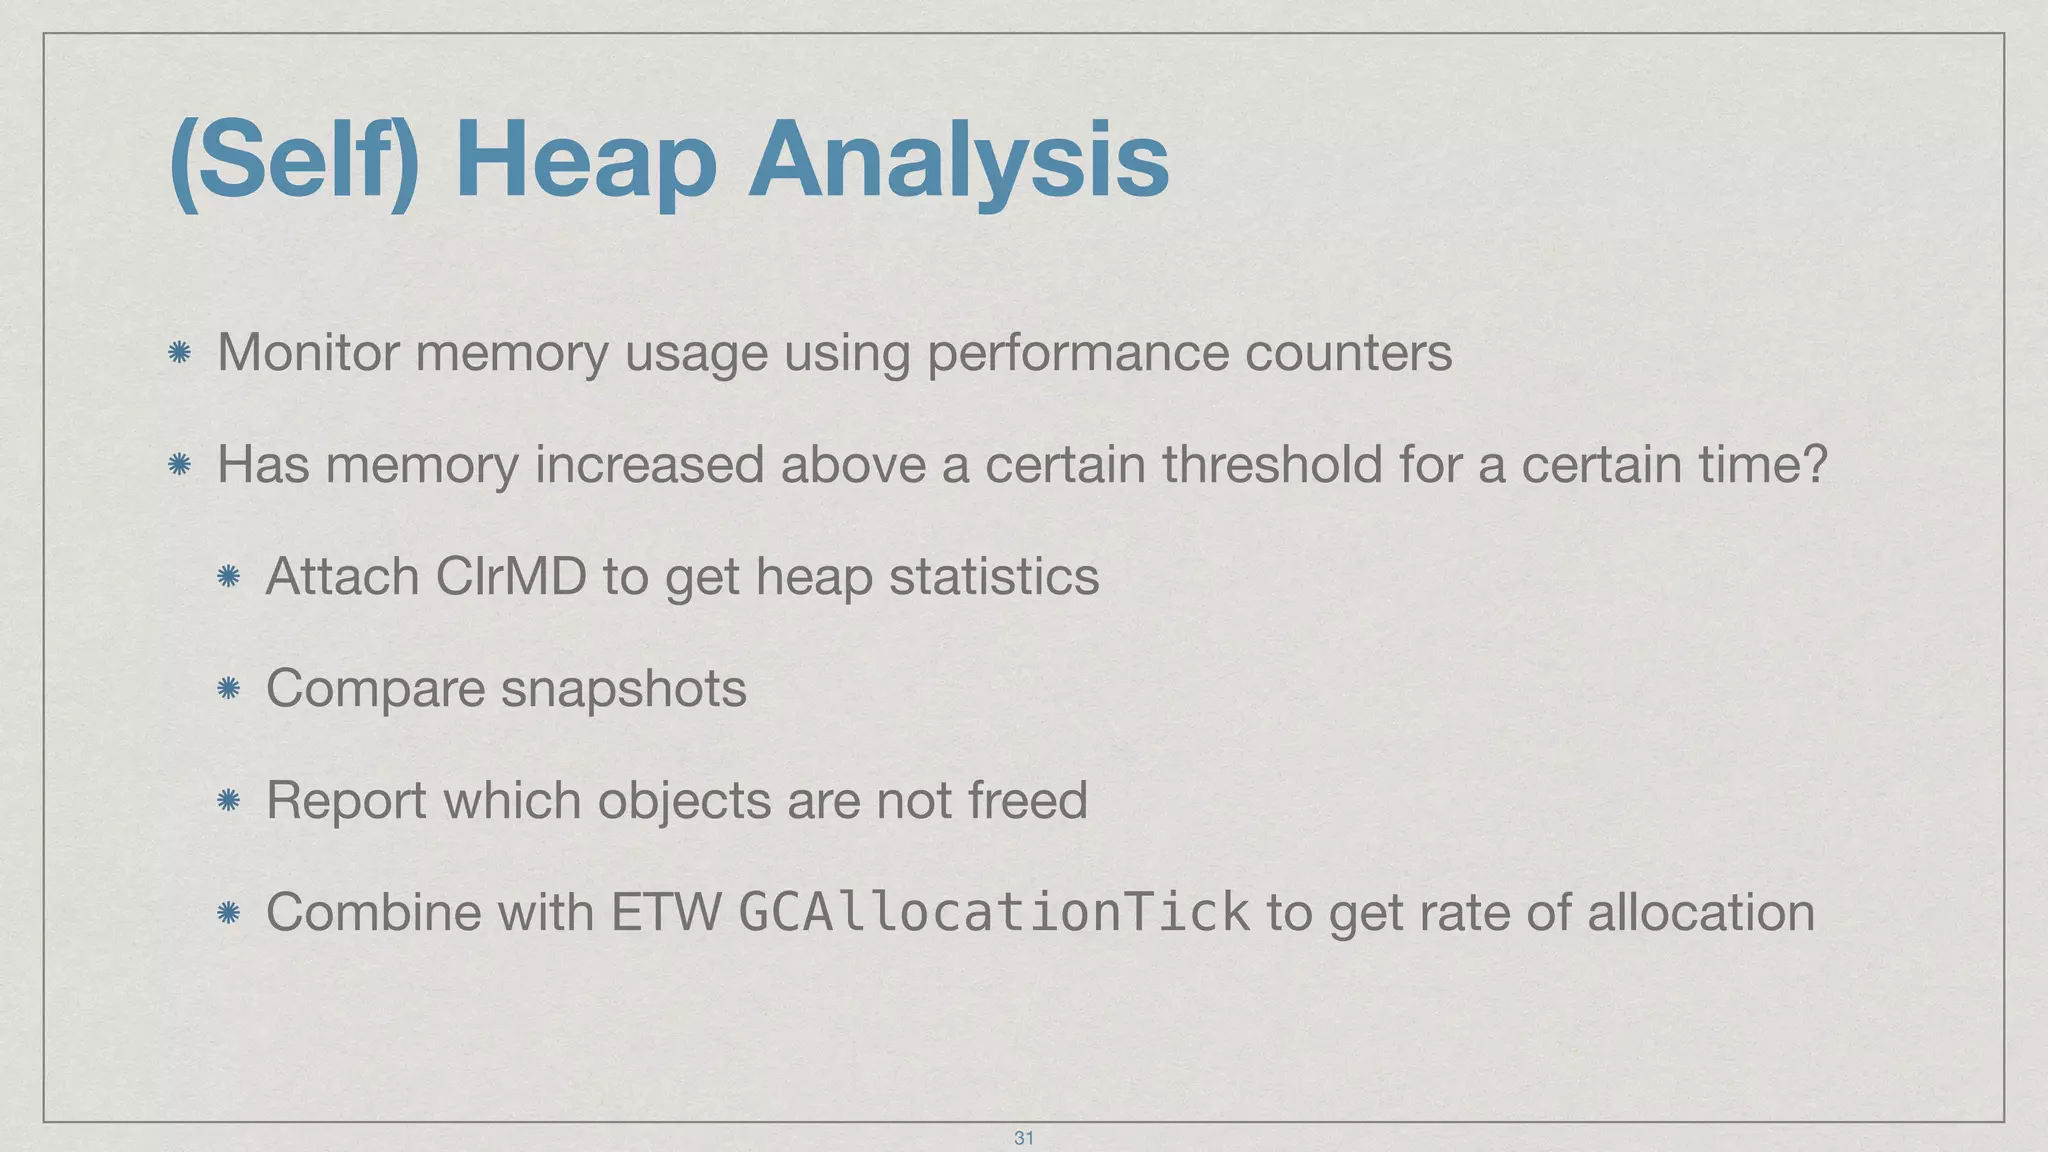
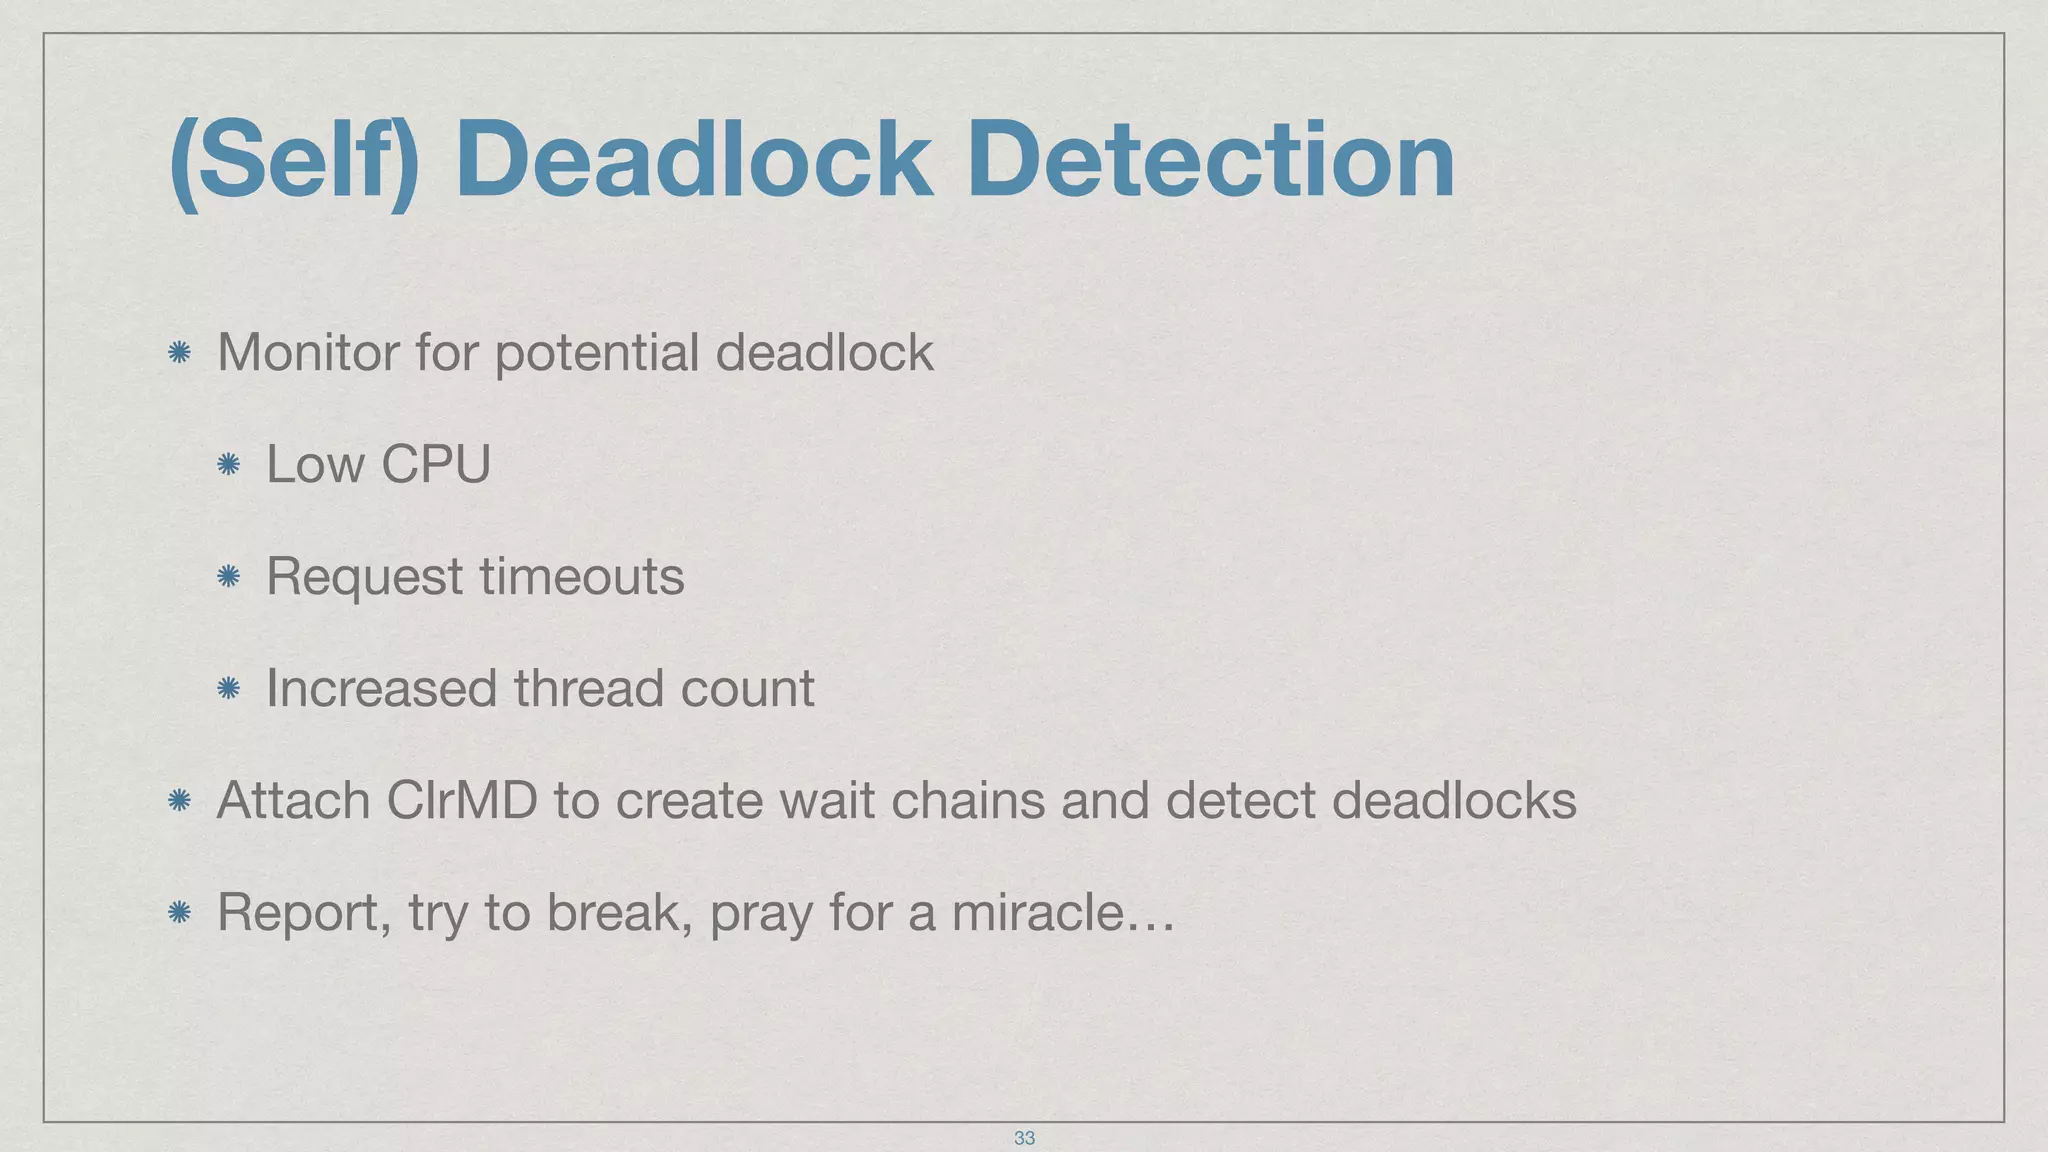


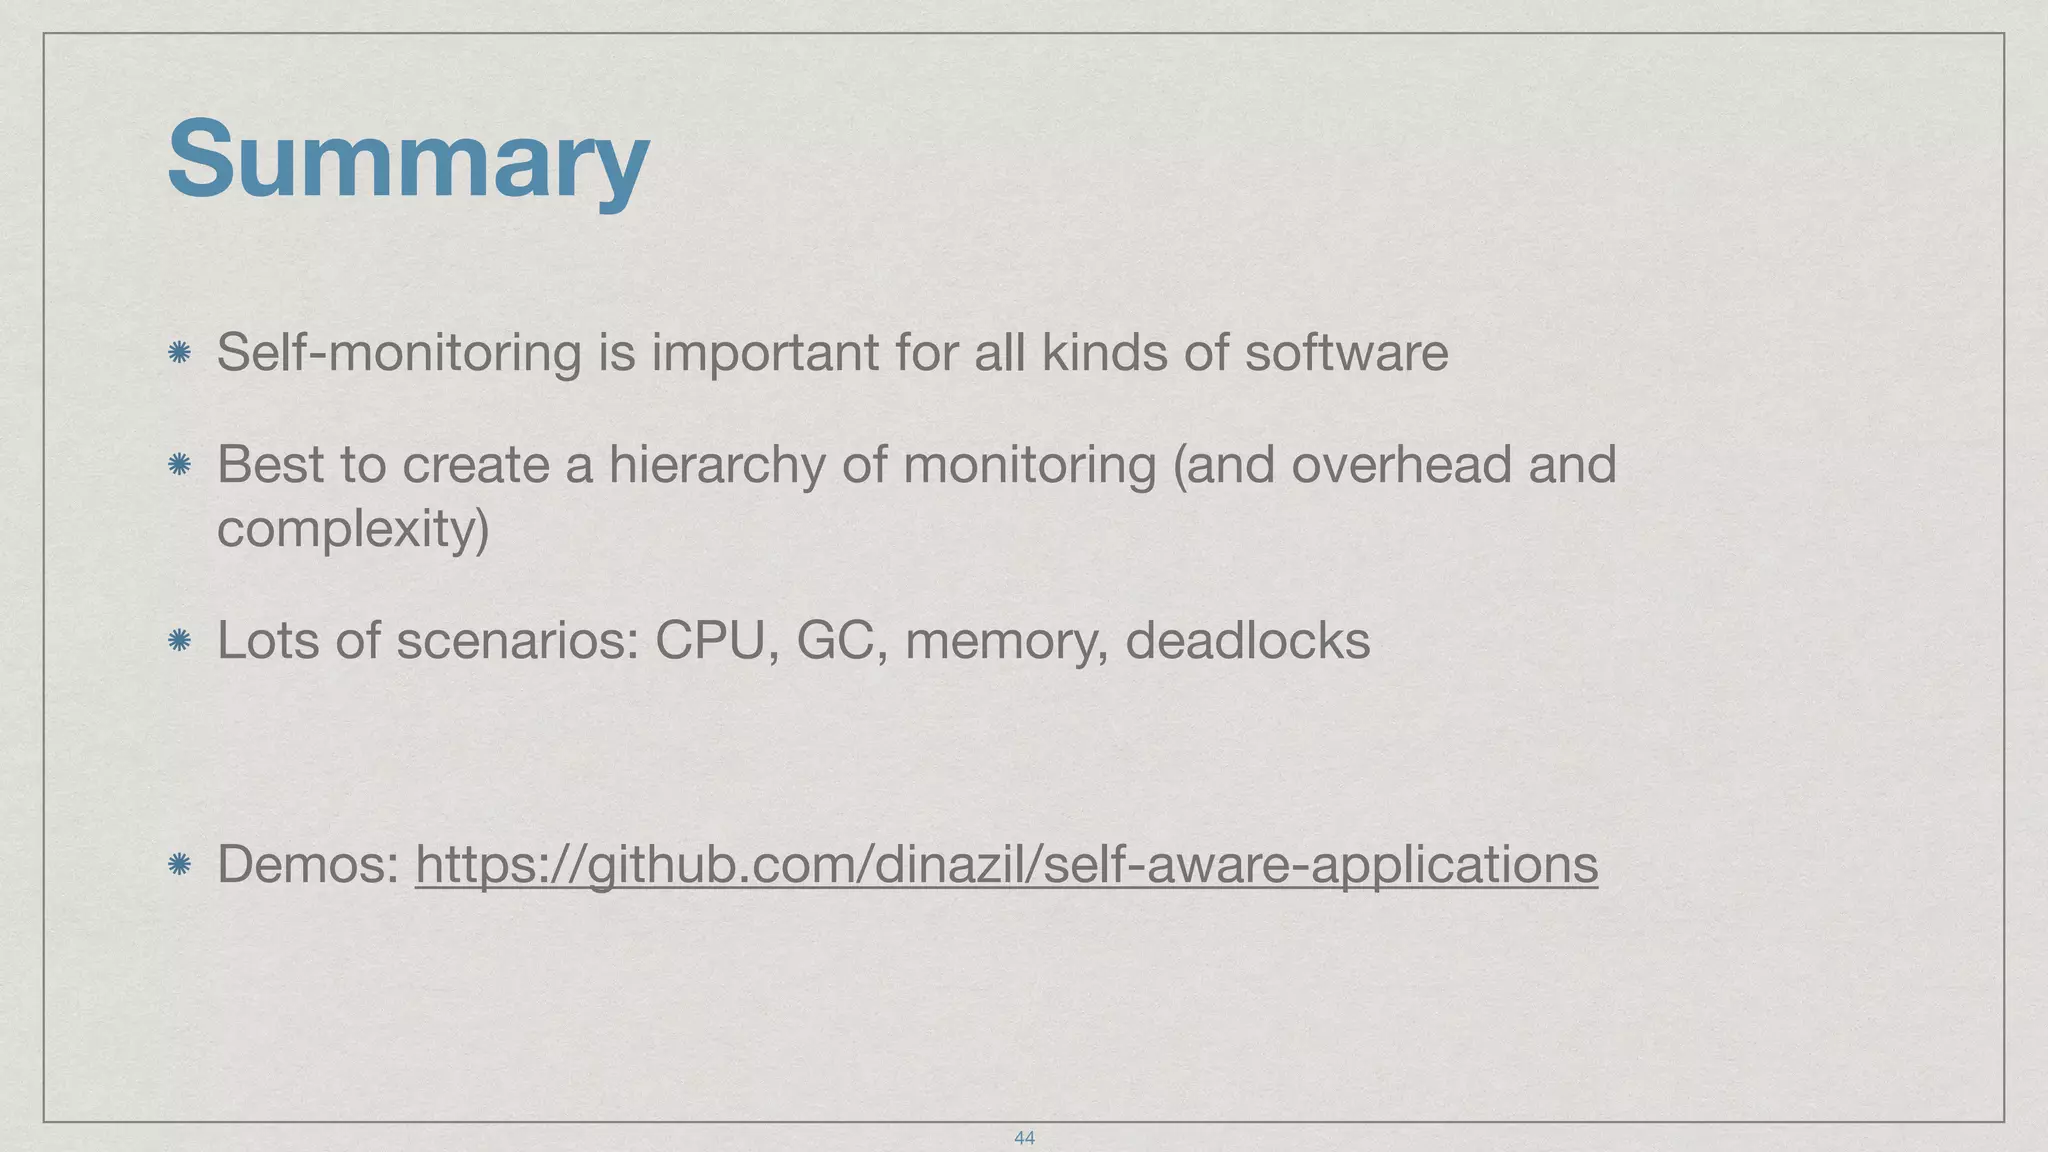


The document discusses the importance of self-monitoring in applications, emphasizing a hierarchical strategy for monitoring CPU, memory, garbage collection, and deadlocks. It highlights the necessity for both large-scale servers and simpler applications to use customized monitoring tools that meet specific business needs. Additionally, it outlines various performance counters and APIs for effective diagnostics and profiling while acknowledging the complexity and overhead involved in implementing such monitoring systems.


![Vibe Coding vs. Spec-Driven Development [Free Meetup]](https://cdn.slidesharecdn.com/ss_thumbnails/vibecodingvsspecdrivendevelopment-251209105622-43f455e7-thumbnail.jpg?width=640&height=640&fit=bounds)


