Downloaded 40 times


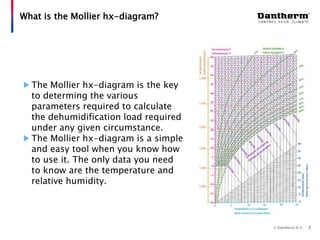
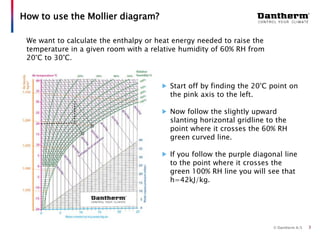
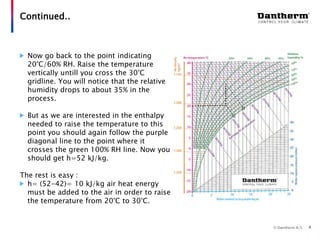
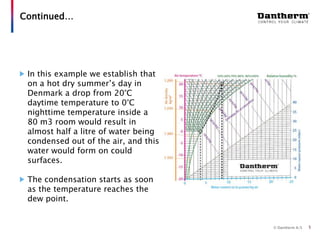
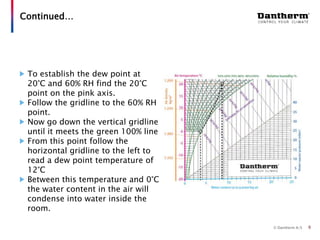
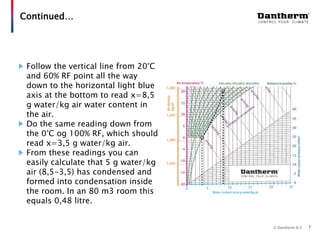


The document discusses using the Mollier hx-diagram to determine dehumidification needs. It explains that the Mollier hx-diagram allows you to determine parameters like enthalpy and dew point by plotting temperature and relative humidity on the chart. An example is provided where 20°C and 60% RH is plotted, then traced to 30°C to determine the enthalpy increase needed is 10 kJ/kg. Another example shows how to use the chart to calculate that lowering a room from 20°C to 0°C at night would cause 0.48 liters of condensation to form. The document encourages using the Mollier hx-diagram and contacting the company for further de


