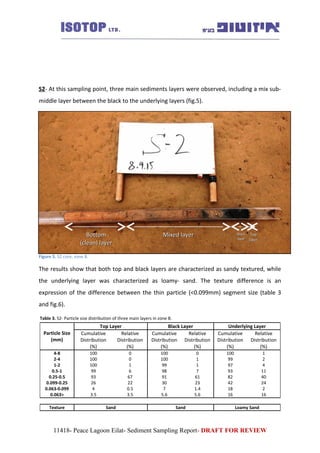
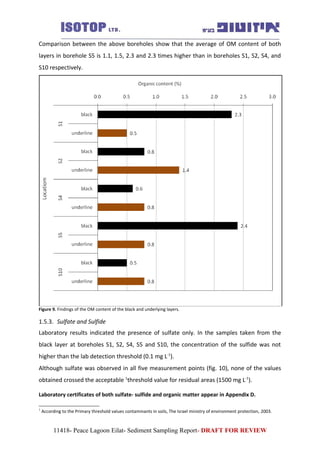
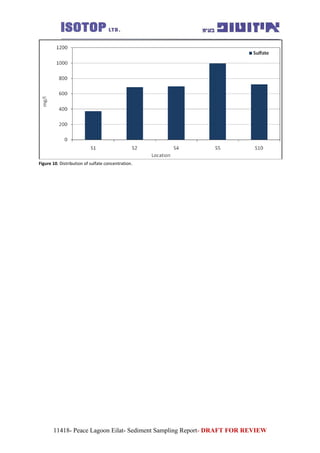
The report summarizes sediment sampling results from three zones of the Peace Lagoon in Eilat, Israel. Sediment cores were taken and analyzed for particle size distribution, organic matter content, and sulfate/sulfide concentration. In Zone A, the black layer had larger particles than the underlying layer. Zone B contained three distinct layers. Organic matter was highest in the black layers across zones. Sulfate concentrations varied between layers and locations. Groundwater was also monitored from two wells near the lagoon.
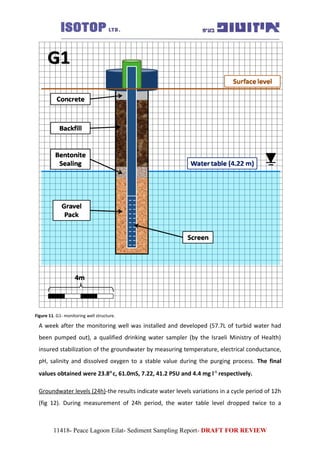
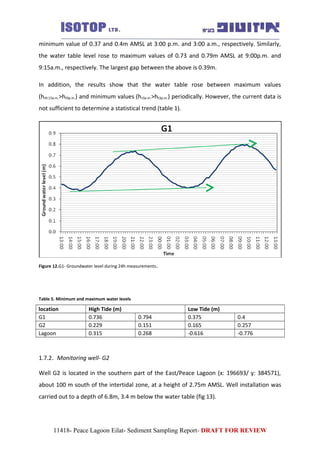
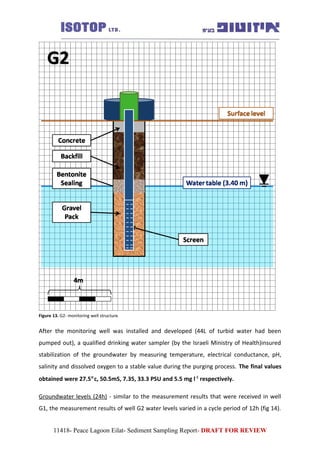


![11.[40 51]correlates in groundwater quality parameters and textural classes o...](https://cdn.slidesharecdn.com/ss_thumbnails/11-40-51correlatesingroundwaterqualityparametersandtexturalclassesofsoilsinaperi-industrialdistrictofthenigeriandeltaregion-120512235818-phpapp02-thumbnail.jpg?width=640&height=640&fit=bounds)


