Download to read offline


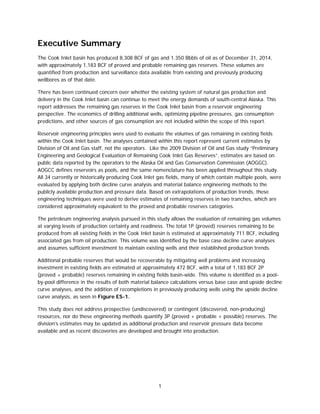
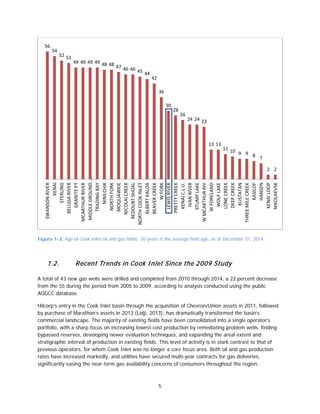
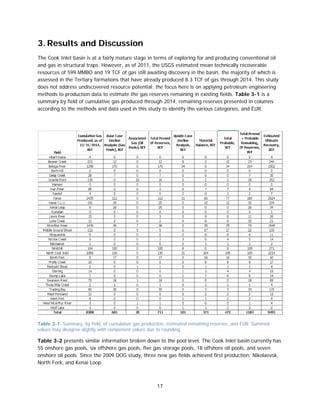
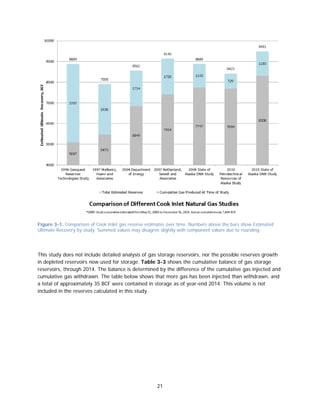
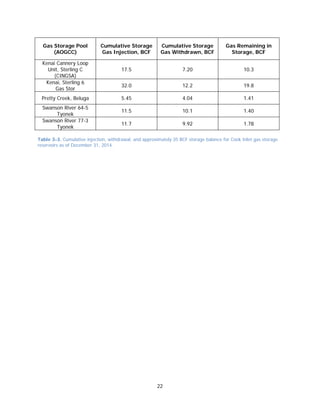
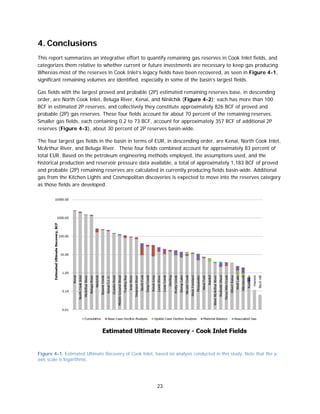
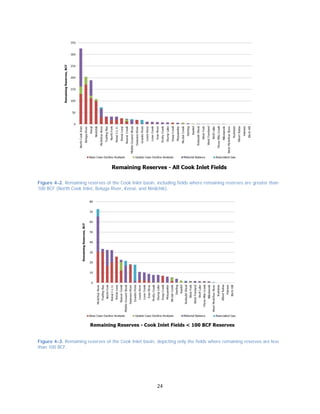


This report provides an updated engineering evaluation of remaining natural gas reserves in Cook Inlet, Alaska. It was authored by three petroleum reservoir engineers from the Alaska Division of Oil and Gas and edited by the Resource Evaluation Section Manager. The report finds that as of December 31, 2014, 3.9 trillion cubic feet of gas had been produced from Cook Inlet fields, with an estimated 3.4 trillion cubic feet of reserves remaining under existing economic and technical conditions. Of the remaining reserves, 1.7 trillion cubic feet require additional investment to be produced.


