SlideShare a Scribd company logo
1 of 16
Download to read offline
HEC-HMS Modeling Summary:
Cherry Creek Basin Tributary to Cherry Creek Dam
October 2008
Prepared by:
U.S. Army Corps of Engineers, Omaha District
Hydrology Section - Hydrologic Engineering Branch
1616 Capitol Avenue
Omaha, NE 68102-9000
Kevin D. Stamm, P.E.
ii
For Information Regarding This Document Please Contact:
Kevin Stamm, P.E.
U.S. Army Corps of Engineers, Omaha District
Attention: CENWO-ED-HE
1616 Capitol Avenue
Omaha, NE 68102-9000
(402) 995-2346
kevin.d.stamm@usace.army.mil
iii
Table of Contents
Table of Contents...........................................................................................................................iii
Table of Figures.............................................................................................................................iii
List of Tables .................................................................................................................................iii
1 General Information................................................................................................................ 5
1.1 Basin Description............................................................................................................ 5
1.2 Streamflow Data ............................................................................................................. 5
1.3 Spatial Data..................................................................................................................... 5
1.4 HEC-HMS....................................................................................................................... 5
2 Basin Model............................................................................................................................ 6
2.1 Delineations .................................................................................................................... 6
2.2 Land Use/Impervious Area............................................................................................. 6
2.3 Rainfall Losses................................................................................................................ 6
2.4 Transform Method .......................................................................................................... 8
2.5 Channel Routing ............................................................................................................. 8
3 Flood Control Storage........................................................................................................... 11
3.1 Sub-basin Impoundments.............................................................................................. 11
3.2 Cherry Creek Dam........................................................................................................ 11
3.3 Elevation-Storage Functions......................................................................................... 11
3.4 Spillway Rating............................................................................................................. 12
4 Meteorologic Models............................................................................................................ 13
4.1 User-Specified Hyetographs......................................................................................... 13
4.2 Inverse-Distance Precipitation Events.......................................................................... 13
5 Model Summary.................................................................................................................... 13
6 References............................................................................................................................. 15
Table of Figures
Figure 1. Cherry Creek Basin HEC-HMS model tributary to Cherry Creek Lake........................ 7
Figure 2. Cherry Creek elevation-capacity derived from the 1961, 1965, and 1988 bathymetric
surveys. ................................................................................................................................. 12
Figure 3. Cherry Creek spillway rating curves for the designed spillway, 2008 existing condition
and the improved channel condition..................................................................................... 13
List of Tables
Table 1. Soil loss parameters at field capacity and HMS transform parameters model sub-basins.
................................................................................................................................................. 9
Table 2. Green and Ampt soil parameters calibrated for the June 16, 1965 flood event............... 9
Table 3. Green and Ampt soil parameters calibrated for the May 6, 1973 flood event............... 10
Table 4. Green and Ampt soil parameters calibrated for the July 2, 2006 flood event. .............. 10
Table 5. Modeled sub-basins that contain unit graph parameters adjusted for watershed flood
storage................................................................................................................................... 11
Table 6. Cherry Creek Engineering Data..................................................................................... 11
Table 7. HEC-HMS model basin, meteorologic, and simulation components for Cherry Creek
Basin. .................................................................................................................................... 14
iv
5
1 GENERAL INFORMATION
1.1 Basin Description
Cherry Creek is a right bank tributary of the South Platte River which enters the river in Denver,
Colorado. The Cherry Creek basin contributing drainage area at its mouth is 414 mi2
, and at
Cherry Creek Dam it is 385.0 mi2
. The source of Cherry Creek is approximately 57 miles south
of its mouth at the Palmer Divide which separates the South Platte and Arkansas River basins.
The basin rises in the south to an elevation of 7700 ft and descends to elevation 5190 at its
mouth.
1.2 Streamflow Data
Average daily stream discharge was available for Cherry Creek at Franktown, Parker and
Melvin, CO, as well as Cherry Creek Lake. Franktown (06712000) and Melvin (06712500) are
USGS stream gages that report daily and instantaneous peak discharge, while Parker and Cherry
Creek Lake are maintained by the Corps of Engineers. The Melvin gage is no longer in service.
The Cherry Creek Reservoir gage is used in combination with gauged lake releases to report
daily reservoir inflow, elevation, and storage of Cherry Creek Lake.
During the June 16, 1965, and May 6, 1973, floods, data was collected that enabled the Corps of
Engineers to reconstruct flow hydrographs entering Cherry Creek Reservoir. These hydrographs
were used along with average daily stream flows to calibrate the hydrologic model.
1.3 Spatial Data
USGS 10-meter grid cell digital elevation data was obtained for the Cherry Creek basin through
the USGS Seamless Data clearinghouse. All GIS data was projected into the Standard
Hydrologic Grid (SHG) projection, an Albers equal-area projection. SHG projection is
referenced with the following spatial information:
Units: Meters
Datum: North American Datum, 1983 (NAD83)
1st
Standard Parallel: 29 deg 30 min 0 sec North
2nd
Standard Parallel: 45 deg 30 min 0 sec North
Central Meridian: 96 deg 0 min 0 sec West
Latitude of Origin: 23 deg 0 min 0 sec North
False Easting: 0.0
False Northing: 0.0
1.4 HEC-HMS
The HEC Hydrologic Modeling System (HMS) simulates the precipitation-runoff process
primarily for surface water applications, and computes watershed discharge, storage, and
diversions. The model computes runoff through an assortment of soil-water infiltration, runoff
transform, and routing methods in a lumped or semi-distributed parameter approach. The Cherry
6
Creek hydrologic model was created using a lumped parameter approach using the ArcView
extension GeoHMS to create basin boundaries, a stream network, and extract basin physical
properties from the digital elevation data. Hydrologic model simulations were performed using
HEC-HMS version 3.0.1.
2 BASIN MODEL
2.1 Delineations
A total of 22 sub-basins tributary to Cherry Creek Dam were delineated from the 10-meter
resolution digital elevation model. Contributing drainage areas along Cherry Creek at gaged
locations were 165.9 mi2
at Franktown, 339.5 mi2
at the Melvin, and 386.1 mi2
at Cherry Creek
Dam.
2.2 Land Use/Impervious Area
The progression of development within the basin since 1954 was identified and classified using
USGS 7.5-minute quadrangle (quad) maps. Development in the years 1954, 1964, and 1988 was
determined by identifying urban development and road networks. Aerial photographs from 1999
and 2004 were used to identify development for 2004. Impacts of land use are reflected in the
model as sub-basin percent impervious area. The final calibrated model depicts 2004 land use
conditions
2.3 Rainfall Losses
The Cherry Creek model uses the Green and Ampt infiltration method along with initial surface
storage and canopy losses. The Green and Ampt method was used because it has the ability to
simulate variations in initial soil moisture content and changes in soil infiltration rate that occur
during a rain storm.
The Green-Ampt Method computes infiltration rate and cumulative infiltration as:
⎟⎟
⎠
⎞
⎜⎜
⎝
⎛
+
ΨΔ
=
Δ+
Δ+ 1
tt
tt
F
Kf
θ
⎥
⎦
⎤
⎢
⎣
⎡
ΨΔ+
ΨΔ+
ΨΔ+Δ+= Δ+
Δ+
θ
θ
θ
t
tt
ttt
F
F
KtKFF ln
ft+Δt = current potential infiltration rate
K = saturated hydraulic conductivity
ψ = soil wetting suction front
Δθ = volumetric moisture deficit
Ft+Δt = cumulative infiltration
Ft = cumulative infiltration at the previous time step.
7
Figure 1. Cherry Creek Basin HEC-HMS model tributary to Cherry Creek Lake.
8
Potential infiltration rate (f) and cumulative infiltration (F) are functions of F and the hydrologic
parameter constants Δθ , Ψ, and K, specified within the model. K defines the rate which water
moves through the soil when the soil is saturated, and it is not equivalent to the infiltration rate.
Ψ is a soil physical property that defines the soil pressure or tension usually as a function of soil
dryness. Volumetric moisture deficit (Δθ) is the soil pore volume free of water, and it is
dependent on the soil porosity and water content. Effective porosity was used as Δθ for dry soil
(Rawls et. al, 1982), and a reduced Δθ was computed for wetter soils at field capacity. Field
capacity is a condition of the soil in which a saturated soil is allowed time to sufficiently drain,
and the soil tension is at -0.33 bars of pressure. Field capacity Δθ was based on standard values
cited in Schwab, et al. (1993).
From the equation for f, initial f is near infinity because F is near zero, but as F increases, f
approaches K. Infiltration occurs at a rate equal to the rainfall rate (i) if f is less than i. When i
exceeds f, infiltration occurs at the rate of f, and F is computed with the specified Green-Ampt
equation.
Green and Ampt parameters required by HEC-HMS include volumetric moisture deficit (θ),
wetting suction (Ψ) front, and saturated hydraulic conductivity (K). Sub-basin averaged Green
and Ampt parameters were determined by combining standard parameter values associated with
soil texture (Rawls et. al., 1982) to a GIS overlay of Cherry Creek sub-basins and soil textural
classes. Field capacity soil loss parameters and unit graph parameters for individual sub-basins
are provided in Table 1. Green and Ampt soil loss parameters used in the calibration of flood
hydrographs for the 1965, 1973, and 2006 discharge events are provided in Tables 2 – 4.
2.4 Transform Method
The Clark’s synthetic unit hydrograph method was chosen for this model in order to provide the
capability of using gridded time-series precipitation data in the Corps Water Management
System (CWMS) at a later time. Clark’s method in HEC-HMS uses a smooth function fitted to a
typical time-area relationship in which only the basin time of concentration, tc, and the storage
coefficient, R, are specified in the model. A storage coefficient of 1.0 worked well in the
calibration simulations.
2.5 Channel Routing
The Muskingum-Cunge routing method was used to route sub-basin discharges through the
Cherry Creek channel to Cherry Creek Lake. Eight-point channel cross sections were extracted
from the 10-meter digital elevation model of Cherry Creek basin using GeoRAS. Roughness
coefficients for the channel and overbank areas of 0.03 and 0.05, respectively, were set during
the model calibration. Observation of some streamflow data indicated that channel infiltration
caused a significant volume of water to be lost from Cherry Creek; however, this phenomenon
was not modeled in this particular version of the Cherry Creek model.
9
Table 1. Soil loss parameters at field capacity and HMS transform parameters model sub-basins.
Sub-basin
Initial
Loss
(Inches)
Volumetric
Moisture
Deficit
Wetting
Suction
Front
(inches)
Saturated
Hydraulic
Conductivity
(in/hr)
Time of
Concentration
(hrs)
Clark’s
Storage
Coefficient
(R)
R100W100
R10W10
R110W110
R120W120
R140W140
R150W150
R180W180
R190W190
R200W200
R210W210
R220W220
R230W230
R240W240
R250W250
R260W260
R270W270
R30W30
R50W50
R60W60
R70W70
R80W80
R90W90
0.2
0.2
0.2
0.2
0.2
0.2
0.2
0.2
0.2
0.2
0.2
0.2
0.2
0.2
0.2
0.2
0.2
0.2
0.2
0.2
0.2
0.2
0.21
0.13
0.24
0.22
0.21
0.22
0.22
0.22
0.17
0.20
0.17
0.20
0.21
0.21
0.17
0.18
0.21
0.24
0.23
0.20
0.19
0.21
10.4
15.1
8.6
9.6
10.5
10.0
9.3
10.0
13.0
10.1
13.4
10.0
9.6
9.5
13.3
12.7
10.7
8.8
9.2
11.3
12.1
9.7
0.31
0.23
0.36
0.33
0.31
0.32
0.34
0.32
0.26
0.28
0.25
0.28
0.28
0.28
0.25
0.27
0.32
0.35
0.33
0.30
0.28
0.31
2.16
2.68
2.72
2.46
5
3.10
1.53
2.79
3.48
5.4
0.84
9.08
5.98
7.9
2.92
2.29
4.19
1.67
2.82
3.78
3.33
1.69
1
1
1
1
2.5
1
1
4
1
4
1
4
4
4
1
1
1
1
1
1
1
1
Table 2. Green and Ampt soil parameters calibrated for the June 16, 1965 flood event.
Sub-basin
Initial Loss
(Inches)
Volumetric
Moisture Deficit
Wetting Suction
Front (inches)
Saturated Hydraulic
Conductivity
(in/hr)
R100W100
R10W10
R110W110
R120W120
R140W140
R150W150
R180W180
R190W190
R200W200
R210W210
R220W220
R230W230
R240W240
R250W250
R260W260
R270W270
R30W30
R50W50
R60W60
R70W70
R80W80
R90W90
0.2
0.2
0.2
0.2
0.2
0.2
0.2
0.2
0.2
0.2
0.2
0.2
0.2
0.2
0.2
0.2
0.2
0.2
0.2
0.2
0.2
0.2
0.20
0.13
0.23
0.21
0.20
0.21
0.21
0.21
0.16
0.19
0.16
0.19
0.20
0.20
0.16
0.17
0.20
0.23
0.22
0.19
0.18
0.20
10.0
14.6
8.2
9.2
10.1
9.6
8.9
9.6
12.6
9.7
13.0
9.6
9.2
9.1
12.9
11.9
10.3
8.4
8.8
10.9
10.7
9.3
0.31
0.23
0.36
0.33
0.31
0.32
0.34
0.32
0.26
0.28
0.25
0.28
0.28
0.28
0.25
0.27
0.32
0.35
0.33
0.30
0.28
0.31
10
Table 3. Green and Ampt soil parameters calibrated for the May 6, 1973 flood event.
Sub-basin
Initial Loss
(Inches)
Volumetric
Moisture Deficit
Wetting Suction
Front (inches)
Saturated Hydraulic
Conductivity
(in/hr)
R100W100
R10W10
R110W110
R120W120
R140W140
R150W150
R180W180
R190W190
R200W200
R210W210
R220W220
R230W230
R240W240
R250W250
R260W260
R270W270
R30W30
R50W50
R60W60
R70W70
R80W80
R90W90
0.2
0.2
0.2
0.2
0.2
0.2
0.2
0.2
0.2
0.2
0.2
0.2
0.2
0.2
0.2
0.2
0.2
0.2
0.2
0.2
0.2
0.2
0.01
0.01
0.01
0.01
0.01
0.01
0.01
0.01
0.01
0.01
0.01
0.01
0.01
0.01
0.01
0.01
0.01
0.01
0.01
0.01
0.01
0.01
2.8
4.5
2.0
2.3
2.7
2.5
2.1
2.5
4.5
3.1
4.7
3.0
2.8
2.8
4.1
3.7
2.8
2.0
2.1
3.2
3.5
2.4
0.31
0.23
0.36
0.33
0.31
0.32
0.34
0.32
0.26
0.28
0.25
0.28
0.28
0.28
0.25
0.27
0.32
0.35
0.33
0.30
0.28
0.31
Table 4. Green and Ampt soil parameters calibrated for the July 2, 2006 flood event.
Sub-basin
Initial Loss
(Inches)
Volumetric
Moisture Deficit
Wetting Suction
Front (inches)
Saturated Hydraulic
Conductivity
(in/hr)
R100W100
R10W10
R110W110
R120W120
R140W140
R150W150
R180W180
R190W190
R200W200
R210W210
R220W220
R230W230
R240W240
R250W250
R260W260
R270W270
R30W30
R50W50
R60W60
R70W70
R80W80
R90W90
0.2
0.2
0.2
0.2
0.2
0.2
0.2
0.2
0.2
0.2
0.2
0.2
0.2
0.2
0.2
0.2
0.2
0.2
0.2
0.2
0.2
0.2
0.21
0.13
0.24
0.22
0.21
0.22
0.22
0.22
0.17
0.20
0.17
0.20
0.21
0.21
0.17
0.18
0.21
0.24
0.23
0.20
0.19
0.21
10.4
15.1
8.6
9.6
10.5
10.0
9.3
10.0
13.0
10.1
13.4
10.0
9.6
9.5
13.3
12.7
10.7
8.8
9.2
11.3
12.1
9.7
0.31
0.23
0.36
0.33
0.31
0.32
0.34
0.32
0.26
0.28
0.25
0.28
0.28
0.28
0.25
0.27
0.32
0.35
0.33
0.30
0.28
0.31
11
3 FLOOD CONTROL STORAGE
3.1 Sub-basin Impoundments
The National Inventory of Dams lists 41 flood control structures in the Cherry Creek drainage
basin, 26 located upstream of the Franktown, CO, stream gage; and, 15 located downstream of
the Franktown gage. These structures delay the runoff hydrograph peak discharge by storing
water behind the impoundments. In the hydrologic model flood control structures impact sub-
basins upstream of Cherry Creek Lake. The main basin model does not incorporate the flood
control structures, but compensates for runoff storage and the lag in time of peak discharge
through modified Clark storage coefficients (Table 5) and lagging of times of peak discharge.
Table 5. Modeled sub-basins that contain unit graph parameters adjusted for watershed flood storage.
Sub-basin R
% of
Controlled
Area
Flood Storage
ac ft
R140W140
R190W190
R210W210
R230W230
R240W240
R250W250
2.5
4.0
4.0
4.0
4.0
4.0
34.6
54.7
54.4
79.6
85.0
87.1
618
767
1016
2871
1427
2042
3.2 Cherry Creek Dam
Cherry Creek Dam engineering data is listed below in Table 6.
Table 6. Cherry Creek Engineering Data.
Dam Embankment
Top of dam, ft MSL
Length of Dam, ft
Height of Dam, ft MSL
Stream bed, ft MSL
5644.5
14,300
141
5504.0
Reservoir Elev. and Area
Maximum Pool, ft MSL
Top of flood control pool
Top of multipurpose pool
5645.0
5608.7
5550.0
Spillway
Crest elevation, ft MSL
Design width, ft MSL
5598.0 (design)
5608.7 (flood control)
5610.6 (2008 condition)
67
Outlet Works
Number and size
Length, ft
Discharge capacity, cfs
2 – 8 x 12 ft. oval conduits
1 – 12 ft. circular conduit
679.5 ft
8100 at 5598.0 ft MSL
3.3 Elevation-Storage Functions
Over the life of Cherry Creek Dam the volume of permanent and flood control storage has
changed due to major runoff events; therefore, several reservoir-elevation-capacity curves are
used in the hydrologic model. The model contains reservoir elevation-storage functions based on
bathymetric surveys conducted in 1950, 1961, 1965, and 1988. Functions from 1961, 1965 and
1988 are plotted in Figure 2. The 1988 curve reflects the most recently surveyed lake
bathymetry.
12
5510
5525
5540
5555
5570
5585
5600
5615
5630
5645
0 25000 50000 75000 100000 125000 150000 175000 200000 225000 250000
Capacity (acre feet)
Elevation(ftMSL)
1961
1965
1988
Figure 2. Cherry Creek elevation-capacity derived from the 1961, 1965, and 1988 bathymetric surveys.
3.4 Spillway Rating
The Cherry Creek spillway was originally designed and constructed with a crest elevation of
5598 ft MSL and a bottom width of 67 feet with side slopes ranging from one (horizontal) on
two (vertical) to one on one. The spillway was designed using a Manning’s roughness
coefficient (n) of 0.025 for velocity limitations and 0.035 for spillway capacity. Over time the
poor stability of the slopes caused sloughing toward the bottom of the spillway, effectively
raising the crest elevation to 5608.7 ft MSL. In addition a lack of maintenance has allowed thick
shrubs and some trees to grow in the spillway raising estimated channel coefficients to 0.075 and
side slope coefficients to 0.065. The reservoir regulation manual specifies 5608.7 ft MSL as the
top of the flood control pool and crest of the spillway channel; however, the April 2008 survey
determined the crest elevation was near 5610.6 ft MSL with a rating curve reflecting the existing
channel roughness conditions. The three crest elevation rating curves plotted in Figure 3 are for
the design condition (5598.0 ft MSL), an improved channel condition with lower roughness
(5608.7 ft MSL), and the existing channel condition (5610.6 ft MSL).
The hydrologic model includes discharge rating curves for the 5608.7 ft MSL crest elevation in
its existing condition (EC), the 5608.7 ft MSL crest elevation in an improved condition (IC), and
the 5610.7 ft MSL crest elevation in its existing condition (EC). Additional rating curves include
discharge due to dam overtopping (OT) and outlet works (OW) discharge limited to 5000 cfs.
13
5595
5605
5615
5625
5635
5645
5655
5665
0 10000 20000 30000 40000 50000 60000 70000 80000
Discharge (cfs)
Elevation(ftMSL)
5598.0 Crest
5608.7 Crest
5610.6 Crest
Figure 3. Cherry Creek spillway rating curves for the designed spillway, 2008 existing condition and the
improved channel condition.
4 METEOROLOGIC MODELS
4.1 User-Specified Hyetographs
User-specified hyetograph precipitation methods were used for Cherry Creek calibration floods
which included the June 16, 1965 storm; May 5, 1973 storm; and the July 2, 2006 storm. User-
specified hyetographs are rainfall hyetographs specified for individual sub-basins. Complete
hyetograph information is included in the HEC-HMS meteorologic model files.
4.2 Inverse-Distance Precipitation Events
Inverse-distance meteorological models represent rainfall events by weighing rain gage
precipitation by the inverse of the distance from the gage to the sub-basin centroid. This method
works relatively well if the watershed contains a good network of rain gages. The hydrologic
model contains meteorological models for the August 3, 1963; and July 23, 1983 storms.
5 MODEL SUMMARY
Table 7 summarizes the basin models, meteorological models, and simulations that the Cherry
Creek HEC-HMS model contains. The basin models are all based on the same sub-basin
14
delineations, unit graph parameters, and channel properties; but, they differ in initial soil
conditions. Both inverse-distance and user-specified hyetograph meteorologic models are
contained within the model files. The model was calibrated using primarily user-specified
hyetographs for the 1965, 1973, and 2006 runoff events. Finally the model is configured to
perform five simulations. The Cherry Creek Calibrated basin model was not used in a
simulation, yet it contains baseline soil moisture parameters from which most simulations can be
initiated.
Table 7. HEC-HMS model basin, meteorologic, and simulation components for Cherry Creek Basin.
Basin Model Description
Cherry Creek Calibrated
Calib_06July
Calib_63
Calib_65
Calib_73
Calib_88
Baseline model with 2004 imperviousness, field capacity soil parameters, and
calibrated Clark parameters
Cherry Creek Calibrated model, soil parameters adjusted for 2006 storm
Cherry Creek Calibrated model, soil parameters adjusted for 1963 storm
Cherry Creek Calibrated model, soil parameters adjusted for 1965 storm
Cherry Creek Calibrated model, soil parameters adjusted for 1973 storm
Cherry Creek Calibrated model, soil parameters adjusted for 1988 storm
Meteorologic Model Storm Type Data Source
1963Aug3-7
1965Jun16_COE
1965Jun16_USGS_Calib
1973May6_Calib
1983Jul21-24
2006 July 2 #1
inverse-distance
user-specified hyetograph
inverse-distance
user-specified hyetograph
NCDC
COE data
USGS publication
USGS publication
NCDC
Urban Drainage
Simulation Basin Model Meteorologic Model
1963Aug3-7
1965Jun16_Calib
1973May5_Calib
1983July22-25
2006July2
Calib_63
Calib_65
Calib_73
Calib_88
Calib_06July
1963Aug3-7
1965Jun16_USGS_Calib
1973May6_Calib
1983Jul21-24
2006 July 2 #1
15
6 REFERENCES
Chow, V.T., Maidment, D.R., and L.W. Mays. Applied Hydrology. McGraw-Hill, Inc. New
York, NY. 1988.
Ducret, G.L. Jr., and Hansen, W.R. Storm of May 5-6, 1973, in the Denver Metro Area:
Frequency and Effect. U.S. Geological Survey. Denver, CO. 1973.
Matthai, H.F. Floods of June 1965 in South Platte River Basin, Colorado. Geological Survey
Water-Supply Paper 1850-B. U.S. Geological Survey. Washington, D.C. 1969.
National Oceanic and Atmospheric Administration, National Climatic Data Center.
Climatological Data for Colorado.
National Oceanic and Atmospheric Administration, National Weather Service. Precipitation
Antecedent to Probable Maximum Storms for the Chatfield, Cherry Creek and Bear Creek
Drainages. Silver Spring, Maryland, 1997.
National Oceanic and Atmospheric Administration & U.S. Dept. of the Army, Corps of
Engineers. Hydrometeorological Report No. 55A: Probable Maximum Precipitation Estimates –
United States between the Continental Divide and the 103rd
Meridian. Washington, D.C. June
1988.
Rawls, W.J., and Brakensiek, D.L. “Estimating Soil Water Retention from Soil Properties,”
Journal Irrigation Drainage Division. American Society of Civil Engineers, Vol 108, No. IR2.
1982.
Rawls, W.J., Brakensiek, D.L., and Saxton, K.E. “Estimation of Soil Water Properties,”
Transactions of the American Society of Agricultural Engineers, Vol 25, No. 5. St. Joseph, MI.
1982.
Schwab, G.O., Fangmeier, D.D., Elliot, W.J., and Frevert, R.K. Soil and Water Conservation
Engineering, 4th
Edition. John Wiley & Sons, Inc. New York, NY. 1993.
U.S. Army Corps of Engineers. Guidelines for Evaluating Modifications of Existing Dams
Related to Hydrologic Deficiencies. Washington, D.C., September 1986.
U.S. Army Corps of Engineers, Engineering and Design. Flood Runoff Analysis. EM 1110-2-
1417. August 31, 1994.
U.S. Army Corps of Engineers, Engineering and Design. Inflow Design Floods for Dams and
Reservoirs. ER 1110-8-2(FR). March 1, 1991.
U.S. Army Corps of Engineers, Hydrologic Engineering Center. Geospatial Hydrologic
Modeling Extension HEC-GeoHMS, User’s Manual. July 2000.
16
U.S. Army Corps of Engineers, Hydrologic Engineering Center. Hydrologic Modeling System
HEC-HMS, Technical Reference Manual. March 2000.
U.S. Army Corps of Engineers, Hydrologic Engineering Center. Hydrologic Modeling System
HEC-HMS, User’s Manual. January 2001.
U.S. Department of Agriculture, Natural Resources Conservation Service. Urban Hydrology for
Small Watersheds, TR-55. June 1986.
U.S. Geological Survey, Water Resources Division. Water Resources Data – Colorado. 1950 –
2002.

More Related Content

What's hot

Using Computer-simulated hydrological model (SWAT) to estimate the ground-wat...
Using Computer-simulated hydrological model (SWAT) to estimate the ground-wat...Using Computer-simulated hydrological model (SWAT) to estimate the ground-wat...
Using Computer-simulated hydrological model (SWAT) to estimate the ground-wat...Dhiraj Jhunjhunwala
 
Investigating Flooding Pattern Using Hydrologic Engineering Center-River Anal...
Investigating Flooding Pattern Using Hydrologic Engineering Center-River Anal...Investigating Flooding Pattern Using Hydrologic Engineering Center-River Anal...
Investigating Flooding Pattern Using Hydrologic Engineering Center-River Anal...Niraj Lamichhane
 
Amaljit - Work Report 2016
Amaljit - Work Report 2016Amaljit - Work Report 2016
Amaljit - Work Report 2016Amaljit Bharali
 
Ch sw water availibility study and supply demand analysis in kharun sub basin...
Ch sw water availibility study and supply demand analysis in kharun sub basin...Ch sw water availibility study and supply demand analysis in kharun sub basin...
Ch sw water availibility study and supply demand analysis in kharun sub basin...hydrologyproject0
 
Master's course defense presentation in Water Resource Management and GIS
Master's course defense presentation in Water Resource Management and GIS  Master's course defense presentation in Water Resource Management and GIS
Master's course defense presentation in Water Resource Management and GIS Tooryalay Ayoubi
 
Exaple of use of decision support system planning dss (p) kerala state
Exaple of use of decision support system planning dss (p)   kerala stateExaple of use of decision support system planning dss (p)   kerala state
Exaple of use of decision support system planning dss (p) kerala statehydrologyproject0
 
Runoff modelling using hec hms for rural watershed
Runoff modelling using hec hms for rural watershedRunoff modelling using hec hms for rural watershed
Runoff modelling using hec hms for rural watershedEditorIJAERD
 
Revision of the Rainfall Intensity Duration Frequency Curves for the City of ...
Revision of the Rainfall Intensity Duration Frequency Curves for the City of ...Revision of the Rainfall Intensity Duration Frequency Curves for the City of ...
Revision of the Rainfall Intensity Duration Frequency Curves for the City of ...theijes
 
Application of Bayesian Regularized Neural Networks for Groundwater Level Mo...
Application of Bayesian Regularized Neural  Networks for Groundwater Level Mo...Application of Bayesian Regularized Neural  Networks for Groundwater Level Mo...
Application of Bayesian Regularized Neural Networks for Groundwater Level Mo...Dr. Amir Mosavi, PhD., P.Eng.
 
ASPRS Coastal Inundation Mapping_Draft8c
ASPRS Coastal Inundation Mapping_Draft8cASPRS Coastal Inundation Mapping_Draft8c
ASPRS Coastal Inundation Mapping_Draft8cBrandon Dees
 
Hydrological Application of Remote – Sensing and GIS for Handling of Excess R...
Hydrological Application of Remote – Sensing and GIS for Handling of Excess R...Hydrological Application of Remote – Sensing and GIS for Handling of Excess R...
Hydrological Application of Remote – Sensing and GIS for Handling of Excess R...IDES Editor
 
79 roger n. anderson - 6826483 - petroleum reservoir simulation and charact...
79   roger n. anderson - 6826483 - petroleum reservoir simulation and charact...79   roger n. anderson - 6826483 - petroleum reservoir simulation and charact...
79 roger n. anderson - 6826483 - petroleum reservoir simulation and charact...Mello_Patent_Registry
 

What's hot (20)

20320130406021 2-3
20320130406021 2-320320130406021 2-3
20320130406021 2-3
 
Using Computer-simulated hydrological model (SWAT) to estimate the ground-wat...
Using Computer-simulated hydrological model (SWAT) to estimate the ground-wat...Using Computer-simulated hydrological model (SWAT) to estimate the ground-wat...
Using Computer-simulated hydrological model (SWAT) to estimate the ground-wat...
 
Investigating Flooding Pattern Using Hydrologic Engineering Center-River Anal...
Investigating Flooding Pattern Using Hydrologic Engineering Center-River Anal...Investigating Flooding Pattern Using Hydrologic Engineering Center-River Anal...
Investigating Flooding Pattern Using Hydrologic Engineering Center-River Anal...
 
Swat model
Swat model Swat model
Swat model
 
Amaljit - Work Report 2016
Amaljit - Work Report 2016Amaljit - Work Report 2016
Amaljit - Work Report 2016
 
Ch sw water availibility study and supply demand analysis in kharun sub basin...
Ch sw water availibility study and supply demand analysis in kharun sub basin...Ch sw water availibility study and supply demand analysis in kharun sub basin...
Ch sw water availibility study and supply demand analysis in kharun sub basin...
 
Master's course defense presentation in Water Resource Management and GIS
Master's course defense presentation in Water Resource Management and GIS  Master's course defense presentation in Water Resource Management and GIS
Master's course defense presentation in Water Resource Management and GIS
 
Exaple of use of decision support system planning dss (p) kerala state
Exaple of use of decision support system planning dss (p)   kerala stateExaple of use of decision support system planning dss (p)   kerala state
Exaple of use of decision support system planning dss (p) kerala state
 
Runoff modelling using hec hms for rural watershed
Runoff modelling using hec hms for rural watershedRunoff modelling using hec hms for rural watershed
Runoff modelling using hec hms for rural watershed
 
Revision of the Rainfall Intensity Duration Frequency Curves for the City of ...
Revision of the Rainfall Intensity Duration Frequency Curves for the City of ...Revision of the Rainfall Intensity Duration Frequency Curves for the City of ...
Revision of the Rainfall Intensity Duration Frequency Curves for the City of ...
 
Revision of the Rainfall Intensity Duration Frequency Curves for the City of ...
Revision of the Rainfall Intensity Duration Frequency Curves for the City of ...Revision of the Rainfall Intensity Duration Frequency Curves for the City of ...
Revision of the Rainfall Intensity Duration Frequency Curves for the City of ...
 
Rainfall-Runoff Modelling
Rainfall-Runoff ModellingRainfall-Runoff Modelling
Rainfall-Runoff Modelling
 
Application of Bayesian Regularized Neural Networks for Groundwater Level Mo...
Application of Bayesian Regularized Neural  Networks for Groundwater Level Mo...Application of Bayesian Regularized Neural  Networks for Groundwater Level Mo...
Application of Bayesian Regularized Neural Networks for Groundwater Level Mo...
 
Towards a Near Real-time Agricultural Drought Monitoring and Forecasting
Towards a Near Real-time Agricultural Drought Monitoring and ForecastingTowards a Near Real-time Agricultural Drought Monitoring and Forecasting
Towards a Near Real-time Agricultural Drought Monitoring and Forecasting
 
ASPRS Coastal Inundation Mapping_Draft8c
ASPRS Coastal Inundation Mapping_Draft8cASPRS Coastal Inundation Mapping_Draft8c
ASPRS Coastal Inundation Mapping_Draft8c
 
Hydrological Application of Remote – Sensing and GIS for Handling of Excess R...
Hydrological Application of Remote – Sensing and GIS for Handling of Excess R...Hydrological Application of Remote – Sensing and GIS for Handling of Excess R...
Hydrological Application of Remote – Sensing and GIS for Handling of Excess R...
 
Understanding runoff generation processes and rainfall runoff modeling: The c...
Understanding runoff generation processes and rainfall runoff modeling: The c...Understanding runoff generation processes and rainfall runoff modeling: The c...
Understanding runoff generation processes and rainfall runoff modeling: The c...
 
Hydrological modelling i5
Hydrological modelling i5Hydrological modelling i5
Hydrological modelling i5
 
Hydrologic modeling
Hydrologic modelingHydrologic modeling
Hydrologic modeling
 
79 roger n. anderson - 6826483 - petroleum reservoir simulation and charact...
79   roger n. anderson - 6826483 - petroleum reservoir simulation and charact...79   roger n. anderson - 6826483 - petroleum reservoir simulation and charact...
79 roger n. anderson - 6826483 - petroleum reservoir simulation and charact...
 

Viewers also liked

Prezentare
Prezentare Prezentare
Prezentare AGEPI
 
продажи в условиях нестабильности
продажи в условиях нестабильностипродажи в условиях нестабильности
продажи в условиях нестабильностиIgor Iakovliev
 
η εποχή του διαφωτισμού, σελ. 10 13
η εποχή του διαφωτισμού, σελ. 10 13η εποχή του διαφωτισμού, σελ. 10 13
η εποχή του διαφωτισμού, σελ. 10 13sotirisgar
 
βιομηχανική επανάσταση
βιομηχανική επανάστασηβιομηχανική επανάσταση
βιομηχανική επανάστασηsotirisgar
 
Results after modifying errors
Results after modifying errorsResults after modifying errors
Results after modifying errorsMaRwa Hamed
 
(الصداع (بحث
(الصداع (بحث(الصداع (بحث
(الصداع (بحثAishahAG
 
Fusion Rug Range By Ultimate Rugs
Fusion Rug Range By Ultimate RugsFusion Rug Range By Ultimate Rugs
Fusion Rug Range By Ultimate RugsThe Rug Shop UK
 
برنامج بناء القدرات للجامعات Tiec
برنامج بناء القدرات للجامعات Tiecبرنامج بناء القدرات للجامعات Tiec
برنامج بناء القدرات للجامعات TiecRana Fahmy
 
The film foosball
The film foosballThe film foosball
The film foosball292002
 
ο βενιζέλος πρωθυπουργός, σελ. 84
ο βενιζέλος πρωθυπουργός, σελ. 84ο βενιζέλος πρωθυπουργός, σελ. 84
ο βενιζέλος πρωθυπουργός, σελ. 84sotirisgar
 
Why Multichannel is nothing new and just plain common sense!
Why Multichannel is nothing new and just plain common sense!Why Multichannel is nothing new and just plain common sense!
Why Multichannel is nothing new and just plain common sense!Sagittarius
 
управление бизнесом в условиях кризиса
управление бизнесом в условиях кризисауправление бизнесом в условиях кризиса
управление бизнесом в условиях кризисаIgor Iakovliev
 
Mallory ryan keeping_the_immune_system_strong
Mallory ryan keeping_the_immune_system_strongMallory ryan keeping_the_immune_system_strong
Mallory ryan keeping_the_immune_system_strongrtmallor
 

Viewers also liked (16)

Prezentare
Prezentare Prezentare
Prezentare
 
продажи в условиях нестабильности
продажи в условиях нестабильностипродажи в условиях нестабильности
продажи в условиях нестабильности
 
η εποχή του διαφωτισμού, σελ. 10 13
η εποχή του διαφωτισμού, σελ. 10 13η εποχή του διαφωτισμού, σελ. 10 13
η εποχή του διαφωτισμού, σελ. 10 13
 
βιομηχανική επανάσταση
βιομηχανική επανάστασηβιομηχανική επανάσταση
βιομηχανική επανάσταση
 
Results after modifying errors
Results after modifying errorsResults after modifying errors
Results after modifying errors
 
(الصداع (بحث
(الصداع (بحث(الصداع (بحث
(الصداع (بحث
 
Creations2014
Creations2014Creations2014
Creations2014
 
Fusion Rug Range By Ultimate Rugs
Fusion Rug Range By Ultimate RugsFusion Rug Range By Ultimate Rugs
Fusion Rug Range By Ultimate Rugs
 
برنامج بناء القدرات للجامعات Tiec
برنامج بناء القدرات للجامعات Tiecبرنامج بناء القدرات للجامعات Tiec
برنامج بناء القدرات للجامعات Tiec
 
Life quality 2040 Presentation
Life quality 2040 PresentationLife quality 2040 Presentation
Life quality 2040 Presentation
 
The film foosball
The film foosballThe film foosball
The film foosball
 
ο βενιζέλος πρωθυπουργός, σελ. 84
ο βενιζέλος πρωθυπουργός, σελ. 84ο βενιζέλος πρωθυπουργός, σελ. 84
ο βενιζέλος πρωθυπουργός, σελ. 84
 
Why Multichannel is nothing new and just plain common sense!
Why Multichannel is nothing new and just plain common sense!Why Multichannel is nothing new and just plain common sense!
Why Multichannel is nothing new and just plain common sense!
 
управление бизнесом в условиях кризиса
управление бизнесом в условиях кризисауправление бизнесом в условиях кризиса
управление бизнесом в условиях кризиса
 
Mallory ryan keeping_the_immune_system_strong
Mallory ryan keeping_the_immune_system_strongMallory ryan keeping_the_immune_system_strong
Mallory ryan keeping_the_immune_system_strong
 
Elämänlaatu 2040 Esittely
Elämänlaatu 2040 EsittelyElämänlaatu 2040 Esittely
Elämänlaatu 2040 Esittely
 

Similar to Cherry creek hms

Modeling analyses for fort lewis jblm drinking water system, aspect 2009
Modeling analyses for fort lewis jblm drinking water system, aspect 2009Modeling analyses for fort lewis jblm drinking water system, aspect 2009
Modeling analyses for fort lewis jblm drinking water system, aspect 2009Sequalitchew Creek Watershed Council
 
Final poster final
Final poster finalFinal poster final
Final poster finalRachelCron1
 
Hydrology Final Poster
Hydrology Final PosterHydrology Final Poster
Hydrology Final PosterPatrick Cusack
 
Group Project to Design Water Infrastructure for a Theoretical Small Town.
Group Project to Design Water Infrastructure for a Theoretical Small Town.Group Project to Design Water Infrastructure for a Theoretical Small Town.
Group Project to Design Water Infrastructure for a Theoretical Small Town.Jonathan Damora
 
Hydrologic modeling of detention pond
Hydrologic modeling of detention pondHydrologic modeling of detention pond
Hydrologic modeling of detention pondeSAT Publishing House
 
Hydrologic modeling of detention pond
Hydrologic modeling of detention pondHydrologic modeling of detention pond
Hydrologic modeling of detention pondeSAT Journals
 
journal of engineering and applied science 18.pdf
journal of engineering and applied science 18.pdfjournal of engineering and applied science 18.pdf
journal of engineering and applied science 18.pdfnareshkotra
 
journal of applied science and engineering.pdf
journal of applied science and engineering.pdfjournal of applied science and engineering.pdf
journal of applied science and engineering.pdfnareshkotra
 
Hydrological Calibration in the Mount Lofty Ranges using Source Paramenter Es...
Hydrological Calibration in the Mount Lofty Ranges using Source Paramenter Es...Hydrological Calibration in the Mount Lofty Ranges using Source Paramenter Es...
Hydrological Calibration in the Mount Lofty Ranges using Source Paramenter Es...eWater
 
Task 4 tm_main_draft_20130524
Task 4 tm_main_draft_20130524Task 4 tm_main_draft_20130524
Task 4 tm_main_draft_20130524vidya priya
 
HWRS2014_Diermanse-Paper148
HWRS2014_Diermanse-Paper148HWRS2014_Diermanse-Paper148
HWRS2014_Diermanse-Paper148Rob Ayre
 
SRBC Report: Water Use Associated with Natural Gas Development
SRBC Report: Water Use Associated with Natural Gas DevelopmentSRBC Report: Water Use Associated with Natural Gas Development
SRBC Report: Water Use Associated with Natural Gas DevelopmentMarcellus Drilling News
 
Lysimeter (measurement of evapotranspiration).docx
Lysimeter (measurement of evapotranspiration).docxLysimeter (measurement of evapotranspiration).docx
Lysimeter (measurement of evapotranspiration).docxssuser6e70fd
 
Evaluation Of Low Impact Developments (LID)
Evaluation Of Low Impact Developments (LID)Evaluation Of Low Impact Developments (LID)
Evaluation Of Low Impact Developments (LID)Dawit A. Melaku
 
MicroHydro Design Project REPORT
MicroHydro Design Project REPORTMicroHydro Design Project REPORT
MicroHydro Design Project REPORTMichael Clarke
 

Similar to Cherry creek hms (20)

CE573_Poster2
CE573_Poster2CE573_Poster2
CE573_Poster2
 
Modeling analyses for fort lewis jblm drinking water system, aspect 2009
Modeling analyses for fort lewis jblm drinking water system, aspect 2009Modeling analyses for fort lewis jblm drinking water system, aspect 2009
Modeling analyses for fort lewis jblm drinking water system, aspect 2009
 
Final poster final
Final poster finalFinal poster final
Final poster final
 
Hydrology Final Poster
Hydrology Final PosterHydrology Final Poster
Hydrology Final Poster
 
Group Project to Design Water Infrastructure for a Theoretical Small Town.
Group Project to Design Water Infrastructure for a Theoretical Small Town.Group Project to Design Water Infrastructure for a Theoretical Small Town.
Group Project to Design Water Infrastructure for a Theoretical Small Town.
 
Hydrologic modeling of detention pond
Hydrologic modeling of detention pondHydrologic modeling of detention pond
Hydrologic modeling of detention pond
 
Hydrologic modeling of detention pond
Hydrologic modeling of detention pondHydrologic modeling of detention pond
Hydrologic modeling of detention pond
 
journal of engineering and applied science 18.pdf
journal of engineering and applied science 18.pdfjournal of engineering and applied science 18.pdf
journal of engineering and applied science 18.pdf
 
journal of applied science and engineering.pdf
journal of applied science and engineering.pdfjournal of applied science and engineering.pdf
journal of applied science and engineering.pdf
 
Hydrological Calibration in the Mount Lofty Ranges using Source Paramenter Es...
Hydrological Calibration in the Mount Lofty Ranges using Source Paramenter Es...Hydrological Calibration in the Mount Lofty Ranges using Source Paramenter Es...
Hydrological Calibration in the Mount Lofty Ranges using Source Paramenter Es...
 
Task 4 tm_main_draft_20130524
Task 4 tm_main_draft_20130524Task 4 tm_main_draft_20130524
Task 4 tm_main_draft_20130524
 
HWRS2014_Diermanse-Paper148
HWRS2014_Diermanse-Paper148HWRS2014_Diermanse-Paper148
HWRS2014_Diermanse-Paper148
 
FLOODPLAIN HAZARD MAPPING AND ASSESSMENT OF RIVER KABUL USING HEC-RAS 2D MODEL
FLOODPLAIN HAZARD MAPPING AND ASSESSMENT OF RIVER KABUL USING HEC-RAS 2D MODELFLOODPLAIN HAZARD MAPPING AND ASSESSMENT OF RIVER KABUL USING HEC-RAS 2D MODEL
FLOODPLAIN HAZARD MAPPING AND ASSESSMENT OF RIVER KABUL USING HEC-RAS 2D MODEL
 
SRBC Report: Water Use Associated with Natural Gas Development
SRBC Report: Water Use Associated with Natural Gas DevelopmentSRBC Report: Water Use Associated with Natural Gas Development
SRBC Report: Water Use Associated with Natural Gas Development
 
Coulton Sess6 101309
Coulton Sess6 101309Coulton Sess6 101309
Coulton Sess6 101309
 
Lysimeter (measurement of evapotranspiration).docx
Lysimeter (measurement of evapotranspiration).docxLysimeter (measurement of evapotranspiration).docx
Lysimeter (measurement of evapotranspiration).docx
 
OF10-1153
OF10-1153OF10-1153
OF10-1153
 
Evaluation Of Low Impact Developments (LID)
Evaluation Of Low Impact Developments (LID)Evaluation Of Low Impact Developments (LID)
Evaluation Of Low Impact Developments (LID)
 
MUSE
MUSEMUSE
MUSE
 
MicroHydro Design Project REPORT
MicroHydro Design Project REPORTMicroHydro Design Project REPORT
MicroHydro Design Project REPORT
 

Cherry creek hms

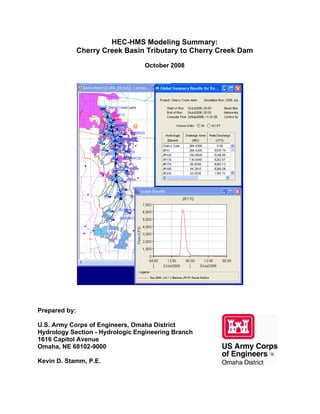
  • 1. HEC-HMS Modeling Summary: Cherry Creek Basin Tributary to Cherry Creek Dam October 2008 Prepared by: U.S. Army Corps of Engineers, Omaha District Hydrology Section - Hydrologic Engineering Branch 1616 Capitol Avenue Omaha, NE 68102-9000 Kevin D. Stamm, P.E.
  • 2. ii For Information Regarding This Document Please Contact: Kevin Stamm, P.E. U.S. Army Corps of Engineers, Omaha District Attention: CENWO-ED-HE 1616 Capitol Avenue Omaha, NE 68102-9000 (402) 995-2346 kevin.d.stamm@usace.army.mil
  • 3. iii Table of Contents Table of Contents...........................................................................................................................iii Table of Figures.............................................................................................................................iii List of Tables .................................................................................................................................iii 1 General Information................................................................................................................ 5 1.1 Basin Description............................................................................................................ 5 1.2 Streamflow Data ............................................................................................................. 5 1.3 Spatial Data..................................................................................................................... 5 1.4 HEC-HMS....................................................................................................................... 5 2 Basin Model............................................................................................................................ 6 2.1 Delineations .................................................................................................................... 6 2.2 Land Use/Impervious Area............................................................................................. 6 2.3 Rainfall Losses................................................................................................................ 6 2.4 Transform Method .......................................................................................................... 8 2.5 Channel Routing ............................................................................................................. 8 3 Flood Control Storage........................................................................................................... 11 3.1 Sub-basin Impoundments.............................................................................................. 11 3.2 Cherry Creek Dam........................................................................................................ 11 3.3 Elevation-Storage Functions......................................................................................... 11 3.4 Spillway Rating............................................................................................................. 12 4 Meteorologic Models............................................................................................................ 13 4.1 User-Specified Hyetographs......................................................................................... 13 4.2 Inverse-Distance Precipitation Events.......................................................................... 13 5 Model Summary.................................................................................................................... 13 6 References............................................................................................................................. 15 Table of Figures Figure 1. Cherry Creek Basin HEC-HMS model tributary to Cherry Creek Lake........................ 7 Figure 2. Cherry Creek elevation-capacity derived from the 1961, 1965, and 1988 bathymetric surveys. ................................................................................................................................. 12 Figure 3. Cherry Creek spillway rating curves for the designed spillway, 2008 existing condition and the improved channel condition..................................................................................... 13 List of Tables Table 1. Soil loss parameters at field capacity and HMS transform parameters model sub-basins. ................................................................................................................................................. 9 Table 2. Green and Ampt soil parameters calibrated for the June 16, 1965 flood event............... 9 Table 3. Green and Ampt soil parameters calibrated for the May 6, 1973 flood event............... 10 Table 4. Green and Ampt soil parameters calibrated for the July 2, 2006 flood event. .............. 10 Table 5. Modeled sub-basins that contain unit graph parameters adjusted for watershed flood storage................................................................................................................................... 11 Table 6. Cherry Creek Engineering Data..................................................................................... 11 Table 7. HEC-HMS model basin, meteorologic, and simulation components for Cherry Creek Basin. .................................................................................................................................... 14
  • 4. iv
  • 5. 5 1 GENERAL INFORMATION 1.1 Basin Description Cherry Creek is a right bank tributary of the South Platte River which enters the river in Denver, Colorado. The Cherry Creek basin contributing drainage area at its mouth is 414 mi2 , and at Cherry Creek Dam it is 385.0 mi2 . The source of Cherry Creek is approximately 57 miles south of its mouth at the Palmer Divide which separates the South Platte and Arkansas River basins. The basin rises in the south to an elevation of 7700 ft and descends to elevation 5190 at its mouth. 1.2 Streamflow Data Average daily stream discharge was available for Cherry Creek at Franktown, Parker and Melvin, CO, as well as Cherry Creek Lake. Franktown (06712000) and Melvin (06712500) are USGS stream gages that report daily and instantaneous peak discharge, while Parker and Cherry Creek Lake are maintained by the Corps of Engineers. The Melvin gage is no longer in service. The Cherry Creek Reservoir gage is used in combination with gauged lake releases to report daily reservoir inflow, elevation, and storage of Cherry Creek Lake. During the June 16, 1965, and May 6, 1973, floods, data was collected that enabled the Corps of Engineers to reconstruct flow hydrographs entering Cherry Creek Reservoir. These hydrographs were used along with average daily stream flows to calibrate the hydrologic model. 1.3 Spatial Data USGS 10-meter grid cell digital elevation data was obtained for the Cherry Creek basin through the USGS Seamless Data clearinghouse. All GIS data was projected into the Standard Hydrologic Grid (SHG) projection, an Albers equal-area projection. SHG projection is referenced with the following spatial information: Units: Meters Datum: North American Datum, 1983 (NAD83) 1st Standard Parallel: 29 deg 30 min 0 sec North 2nd Standard Parallel: 45 deg 30 min 0 sec North Central Meridian: 96 deg 0 min 0 sec West Latitude of Origin: 23 deg 0 min 0 sec North False Easting: 0.0 False Northing: 0.0 1.4 HEC-HMS The HEC Hydrologic Modeling System (HMS) simulates the precipitation-runoff process primarily for surface water applications, and computes watershed discharge, storage, and diversions. The model computes runoff through an assortment of soil-water infiltration, runoff transform, and routing methods in a lumped or semi-distributed parameter approach. The Cherry
  • 6. 6 Creek hydrologic model was created using a lumped parameter approach using the ArcView extension GeoHMS to create basin boundaries, a stream network, and extract basin physical properties from the digital elevation data. Hydrologic model simulations were performed using HEC-HMS version 3.0.1. 2 BASIN MODEL 2.1 Delineations A total of 22 sub-basins tributary to Cherry Creek Dam were delineated from the 10-meter resolution digital elevation model. Contributing drainage areas along Cherry Creek at gaged locations were 165.9 mi2 at Franktown, 339.5 mi2 at the Melvin, and 386.1 mi2 at Cherry Creek Dam. 2.2 Land Use/Impervious Area The progression of development within the basin since 1954 was identified and classified using USGS 7.5-minute quadrangle (quad) maps. Development in the years 1954, 1964, and 1988 was determined by identifying urban development and road networks. Aerial photographs from 1999 and 2004 were used to identify development for 2004. Impacts of land use are reflected in the model as sub-basin percent impervious area. The final calibrated model depicts 2004 land use conditions 2.3 Rainfall Losses The Cherry Creek model uses the Green and Ampt infiltration method along with initial surface storage and canopy losses. The Green and Ampt method was used because it has the ability to simulate variations in initial soil moisture content and changes in soil infiltration rate that occur during a rain storm. The Green-Ampt Method computes infiltration rate and cumulative infiltration as: ⎟⎟ ⎠ ⎞ ⎜⎜ ⎝ ⎛ + ΨΔ = Δ+ Δ+ 1 tt tt F Kf θ ⎥ ⎦ ⎤ ⎢ ⎣ ⎡ ΨΔ+ ΨΔ+ ΨΔ+Δ+= Δ+ Δ+ θ θ θ t tt ttt F F KtKFF ln ft+Δt = current potential infiltration rate K = saturated hydraulic conductivity ψ = soil wetting suction front Δθ = volumetric moisture deficit Ft+Δt = cumulative infiltration Ft = cumulative infiltration at the previous time step.
  • 7. 7 Figure 1. Cherry Creek Basin HEC-HMS model tributary to Cherry Creek Lake.
  • 8. 8 Potential infiltration rate (f) and cumulative infiltration (F) are functions of F and the hydrologic parameter constants Δθ , Ψ, and K, specified within the model. K defines the rate which water moves through the soil when the soil is saturated, and it is not equivalent to the infiltration rate. Ψ is a soil physical property that defines the soil pressure or tension usually as a function of soil dryness. Volumetric moisture deficit (Δθ) is the soil pore volume free of water, and it is dependent on the soil porosity and water content. Effective porosity was used as Δθ for dry soil (Rawls et. al, 1982), and a reduced Δθ was computed for wetter soils at field capacity. Field capacity is a condition of the soil in which a saturated soil is allowed time to sufficiently drain, and the soil tension is at -0.33 bars of pressure. Field capacity Δθ was based on standard values cited in Schwab, et al. (1993). From the equation for f, initial f is near infinity because F is near zero, but as F increases, f approaches K. Infiltration occurs at a rate equal to the rainfall rate (i) if f is less than i. When i exceeds f, infiltration occurs at the rate of f, and F is computed with the specified Green-Ampt equation. Green and Ampt parameters required by HEC-HMS include volumetric moisture deficit (θ), wetting suction (Ψ) front, and saturated hydraulic conductivity (K). Sub-basin averaged Green and Ampt parameters were determined by combining standard parameter values associated with soil texture (Rawls et. al., 1982) to a GIS overlay of Cherry Creek sub-basins and soil textural classes. Field capacity soil loss parameters and unit graph parameters for individual sub-basins are provided in Table 1. Green and Ampt soil loss parameters used in the calibration of flood hydrographs for the 1965, 1973, and 2006 discharge events are provided in Tables 2 – 4. 2.4 Transform Method The Clark’s synthetic unit hydrograph method was chosen for this model in order to provide the capability of using gridded time-series precipitation data in the Corps Water Management System (CWMS) at a later time. Clark’s method in HEC-HMS uses a smooth function fitted to a typical time-area relationship in which only the basin time of concentration, tc, and the storage coefficient, R, are specified in the model. A storage coefficient of 1.0 worked well in the calibration simulations. 2.5 Channel Routing The Muskingum-Cunge routing method was used to route sub-basin discharges through the Cherry Creek channel to Cherry Creek Lake. Eight-point channel cross sections were extracted from the 10-meter digital elevation model of Cherry Creek basin using GeoRAS. Roughness coefficients for the channel and overbank areas of 0.03 and 0.05, respectively, were set during the model calibration. Observation of some streamflow data indicated that channel infiltration caused a significant volume of water to be lost from Cherry Creek; however, this phenomenon was not modeled in this particular version of the Cherry Creek model.
  • 9. 9 Table 1. Soil loss parameters at field capacity and HMS transform parameters model sub-basins. Sub-basin Initial Loss (Inches) Volumetric Moisture Deficit Wetting Suction Front (inches) Saturated Hydraulic Conductivity (in/hr) Time of Concentration (hrs) Clark’s Storage Coefficient (R) R100W100 R10W10 R110W110 R120W120 R140W140 R150W150 R180W180 R190W190 R200W200 R210W210 R220W220 R230W230 R240W240 R250W250 R260W260 R270W270 R30W30 R50W50 R60W60 R70W70 R80W80 R90W90 0.2 0.2 0.2 0.2 0.2 0.2 0.2 0.2 0.2 0.2 0.2 0.2 0.2 0.2 0.2 0.2 0.2 0.2 0.2 0.2 0.2 0.2 0.21 0.13 0.24 0.22 0.21 0.22 0.22 0.22 0.17 0.20 0.17 0.20 0.21 0.21 0.17 0.18 0.21 0.24 0.23 0.20 0.19 0.21 10.4 15.1 8.6 9.6 10.5 10.0 9.3 10.0 13.0 10.1 13.4 10.0 9.6 9.5 13.3 12.7 10.7 8.8 9.2 11.3 12.1 9.7 0.31 0.23 0.36 0.33 0.31 0.32 0.34 0.32 0.26 0.28 0.25 0.28 0.28 0.28 0.25 0.27 0.32 0.35 0.33 0.30 0.28 0.31 2.16 2.68 2.72 2.46 5 3.10 1.53 2.79 3.48 5.4 0.84 9.08 5.98 7.9 2.92 2.29 4.19 1.67 2.82 3.78 3.33 1.69 1 1 1 1 2.5 1 1 4 1 4 1 4 4 4 1 1 1 1 1 1 1 1 Table 2. Green and Ampt soil parameters calibrated for the June 16, 1965 flood event. Sub-basin Initial Loss (Inches) Volumetric Moisture Deficit Wetting Suction Front (inches) Saturated Hydraulic Conductivity (in/hr) R100W100 R10W10 R110W110 R120W120 R140W140 R150W150 R180W180 R190W190 R200W200 R210W210 R220W220 R230W230 R240W240 R250W250 R260W260 R270W270 R30W30 R50W50 R60W60 R70W70 R80W80 R90W90 0.2 0.2 0.2 0.2 0.2 0.2 0.2 0.2 0.2 0.2 0.2 0.2 0.2 0.2 0.2 0.2 0.2 0.2 0.2 0.2 0.2 0.2 0.20 0.13 0.23 0.21 0.20 0.21 0.21 0.21 0.16 0.19 0.16 0.19 0.20 0.20 0.16 0.17 0.20 0.23 0.22 0.19 0.18 0.20 10.0 14.6 8.2 9.2 10.1 9.6 8.9 9.6 12.6 9.7 13.0 9.6 9.2 9.1 12.9 11.9 10.3 8.4 8.8 10.9 10.7 9.3 0.31 0.23 0.36 0.33 0.31 0.32 0.34 0.32 0.26 0.28 0.25 0.28 0.28 0.28 0.25 0.27 0.32 0.35 0.33 0.30 0.28 0.31
  • 10. 10 Table 3. Green and Ampt soil parameters calibrated for the May 6, 1973 flood event. Sub-basin Initial Loss (Inches) Volumetric Moisture Deficit Wetting Suction Front (inches) Saturated Hydraulic Conductivity (in/hr) R100W100 R10W10 R110W110 R120W120 R140W140 R150W150 R180W180 R190W190 R200W200 R210W210 R220W220 R230W230 R240W240 R250W250 R260W260 R270W270 R30W30 R50W50 R60W60 R70W70 R80W80 R90W90 0.2 0.2 0.2 0.2 0.2 0.2 0.2 0.2 0.2 0.2 0.2 0.2 0.2 0.2 0.2 0.2 0.2 0.2 0.2 0.2 0.2 0.2 0.01 0.01 0.01 0.01 0.01 0.01 0.01 0.01 0.01 0.01 0.01 0.01 0.01 0.01 0.01 0.01 0.01 0.01 0.01 0.01 0.01 0.01 2.8 4.5 2.0 2.3 2.7 2.5 2.1 2.5 4.5 3.1 4.7 3.0 2.8 2.8 4.1 3.7 2.8 2.0 2.1 3.2 3.5 2.4 0.31 0.23 0.36 0.33 0.31 0.32 0.34 0.32 0.26 0.28 0.25 0.28 0.28 0.28 0.25 0.27 0.32 0.35 0.33 0.30 0.28 0.31 Table 4. Green and Ampt soil parameters calibrated for the July 2, 2006 flood event. Sub-basin Initial Loss (Inches) Volumetric Moisture Deficit Wetting Suction Front (inches) Saturated Hydraulic Conductivity (in/hr) R100W100 R10W10 R110W110 R120W120 R140W140 R150W150 R180W180 R190W190 R200W200 R210W210 R220W220 R230W230 R240W240 R250W250 R260W260 R270W270 R30W30 R50W50 R60W60 R70W70 R80W80 R90W90 0.2 0.2 0.2 0.2 0.2 0.2 0.2 0.2 0.2 0.2 0.2 0.2 0.2 0.2 0.2 0.2 0.2 0.2 0.2 0.2 0.2 0.2 0.21 0.13 0.24 0.22 0.21 0.22 0.22 0.22 0.17 0.20 0.17 0.20 0.21 0.21 0.17 0.18 0.21 0.24 0.23 0.20 0.19 0.21 10.4 15.1 8.6 9.6 10.5 10.0 9.3 10.0 13.0 10.1 13.4 10.0 9.6 9.5 13.3 12.7 10.7 8.8 9.2 11.3 12.1 9.7 0.31 0.23 0.36 0.33 0.31 0.32 0.34 0.32 0.26 0.28 0.25 0.28 0.28 0.28 0.25 0.27 0.32 0.35 0.33 0.30 0.28 0.31
  • 11. 11 3 FLOOD CONTROL STORAGE 3.1 Sub-basin Impoundments The National Inventory of Dams lists 41 flood control structures in the Cherry Creek drainage basin, 26 located upstream of the Franktown, CO, stream gage; and, 15 located downstream of the Franktown gage. These structures delay the runoff hydrograph peak discharge by storing water behind the impoundments. In the hydrologic model flood control structures impact sub- basins upstream of Cherry Creek Lake. The main basin model does not incorporate the flood control structures, but compensates for runoff storage and the lag in time of peak discharge through modified Clark storage coefficients (Table 5) and lagging of times of peak discharge. Table 5. Modeled sub-basins that contain unit graph parameters adjusted for watershed flood storage. Sub-basin R % of Controlled Area Flood Storage ac ft R140W140 R190W190 R210W210 R230W230 R240W240 R250W250 2.5 4.0 4.0 4.0 4.0 4.0 34.6 54.7 54.4 79.6 85.0 87.1 618 767 1016 2871 1427 2042 3.2 Cherry Creek Dam Cherry Creek Dam engineering data is listed below in Table 6. Table 6. Cherry Creek Engineering Data. Dam Embankment Top of dam, ft MSL Length of Dam, ft Height of Dam, ft MSL Stream bed, ft MSL 5644.5 14,300 141 5504.0 Reservoir Elev. and Area Maximum Pool, ft MSL Top of flood control pool Top of multipurpose pool 5645.0 5608.7 5550.0 Spillway Crest elevation, ft MSL Design width, ft MSL 5598.0 (design) 5608.7 (flood control) 5610.6 (2008 condition) 67 Outlet Works Number and size Length, ft Discharge capacity, cfs 2 – 8 x 12 ft. oval conduits 1 – 12 ft. circular conduit 679.5 ft 8100 at 5598.0 ft MSL 3.3 Elevation-Storage Functions Over the life of Cherry Creek Dam the volume of permanent and flood control storage has changed due to major runoff events; therefore, several reservoir-elevation-capacity curves are used in the hydrologic model. The model contains reservoir elevation-storage functions based on bathymetric surveys conducted in 1950, 1961, 1965, and 1988. Functions from 1961, 1965 and 1988 are plotted in Figure 2. The 1988 curve reflects the most recently surveyed lake bathymetry.
  • 12. 12 5510 5525 5540 5555 5570 5585 5600 5615 5630 5645 0 25000 50000 75000 100000 125000 150000 175000 200000 225000 250000 Capacity (acre feet) Elevation(ftMSL) 1961 1965 1988 Figure 2. Cherry Creek elevation-capacity derived from the 1961, 1965, and 1988 bathymetric surveys. 3.4 Spillway Rating The Cherry Creek spillway was originally designed and constructed with a crest elevation of 5598 ft MSL and a bottom width of 67 feet with side slopes ranging from one (horizontal) on two (vertical) to one on one. The spillway was designed using a Manning’s roughness coefficient (n) of 0.025 for velocity limitations and 0.035 for spillway capacity. Over time the poor stability of the slopes caused sloughing toward the bottom of the spillway, effectively raising the crest elevation to 5608.7 ft MSL. In addition a lack of maintenance has allowed thick shrubs and some trees to grow in the spillway raising estimated channel coefficients to 0.075 and side slope coefficients to 0.065. The reservoir regulation manual specifies 5608.7 ft MSL as the top of the flood control pool and crest of the spillway channel; however, the April 2008 survey determined the crest elevation was near 5610.6 ft MSL with a rating curve reflecting the existing channel roughness conditions. The three crest elevation rating curves plotted in Figure 3 are for the design condition (5598.0 ft MSL), an improved channel condition with lower roughness (5608.7 ft MSL), and the existing channel condition (5610.6 ft MSL). The hydrologic model includes discharge rating curves for the 5608.7 ft MSL crest elevation in its existing condition (EC), the 5608.7 ft MSL crest elevation in an improved condition (IC), and the 5610.7 ft MSL crest elevation in its existing condition (EC). Additional rating curves include discharge due to dam overtopping (OT) and outlet works (OW) discharge limited to 5000 cfs.
  • 13. 13 5595 5605 5615 5625 5635 5645 5655 5665 0 10000 20000 30000 40000 50000 60000 70000 80000 Discharge (cfs) Elevation(ftMSL) 5598.0 Crest 5608.7 Crest 5610.6 Crest Figure 3. Cherry Creek spillway rating curves for the designed spillway, 2008 existing condition and the improved channel condition. 4 METEOROLOGIC MODELS 4.1 User-Specified Hyetographs User-specified hyetograph precipitation methods were used for Cherry Creek calibration floods which included the June 16, 1965 storm; May 5, 1973 storm; and the July 2, 2006 storm. User- specified hyetographs are rainfall hyetographs specified for individual sub-basins. Complete hyetograph information is included in the HEC-HMS meteorologic model files. 4.2 Inverse-Distance Precipitation Events Inverse-distance meteorological models represent rainfall events by weighing rain gage precipitation by the inverse of the distance from the gage to the sub-basin centroid. This method works relatively well if the watershed contains a good network of rain gages. The hydrologic model contains meteorological models for the August 3, 1963; and July 23, 1983 storms. 5 MODEL SUMMARY Table 7 summarizes the basin models, meteorological models, and simulations that the Cherry Creek HEC-HMS model contains. The basin models are all based on the same sub-basin
  • 14. 14 delineations, unit graph parameters, and channel properties; but, they differ in initial soil conditions. Both inverse-distance and user-specified hyetograph meteorologic models are contained within the model files. The model was calibrated using primarily user-specified hyetographs for the 1965, 1973, and 2006 runoff events. Finally the model is configured to perform five simulations. The Cherry Creek Calibrated basin model was not used in a simulation, yet it contains baseline soil moisture parameters from which most simulations can be initiated. Table 7. HEC-HMS model basin, meteorologic, and simulation components for Cherry Creek Basin. Basin Model Description Cherry Creek Calibrated Calib_06July Calib_63 Calib_65 Calib_73 Calib_88 Baseline model with 2004 imperviousness, field capacity soil parameters, and calibrated Clark parameters Cherry Creek Calibrated model, soil parameters adjusted for 2006 storm Cherry Creek Calibrated model, soil parameters adjusted for 1963 storm Cherry Creek Calibrated model, soil parameters adjusted for 1965 storm Cherry Creek Calibrated model, soil parameters adjusted for 1973 storm Cherry Creek Calibrated model, soil parameters adjusted for 1988 storm Meteorologic Model Storm Type Data Source 1963Aug3-7 1965Jun16_COE 1965Jun16_USGS_Calib 1973May6_Calib 1983Jul21-24 2006 July 2 #1 inverse-distance user-specified hyetograph user-specified hyetograph user-specified hyetograph inverse-distance user-specified hyetograph NCDC COE data USGS publication USGS publication NCDC Urban Drainage Simulation Basin Model Meteorologic Model 1963Aug3-7 1965Jun16_Calib 1973May5_Calib 1983July22-25 2006July2 Calib_63 Calib_65 Calib_73 Calib_88 Calib_06July 1963Aug3-7 1965Jun16_USGS_Calib 1973May6_Calib 1983Jul21-24 2006 July 2 #1
  • 15. 15 6 REFERENCES Chow, V.T., Maidment, D.R., and L.W. Mays. Applied Hydrology. McGraw-Hill, Inc. New York, NY. 1988. Ducret, G.L. Jr., and Hansen, W.R. Storm of May 5-6, 1973, in the Denver Metro Area: Frequency and Effect. U.S. Geological Survey. Denver, CO. 1973. Matthai, H.F. Floods of June 1965 in South Platte River Basin, Colorado. Geological Survey Water-Supply Paper 1850-B. U.S. Geological Survey. Washington, D.C. 1969. National Oceanic and Atmospheric Administration, National Climatic Data Center. Climatological Data for Colorado. National Oceanic and Atmospheric Administration, National Weather Service. Precipitation Antecedent to Probable Maximum Storms for the Chatfield, Cherry Creek and Bear Creek Drainages. Silver Spring, Maryland, 1997. National Oceanic and Atmospheric Administration & U.S. Dept. of the Army, Corps of Engineers. Hydrometeorological Report No. 55A: Probable Maximum Precipitation Estimates – United States between the Continental Divide and the 103rd Meridian. Washington, D.C. June 1988. Rawls, W.J., and Brakensiek, D.L. “Estimating Soil Water Retention from Soil Properties,” Journal Irrigation Drainage Division. American Society of Civil Engineers, Vol 108, No. IR2. 1982. Rawls, W.J., Brakensiek, D.L., and Saxton, K.E. “Estimation of Soil Water Properties,” Transactions of the American Society of Agricultural Engineers, Vol 25, No. 5. St. Joseph, MI. 1982. Schwab, G.O., Fangmeier, D.D., Elliot, W.J., and Frevert, R.K. Soil and Water Conservation Engineering, 4th Edition. John Wiley & Sons, Inc. New York, NY. 1993. U.S. Army Corps of Engineers. Guidelines for Evaluating Modifications of Existing Dams Related to Hydrologic Deficiencies. Washington, D.C., September 1986. U.S. Army Corps of Engineers, Engineering and Design. Flood Runoff Analysis. EM 1110-2- 1417. August 31, 1994. U.S. Army Corps of Engineers, Engineering and Design. Inflow Design Floods for Dams and Reservoirs. ER 1110-8-2(FR). March 1, 1991. U.S. Army Corps of Engineers, Hydrologic Engineering Center. Geospatial Hydrologic Modeling Extension HEC-GeoHMS, User’s Manual. July 2000.
  • 16. 16 U.S. Army Corps of Engineers, Hydrologic Engineering Center. Hydrologic Modeling System HEC-HMS, Technical Reference Manual. March 2000. U.S. Army Corps of Engineers, Hydrologic Engineering Center. Hydrologic Modeling System HEC-HMS, User’s Manual. January 2001. U.S. Department of Agriculture, Natural Resources Conservation Service. Urban Hydrology for Small Watersheds, TR-55. June 1986. U.S. Geological Survey, Water Resources Division. Water Resources Data – Colorado. 1950 – 2002.