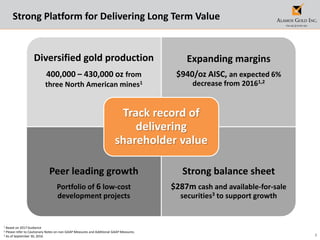
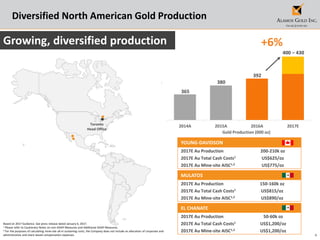
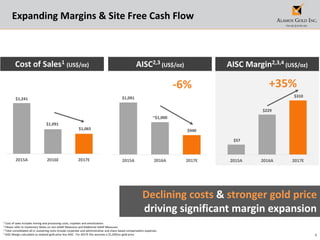
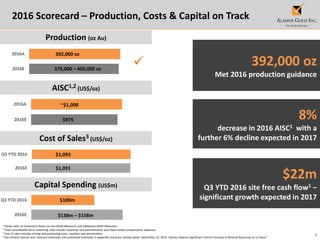
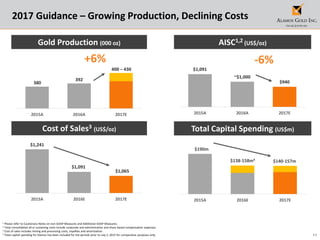
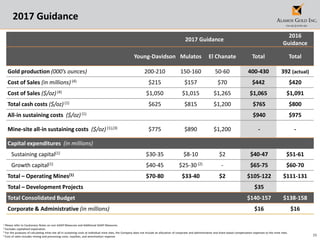
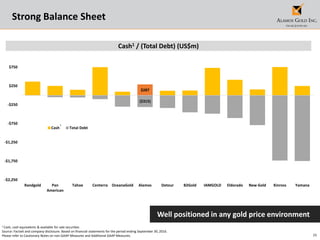
SlideShare a Scribd company logo
January 2017 Corporate Presentation
2
Cautionary Notes
No stock exchange, securities commission or other regulatory authority has approved or disapproved the information contained herein.
Certain statements in this presentation are “forward-looking statements”, including within the meaning of the United States Securities Exchange Act of 1934, as amended. All statements other than statements of historical
fact included in this presentation, including without limitation statements regarding forecast gold production, gold grades, recoveries, waste-to-ore ratios, total cash costs, potential mineralization and reserves, exploration
results, and future plans and objectives of Alamos, are forward-looking statements based on forecasts of future operational or financial results, estimates of amounts not yet determinable and assumptions of management
that involve various risks and uncertainties. Any statements that express or involve discussions with respect to predictions, expectations, beliefs, plans, projections, objectives, assumptions or future events or performance
(often, but not always, using words or phrases such as “expects” or “does not expect”, “is expected”, “anticipates” or “does not anticipate”, “plans”, “estimates” or “intends”, or stating that certain actions, events or results
“may”, “could”, “would”, “might” or “will” be taken, occur or be achieved) are not statements of historical fact and may be “forward-looking statements.” Alamos cautions that forward-looking information involves known and
unknown risks, uncertainties and other factors that may cause Alamos' actual results, performance or achievements to be materially different from those expressed or implied by such information, including, but not limited
to, gold and silver price volatility; fluctuations in foreign exchange rates and interest rates; the impact of any hedging activities; discrepancies between actual and estimated production, between actual and estimated
reserves and resources or between actual and estimated metallurgical recoveries; costs of production; capital expenditure requirements; the costs and timing of construction and development of new deposits; and the
success of exploration and permitting activities. In addition, the factors described or referred to in the section entitled “Risk Factors” in both Alamos Gold Inc.’s Annual Information Form for the year ended December 31,
2015 along with subsequent public filings available on the SEDAR website at www.sedar.com, should be reviewed in conjunction with the information found in this presentation. Although Alamos has attempted to identify
important factors that could cause actual results, performance or achievements to differ materially from those contained in forward-looking information, there can be other factors that cause results, performance or
achievements not to be as anticipated, estimated or intended. There can be no assurance that such information will prove to be accurate or that management’s expectations or estimates of future developments,
circumstances or results will materialize. Accordingly, readers should not place undue reliance on forward-looking information.
Note to U.S. Investors
Alamos prepares its disclosure in accordance with the requirements of securities laws in effect in Canada, which differ from the requirements of U.S. securities laws. Terms relating to mineral resources in this presentation
are defined in accordance with National Instrument 43-101 – Standards of Disclosure for Mineral Projects under the guidelines set out in the Canadian Institute of Mining, Metallurgy, and Petroleum Standards on Mineral
Resources and Mineral Reserves. The United States Securities and Exchange Commission (the “SEC”) permits mining companies, in their filings with the SEC, to disclose only those mineral deposits that a company can
economically and legally extract or produce. Alamos may use certain terms, such as “measured mineral resources”, “indicated mineral resources”, “inferred mineral resources” and “probable mineral reserves” that the SEC
does not recognize (these terms may be used in this presentation and are included in the public filings of Alamos, which have been filed with the SEC and the securities commissions or similar authorities in Canada).
Cautionary non-GAAP Measures and Additional GAAP Measures
Note that for purposes of this section, GAAP refers to IFRS. The Company believes that investors use certain non-GAAP and additional GAAP measures as indicators to assess gold mining companies. They are intended to
provide additional information and should not be considered in isolation or as a substitute for measures of performance prepared with GAAP.
“Cash flow from operating activities before changes in non-cash working capital” is a non-GAAP performance measure that could provide an indication of the Company’s ability to generate cash flows from operations, and is
calculated by adding back the change in non-cash working capital to “Cash provided by (used in) operating activities” as presented on the Company’s consolidated statements of cash flows. “Free cash flow” is a non-GAAP
performance measure that is calculated as cash flows from operations net of cash flows invested in mineral property, plant and equipment and exploration and evaluation assets as presented on the Company’s consolidated
statements of cash flows and that would provide an indication of the Company’s ability to generate cash flows from its mineral projects. “Mine site free cash flow” is a non-GAAP measure which includes cash flow from
operating activities at, less capital expenditures at each mine site. Return on Equity is defined as Earnings from Continuing Operations divided by the average Total Equity for the current and previous year. “Mining cost per
tonne of ore” and “Cost per tonne of ore” are non-GAAP performance measures that could provide an indication of the mining and processing efficiency and effectiveness of the mine. These measures are calculated by
dividing the relevant mining and processing costs and total costs by the tonnes of ore processed in the period. “Cost per tonne of ore” is usually affected by operating efficiencies and waste-to-ore ratios in the period. “Total
cash costs per ounce”, “all-in sustaining costs per ounce”, and “mine-site all-in sustaining costs” as used in this analysis are non-GAAP terms typically used by gold mining companies to assess the level of gross margin
available to the Company by subtracting these costs from the unit price realized during the period. These non-GAAP terms are also used to assess the ability of a mining company to generate cash flow from operations.
There may be some variation in the method of computation of these metrics as determined by the Company compared with other mining companies. In this context, “total cash costs” reflects mining and processing costs
allocated from in-process and dore inventory associated and associated royalties with ounces of gold sold in the period. Total cash costs per ounce are exclusive of exploration costs. “All-in sustaining costs per ounce”
include total cash costs, exploration, corporate and administrative, share based compensation and sustaining capital costs. “Mine-site all-in sustaining costs” include total cash costs, exploration, and sustaining capital costs
for the mine-site, but exclude an allocation of corporate and administrative and share based compensation.
Additional GAAP measures that are presented on the face of the Company’s consolidated statements of comprehensive income and are not meant to be a substitute for other subtotals or totals presented in accordance
with IFRS, but rather should be evaluated in conjunction with such IFRS measures. This includes “Earnings from operations”, which is intended to provide an indication of the Company’s operating performance, and
represents the amount of earnings before net finance income/expense, foreign exchange gain/loss, other income/loss, and income tax expense. Non-GAAP and additional GAAP measures do not have a standardized
meaning prescribed under IFRS and therefore may not be comparable to similar measures presented by other companies. A reconciliation of historical non-GAAP and additional GAAP measures are available at
www.alamosgold.com.
Technical Information
Except as otherwise noted herein, Chris Bostwick, FAusIMM, Alamos Gold’s Vice President, Technical Services, has reviewed and approved the scientific and technical information contained in this presentation. Chris
Bostwick is a Qualified Person within the meaning of Canadian Securities Administrator’s National Instrument 43-101. For more information, please refer to the Alamos Gold Inc. 2015 Annual Information Form and the
technical reports referenced therein and in this presentation, available on SEDAR (www.sedar.com).
All figures in US$ unless otherwise indicated.
Cautionary Notes
3
1 Based on 2017 Guidance
2 Please refer to Cautionary Notes on non-GAAP Measures and Additional GAAP Measures.
3 As of September 30, 2016
Strong Platform for Delivering Long Term Value
Diversified gold production
400,000 – 430,000 oz from
three North American mines1
Expanding margins
$940/oz AISC, an expected 6%
decrease from 20161,2
Peer leading growth
Portfolio of 6 low-cost
development projects
Strong balance sheet
$287m cash and available-for-sale
securities3 to support growth
Track record of
delivering
shareholder value
4
2014A 2015A 2016A 2017E
Gold Production (000 oz)
Toronto
Head Office
Diversified North American Gold Production
Based on 2017 Guidance. See press release dated January 6, 2017.
1 Please refer to Cautionary Notes on non-GAAP Measures and Additional GAAP Measures.
2 For the purposes of calculating mine-site all-in sustaining costs, the Company does not include an allocation of corporate and
administrative and share based compensation expenses.
Growing, diversified production
380
392
400 – 430
+6%
MULATOS
2017E Au Production 150-160k oz
2017E Au Total Cash Costs1 US$815/oz
2017E Au Mine-site AISC1,2 US$890/oz
EL CHANATE
2017E Au Production 50-60k oz
2017E Au Total Cash Costs1 US$1,200/oz
2017E Au Mine-site AISC1,2 US$1,200/oz
YOUNG-DAVIDSON
2017E Au Production 200-210k oz
2017E Au Total Cash Costs1 US$625/oz
2017E Au Mine-site AISC1,2 US$775/oz
365
5
$57
$229
$310
2015A 2016A 2017E
$1,091
~$1,000
$940
2015A 2016A 2017E
$1,241
$1,091
$1,065
2015A 2016E 2017E
Expanding Margins & Site Free Cash Flow
1 Cost of sales includes mining and processing costs, royalties and amortization.
2 Please refer to Cautionary Notes on non-GAAP Measures and Additional GAAP Measures.
3 Total consolidated all-in sustaining costs include corporate and administrative and share based compensation expenses.
4 AISC Margin calculated as realized gold price less AISC. For 2017E this assumes a $1,250/oz gold price
AISC2,3 (US$/oz)
-6%
Cost of Sales1 (US$/oz)
+35%
Declining costs & stronger gold price
driving significant margin expansion
AISC Margin2,3,4 (US$/oz)
6
Leading
development
pipelineGrowth at existing
operations
ESPERANZA
Production
79%
Development
21%
Peer Leading Low-Cost Growth Profile
Controlled, disciplined, multi-stage growth
Advanced
exploration
AĞI DAĞI
KIRAZLI
ÇAMYURT
Consensus NPV
by Geography1
Consensus NPV
by Stage1
Canada
64%
Mexico
24%
Turkey
12%
QUARTZ MOUNTAIN
LYNN LAKE
MULATOS DISTRICT
Producing Assets
Development/Exploration Assets
YOUNG-DAVIDSON
RAMP-UP
MULATOS: LA YAQUI
& CERRO PELON
1 Consensus analyst estimates
Please refer to Cautionary Notes on non-GAAP Measures and Additional GAAP Measures.
7
Strong Balance Sheet
1 Unaudited management estimate as of September 30, 2016.
2 Cash, cash equivalents & available for sale securities.
3 As of January 16, 2017.
No debt maturities until 2020
Balance Sheet
Cash & Cash Eq.1,2 US$287 million
Working Capital1 US$368 million
Total Debt1 US$315 million
Capital Structure
Shares Outstanding 267.0 million
Warrants 11.8 million
Employee Options 9.6 million
Fully Diluted 290.0 million
Recent Share Price (TSX)3 C$10.92
Market Capitalization ~C$2.9 billion
$287 m
$315 m
Cash Total Debt
As of September 30, 2016
2
8
960%
15%
241%
-50%
450%
950%
1450%
1950%
2003 2004 2005 2006 2007 2008 2009 2010 2011 2012 2013 2014 2015 2016
Alamos Gold Inc. (TSX:AGI) - Share Price
S&P/TSX Global Gold Index
Gold (US$/oz)
Track Record of Delivering Shareholder Value
18%
Annualized return
since 2003
MULATOS: BLUEPRINT FOR SUCCESS
LEADING GROWTH PROFILE WITH
DISCIPLINED M&A STRATEGY
ROE AMONG BEST IN INDUSTRY 11% Alamos five year average ROE prior to merger4
$10m
cost to acquire
Mulatos in 2003
$350m
free cash flow1
generated to date
$70m
initial capital raised
to build Mulatos
6
development
projects
$170m
total combined
acquisition cost
10.7m
combined M&I and
Inferred resources2,3
1 Please refer to Cautionary Notes on non-GAAP Measures and Additional GAAP Measures.
2 Includes Measured and Indicated resources of 7.0m oz Au (227 mt at 0.96 g/t Au) and Inferred resources of 3.7m oz Au (116 mt at 0.99 g/t Au).
3 See mineral reserve and resource estimates and associated footnotes in appendix.
4 Alamos adopted AuRico Gold’s financials with the completion of the merger of the two companies in July 2015. Prior to the merger, Alamos’ five year average return on equity ending 2014 was 10.7%.
9
2016E
2016A
2016E
Q3 YTD 2016
2016 Scorecard – Production, Costs & Capital on Track
1 Please refer to Cautionary Notes on non-GAAP Measures and Additional GAAP Measures.
2 Total consolidated all-in sustaining costs include corporate and administrative and share based compensation expenses.
3 Cost of sales includes mining and processing costs, royalties and amortization.
4 See mineral reserve and resource estimates and associated footnotes in appendix and press release dated September 12, 2016 “Alamos Reports Significant Interim Increase in Mineral Resources at La Yaqui”
8%
decrease in 2016 AISC1 with a
further 6% decline expected in 2017
Production (oz Au)
Capital Spending (US$m)
AISC1,2 (US$/oz)
$22m
Q3 YTD 2016 site free cash flow1 –
significant growth expected in 2017
392,000 oz
Met 2016 production guidance
Cost of Sales3 (US$/oz)
$1,091
$1,093
2016E
Q3 YTD 2016
370,000 – 400,000 oz
392,000 oz
$109m
$138m – $158m

$975
~$1,000
2016E
2016A
10
2016 Scorecard – Growth Projects
Permitting milestones
La Yaqui Phase I EIA &
Kirazlı Forestry Permits granted
80 89 89
149
232
298
0
100
200
300
400
500
600
2014 2015 August 2016
Auoz(000)
Inferred Mineral Resources Indicated Mineral Resources
Proven & Probable Mineral Reserves
1
Surfacing value
Exploration success
570% increase in combined mineral reserves
& resources at La Yaqui since 20141
+570%
1 Includes Proven & Probable reserves of 89,000 oz (1.9 mt at 1.45 g/t Au), Measured and Indicated resources of 149,000 oz (4.1 mt at 1.14 g/t Au) and Inferred resources of 298,000 oz (5.5 mt at 1.68 g/t Au).
For more information, see press releases dated September 12, 2016 “Alamos Reports Significant Interim Increase in Mineral Resources at La Yaqui” and March 24, 2016 “Alamos Reports Mineral Reserves and Resources for the Year-Ended 2015”
and September 21, 2015 “Alamos Announces Discovery of New Zones of Mineralization at Cerro Pelon and La Yaqui”.
See mineral reserve and resource estimates and associated footnotes in appendix.
La Yaqui Grande
La Yaqui Phase I
11
2015A 2016A 2017E
$1,241
$1,091
$1,065
2015A 2016E 2017E 2015A 2016E 2017E
$1,091
~$1,000
$940
2015A 2016A 2017E
2017 Guidance – Growing Production, Declining Costs
Gold Production (000 oz) AISC1,2 (US$/oz)
-6%
Total Capital Spending (US$m)
$138-158m4
$140-157m
Cost of Sales3 (US$/oz)
1 Please refer to Cautionary Notes on non-GAAP Measures and Additional GAAP Measures.
2 Total consolidated all-in sustaining costs include corporate and administrative and share based compensation expenses.
3 Cost of sales includes mining and processing costs, royalties and amortization.
4 Total capital spending for Alamos has been included for the periods prior to July 2, 2015 for comparative purposes only.
392
400 – 430
+6%
380
$190m
12
Young-Davidson – Flagship, Long-Life Production
Location: Ontario, Canada
Ownership: 100% interest
Stage: Producing
Operation: Underground
• One of Canada’s largest underground gold mines
• 15 year mine life based on year end 2015 reserves
• Large resource base and exploration potential to
support mine life extension
Gold Reserves & Resources4 Tonnes
(000)
Grade
(g/t)
oz Au
(000)
P&P Underground Reserves 44,290 2.69 3,837
M&I Underground Resources 7,955 3.45 883
Inferred Underground Resources 3,523 2.76 312
$20m
reduction in capital expected in 2017
95%
of costs are in Canadian Dollars – C$
gold price near historical highs
1 Cost of sales includes mining and processing costs, royalties and amortization.
2 Please refer to Cautionary Notes on non-GAAP Measures and Additional GAAP Measures.
3 Excludes Net Realizable Value (“NRV”) inventory adjustments. See associated MD&A for a full reconciliation.
4 See mineral reserve and resource estimates and associated footnotes in appendix.
2015A Q4/16A 2016A 2016E 2017E
Gold Production (k oz) 160.4 44.7 170.0 170-180 200-210
Cost of Sales1 (US$/oz) $1,162 - - $1,034 $1,050
Total Cash Costs2,3 (US$/oz) $683 - - $600 $625
Mine-site AISC2,3 (US$/oz) $986 - - $825 $775
Total Capital (US$m) $108 - - $85-95 $70-80
13
Growing production; declining costs; declining capital intensity
>6,600 tpd
average underground mining rate
in Q4 2016
Young-Davidson – Ramp up of Underground Mining
Owner development
transition completed in April 2016
MCM shaft
completed commissioning Q1 2016
>7,000 tpd
achieved 2016 year-end
underground mining rate target
Please refer to Cautionary Notes on non-GAAP Measures and Additional GAAP Measures.
0
1,000
2,000
3,000
4,000
5,000
6,000
7,000
8,000
Q1/13
Q2/13
Q3/13
Q4/13
Q1/14
Q2/14
Q3/14
Q4/14
Q1/15
Q2/15
Q3/15
Q4/15
Q1/16
Q2/16
Q3/16
Q4/16
Mill TPD Underground TPD
14
Mulatos – Our Founding Operation
Location: Sonora State, Mexico
Ownership: 100% interest
Stage: Producing
Operation: Open pit, heap leach & high grade mill
• Mine life of 6 years based on YE 2015 reserves
• Generated ~$350m in free cash flow2 to date
• Large exploration package (28,773 ha)
Gold Reserves & Resources4 Tonnes
(000)
Grade
(g/t)
oz Au
(000)
P&P Reserves 44,713 1.07 1,543
M&I Resources 81,126 1.14 2,972
Inferred Resources 13,773 1.25 555
$909/oz
Q3 YTD 2016 AISC2, down 13% from
2015 levels
154k oz
2016 production – exceeding
full year guidance
1 Cost of sales includes mining and processing costs, royalties and amortization.
2 Please refer to Cautionary Notes on non-GAAP Measures and Additional GAAP Measures.
3 Capital spending guidance for 2016 and 2017 excludes capitalized exploration.
4 See mineral reserve and resource estimates and associated footnotes in appendix.
2015A Q4/16A 2016A 2016E 2017E
Gold Production (k oz) 140.3 44.9 154.0 140-150 150-160
Cost of Sales1 (US$/oz) $1,116 - - $1,097 $1,015
Total Cash Costs2 (US$/oz) $869 - - $850 $815
Mine-site AISC2 (US$/oz) $1,047 - - $925 $890
Total Capital3 (US$m) $45 - - $25-35 $33-40
15
$1,047
$925
$890
2015A 2016E 2017E
220 259 259
47
196
236
302
0
100
200
300
400
500
600
700
800
2014 2015 August 2016
000ozAu
Inferred Mineral Resources Measured & Indicated Mineral Resources Proven & Probable Mineral Reserves
Mulatos – Declining Cost Profile
Focused cost reductions
2017 AISC expected to decrease ~$160/oz
from 2015
Higher mill production
Transition to concentrate production
generating higher recoveries
Declining cost profile
Low cost production from La Yaqui & Cerro
Pelon; 5% royalty nearing completion
Ongoing exploration success
Improved land access & renewed focus –
2017 Mulatos exploration budget of $17m
Declining Costs
1 Please refer to Cautionary Notes on non-GAAP Measures and Additional GAAP Measures.
2 For the purposes of calculating mine-site all-in sustaining costs, the Company does not include an allocation of corporate and administrative and share based compensation expenses.
3 Cost of sales includes mining and processing costs, royalties and amortization.
4 For more information, see press releases dated September 12, 2016 “Alamos Reports Significant Interim Increase in Mineral Resources at La Yaqui” and March 24, 2016 “Alamos Reports Mineral Reserves and Resources for the Year-Ended 2015”
5 2016 reserves & resources Include 5.2 mt at 1.56 g/t for 259k oz in the Proven & Probable category, 4.6 mt at 1.32 g/t for 196k oz in the Measured & Indicated categories and 5.6 mt at 1.67 g/t for 302k oz in the Inferred category.
La Yaqui & Cerro Pelon Reserve & Resource
Growth4,5
+244%
Mine-site AISC1,2 (US$/oz) Cost of Sales3 (US$/oz)
-15%
$1,116
$1,097
$1,015
2015A 2016E 2017E
16
La Yaqui & Cerro Pelon – Low Cost Production Growth
1 Please refer to Cautionary Notes on non-GAAP Measures and Additional GAAP Measures.
2 See mineral reserve and resource estimates and associated footnotes in appendix.
Gold Reserves &
Resources2
Tonnes
(000)
Grade
(g/t)
oz Au
(000)
La Yaqui 1,912 1.45 89
Cerro Pelon 3,253 1.63 170
Total P&P Reserves 5,165 1.56 259
La Yaqui 4,050 1.14 149
Cerro Pelon 572 2.57 47
Total M&I Resources 4,622 1.32 196
La Yaqui 5,524 1.68 298
Cerro Pelon 109 1.23 4
Total Inferred Resources 5,633 1.67 302
87% higher grade
Combined reserve grade 1.56 g/t, 87%
above 2017 budget
Initial production H2-2017
Phase I development of La Yaqui on track
~$400/oz
La Yaqui Phase I 2017 total cash costs1,
51% lower than 2017 Mulatos budget
District potential
Large underexplored land package; >70% of past
drilling focused near Mulatos mine
Mulatos District
Mulatos mine
17
El Chanate – Consistent Gold Producer
Location: Sonora State, Mexico
Ownership: 100% interest
Stage: Producing
Operation: Open pit, heap leach
• Positive free cash flow generation in 2015
• Significant free cash flow at end of mine life – low
cost production through residual leaching
1 Cost of sales includes mining and processing costs, royalties and amortization.
2 Please refer to Cautionary Notes on non-GAAP Measures and Additional GAAP Measures.
3 Excludes Net Realizable Value (“NRV”) inventory adjustments. See associated MD&A for a full reconciliation.
4 See mineral reserve and resource estimates and associated footnotes in appendix.
5 ~75% of El Chanate’s 2017 expected production has been hedged through gold collars ensuring minimum gold price of $1,225/oz and participation up to $1,450/oz
Gold Reserves & Resources4 Tonnes
(000)
Grade
(g/t)
oz Au
(000)
P&P Reserves – Open Pit 19,317 0.59 365
P&P Reserves – Leach Pad Inventory - - 98
M&I Resources 2,327 0.86 64
~75%
2017 production hedged ensuring
minimum gold price of $1,225/oz5
$5m
Site free cash flow2 generated Q3
YTD 2016
2015A Q4/16A 2016A 2016E 2017E
Gold Production (k oz) 79.3 16.1 68.0 60-70 50-60
Cost of Sales1 (US$/oz) $1,504 - - $1,231 $1,265
Total Cash Costs2,3 (US$/oz) $808 - - $1,100 $1,200
Mine-site AISC2,3 (US$/oz) $978 - - $1,100 $1,200
Total Capital (US$m) $14 - - $1 $2
18
Development: Lynn Lake Project – High Grade, Open Pit
1 For more information regarding the Lynn Lake District, please refer to the press release issued by Carlisle Goldfields dated February 27, 2014 titled Carlisle
Announces Optimized PEA of the Farley and MacLellan deposits at Lynn Lake returns Post-Tax IRR of 26.3% at US$1,100 gold price available on SEDAR.
2 See mineral reserve and resource estimates and associated footnotes in appendix.
3 Please refer to Cautionary Notes on non-GAAP Measures and Additional GAAP Measures.
Location: Manitoba, Canada
Ownership: 100% interest
Stage: Feasibility
Operation: Open pit
• Located in the highly-prospective Lynn Lake
Mining District
• One of the highest grade open pit deposits in
Canada; significant exploration potential
• Existing infrastructure in place, low power
rates of C$0.027/kwh
• Feasibility study expected in Q3 2017
Life of Mine Production Profile1
0
50
100
150
200
250
1 2 3 4 5 6 7 8 9 10 11 12
Gold(kozperyear)
Life of Mine (years)
Gold Reserves & Resources2 Tonnes
(000)
Grade
(g/t)
oz Au
(000)
M&I Resources 40,303 2.03 2,629
Inferred Resources 50,704 1.28 2,089
19
Development: Kirazlı, Ağı Dağı & Çamyurt
1 Please refer to press release dated June 28, 2012 on Turkey PFS and Çamyurt initial mineral resource estimate.
2 Please refer to Cautionary Notes on non-GAAP Measures and Additional GAAP Measures.
3 See mineral reserve and resource estimates and associated footnotes in appendix.
2012 Positive Pre-feasibility Study – Summary1
Kirazlı Ağı Dağı
Mine Life Years 5 7
Average Annual Production
oz Au 99,000 143,000
oz Ag 601,000 271,000
Average Throughput tpd 15,000 30,000
Average grade g/t Au 0.75 0.55
Total Cash Costs2
US$/oz $515 $611
Pre-production Capex US$m $146.1 $278.3
Total Capex US$m $165.7 $326.6
Location: Turkey
Ownership: 100% interest
Stage: Development
Operation: Open pit, heap leach
Kirazlı3
Tonnes Grade Contained Ounces
(000) (g/t Au) (g/t Ag) (000 Au) (000 Ag)
Measured & Indicated 32,734 0.72 8.74 758 9,202
Inferred 5,689 0.59 8.96 108 1,638
Ağı Dağı3
Measured & Indicated 90,052 0.59 4.09 1,695 11,849
Inferred 16,760 0.46 2.85 245 1,534
Çamyurt3
Measured & Indicated 17,721 0.89 6.14 509 3,496
Inferred 2,791 0.95 5.77 85 518
• Kirazlı Forestry Permits received Jan 2017
• Kirazlı & Ağı Dağı EIA’s approved
• Kirazlı & Ağı Dağı feasibility studies & Çamyurt PEA
nearing completion
• New mining law supportive of industry
20
Development: Esperanza & Quartz Mountain
1 Please refer to Cautionary Notes on non-GAAP Measures and Additional GAAP Measures
2 Historic column recovery tests for gold at Quartz Mountain varied between 74% and 88% for the felsic rock hosted mineralization; see Orsa Ventures press release dated February 12, 2013
3 See mineral reserve and resource estimates and associated footnotes in appendix.
4 Additional C$3m due on completion of feasibility study & C$15m or 2% NSR upon successful permitting
Location: Morelos State, Mexico
Ownership: 100% interest
Stage: Development
Operation: Open pit, heap leach
• Excellent infrastructure; low technical risk
• Low capital intensity and operating costs
• Average annual production potential > 100,000 oz
• All-in sustaining costs expected to be lowest quartile1
Location: Oregon, United States
Ownership: Right to earn a 100% interest4
Stage: Advanced Exploration
• Located on northern extension of prolific Basin & Range
Province of Nevada
• Low strip ratio, favourable metallurgy2
• Acquisition cost $3.5m
Tonnes Grade Contained Ounces
(000) (g/t Au) (g/t Ag) (000 Au) (000 Ag)
Measured & Indicated3
34,352 0.98 8.09 1,083 8,936
Inferred 718 0.80 15.04 18 347
Quartz Butte
Crone Hill
Tonnes Grade Contained Ounces
(000) (g/t Au) (000 Au)
Measured & Indicated3
12,156 0.87 339
Inferred 39,205 0.91 1,147
Project: Esperanza
Project: Quartz Mountain
21
Alamos – Investment Case
Diversified intermediate gold producer
Low-cost growth profile
Strong balance sheet to support growth
Long term track record of delivering shareholder value
Catalysts
 Q3 2016: 93% increase in combined resources at La Yaqui
 Q4 2016: La Yaqui EIA approved
 Q4 2016: Met consolidated 2016 production guidance
 Q4 2016: Achieved year-end target of 7,000 tpd from UG at YD
 Q1 2017: Received Forestry Permits for Kirazlı project
2017: Kirazlı & Ağı Dağı feasibility studies & Çamyurt PEA
Q3 2017: Lynn Lake feasibility study
H2 2017: Initial production at La Yaqui
22
Appendices
23
Board of Directors and Executive and Management Team
Paul J. Murphy Chairman
John A. McCluskey Director
Mark J. Daniel Director
Patrick D. Downey Director
David Fleck Director
David Gower Director
Claire M. C. Kennedy Director
Ronald E. Smith Director
Kenneth Stowe Director
John A. McCluskey President and Chief Executive Officer
Jamie Porter Chief Financial Officer
Peter MacPhail Chief Operating Officer
Christine Barwell Vice President, Human Resources
Chris Bostwick Vice President, Technical Services
Luis Chavez Senior Vice President, Mexico
Andrew Cormier Vice President, Development & Construction
Nils Engelstad Vice President, General Counsel
Greg Fisher Vice President, Finance
Aoife McGrath Vice President, Exploration
Scott Parsons Vice President, Investor Relations
Colin Webster Vice President, Sustainability & External Affairs
Board of Directors Executive and Management Team
24
Sustainability
• Our Objectives
• As we pursue further growth, we will continue to measure our success as an
organization by our performance in achievement of our sustainability objectives:
• Protecting the health and well-being of our employees
• Creating shared value with our host communities and countries
• Ensuring that our operations are net-positive for the environment
• Over the years, Alamos has been recognized for its achievements in these areas:
Clean Industry Certification from PROFEPA
• Alamos was certified as an Industria Limpia (clean industry)
in recognition of the excellence of environmental management
at Mulatos
CSR Award from Mexican Center for Philanthropy (CEMEFI)
• Signifies exceptional record of CSR performance;
• 2015 marked the 7th consecutive year for Alamos
25
1 Please refer to Cautionary Notes on non-GAAP Measures and Additional GAAP Measures.
2 Excludes capitalized exploration.
3 For the purposes of calculating mine-site all-in sustaining costs at individual mine sites, the Company does not include an allocation of corporate and administrative and share based compensation expenses to the mine sites.
4 Cost of sales includes mining and processing costs, royalties, and amortization expense
2017 Guidance
2017 Guidance
2016
Guidance
Young-Davidson Mulatos El Chanate Total Total
Gold production (000’s ounces) 200-210 150-160 50-60 400-430 392 (actual)
Cost of Sales (in millions) (4) $215 $157 $70 $442 $420
Cost of Sales ($/oz)(4) $1,050 $1,015 $1,265 $1,065 $1,091
Total cash costs ($/oz)(1) $625 $815 $1,200 $765 $800
All-in sustaining costs ($/oz)(1) $940 $975
Mine-site all-in sustaining costs ($/oz) (1),(3) $775 $890 $1,200 - -
Capital expenditures (in millions)
Sustaining capital(1) $30-35 $8-10 $2 $40-47 $51-61
Growth capital(1) $40-45 $25-30 (2) - $65-75 $60-70
Total – Operating Mines(1) $70-80 $33-40 $2 $105-122 $111-131
Total – Development Projects $35
Total Consolidated Budget $140-157 $138-158
Corporate & Administrative (in millions) $16 $16
26
$287
($315)
-$2,250
-$1,750
-$1,250
-$750
-$250
$250
$750
Randgold Pan
American
Tahoe Centerra OceanaGold Alamos Detour B2Gold IAMGOLD Eldorado New Gold Kinross Yamana
Cash Total Debt
Strong Balance Sheet
1 Cash, cash equivalents & available for sale securities
Source: Factset and company disclosure. Based on financial statements for the period ending September 30, 2016.
Please refer to Cautionary Notes on non-GAAP Measures and Additional GAAP Measures.
Well positioned in any gold price environment
Cash1 / (Total Debt) (US$m)
1
27
Young-Davidson – Increasing Grade & Productivity
1 Cost of sales includes mining and processing costs, royalties and amortization.
2 Please refer to Cautionary Notes on non-GAAP Measures and Additional GAAP Measures.
3 Excludes Net Realizable Value (“NRV”) inventory adjustments. See associated MD&A for a full reconciliation.
4 Excludes hydro rebate not attributable to Q4/15
Underground ramp up driving production higher and unit costs lower
Q1/13 Q2/13 Q3/13 Q4/13 Q1/14 Q2/14 Q3/14 Q4/14 Q1/15 Q2/15 Q3/15 Q4/15 Q1/16 Q2/16 Q3/16 Q4/16
Gold ounces produced 28,281 29,252 30,099 33,106 35,104 40,166 40,538 40,945 38,098 39,365 38,201 44,694 39,065 42,644 43,629 44,662
Cost of sales1 (US$/oz) Pre-commercial production $1,677 $1,625 $1,370 $1,211 $1,216 $1,298 $1,165 $986 $1,058 $1,182 $1,032
Total cash costs per oz. (2,3)
$694 $716 $666 $850 $1,009 $871 $723 $719 $745 $697 $681 $617 $616 $738 $607
Mine-site AISC per oz.(2,3)
$1,059 $1,254 $1,357 $1,270 $1,315 $1,144 $959 $912 $987 $1,008 $979 $980 $846 $965 $849
Underground mine
Tonnes mined per day 1,130 1,611 1,417 2,590 2,611 3,595 3,753 4,140 4,130 5,149 5,081 5,911 5,776 6,123 5,467 6,600
Grades (g/t) 2.7 2.5 2.8 3.1 2.8 3.3 3.1 3.0 3.0 2.6 2.6 2.6 2.6 2.4 2.8
Development metres 1,941 2,445 2,620 2,986 3,772 3,545 3,269 3,438 3,409 3,789 3,619 3,769 3,490 3,168 2,677
Unit UG mining costs (US$)
Pre-commercial production
$46 $45 $41 $39 $39 $33 $32 $294 $31 $34 $34
Unit UG mining costs (CAD$) $51 $49 $45 $44 $48 $41 $41 $384 $42 $44 $45
Mill processing facility
Tonnes processed per day 6,466 7,017 6,747 6,969 7,163 8,230 7,670 7,757 7,186 7,677 7,680 7,630 7,342 7,006 6,833
Grades (inc. OP stockpile) 1.8 1.7 1.7 2.0 1.8 2.2 1.9 2.0 2.0 2.0 1.9 2.2 2.1 2.1 2.4
Recoveries (%) 86% 85% 89% 88% 87% 88% 90% 88% 86% 88% 92% 91% 90% 92% 93%
$0
$5
$10
$15
$20
$25
$30
$35
$40
$45
$50
1,500
2,500
3,500
4,500
5,500
6,500
Q1/14 Q2/14 Q3/14 Q4/14 Q1/15 Q2/15 Q3/15 Q4/15 Q1/16 Q2/16 Q3/16 Q4/16
UnitUGminingcosts(US$/t)
UndergroundTPD
Underground tonnes mined per day Unit UG mining costs (US$/t)
28
Young-Davidson – Development Schedule
Please refer to Cautionary Notes on non-GAAP Measures and Additional GAAP Measures.
Declining capital intensity
2016 2017 2018 2019
 Commissioning of MCM shaft
 Transition to 100% owner
development
 Ramp up to 7,000 tpd
• Raise boring of lower NG shaft
• Completion of MCM waste pass
• Shaft bottom infrastructure
• Northgate shaft hoisting from
8900L
29
Young-Davidson – Long Section
MCM
Wastepass
East
Wastepass
Productivity improvements &
declining costs
Developing the underground to support ramp up of underground mining
Milled grade higher
Declining capital intensity
Higher underground mining
rates driving:
Production growth
30
Mulatos District
31
Mulatos – La Yaqui Project Area
For more information, see press releases dated September 12, 2016 “Alamos Reports Significant Interim Increase in Mineral Resources at La Yaqui” and March 24, 2016 “Alamos Reports Mineral Reserves and Resources for the Year-Ended
2015” and September 21, 2015 “Alamos Announces Discovery of New Zones of Mineralization at Cerro Pelon and La Yaqui”.
32
Mulatos – La Yaqui Conceptual Cross Section Zone 1
For more information, see press releases dated September 12, 2016 “Alamos Reports Significant Interim Increase in Mineral Resources at La Yaqui” and March 24, 2016 “Alamos Reports Mineral Reserves and Resources for the Year-
Ended 2015” and September 21, 2015 “Alamos Announces Discovery of New Zones of Mineralization at Cerro Pelon and La Yaqui”.
33
Mulatos – La Yaqui Conceptual Cross Section Zone 2
For more information, see press releases dated September 12, 2016 “Alamos Reports Significant Interim Increase in Mineral Resources at La Yaqui” and March 24, 2016 “Alamos Reports Mineral Reserves and Resources for the Year-
Ended 2015” and September 21, 2015 “Alamos Announces Discovery of New Zones of Mineralization at Cerro Pelon and La Yaqui”.
34
Mulatos – Cerro Pelon Project Area
RESULTS IN RESERVE CONES
15PEL056: 46m @ 1.13g/t Au (2 – 48m)
15PEL066: 27m @ 2.74g/t Au (34– 61m)
15PEL069: 20m @ 2.54g/t Au (52 - 72m) &
34m @ 6.67g/t Au (134 - 168m)
15PEL070: 44m @ 1.43g/t Au (11 – 55m)
15PEL073: 33m @ 3.20g/t Au (4 – 37m)
RESULTS IN RESOURCE CONES
15PEL012: 50m @ 14.47g/t Au (157-207m)
15PEL020: 35m @ 9.65g/t Au (157 - 192m)
15PEL075: 9m @ 2.69g/t Au (121 - 130m)
15PEL077: 52m @ 1.35g/t Au (41 - 93 m) &
6m @ 1.47g/t Au (97 - 103 m)
15PEL085: 14m @ 10.63g/t Au (24 - 138m)
16PEL018: 47m @ 7.79g/t Au (88 – 135m)
16PEL021: 41m @ 0.92g/t Au (81 - 122m)
See press release dated August 10, 2016 “Alamos Reports
Second Quarter 2016 Results and Provides Exploration
Update at Mulatos”.
35
Mulatos – Cerro Pelon Project Area
Conceptual Long Section (Looking West)
Highlight intercepts from the 2015 exploration program at Cerro Pelon, including several previously released results as indicated by *
For more information, see press releases dated March 24, 2016 “Alamos Reports Mineral Reserves and Resources for the Year-Ended 2015” and September 21, 2015 “Alamos Announces Discovery of New Zones of Mineralization at
Cerro Pelon and La Yaqui”.
36
Best In Class Portfolio of Assets
MULATOS
2017E Au Production 150-160k oz
2017E Au Total Cash Costs US$815/oz
2P Au Reserves 1.5m oz (44.7mt @ 1.07 g/t)
Total Au M&I Resources 3.0m oz (81.1mt @ 1.14 g/t)
Total Au Inf. Resources 0.6m oz (13.8mt @ 1.25 g/t)
EL CHANATE
2017E Au Production 50-60k oz
2017E Au Total Cash Costs US$1,200/oz
2P Au Reserves 0.5m oz (19.3mt @ 0.75 g/t)
Total Au M&I Resources 0.1m oz (2.3mt @ 0.86 g/t)
QUARTZ MOUNTAIN
Stage Advanced Exploration
Total Au M&I Resources 0.3m oz (12.2mt @ 0.87 g/t)
Total Au Inf. Resources 1.1m oz (39.2mt @0.91 g/t)
YOUNG-DAVIDSON
2017E Au Production 200-210k oz
2017E Au Total Cash Costs US$625/oz
2P Au Reserves 3.9m oz (45.7mt @ 2.64 g/t)
Total Au M&I Resources 1.0m oz (9.7mt @ 3.05 g/t)
Total Au Inf. Resources 0.3m oz (3.6mt @ 2.74g/t)
AĞI DAĞI
Stage Permitting
Est. Annual Production 143k oz
Est. Total Cash Costs US$611/oz
Total Au M&I Resources 1.7m oz (90.1mt @ 0.59 g/t)
Total Au Inf. Resources 0.2m oz (16.8mt @ 0.46 g/t)
Producing Assets
Exploration / Development Assets
Toronto
Head Office
ESPERANZA
Stage Permitting
Est. Annual Production +100k oz
Est. Total Cash Costs ~US$500/oz
Total Au M&I Resources 1.1m oz (34.4mt @ 0.98 g/t)
KIRAZLI
Stage Permitting
Est. Annual Production 99k oz
Est. Total Cash Costs US$515/oz
Total Au M&I Resources 0.8m oz (32.7mt @ 0.72 g/t)
Total Au Inf. Resources 0.1m oz (5.7mt @ 0.59 g/t)
ÇAMYURT
Stage Resource Dev.
Total Au M&I Resources 0.5m oz (17.7mt @ 0.89 g/t)
Total Au Inf. Resources 0.1m oz (2.8mt @0.95 g/t)
LYNN LAKE
Stage Feasibility
Est. Annual Production 145k oz
Est. Total Cash Costs C$530/oz
Total Au M&I Resources 2.6m oz (40.3mt @ 2.03 g/t)
Total Au Inf. Resources 2.1m oz (50.7mt @ 1.28 g/t)
Diversified production Low-cost growth Safe jurisdictions
Consensus NPV
by Geography1
Consensus NPV
by Stage1
Production
79%
Development
21%
Canada
64%
Mexico
24%
Turkey
12%
Please refer to Cautionary Notes on non-GAAP Measures and Additional GAAP Measures.
Note: Mineral resources are exclusive of mineral reserves. See mineral reserve and resource estimates and associated footnotes in appendix.
1Consensus analyst estimates
37
Long Life Reserve Base
Reserve Life Index (on Operating Assets)2
Gold Mineral Reserves & Resources1
1 See mineral reserve and resource estimates and associated footnotes in appendix.
2 Source: TD Securities. 2015 Y/E operating gold reserves/2017E gold production; adjusted for asset sales.
5.9 5.9
11.1
4.6
0
5
10
15
20
25
Mineral Reserves Mineral Reserves & Resources
Auoz(millions)
Inferred Mineral Resources
M&I Mineral Resources
P&P Mineral Reserves
26.1
19.2
14.5 13.8
11.6 10.7 10.4 10.3 9.7 9.5
8.2
6.8
4.4
0
5
10
15
20
25
30
DGC ELD NEM AGI GG ABX KGC AUY AEM IMG SMF NGD P
Reservelifeindex(years)
38
2015 Proven and Probable Mineral Reserves
PROVEN AND PROBABLE MINERAL RESERVES
AS AT DECEMBER 31, 2015
PROVEN PROBABLE PROVEN + PROBABLE
TONNES GRADE CONTAINED TONNES GRADE CONTAINED TONNES GRADE CONTAINED
(000) (G/T AU)
OUNCES
(000)
(000) (G/T AU)
OUNCES
(000)
(000) (G/T AU)
OUNCES
(000)
Young-Davidson
Surface 1,396 0.82 37 - 0.00 - 1,396 0.82 37
Underground 14,282 2.73 1,255 30,008 2.68 2,582 44,290 2.69 3,837
Total Young-Davidson 15,678 2.56 1,292 30,008 2.68 2,582 45,686 2.64 3,874
Mulatos
Mulatos Main Pits 5,248 0.98 165 27,654 0.85 756 32,902 0.87 921
San Carlos Underground 83 15.49 42 77 7.66 19 161 11.73 61
Stockpiles 6,485 1.45 302 - - - 6,485 1.45 302
La Yaqui 474 1.52 23 1,438 1.42 66 1,912 1.45 89
Cerro Pelon 960 1.70 53 2,293 1.59 117 3,253 1.63 170
Total Mulatos 13,251 1.37 585 31,462 0.95 958 44,713 1.07 1,543
El Chanate
El Chanate Open Pit 11,480 0.55 204 7,837 0.64 161 19,317 0.59 365
El Chanate Leach Pad Inv. - - 98 - - - - - 98
Total El Chanate 11,480 0.82 302 7,837 0.64 161 19,317 0.75 463
Total Alamos 40,409 1.68 2,178 69,307 1.66 3,702 109,716 1.67 5,880
39
2015 Total Measured and Indicated Mineral Resources
MEASURED AND INDICATED GOLD MINERAL RESOURCES (AS AT DECEMBER 31, 2015)
MEASURED RESOURCES INDICATED RESOURCES TOTAL MEASURED AND INDICATED
TONNES GRADE OUNCES TONNES GRADE OUNCES TONNES GRADE OUNCES
(000'S) (G/T AU) (000'S) (000'S) (G/T AU) (000'S) (000'S) (G/T AU) (000'S)
Young-Davidson – Surface 496 1.13 18 1,242 1.28 51 1,739 1.24 69
Young-Davidson – Underground 4,248 3.47 474 3,707 3.43 408 7,955 3.45 883
Total Young-Davidson 4,744 3.23 493 4,949 2.89 460 9,694 3.05 952
Mulatos 8,625 1.24 343 65,921 1.08 2,287 74,546 1.10 2,630
San Carlos UG 236 6.03 46 367 5.42 64 603 5.66 110
La Yaqui - - - 4,050 1.14 149 4,050 1.14 149
Cerro Pelon 117 2.75 10 455 2.52 37 572 2.57 47
Carricito 58 0.82 2 1,297 0.82 34 1,355 0.82 36
Total Mulatos 9,036 1.38 401 72,090 1.11 2,571 81,126 1.14 2,972
El Chanate 765 0.66 16 1,563 0.95 48 2,327 0.86 64
Lynn Lake 15,010 1.99 960 25,293 2.05 1,669 40,303 2.03 2,629
Esperanza 19,226 1.01 622 15,126 0.95 462 34,352 0.98 1,083
Orion - - - 554 3.66 65 554 3.66 65
Ağı Dağı 2,008 0.67 44 88,044 0.58 1,651 90,052 0.59 1,695
Kirazli 837 1.13 31 31,897 0.71 727 32,734 0.72 758
Çamyurt 513 1.00 17 17,208 0.89 492 17,721 0.89 509
Total Turkey 3,358 0.84 91 137,149 0.65 2,871 140,507 0.66 2,961
Quartz Mountain 214 0.95 7 11,942 0.87 333 12,156 0.87 339
Alamos - Total 52,353 1.54 2,588 268,665 0.98 8,477 321,018 1.07 11,066
MEASURED AND INDICATED SILVER MINERAL RESOURCES (AS AT DECEMBER 31, 2015)
MEASURED RESOURCES INDICATED RESOURCES TOTAL MEASURED AND INDICATED
TONNES GRADE OUNCES TONNES GRADE OUNCES TONNES GRADE OUNCES
(000'S) (G/T AG) (000'S) (000'S) (G/T AG) (000'S) (000'S) (G/T AG) (000'S)
Esperanza 19,226 7.25 4,482 15,126 9.16 4,455 34,352 8.09 8,936
Orion - - - 554 309 5,503 554 309 5,503
Ağı Dağı 2,008 4.87 314 88,044 4.07 11,535 90,052 4.09 11,849
Kirazli 837 12.79 344 31,897 8.64 8,857 32,734 8.74 9,202
Çamyurt 513 5.63 93 17,208 6.15 3,404 17,721 6.14 3,496
Alamos - Total 22,584 7.21 5,233 152,829 6.87 33,754 175,413 6.91 38,987
40
2015 Total Inferred Mineral Resources
INFERRED GOLD MINERAL RESOURCES (AS AT DECEMBER 31, 2015)
TONNES GRADE OUNCES
(000'S) (G/T AU) (000'S)
Young-Davidson - Surface 31 0.99 1
Young-Davidson - Underground 3,523 2.76 312
Total Young-Davidson 3,554 2.74 313
Mulatos 7,078 0.90 205
San Carlos UG 162 4.93 26
La Yaqui 5,524 1.68 298
Cerro Pelon 109 1.23 4
Carricito 900 0.74 22
Total Mulatos 13,773 1.25 555
El Chanate 101 0.36 1
Lynn Lake 50,704 1.28 2,089
Esperanza 718 0.80 18
Orion 91 3.33 10
Ağı Dağı 16,760 0.46 245
Kirazli 5,689 0.59 108
Çamyurt 2,791 0.95 85
Total Turkey 25,240 0.54 438
Quartz Mountain 39,205 0.91 1,147
Alamos - Total 133,386 1.07 4,572
INFERRED SILVER MINERAL RESOURCES (as at DECEMBER 31, 2015)
TONNES GRADE OUNCES
(000'S) (G/T AG) (000'S)
Esperanza 718 15.04 347
Orion 91 95.00 275
Ağı Dağı 16,760 2.85 1,534
Kirazli 5,689 8.96 1,638
Çamyurt 2,791 5.77 518
Alamos - Total 26,049 5.15 4,312
41
Notes to Mineral Reserve and Resource Estimates
Notes to Mineral Reserve and Resource Tables:
• The Company’s mineral reserves and mineral resource as at December 31, 2015 are classified in accordance with the Canadian Institute of Mining Metallurgy and Petroleum’s “CIM Standards on Mineral
Resources and Reserves, Definition and Guidelines” as per Canadian Securities Administrator’s NI 43-101 requirements. La Yaqui mineral resources are as at September 1, 2016.
• Mineral resources are not mineral reserves and do not have demonstrated economic viability.
• Mineral resources are exclusive of mineral reserves.
• Mineral reserve cut-off grade for the Mulatos Mine, the Cerro Pelon Pit and the La Yaqui Pit are determined as a net of process value of $0.10 per tonne for each model block
• All Measured, indicated and inferred mineral resources are pit constrained with the exception of the Mulatos Main Pits on the Mulatos property which have no economic restrictions and are tabulated at a
gold cut-off grade of 0.5 grams per tonne.
• Mineral Reserve estimates assumed a gold price of $1,250 per ounce and Mineral Resource estimates assumed a gold price of $1,400 per ounce, except as follows: Orion assumed a gold price of $850 per
ounce and a silver price of $13.00 per ounce for resources. Lynn Lake assumed a gold price of $1,550 per ounce with an assumption of the Canadian dollar at parity with the United States dollar. Metal
prices, cutoff grades and metallurgical recoveries are set out in the table below.
• El Chanate mineral reserve ounces include a December 31, 2015 inventory of 98,000 recoverable ounces contained within the heap leach pad.
• Lynn Lake mineral resources represent 100% of the Lynn Lake Project. Alamos completed the acquisition of Carlisle Goldfields Limited (Lynn Lake Project) on January 7th, 2016.
• Orion Mineral Resources are reflected on a 50% basis. Following the completion of a joint venture agreement, Minera Frisco, S.A.B. de C.V. has a 50% interest in the Orion project.
Qualified Persons:
Chris Bostwick, FAusIMM, Alamos Gold’s Vice President, Technical Services, has reviewed and approved the scientific and technical information contained in this presentation. Chris Bostwick is a Qualified
Person within the meaning of Canadian Securities Administrator’s National Instrument 43-101 (“NI 43-101”). The independent Qualified Person’s for the National Instrument 43-101 compliant mineral
reserve and resource estimates are detailed in the following table.
Mineral Resources
Jeffrey Volk, CPG, FAusIMM Director - Reserves and Resource, Alamos Gold Inc. Young-Davidson, El Chanate, San Carlos U/G, Lynn Lake, Orion
Marc Jutras, P.Eng Principal, Ginto Consulting Inc.
Mulatos Pits, Cerro Pelon, La Yaqui, Carricito, Esperanza, Ağı Dağı,
Kirazli, Çamyurt, Quartz Mountain
Mineral Reserves
Chris Bostwick, FAusIMM VP Technical Services, Alamos Gold Inc. Young-Davidson, El Chanate, San Carlos Underground
Herb Welhener, SME-QP VP, Independent Mining Consultants Inc. Mulatos Pits, Cerro Pelon, La Yaqui
RESOURCES RESERVES
GOLD PRICE CUTOFF GOLD PRICE CUTOFF MET RECOVERY
Mulatos:
Mulatos Main Open Pit $1,400 0.5 $1,250 see notes >50%
San Carlos Underground $1,400 2.5 $1,250 3.27 70%
Cerro Pelon $1,400 0.3 $1,250 see notes 75%
La Yaqui $1,400 0.3 $1,250 see notes 50-85%
Carricito $1,400 0.3 n/a n/a >50%
Young-Davidson - Surface $1,400 0.5 $1,250 0.5 91%
Young-Davidson - Underground $1,400 1.3 $1,250 1.9 91%
El Chanate $1,400 0.15 $1,250 0.15 30-65%
Lynn Lake $1,555 0.4 n/a n/a 89-92%
Esperanza $1,400 0.4 n/a n/a 60-72%
Orion $850 2.0 n/a n/a 92%
Ağı Dağı $1,400 0.2 n/a n/a 80%
Kirazli $1,400 0.2 n/a n/a 81%
Çamyurt $1,400 0.2 n/a n/a 78%
Quartz Mountain $1,400 0.21 Oxide, 0.6 Sulfide n/a n/a 65-80%
42
Scott K. Parsons, CFA
VP, Investor Relations
416.368.9932 x 5439
sparsons@alamosgold.com

More Related Content

What's hot

20.1 falco presentation may 2017
20.1 falco presentation   may 201720.1 falco presentation   may 2017
20.1 falco presentation may 2017
FalcoCorporate
 
10 11-2016 q3 webcast presentation
10 11-2016 q3 webcast presentation10 11-2016 q3 webcast presentation
10 11-2016 q3 webcast presentation
richmontminesinc2016
 
First Quarter 2016 Financial Results - May 12, 2016
First Quarter 2016 Financial Results - May 12, 2016First Quarter 2016 Financial Results - May 12, 2016
First Quarter 2016 Financial Results - May 12, 2016
Adnet Communications
 
Newmarket Gold Investor Presentation July 2016
Newmarket Gold Investor Presentation July 2016Newmarket Gold Investor Presentation July 2016
Newmarket Gold Investor Presentation July 2016
Newmarket Gold Inc.
 
04.13 20.2016 european marketing
04.13 20.2016 european marketing04.13 20.2016 european marketing
04.13 20.2016 european marketing
RichmontIR
 
KGI Marketing – US and Montreal
KGI Marketing – US and MontrealKGI Marketing – US and Montreal
KGI Marketing – US and Montreal
kirklandlakegoldinc
 
Claude Resources Inc. Corporate Presentation - January 2016
Claude Resources Inc. Corporate Presentation - January 2016Claude Resources Inc. Corporate Presentation - January 2016
Claude Resources Inc. Corporate Presentation - January 2016
Claude Resources Inc.
 
Third Quarter 2015 Financial Results
Third Quarter 2015 Financial ResultsThird Quarter 2015 Financial Results
Third Quarter 2015 Financial Results
RichmontIR
 
Island Gold Mine Technical Session Presentation
Island Gold Mine Technical Session PresentationIsland Gold Mine Technical Session Presentation
Island Gold Mine Technical Session Presentation
richmontminesinc2016
 
03 03-16 red cloud pre-pdac showcase
03 03-16 red cloud pre-pdac showcase03 03-16 red cloud pre-pdac showcase
03 03-16 red cloud pre-pdac showcase
Adnet Communications
 
20 kgi corp presentation-2016 agm-13jun16
20 kgi corp presentation-2016 agm-13jun1620 kgi corp presentation-2016 agm-13jun16
20 kgi corp presentation-2016 agm-13jun16
kirklandlakegoldinc
 
Kirkland lake gold investor presentation jan23 cibc final
Kirkland lake gold investor presentation jan23 cibc finalKirkland lake gold investor presentation jan23 cibc final
Kirkland lake gold investor presentation jan23 cibc final
kirklandlakegoldinc
 
2.28.2016 bmo conference final
2.28.2016 bmo conference final2.28.2016 bmo conference final
2.28.2016 bmo conference final
Adnet Communications
 
Royal gold presentation egf - final screen
Royal gold presentation   egf - final screenRoyal gold presentation   egf - final screen
Royal gold presentation egf - final screen
RoyalGold
 
Richmont Mines London Marketing Presentation
Richmont Mines London Marketing PresentationRichmont Mines London Marketing Presentation
Richmont Mines London Marketing Presentation
RichmontIR
 
Q1 2017 Results
Q1 2017 ResultsQ1 2017 Results
Q1 2017 Results
GranColombiaGold
 
08 09-16 montreal-marketing
08 09-16 montreal-marketing08 09-16 montreal-marketing
08 09-16 montreal-marketing
RichmontIR
 
04 27-16-toronto-marketing
04 27-16-toronto-marketing04 27-16-toronto-marketing
04 27-16-toronto-marketing
RichmontIR
 

What's hot (18)

20.1 falco presentation may 2017
20.1 falco presentation   may 201720.1 falco presentation   may 2017
20.1 falco presentation may 2017
 
10 11-2016 q3 webcast presentation
10 11-2016 q3 webcast presentation10 11-2016 q3 webcast presentation
10 11-2016 q3 webcast presentation
 
First Quarter 2016 Financial Results - May 12, 2016
First Quarter 2016 Financial Results - May 12, 2016First Quarter 2016 Financial Results - May 12, 2016
First Quarter 2016 Financial Results - May 12, 2016
 
Newmarket Gold Investor Presentation July 2016
Newmarket Gold Investor Presentation July 2016Newmarket Gold Investor Presentation July 2016
Newmarket Gold Investor Presentation July 2016
 
04.13 20.2016 european marketing
04.13 20.2016 european marketing04.13 20.2016 european marketing
04.13 20.2016 european marketing
 
KGI Marketing – US and Montreal
KGI Marketing – US and MontrealKGI Marketing – US and Montreal
KGI Marketing – US and Montreal
 
Claude Resources Inc. Corporate Presentation - January 2016
Claude Resources Inc. Corporate Presentation - January 2016Claude Resources Inc. Corporate Presentation - January 2016
Claude Resources Inc. Corporate Presentation - January 2016
 
Third Quarter 2015 Financial Results
Third Quarter 2015 Financial ResultsThird Quarter 2015 Financial Results
Third Quarter 2015 Financial Results
 
Island Gold Mine Technical Session Presentation
Island Gold Mine Technical Session PresentationIsland Gold Mine Technical Session Presentation
Island Gold Mine Technical Session Presentation
 
03 03-16 red cloud pre-pdac showcase
03 03-16 red cloud pre-pdac showcase03 03-16 red cloud pre-pdac showcase
03 03-16 red cloud pre-pdac showcase
 
20 kgi corp presentation-2016 agm-13jun16
20 kgi corp presentation-2016 agm-13jun1620 kgi corp presentation-2016 agm-13jun16
20 kgi corp presentation-2016 agm-13jun16
 
Kirkland lake gold investor presentation jan23 cibc final
Kirkland lake gold investor presentation jan23 cibc finalKirkland lake gold investor presentation jan23 cibc final
Kirkland lake gold investor presentation jan23 cibc final
 
2.28.2016 bmo conference final
2.28.2016 bmo conference final2.28.2016 bmo conference final
2.28.2016 bmo conference final
 
Royal gold presentation egf - final screen
Royal gold presentation   egf - final screenRoyal gold presentation   egf - final screen
Royal gold presentation egf - final screen
 
Richmont Mines London Marketing Presentation
Richmont Mines London Marketing PresentationRichmont Mines London Marketing Presentation
Richmont Mines London Marketing Presentation
 
Q1 2017 Results
Q1 2017 ResultsQ1 2017 Results
Q1 2017 Results
 
08 09-16 montreal-marketing
08 09-16 montreal-marketing08 09-16 montreal-marketing
08 09-16 montreal-marketing
 
04 27-16-toronto-marketing
04 27-16-toronto-marketing04 27-16-toronto-marketing
04 27-16-toronto-marketing
 

Viewers also liked

Fourth Quarter 2016 and Full Year Results Presentation
Fourth Quarter 2016 and Full Year Results PresentationFourth Quarter 2016 and Full Year Results Presentation
Fourth Quarter 2016 and Full Year Results Presentation
yamanagold2016
 
Corporate presentation january 2017 v final
Corporate presentation   january 2017 v finalCorporate presentation   january 2017 v final
Corporate presentation january 2017 v final
newgold2011
 
Q4-2016 Results
Q4-2016 ResultsQ4-2016 Results
Q4-2016 Results
Agnico Eagle Mines
 
Island Gold Site Visit
Island Gold Site VisitIsland Gold Site Visit
Island Gold Site Visit
richmontminesinc2016
 
Full Year and Q4 2016 Earnings
Full Year and Q4 2016 EarningsFull Year and Q4 2016 Earnings
Full Year and Q4 2016 Earnings
Newmont Mining Corporation
 
Cibc whister jan 25 2017
Cibc whister jan 25 2017Cibc whister jan 25 2017
Cibc whister jan 25 2017
PretiumR
 
C.Beiser
C.BeiserC.Beiser
C.Beiser
Cliff Beiser
 
2015 cah-annl sharemtgpres-115_final
2015 cah-annl sharemtgpres-115_final2015 cah-annl sharemtgpres-115_final
2015 cah-annl sharemtgpres-115_final
Cardinal_Health
 
debresume2.docx
debresume2.docxdebresume2.docx
debresume2.docx
Debi Reid
 
2017 keynote (1)
2017 keynote (1)2017 keynote (1)
2017 keynote (1)
Ryan Loechner
 
Darlene Madrigal Resume 1 (1)
Darlene Madrigal Resume 1 (1)Darlene Madrigal Resume 1 (1)
Darlene Madrigal Resume 1 (1)
Darlene Burgoyne-Madrigal
 
Sun september investor presentation
Sun september investor presentationSun september investor presentation
Sun september investor presentation
SunocoLP
 
Q3 2016 irm supplemental report
Q3 2016 irm supplemental reportQ3 2016 irm supplemental report
Q3 2016 irm supplemental report
IronMInc
 
Presentation dgc 17-01_31 _ q4 ops 2017 guidance webcast
Presentation   dgc 17-01_31 _ q4 ops 2017 guidance webcastPresentation   dgc 17-01_31 _ q4 ops 2017 guidance webcast
Presentation dgc 17-01_31 _ q4 ops 2017 guidance webcast
DetourGold
 
Dec 5 corp presentation kl gold scotia conference final2
Dec 5 corp presentation kl gold scotia conference final2Dec 5 corp presentation kl gold scotia conference final2
Dec 5 corp presentation kl gold scotia conference final2
kirklandlakegoldinc
 
021617 q4 fy 2017 webcast
021617 q4 fy 2017 webcast021617 q4 fy 2017 webcast
021617 q4 fy 2017 webcast
KinrossGold
 
Dalradian Corporate Presentation February 2017
Dalradian Corporate Presentation February 2017Dalradian Corporate Presentation February 2017
Dalradian Corporate Presentation February 2017
DalradianResource
 
Apresentação Institucional - Set/2016
Apresentação Institucional - Set/2016Apresentação Institucional - Set/2016
Apresentação Institucional - Set/2016
HypermarcasRi
 

Viewers also liked (19)

Fourth Quarter 2016 and Full Year Results Presentation
Fourth Quarter 2016 and Full Year Results PresentationFourth Quarter 2016 and Full Year Results Presentation
Fourth Quarter 2016 and Full Year Results Presentation
 
Corporate presentation january 2017 v final
Corporate presentation   january 2017 v finalCorporate presentation   january 2017 v final
Corporate presentation january 2017 v final
 
Q4-2016 Results
Q4-2016 ResultsQ4-2016 Results
Q4-2016 Results
 
Island Gold Site Visit
Island Gold Site VisitIsland Gold Site Visit
Island Gold Site Visit
 
Full Year and Q4 2016 Earnings
Full Year and Q4 2016 EarningsFull Year and Q4 2016 Earnings
Full Year and Q4 2016 Earnings
 
Cibc whister jan 25 2017
Cibc whister jan 25 2017Cibc whister jan 25 2017
Cibc whister jan 25 2017
 
C.Beiser
C.BeiserC.Beiser
C.Beiser
 
2015 cah-annl sharemtgpres-115_final
2015 cah-annl sharemtgpres-115_final2015 cah-annl sharemtgpres-115_final
2015 cah-annl sharemtgpres-115_final
 
debresume2.docx
debresume2.docxdebresume2.docx
debresume2.docx
 
2017 keynote (1)
2017 keynote (1)2017 keynote (1)
2017 keynote (1)
 
DoHE Newsletter_July 2016
DoHE Newsletter_July 2016DoHE Newsletter_July 2016
DoHE Newsletter_July 2016
 
Darlene Madrigal Resume 1 (1)
Darlene Madrigal Resume 1 (1)Darlene Madrigal Resume 1 (1)
Darlene Madrigal Resume 1 (1)
 
Sun september investor presentation
Sun september investor presentationSun september investor presentation
Sun september investor presentation
 
Q3 2016 irm supplemental report
Q3 2016 irm supplemental reportQ3 2016 irm supplemental report
Q3 2016 irm supplemental report
 
Presentation dgc 17-01_31 _ q4 ops 2017 guidance webcast
Presentation   dgc 17-01_31 _ q4 ops 2017 guidance webcastPresentation   dgc 17-01_31 _ q4 ops 2017 guidance webcast
Presentation dgc 17-01_31 _ q4 ops 2017 guidance webcast
 
Dec 5 corp presentation kl gold scotia conference final2
Dec 5 corp presentation kl gold scotia conference final2Dec 5 corp presentation kl gold scotia conference final2
Dec 5 corp presentation kl gold scotia conference final2
 
021617 q4 fy 2017 webcast
021617 q4 fy 2017 webcast021617 q4 fy 2017 webcast
021617 q4 fy 2017 webcast
 
Dalradian Corporate Presentation February 2017
Dalradian Corporate Presentation February 2017Dalradian Corporate Presentation February 2017
Dalradian Corporate Presentation February 2017
 
Apresentação Institucional - Set/2016
Apresentação Institucional - Set/2016Apresentação Institucional - Set/2016
Apresentação Institucional - Set/2016
 

Similar to Alamos corp presentation jan 17 2017 final

Alamos Corp Presentation_May 11 2017_FINAL
Alamos Corp Presentation_May 11 2017_FINALAlamos Corp Presentation_May 11 2017_FINAL
Alamos Corp Presentation_May 11 2017_FINAL
alamosgoldinc
 
Alamos corp presentation june 12 2017 final
Alamos corp presentation june 12 2017 finalAlamos corp presentation june 12 2017 final
Alamos corp presentation june 12 2017 final
alamosgoldinc
 
Alamos corp presentation june 22 2017 final
Alamos corp presentation june 22 2017 finalAlamos corp presentation june 22 2017 final
Alamos corp presentation june 22 2017 final
alamosgoldinc
 
Alamos corp presentation april 1 2017
Alamos corp presentation april 1 2017Alamos corp presentation april 1 2017
Alamos corp presentation april 1 2017
alamosgoldinc
 
Alamos corp presentation March 2017
Alamos corp presentation March 2017Alamos corp presentation March 2017
Alamos corp presentation March 2017
alamosgoldinc
 
Alamos corp presentation feb 23 2017 final
Alamos corp presentation feb 23 2017 finalAlamos corp presentation feb 23 2017 final
Alamos corp presentation feb 23 2017 final
alamosgoldinc
 
Alamos corporate presentation sept 19 2016 final
Alamos corporate presentation sept 19 2016 finalAlamos corporate presentation sept 19 2016 final
Alamos corporate presentation sept 19 2016 final
alamosgoldinc
 
Alamos corporate presentation oct 11 2016 final
Alamos corporate presentation oct 11 2016 finalAlamos corporate presentation oct 11 2016 final
Alamos corporate presentation oct 11 2016 final
alamosgoldinc
 
Alamos corporate presentation oct 27 2016 final
Alamos corporate presentation oct 27 2016 finalAlamos corporate presentation oct 27 2016 final
Alamos corporate presentation oct 27 2016 final
alamosgoldinc
 
Alamos corporate presentation dec 2 2016 final
Alamos corporate presentation dec 2 2016 finalAlamos corporate presentation dec 2 2016 final
Alamos corporate presentation dec 2 2016 final
alamosgoldinc
 
Alamos corporate presentation august 12 2016
Alamos corporate presentation august 12 2016Alamos corporate presentation august 12 2016
Alamos corporate presentation august 12 2016
alamosgoldinc
 
Alamos corporate presentation july 22 2016 final
Alamos corporate presentation july 22 2016 finalAlamos corporate presentation july 22 2016 final
Alamos corporate presentation july 22 2016 final
alamosgoldinc
 
Alamos corporate presentation - September
Alamos corporate presentation - SeptemberAlamos corporate presentation - September
Alamos corporate presentation - September
alamosgoldinc
 
Alamos corporate presentation nov 10 2016
Alamos corporate presentation nov 10 2016Alamos corporate presentation nov 10 2016
Alamos corporate presentation nov 10 2016
alamosgoldinc
 
Alamos corporate presentation june 2 2016 final
Alamos corporate presentation june 2 2016 finalAlamos corporate presentation june 2 2016 final
Alamos corporate presentation june 2 2016 final
alamosgoldinc
 
Alamos corporate presentation june 9 2016 final
Alamos corporate presentation june 9 2016 finalAlamos corporate presentation june 9 2016 final
Alamos corporate presentation june 9 2016 final
alamosgoldinc
 
Alamos corporate presentation nov 21 2016 final
Alamos corporate presentation nov 21 2016 finalAlamos corporate presentation nov 21 2016 final
Alamos corporate presentation nov 21 2016 final
alamosgoldinc
 
Alamos corporate presentation may 18 2016 final
Alamos corporate presentation may 18 2016 finalAlamos corporate presentation may 18 2016 final
Alamos corporate presentation may 18 2016 final
alamosgoldinc
 
Alamos corporate presentation may 2016 final
Alamos corporate presentation may 2016 finalAlamos corporate presentation may 2016 final
Alamos corporate presentation may 2016 final
alamosgoldinc
 
Alamos corporate presentation may 2016 final
Alamos corporate presentation may 2016 finalAlamos corporate presentation may 2016 final
Alamos corporate presentation may 2016 final
alamosgoldinc
 

Similar to Alamos corp presentation jan 17 2017 final (20)

Alamos Corp Presentation_May 11 2017_FINAL
Alamos Corp Presentation_May 11 2017_FINALAlamos Corp Presentation_May 11 2017_FINAL
Alamos Corp Presentation_May 11 2017_FINAL
 
Alamos corp presentation june 12 2017 final
Alamos corp presentation june 12 2017 finalAlamos corp presentation june 12 2017 final
Alamos corp presentation june 12 2017 final
 
Alamos corp presentation june 22 2017 final
Alamos corp presentation june 22 2017 finalAlamos corp presentation june 22 2017 final
Alamos corp presentation june 22 2017 final
 
Alamos corp presentation april 1 2017
Alamos corp presentation april 1 2017Alamos corp presentation april 1 2017
Alamos corp presentation april 1 2017
 
Alamos corp presentation March 2017
Alamos corp presentation March 2017Alamos corp presentation March 2017
Alamos corp presentation March 2017
 
Alamos corp presentation feb 23 2017 final
Alamos corp presentation feb 23 2017 finalAlamos corp presentation feb 23 2017 final
Alamos corp presentation feb 23 2017 final
 
Alamos corporate presentation sept 19 2016 final
Alamos corporate presentation sept 19 2016 finalAlamos corporate presentation sept 19 2016 final
Alamos corporate presentation sept 19 2016 final
 
Alamos corporate presentation oct 11 2016 final
Alamos corporate presentation oct 11 2016 finalAlamos corporate presentation oct 11 2016 final
Alamos corporate presentation oct 11 2016 final
 
Alamos corporate presentation oct 27 2016 final
Alamos corporate presentation oct 27 2016 finalAlamos corporate presentation oct 27 2016 final
Alamos corporate presentation oct 27 2016 final
 
Alamos corporate presentation dec 2 2016 final
Alamos corporate presentation dec 2 2016 finalAlamos corporate presentation dec 2 2016 final
Alamos corporate presentation dec 2 2016 final
 
Alamos corporate presentation august 12 2016
Alamos corporate presentation august 12 2016Alamos corporate presentation august 12 2016
Alamos corporate presentation august 12 2016
 
Alamos corporate presentation july 22 2016 final
Alamos corporate presentation july 22 2016 finalAlamos corporate presentation july 22 2016 final
Alamos corporate presentation july 22 2016 final
 
Alamos corporate presentation - September
Alamos corporate presentation - SeptemberAlamos corporate presentation - September
Alamos corporate presentation - September
 
Alamos corporate presentation nov 10 2016
Alamos corporate presentation nov 10 2016Alamos corporate presentation nov 10 2016
Alamos corporate presentation nov 10 2016
 
Alamos corporate presentation june 2 2016 final
Alamos corporate presentation june 2 2016 finalAlamos corporate presentation june 2 2016 final
Alamos corporate presentation june 2 2016 final
 
Alamos corporate presentation june 9 2016 final
Alamos corporate presentation june 9 2016 finalAlamos corporate presentation june 9 2016 final
Alamos corporate presentation june 9 2016 final
 
Alamos corporate presentation nov 21 2016 final
Alamos corporate presentation nov 21 2016 finalAlamos corporate presentation nov 21 2016 final
Alamos corporate presentation nov 21 2016 final
 
Alamos corporate presentation may 18 2016 final
Alamos corporate presentation may 18 2016 finalAlamos corporate presentation may 18 2016 final
Alamos corporate presentation may 18 2016 final
 
Alamos corporate presentation may 2016 final
Alamos corporate presentation may 2016 finalAlamos corporate presentation may 2016 final
Alamos corporate presentation may 2016 final
 
Alamos corporate presentation may 2016 final
Alamos corporate presentation may 2016 finalAlamos corporate presentation may 2016 final
Alamos corporate presentation may 2016 final
 

More from alamosgoldinc

Alamos Gold Corporate Presentation August 2019
Alamos Gold Corporate Presentation August 2019Alamos Gold Corporate Presentation August 2019
Alamos Gold Corporate Presentation August 2019
alamosgoldinc
 
Alamos gold corporate presentation September 18 2018 final
Alamos gold corporate presentation   September 18 2018 finalAlamos gold corporate presentation   September 18 2018 final
Alamos gold corporate presentation September 18 2018 final
alamosgoldinc
 
Alamos gold corporate presentation september 06 2018 final
Alamos gold corporate presentation   september 06 2018 finalAlamos gold corporate presentation   september 06 2018 final
Alamos gold corporate presentation september 06 2018 final
alamosgoldinc
 
Alamos gold corporate presentation may 14 2018 final
Alamos gold corporate presentation   may 14 2018 finalAlamos gold corporate presentation   may 14 2018 final
Alamos gold corporate presentation may 14 2018 final
alamosgoldinc
 
Alamos gold corporate presentation may 1 2018 final
Alamos gold corporate presentation   may 1 2018 finalAlamos gold corporate presentation   may 1 2018 final
Alamos gold corporate presentation may 1 2018 final
alamosgoldinc
 
Alamos gold corporate presentation april 12 2018
Alamos gold corporate presentation   april 12 2018Alamos gold corporate presentation   april 12 2018
Alamos gold corporate presentation april 12 2018
alamosgoldinc
 
Alamos corp presentation mar 1 2018 final
Alamos corp presentation mar 1 2018 finalAlamos corp presentation mar 1 2018 final
Alamos corp presentation mar 1 2018 final
alamosgoldinc
 
Alamos corp presentation feb 22 2018 final
Alamos corp presentation feb 22 2018 finalAlamos corp presentation feb 22 2018 final
Alamos corp presentation feb 22 2018 final
alamosgoldinc
 
Alamos corp presentation jan 17 2018 final
Alamos corp presentation jan 17 2018 finalAlamos corp presentation jan 17 2018 final
Alamos corp presentation jan 17 2018 final
alamosgoldinc
 
Alamos corp presentation jan 11 2018 final
Alamos corp presentation jan 11 2018 finalAlamos corp presentation jan 11 2018 final
Alamos corp presentation jan 11 2018 final
alamosgoldinc
 
Alamos corp presentation dec 4 2017 final
Alamos corp presentation dec 4 2017  finalAlamos corp presentation dec 4 2017  final
Alamos corp presentation dec 4 2017 final
alamosgoldinc
 
Alamos corp presentation nov 3 2017 final (1)
Alamos corp presentation nov 3 2017 final (1)Alamos corp presentation nov 3 2017 final (1)
Alamos corp presentation nov 3 2017 final (1)
alamosgoldinc
 
Alamos corp presentation sept 22 2017 final web
Alamos corp presentation sept 22 2017 final webAlamos corp presentation sept 22 2017 final web
Alamos corp presentation sept 22 2017 final web
alamosgoldinc
 
Alamos acquisition of richmont presentation final
Alamos acquisition of richmont presentation finalAlamos acquisition of richmont presentation final
Alamos acquisition of richmont presentation final
alamosgoldinc
 

More from alamosgoldinc (14)

Alamos Gold Corporate Presentation August 2019
Alamos Gold Corporate Presentation August 2019Alamos Gold Corporate Presentation August 2019
Alamos Gold Corporate Presentation August 2019
 
Alamos gold corporate presentation September 18 2018 final
Alamos gold corporate presentation   September 18 2018 finalAlamos gold corporate presentation   September 18 2018 final
Alamos gold corporate presentation September 18 2018 final
 
Alamos gold corporate presentation september 06 2018 final
Alamos gold corporate presentation   september 06 2018 finalAlamos gold corporate presentation   september 06 2018 final
Alamos gold corporate presentation september 06 2018 final
 
Alamos gold corporate presentation may 14 2018 final
Alamos gold corporate presentation   may 14 2018 finalAlamos gold corporate presentation   may 14 2018 final
Alamos gold corporate presentation may 14 2018 final
 
Alamos gold corporate presentation may 1 2018 final
Alamos gold corporate presentation   may 1 2018 finalAlamos gold corporate presentation   may 1 2018 final
Alamos gold corporate presentation may 1 2018 final
 
Alamos gold corporate presentation april 12 2018
Alamos gold corporate presentation   april 12 2018Alamos gold corporate presentation   april 12 2018
Alamos gold corporate presentation april 12 2018
 
Alamos corp presentation mar 1 2018 final
Alamos corp presentation mar 1 2018 finalAlamos corp presentation mar 1 2018 final
Alamos corp presentation mar 1 2018 final
 
Alamos corp presentation feb 22 2018 final
Alamos corp presentation feb 22 2018 finalAlamos corp presentation feb 22 2018 final
Alamos corp presentation feb 22 2018 final
 
Alamos corp presentation jan 17 2018 final
Alamos corp presentation jan 17 2018 finalAlamos corp presentation jan 17 2018 final
Alamos corp presentation jan 17 2018 final
 
Alamos corp presentation jan 11 2018 final
Alamos corp presentation jan 11 2018 finalAlamos corp presentation jan 11 2018 final
Alamos corp presentation jan 11 2018 final
 
Alamos corp presentation dec 4 2017 final
Alamos corp presentation dec 4 2017  finalAlamos corp presentation dec 4 2017  final
Alamos corp presentation dec 4 2017 final
 
Alamos corp presentation nov 3 2017 final (1)
Alamos corp presentation nov 3 2017 final (1)Alamos corp presentation nov 3 2017 final (1)
Alamos corp presentation nov 3 2017 final (1)
 
Alamos corp presentation sept 22 2017 final web
Alamos corp presentation sept 22 2017 final webAlamos corp presentation sept 22 2017 final web
Alamos corp presentation sept 22 2017 final web
 
Alamos acquisition of richmont presentation final
Alamos acquisition of richmont presentation finalAlamos acquisition of richmont presentation final
Alamos acquisition of richmont presentation final
 

Recently uploaded

PPMB_Cove Fund 75_DIGITAL_2023_3-16 (3).pdf
PPMB_Cove Fund 75_DIGITAL_2023_3-16 (3).pdfPPMB_Cove Fund 75_DIGITAL_2023_3-16 (3).pdf
PPMB_Cove Fund 75_DIGITAL_2023_3-16 (3).pdf
kboyd6
 
一比一原版(Carleton毕业证)加拿大卡尔顿大学毕业证如何办理
一比一原版(Carleton毕业证)加拿大卡尔顿大学毕业证如何办理一比一原版(Carleton毕业证)加拿大卡尔顿大学毕业证如何办理
一比一原版(Carleton毕业证)加拿大卡尔顿大学毕业证如何办理
ybjk9iyd
 
一比一原版格罗宁根大学毕业证(RUG毕业证书)学历如何办理
一比一原版格罗宁根大学毕业证(RUG毕业证书)学历如何办理一比一原版格罗宁根大学毕业证(RUG毕业证书)学历如何办理
一比一原版格罗宁根大学毕业证(RUG毕业证书)学历如何办理
gyucof
 
Cadre Direct Access Fund II - Institutional Investor Teaser Q1 2024.pdf
Cadre Direct Access Fund II - Institutional Investor Teaser Q1 2024.pdfCadre Direct Access Fund II - Institutional Investor Teaser Q1 2024.pdf
Cadre Direct Access Fund II - Institutional Investor Teaser Q1 2024.pdf
kboyd6
 
Corporate Presentation Probe June 2024.pdf
Corporate Presentation Probe June 2024.pdfCorporate Presentation Probe June 2024.pdf
Corporate Presentation Probe June 2024.pdf
Probe Gold
 
UnityNet World Environment Day Abraham Project 2024 Press Release
UnityNet World Environment Day Abraham Project 2024 Press ReleaseUnityNet World Environment Day Abraham Project 2024 Press Release
UnityNet World Environment Day Abraham Project 2024 Press Release
LHelferty
 
Voyager Space_Management Presentation_Final
Voyager Space_Management Presentation_FinalVoyager Space_Management Presentation_Final
Voyager Space_Management Presentation_Final
kboyd6
 
一比一原版(UAL毕业证)伦敦艺术大学毕业证如何办理
一比一原版(UAL毕业证)伦敦艺术大学毕业证如何办理一比一原版(UAL毕业证)伦敦艺术大学毕业证如何办理
一比一原版(UAL毕业证)伦敦艺术大学毕业证如何办理
nupyb
 
Collective Mining | Corporate Presentation - June 2024
Collective Mining  | Corporate Presentation - June 2024Collective Mining  | Corporate Presentation - June 2024
Collective Mining | Corporate Presentation - June 2024
CollectiveMining1
 
Corporate Presentation Probe June 19, 2024.pdf
Corporate Presentation Probe June 19, 2024.pdfCorporate Presentation Probe June 19, 2024.pdf
Corporate Presentation Probe June 19, 2024.pdf
Probe Gold
 
Corporate Presentation Probe June 19, 2024.pdf
Corporate Presentation Probe June 19, 2024.pdfCorporate Presentation Probe June 19, 2024.pdf
Corporate Presentation Probe June 19, 2024.pdf
Probe Gold
 
Therus network compañía de Liderazgo y banca digital
Therus network  compañía de Liderazgo y banca digitalTherus network  compañía de Liderazgo y banca digital
Therus network compañía de Liderazgo y banca digital
Rafael Mauro Duarte Morel
 
REVA_IOI_Gain Fund-CASH_11-14-23_digital.pdf
REVA_IOI_Gain Fund-CASH_11-14-23_digital.pdfREVA_IOI_Gain Fund-CASH_11-14-23_digital.pdf
REVA_IOI_Gain Fund-CASH_11-14-23_digital.pdf
kboyd6
 
Solaris Resources - June 2024 - FINAL-Public.pdf
Solaris Resources - June 2024 - FINAL-Public.pdfSolaris Resources - June 2024 - FINAL-Public.pdf
Solaris Resources - June 2024 - FINAL-Public.pdf
JacquelineWagenaar1
 
Cove Multifamily Income Fund 28 LLC IOI 3.3.2021 (1).pdf
Cove Multifamily Income Fund 28 LLC IOI 3.3.2021 (1).pdfCove Multifamily Income Fund 28 LLC IOI 3.3.2021 (1).pdf
Cove Multifamily Income Fund 28 LLC IOI 3.3.2021 (1).pdf
kboyd6
 
Protecting Privacy in CDR Analysis: Best Practices from Experts
Protecting Privacy in CDR Analysis: Best Practices from ExpertsProtecting Privacy in CDR Analysis: Best Practices from Experts
Protecting Privacy in CDR Analysis: Best Practices from Experts
Milind Agarwal
 
Osisko Gold Royalties Ltd - Corporate Presentation, June 12, 2024
Osisko Gold Royalties Ltd - Corporate Presentation, June 12, 2024Osisko Gold Royalties Ltd - Corporate Presentation, June 12, 2024
Osisko Gold Royalties Ltd - Corporate Presentation, June 12, 2024
Osisko Gold Royalties Ltd
 
YieldStreet-Alternative-Income-Fund-Annual-Report-12-31-2023.pdf
YieldStreet-Alternative-Income-Fund-Annual-Report-12-31-2023.pdfYieldStreet-Alternative-Income-Fund-Annual-Report-12-31-2023.pdf
YieldStreet-Alternative-Income-Fund-Annual-Report-12-31-2023.pdf
kboyd6
 
一比一原版(uvic毕业证书)加拿大维多利亚大学毕业证如何办理
一比一原版(uvic毕业证书)加拿大维多利亚大学毕业证如何办理一比一原版(uvic毕业证书)加拿大维多利亚大学毕业证如何办理
一比一原版(uvic毕业证书)加拿大维多利亚大学毕业证如何办理
ufomhev
 

Recently uploaded (19)

PPMB_Cove Fund 75_DIGITAL_2023_3-16 (3).pdf
PPMB_Cove Fund 75_DIGITAL_2023_3-16 (3).pdfPPMB_Cove Fund 75_DIGITAL_2023_3-16 (3).pdf
PPMB_Cove Fund 75_DIGITAL_2023_3-16 (3).pdf
 
一比一原版(Carleton毕业证)加拿大卡尔顿大学毕业证如何办理
一比一原版(Carleton毕业证)加拿大卡尔顿大学毕业证如何办理一比一原版(Carleton毕业证)加拿大卡尔顿大学毕业证如何办理
一比一原版(Carleton毕业证)加拿大卡尔顿大学毕业证如何办理
 
一比一原版格罗宁根大学毕业证(RUG毕业证书)学历如何办理
一比一原版格罗宁根大学毕业证(RUG毕业证书)学历如何办理一比一原版格罗宁根大学毕业证(RUG毕业证书)学历如何办理
一比一原版格罗宁根大学毕业证(RUG毕业证书)学历如何办理
 
Cadre Direct Access Fund II - Institutional Investor Teaser Q1 2024.pdf
Cadre Direct Access Fund II - Institutional Investor Teaser Q1 2024.pdfCadre Direct Access Fund II - Institutional Investor Teaser Q1 2024.pdf
Cadre Direct Access Fund II - Institutional Investor Teaser Q1 2024.pdf
 
Corporate Presentation Probe June 2024.pdf
Corporate Presentation Probe June 2024.pdfCorporate Presentation Probe June 2024.pdf
Corporate Presentation Probe June 2024.pdf
 
UnityNet World Environment Day Abraham Project 2024 Press Release
UnityNet World Environment Day Abraham Project 2024 Press ReleaseUnityNet World Environment Day Abraham Project 2024 Press Release
UnityNet World Environment Day Abraham Project 2024 Press Release
 
Voyager Space_Management Presentation_Final
Voyager Space_Management Presentation_FinalVoyager Space_Management Presentation_Final
Voyager Space_Management Presentation_Final
 
一比一原版(UAL毕业证)伦敦艺术大学毕业证如何办理
一比一原版(UAL毕业证)伦敦艺术大学毕业证如何办理一比一原版(UAL毕业证)伦敦艺术大学毕业证如何办理
一比一原版(UAL毕业证)伦敦艺术大学毕业证如何办理
 
Collective Mining | Corporate Presentation - June 2024
Collective Mining  | Corporate Presentation - June 2024Collective Mining  | Corporate Presentation - June 2024
Collective Mining | Corporate Presentation - June 2024
 
Corporate Presentation Probe June 19, 2024.pdf
Corporate Presentation Probe June 19, 2024.pdfCorporate Presentation Probe June 19, 2024.pdf
Corporate Presentation Probe June 19, 2024.pdf
 
Corporate Presentation Probe June 19, 2024.pdf
Corporate Presentation Probe June 19, 2024.pdfCorporate Presentation Probe June 19, 2024.pdf
Corporate Presentation Probe June 19, 2024.pdf
 
Therus network compañía de Liderazgo y banca digital
Therus network  compañía de Liderazgo y banca digitalTherus network  compañía de Liderazgo y banca digital
Therus network compañía de Liderazgo y banca digital
 
REVA_IOI_Gain Fund-CASH_11-14-23_digital.pdf
REVA_IOI_Gain Fund-CASH_11-14-23_digital.pdfREVA_IOI_Gain Fund-CASH_11-14-23_digital.pdf
REVA_IOI_Gain Fund-CASH_11-14-23_digital.pdf
 
Solaris Resources - June 2024 - FINAL-Public.pdf
Solaris Resources - June 2024 - FINAL-Public.pdfSolaris Resources - June 2024 - FINAL-Public.pdf
Solaris Resources - June 2024 - FINAL-Public.pdf
 
Cove Multifamily Income Fund 28 LLC IOI 3.3.2021 (1).pdf
Cove Multifamily Income Fund 28 LLC IOI 3.3.2021 (1).pdfCove Multifamily Income Fund 28 LLC IOI 3.3.2021 (1).pdf
Cove Multifamily Income Fund 28 LLC IOI 3.3.2021 (1).pdf
 
Protecting Privacy in CDR Analysis: Best Practices from Experts
Protecting Privacy in CDR Analysis: Best Practices from ExpertsProtecting Privacy in CDR Analysis: Best Practices from Experts
Protecting Privacy in CDR Analysis: Best Practices from Experts
 
Osisko Gold Royalties Ltd - Corporate Presentation, June 12, 2024
Osisko Gold Royalties Ltd - Corporate Presentation, June 12, 2024Osisko Gold Royalties Ltd - Corporate Presentation, June 12, 2024
Osisko Gold Royalties Ltd - Corporate Presentation, June 12, 2024
 
YieldStreet-Alternative-Income-Fund-Annual-Report-12-31-2023.pdf
YieldStreet-Alternative-Income-Fund-Annual-Report-12-31-2023.pdfYieldStreet-Alternative-Income-Fund-Annual-Report-12-31-2023.pdf
YieldStreet-Alternative-Income-Fund-Annual-Report-12-31-2023.pdf
 
一比一原版(uvic毕业证书)加拿大维多利亚大学毕业证如何办理
一比一原版(uvic毕业证书)加拿大维多利亚大学毕业证如何办理一比一原版(uvic毕业证书)加拿大维多利亚大学毕业证如何办理
一比一原版(uvic毕业证书)加拿大维多利亚大学毕业证如何办理
 

Alamos corp presentation jan 17 2017 final

  • 1. January 2017 Corporate Presentation
  • 2. 2 Cautionary Notes No stock exchange, securities commission or other regulatory authority has approved or disapproved the information contained herein. Certain statements in this presentation are “forward-looking statements”, including within the meaning of the United States Securities Exchange Act of 1934, as amended. All statements other than statements of historical fact included in this presentation, including without limitation statements regarding forecast gold production, gold grades, recoveries, waste-to-ore ratios, total cash costs, potential mineralization and reserves, exploration results, and future plans and objectives of Alamos, are forward-looking statements based on forecasts of future operational or financial results, estimates of amounts not yet determinable and assumptions of management that involve various risks and uncertainties. Any statements that express or involve discussions with respect to predictions, expectations, beliefs, plans, projections, objectives, assumptions or future events or performance (often, but not always, using words or phrases such as “expects” or “does not expect”, “is expected”, “anticipates” or “does not anticipate”, “plans”, “estimates” or “intends”, or stating that certain actions, events or results “may”, “could”, “would”, “might” or “will” be taken, occur or be achieved) are not statements of historical fact and may be “forward-looking statements.” Alamos cautions that forward-looking information involves known and unknown risks, uncertainties and other factors that may cause Alamos' actual results, performance or achievements to be materially different from those expressed or implied by such information, including, but not limited to, gold and silver price volatility; fluctuations in foreign exchange rates and interest rates; the impact of any hedging activities; discrepancies between actual and estimated production, between actual and estimated reserves and resources or between actual and estimated metallurgical recoveries; costs of production; capital expenditure requirements; the costs and timing of construction and development of new deposits; and the success of exploration and permitting activities. In addition, the factors described or referred to in the section entitled “Risk Factors” in both Alamos Gold Inc.’s Annual Information Form for the year ended December 31, 2015 along with subsequent public filings available on the SEDAR website at www.sedar.com, should be reviewed in conjunction with the information found in this presentation. Although Alamos has attempted to identify important factors that could cause actual results, performance or achievements to differ materially from those contained in forward-looking information, there can be other factors that cause results, performance or achievements not to be as anticipated, estimated or intended. There can be no assurance that such information will prove to be accurate or that management’s expectations or estimates of future developments, circumstances or results will materialize. Accordingly, readers should not place undue reliance on forward-looking information. Note to U.S. Investors Alamos prepares its disclosure in accordance with the requirements of securities laws in effect in Canada, which differ from the requirements of U.S. securities laws. Terms relating to mineral resources in this presentation are defined in accordance with National Instrument 43-101 – Standards of Disclosure for Mineral Projects under the guidelines set out in the Canadian Institute of Mining, Metallurgy, and Petroleum Standards on Mineral Resources and Mineral Reserves. The United States Securities and Exchange Commission (the “SEC”) permits mining companies, in their filings with the SEC, to disclose only those mineral deposits that a company can economically and legally extract or produce. Alamos may use certain terms, such as “measured mineral resources”, “indicated mineral resources”, “inferred mineral resources” and “probable mineral reserves” that the SEC does not recognize (these terms may be used in this presentation and are included in the public filings of Alamos, which have been filed with the SEC and the securities commissions or similar authorities in Canada). Cautionary non-GAAP Measures and Additional GAAP Measures Note that for purposes of this section, GAAP refers to IFRS. The Company believes that investors use certain non-GAAP and additional GAAP measures as indicators to assess gold mining companies. They are intended to provide additional information and should not be considered in isolation or as a substitute for measures of performance prepared with GAAP. “Cash flow from operating activities before changes in non-cash working capital” is a non-GAAP performance measure that could provide an indication of the Company’s ability to generate cash flows from operations, and is calculated by adding back the change in non-cash working capital to “Cash provided by (used in) operating activities” as presented on the Company’s consolidated statements of cash flows. “Free cash flow” is a non-GAAP performance measure that is calculated as cash flows from operations net of cash flows invested in mineral property, plant and equipment and exploration and evaluation assets as presented on the Company’s consolidated statements of cash flows and that would provide an indication of the Company’s ability to generate cash flows from its mineral projects. “Mine site free cash flow” is a non-GAAP measure which includes cash flow from operating activities at, less capital expenditures at each mine site. Return on Equity is defined as Earnings from Continuing Operations divided by the average Total Equity for the current and previous year. “Mining cost per tonne of ore” and “Cost per tonne of ore” are non-GAAP performance measures that could provide an indication of the mining and processing efficiency and effectiveness of the mine. These measures are calculated by dividing the relevant mining and processing costs and total costs by the tonnes of ore processed in the period. “Cost per tonne of ore” is usually affected by operating efficiencies and waste-to-ore ratios in the period. “Total cash costs per ounce”, “all-in sustaining costs per ounce”, and “mine-site all-in sustaining costs” as used in this analysis are non-GAAP terms typically used by gold mining companies to assess the level of gross margin available to the Company by subtracting these costs from the unit price realized during the period. These non-GAAP terms are also used to assess the ability of a mining company to generate cash flow from operations. There may be some variation in the method of computation of these metrics as determined by the Company compared with other mining companies. In this context, “total cash costs” reflects mining and processing costs allocated from in-process and dore inventory associated and associated royalties with ounces of gold sold in the period. Total cash costs per ounce are exclusive of exploration costs. “All-in sustaining costs per ounce” include total cash costs, exploration, corporate and administrative, share based compensation and sustaining capital costs. “Mine-site all-in sustaining costs” include total cash costs, exploration, and sustaining capital costs for the mine-site, but exclude an allocation of corporate and administrative and share based compensation. Additional GAAP measures that are presented on the face of the Company’s consolidated statements of comprehensive income and are not meant to be a substitute for other subtotals or totals presented in accordance with IFRS, but rather should be evaluated in conjunction with such IFRS measures. This includes “Earnings from operations”, which is intended to provide an indication of the Company’s operating performance, and represents the amount of earnings before net finance income/expense, foreign exchange gain/loss, other income/loss, and income tax expense. Non-GAAP and additional GAAP measures do not have a standardized meaning prescribed under IFRS and therefore may not be comparable to similar measures presented by other companies. A reconciliation of historical non-GAAP and additional GAAP measures are available at www.alamosgold.com. Technical Information Except as otherwise noted herein, Chris Bostwick, FAusIMM, Alamos Gold’s Vice President, Technical Services, has reviewed and approved the scientific and technical information contained in this presentation. Chris Bostwick is a Qualified Person within the meaning of Canadian Securities Administrator’s National Instrument 43-101. For more information, please refer to the Alamos Gold Inc. 2015 Annual Information Form and the technical reports referenced therein and in this presentation, available on SEDAR (www.sedar.com). All figures in US$ unless otherwise indicated. Cautionary Notes
  • 3. 3 1 Based on 2017 Guidance 2 Please refer to Cautionary Notes on non-GAAP Measures and Additional GAAP Measures. 3 As of September 30, 2016 Strong Platform for Delivering Long Term Value Diversified gold production 400,000 – 430,000 oz from three North American mines1 Expanding margins $940/oz AISC, an expected 6% decrease from 20161,2 Peer leading growth Portfolio of 6 low-cost development projects Strong balance sheet $287m cash and available-for-sale securities3 to support growth Track record of delivering shareholder value
  • 4. 4 2014A 2015A 2016A 2017E Gold Production (000 oz) Toronto Head Office Diversified North American Gold Production Based on 2017 Guidance. See press release dated January 6, 2017. 1 Please refer to Cautionary Notes on non-GAAP Measures and Additional GAAP Measures. 2 For the purposes of calculating mine-site all-in sustaining costs, the Company does not include an allocation of corporate and administrative and share based compensation expenses. Growing, diversified production 380 392 400 – 430 +6% MULATOS 2017E Au Production 150-160k oz 2017E Au Total Cash Costs1 US$815/oz 2017E Au Mine-site AISC1,2 US$890/oz EL CHANATE 2017E Au Production 50-60k oz 2017E Au Total Cash Costs1 US$1,200/oz 2017E Au Mine-site AISC1,2 US$1,200/oz YOUNG-DAVIDSON 2017E Au Production 200-210k oz 2017E Au Total Cash Costs1 US$625/oz 2017E Au Mine-site AISC1,2 US$775/oz 365
  • 5. 5 $57 $229 $310 2015A 2016A 2017E $1,091 ~$1,000 $940 2015A 2016A 2017E $1,241 $1,091 $1,065 2015A 2016E 2017E Expanding Margins & Site Free Cash Flow 1 Cost of sales includes mining and processing costs, royalties and amortization. 2 Please refer to Cautionary Notes on non-GAAP Measures and Additional GAAP Measures. 3 Total consolidated all-in sustaining costs include corporate and administrative and share based compensation expenses. 4 AISC Margin calculated as realized gold price less AISC. For 2017E this assumes a $1,250/oz gold price AISC2,3 (US$/oz) -6% Cost of Sales1 (US$/oz) +35% Declining costs & stronger gold price driving significant margin expansion AISC Margin2,3,4 (US$/oz)
  • 6. 6 Leading development pipelineGrowth at existing operations ESPERANZA Production 79% Development 21% Peer Leading Low-Cost Growth Profile Controlled, disciplined, multi-stage growth Advanced exploration AĞI DAĞI KIRAZLI ÇAMYURT Consensus NPV by Geography1 Consensus NPV by Stage1 Canada 64% Mexico 24% Turkey 12% QUARTZ MOUNTAIN LYNN LAKE MULATOS DISTRICT Producing Assets Development/Exploration Assets YOUNG-DAVIDSON RAMP-UP MULATOS: LA YAQUI & CERRO PELON 1 Consensus analyst estimates Please refer to Cautionary Notes on non-GAAP Measures and Additional GAAP Measures.
  • 7. 7 Strong Balance Sheet 1 Unaudited management estimate as of September 30, 2016. 2 Cash, cash equivalents & available for sale securities. 3 As of January 16, 2017. No debt maturities until 2020 Balance Sheet Cash & Cash Eq.1,2 US$287 million Working Capital1 US$368 million Total Debt1 US$315 million Capital Structure Shares Outstanding 267.0 million Warrants 11.8 million Employee Options 9.6 million Fully Diluted 290.0 million Recent Share Price (TSX)3 C$10.92 Market Capitalization ~C$2.9 billion $287 m $315 m Cash Total Debt As of September 30, 2016 2
  • 8. 8 960% 15% 241% -50% 450% 950% 1450% 1950% 2003 2004 2005 2006 2007 2008 2009 2010 2011 2012 2013 2014 2015 2016 Alamos Gold Inc. (TSX:AGI) - Share Price S&P/TSX Global Gold Index Gold (US$/oz) Track Record of Delivering Shareholder Value 18% Annualized return since 2003 MULATOS: BLUEPRINT FOR SUCCESS LEADING GROWTH PROFILE WITH DISCIPLINED M&A STRATEGY ROE AMONG BEST IN INDUSTRY 11% Alamos five year average ROE prior to merger4 $10m cost to acquire Mulatos in 2003 $350m free cash flow1 generated to date $70m initial capital raised to build Mulatos 6 development projects $170m total combined acquisition cost 10.7m combined M&I and Inferred resources2,3 1 Please refer to Cautionary Notes on non-GAAP Measures and Additional GAAP Measures. 2 Includes Measured and Indicated resources of 7.0m oz Au (227 mt at 0.96 g/t Au) and Inferred resources of 3.7m oz Au (116 mt at 0.99 g/t Au). 3 See mineral reserve and resource estimates and associated footnotes in appendix. 4 Alamos adopted AuRico Gold’s financials with the completion of the merger of the two companies in July 2015. Prior to the merger, Alamos’ five year average return on equity ending 2014 was 10.7%.
  • 9. 9 2016E 2016A 2016E Q3 YTD 2016 2016 Scorecard – Production, Costs & Capital on Track 1 Please refer to Cautionary Notes on non-GAAP Measures and Additional GAAP Measures. 2 Total consolidated all-in sustaining costs include corporate and administrative and share based compensation expenses. 3 Cost of sales includes mining and processing costs, royalties and amortization. 4 See mineral reserve and resource estimates and associated footnotes in appendix and press release dated September 12, 2016 “Alamos Reports Significant Interim Increase in Mineral Resources at La Yaqui” 8% decrease in 2016 AISC1 with a further 6% decline expected in 2017 Production (oz Au) Capital Spending (US$m) AISC1,2 (US$/oz) $22m Q3 YTD 2016 site free cash flow1 – significant growth expected in 2017 392,000 oz Met 2016 production guidance Cost of Sales3 (US$/oz) $1,091 $1,093 2016E Q3 YTD 2016 370,000 – 400,000 oz 392,000 oz $109m $138m – $158m  $975 ~$1,000 2016E 2016A
  • 10. 10 2016 Scorecard – Growth Projects Permitting milestones La Yaqui Phase I EIA & Kirazlı Forestry Permits granted 80 89 89 149 232 298 0 100 200 300 400 500 600 2014 2015 August 2016 Auoz(000) Inferred Mineral Resources Indicated Mineral Resources Proven & Probable Mineral Reserves 1 Surfacing value Exploration success 570% increase in combined mineral reserves & resources at La Yaqui since 20141 +570% 1 Includes Proven & Probable reserves of 89,000 oz (1.9 mt at 1.45 g/t Au), Measured and Indicated resources of 149,000 oz (4.1 mt at 1.14 g/t Au) and Inferred resources of 298,000 oz (5.5 mt at 1.68 g/t Au). For more information, see press releases dated September 12, 2016 “Alamos Reports Significant Interim Increase in Mineral Resources at La Yaqui” and March 24, 2016 “Alamos Reports Mineral Reserves and Resources for the Year-Ended 2015” and September 21, 2015 “Alamos Announces Discovery of New Zones of Mineralization at Cerro Pelon and La Yaqui”. See mineral reserve and resource estimates and associated footnotes in appendix. La Yaqui Grande La Yaqui Phase I
  • 11. 11 2015A 2016A 2017E $1,241 $1,091 $1,065 2015A 2016E 2017E 2015A 2016E 2017E $1,091 ~$1,000 $940 2015A 2016A 2017E 2017 Guidance – Growing Production, Declining Costs Gold Production (000 oz) AISC1,2 (US$/oz) -6% Total Capital Spending (US$m) $138-158m4 $140-157m Cost of Sales3 (US$/oz) 1 Please refer to Cautionary Notes on non-GAAP Measures and Additional GAAP Measures. 2 Total consolidated all-in sustaining costs include corporate and administrative and share based compensation expenses. 3 Cost of sales includes mining and processing costs, royalties and amortization. 4 Total capital spending for Alamos has been included for the periods prior to July 2, 2015 for comparative purposes only. 392 400 – 430 +6% 380 $190m
  • 12. 12 Young-Davidson – Flagship, Long-Life Production Location: Ontario, Canada Ownership: 100% interest Stage: Producing Operation: Underground • One of Canada’s largest underground gold mines • 15 year mine life based on year end 2015 reserves • Large resource base and exploration potential to support mine life extension Gold Reserves & Resources4 Tonnes (000) Grade (g/t) oz Au (000) P&P Underground Reserves 44,290 2.69 3,837 M&I Underground Resources 7,955 3.45 883 Inferred Underground Resources 3,523 2.76 312 $20m reduction in capital expected in 2017 95% of costs are in Canadian Dollars – C$ gold price near historical highs 1 Cost of sales includes mining and processing costs, royalties and amortization. 2 Please refer to Cautionary Notes on non-GAAP Measures and Additional GAAP Measures. 3 Excludes Net Realizable Value (“NRV”) inventory adjustments. See associated MD&A for a full reconciliation. 4 See mineral reserve and resource estimates and associated footnotes in appendix. 2015A Q4/16A 2016A 2016E 2017E Gold Production (k oz) 160.4 44.7 170.0 170-180 200-210 Cost of Sales1 (US$/oz) $1,162 - - $1,034 $1,050 Total Cash Costs2,3 (US$/oz) $683 - - $600 $625 Mine-site AISC2,3 (US$/oz) $986 - - $825 $775 Total Capital (US$m) $108 - - $85-95 $70-80
  • 13. 13 Growing production; declining costs; declining capital intensity >6,600 tpd average underground mining rate in Q4 2016 Young-Davidson – Ramp up of Underground Mining Owner development transition completed in April 2016 MCM shaft completed commissioning Q1 2016 >7,000 tpd achieved 2016 year-end underground mining rate target Please refer to Cautionary Notes on non-GAAP Measures and Additional GAAP Measures. 0 1,000 2,000 3,000 4,000 5,000 6,000 7,000 8,000 Q1/13 Q2/13 Q3/13 Q4/13 Q1/14 Q2/14 Q3/14 Q4/14 Q1/15 Q2/15 Q3/15 Q4/15 Q1/16 Q2/16 Q3/16 Q4/16 Mill TPD Underground TPD
  • 14. 14 Mulatos – Our Founding Operation Location: Sonora State, Mexico Ownership: 100% interest Stage: Producing Operation: Open pit, heap leach & high grade mill • Mine life of 6 years based on YE 2015 reserves • Generated ~$350m in free cash flow2 to date • Large exploration package (28,773 ha) Gold Reserves & Resources4 Tonnes (000) Grade (g/t) oz Au (000) P&P Reserves 44,713 1.07 1,543 M&I Resources 81,126 1.14 2,972 Inferred Resources 13,773 1.25 555 $909/oz Q3 YTD 2016 AISC2, down 13% from 2015 levels 154k oz 2016 production – exceeding full year guidance 1 Cost of sales includes mining and processing costs, royalties and amortization. 2 Please refer to Cautionary Notes on non-GAAP Measures and Additional GAAP Measures. 3 Capital spending guidance for 2016 and 2017 excludes capitalized exploration. 4 See mineral reserve and resource estimates and associated footnotes in appendix. 2015A Q4/16A 2016A 2016E 2017E Gold Production (k oz) 140.3 44.9 154.0 140-150 150-160 Cost of Sales1 (US$/oz) $1,116 - - $1,097 $1,015 Total Cash Costs2 (US$/oz) $869 - - $850 $815 Mine-site AISC2 (US$/oz) $1,047 - - $925 $890 Total Capital3 (US$m) $45 - - $25-35 $33-40
  • 15. 15 $1,047 $925 $890 2015A 2016E 2017E 220 259 259 47 196 236 302 0 100 200 300 400 500 600 700 800 2014 2015 August 2016 000ozAu Inferred Mineral Resources Measured & Indicated Mineral Resources Proven & Probable Mineral Reserves Mulatos – Declining Cost Profile Focused cost reductions 2017 AISC expected to decrease ~$160/oz from 2015 Higher mill production Transition to concentrate production generating higher recoveries Declining cost profile Low cost production from La Yaqui & Cerro Pelon; 5% royalty nearing completion Ongoing exploration success Improved land access & renewed focus – 2017 Mulatos exploration budget of $17m Declining Costs 1 Please refer to Cautionary Notes on non-GAAP Measures and Additional GAAP Measures. 2 For the purposes of calculating mine-site all-in sustaining costs, the Company does not include an allocation of corporate and administrative and share based compensation expenses. 3 Cost of sales includes mining and processing costs, royalties and amortization. 4 For more information, see press releases dated September 12, 2016 “Alamos Reports Significant Interim Increase in Mineral Resources at La Yaqui” and March 24, 2016 “Alamos Reports Mineral Reserves and Resources for the Year-Ended 2015” 5 2016 reserves & resources Include 5.2 mt at 1.56 g/t for 259k oz in the Proven & Probable category, 4.6 mt at 1.32 g/t for 196k oz in the Measured & Indicated categories and 5.6 mt at 1.67 g/t for 302k oz in the Inferred category. La Yaqui & Cerro Pelon Reserve & Resource Growth4,5 +244% Mine-site AISC1,2 (US$/oz) Cost of Sales3 (US$/oz) -15% $1,116 $1,097 $1,015 2015A 2016E 2017E
  • 16. 16 La Yaqui & Cerro Pelon – Low Cost Production Growth 1 Please refer to Cautionary Notes on non-GAAP Measures and Additional GAAP Measures. 2 See mineral reserve and resource estimates and associated footnotes in appendix. Gold Reserves & Resources2 Tonnes (000) Grade (g/t) oz Au (000) La Yaqui 1,912 1.45 89 Cerro Pelon 3,253 1.63 170 Total P&P Reserves 5,165 1.56 259 La Yaqui 4,050 1.14 149 Cerro Pelon 572 2.57 47 Total M&I Resources 4,622 1.32 196 La Yaqui 5,524 1.68 298 Cerro Pelon 109 1.23 4 Total Inferred Resources 5,633 1.67 302 87% higher grade Combined reserve grade 1.56 g/t, 87% above 2017 budget Initial production H2-2017 Phase I development of La Yaqui on track ~$400/oz La Yaqui Phase I 2017 total cash costs1, 51% lower than 2017 Mulatos budget District potential Large underexplored land package; >70% of past drilling focused near Mulatos mine Mulatos District Mulatos mine
  • 17. 17 El Chanate – Consistent Gold Producer Location: Sonora State, Mexico Ownership: 100% interest Stage: Producing Operation: Open pit, heap leach • Positive free cash flow generation in 2015 • Significant free cash flow at end of mine life – low cost production through residual leaching 1 Cost of sales includes mining and processing costs, royalties and amortization. 2 Please refer to Cautionary Notes on non-GAAP Measures and Additional GAAP Measures. 3 Excludes Net Realizable Value (“NRV”) inventory adjustments. See associated MD&A for a full reconciliation. 4 See mineral reserve and resource estimates and associated footnotes in appendix. 5 ~75% of El Chanate’s 2017 expected production has been hedged through gold collars ensuring minimum gold price of $1,225/oz and participation up to $1,450/oz Gold Reserves & Resources4 Tonnes (000) Grade (g/t) oz Au (000) P&P Reserves – Open Pit 19,317 0.59 365 P&P Reserves – Leach Pad Inventory - - 98 M&I Resources 2,327 0.86 64 ~75% 2017 production hedged ensuring minimum gold price of $1,225/oz5 $5m Site free cash flow2 generated Q3 YTD 2016 2015A Q4/16A 2016A 2016E 2017E Gold Production (k oz) 79.3 16.1 68.0 60-70 50-60 Cost of Sales1 (US$/oz) $1,504 - - $1,231 $1,265 Total Cash Costs2,3 (US$/oz) $808 - - $1,100 $1,200 Mine-site AISC2,3 (US$/oz) $978 - - $1,100 $1,200 Total Capital (US$m) $14 - - $1 $2
  • 18. 18 Development: Lynn Lake Project – High Grade, Open Pit 1 For more information regarding the Lynn Lake District, please refer to the press release issued by Carlisle Goldfields dated February 27, 2014 titled Carlisle Announces Optimized PEA of the Farley and MacLellan deposits at Lynn Lake returns Post-Tax IRR of 26.3% at US$1,100 gold price available on SEDAR. 2 See mineral reserve and resource estimates and associated footnotes in appendix. 3 Please refer to Cautionary Notes on non-GAAP Measures and Additional GAAP Measures. Location: Manitoba, Canada Ownership: 100% interest Stage: Feasibility Operation: Open pit • Located in the highly-prospective Lynn Lake Mining District • One of the highest grade open pit deposits in Canada; significant exploration potential • Existing infrastructure in place, low power rates of C$0.027/kwh • Feasibility study expected in Q3 2017 Life of Mine Production Profile1 0 50 100 150 200 250 1 2 3 4 5 6 7 8 9 10 11 12 Gold(kozperyear) Life of Mine (years) Gold Reserves & Resources2 Tonnes (000) Grade (g/t) oz Au (000) M&I Resources 40,303 2.03 2,629 Inferred Resources 50,704 1.28 2,089
  • 19. 19 Development: Kirazlı, Ağı Dağı & Çamyurt 1 Please refer to press release dated June 28, 2012 on Turkey PFS and Çamyurt initial mineral resource estimate. 2 Please refer to Cautionary Notes on non-GAAP Measures and Additional GAAP Measures. 3 See mineral reserve and resource estimates and associated footnotes in appendix. 2012 Positive Pre-feasibility Study – Summary1 Kirazlı Ağı Dağı Mine Life Years 5 7 Average Annual Production oz Au 99,000 143,000 oz Ag 601,000 271,000 Average Throughput tpd 15,000 30,000 Average grade g/t Au 0.75 0.55 Total Cash Costs2 US$/oz $515 $611 Pre-production Capex US$m $146.1 $278.3 Total Capex US$m $165.7 $326.6 Location: Turkey Ownership: 100% interest Stage: Development Operation: Open pit, heap leach Kirazlı3 Tonnes Grade Contained Ounces (000) (g/t Au) (g/t Ag) (000 Au) (000 Ag) Measured & Indicated 32,734 0.72 8.74 758 9,202 Inferred 5,689 0.59 8.96 108 1,638 Ağı Dağı3 Measured & Indicated 90,052 0.59 4.09 1,695 11,849 Inferred 16,760 0.46 2.85 245 1,534 Çamyurt3 Measured & Indicated 17,721 0.89 6.14 509 3,496 Inferred 2,791 0.95 5.77 85 518 • Kirazlı Forestry Permits received Jan 2017 • Kirazlı & Ağı Dağı EIA’s approved • Kirazlı & Ağı Dağı feasibility studies & Çamyurt PEA nearing completion • New mining law supportive of industry
  • 20. 20 Development: Esperanza & Quartz Mountain 1 Please refer to Cautionary Notes on non-GAAP Measures and Additional GAAP Measures 2 Historic column recovery tests for gold at Quartz Mountain varied between 74% and 88% for the felsic rock hosted mineralization; see Orsa Ventures press release dated February 12, 2013 3 See mineral reserve and resource estimates and associated footnotes in appendix. 4 Additional C$3m due on completion of feasibility study & C$15m or 2% NSR upon successful permitting Location: Morelos State, Mexico Ownership: 100% interest Stage: Development Operation: Open pit, heap leach • Excellent infrastructure; low technical risk • Low capital intensity and operating costs • Average annual production potential > 100,000 oz • All-in sustaining costs expected to be lowest quartile1 Location: Oregon, United States Ownership: Right to earn a 100% interest4 Stage: Advanced Exploration • Located on northern extension of prolific Basin & Range Province of Nevada • Low strip ratio, favourable metallurgy2 • Acquisition cost $3.5m Tonnes Grade Contained Ounces (000) (g/t Au) (g/t Ag) (000 Au) (000 Ag) Measured & Indicated3 34,352 0.98 8.09 1,083 8,936 Inferred 718 0.80 15.04 18 347 Quartz Butte Crone Hill Tonnes Grade Contained Ounces (000) (g/t Au) (000 Au) Measured & Indicated3 12,156 0.87 339 Inferred 39,205 0.91 1,147 Project: Esperanza Project: Quartz Mountain
  • 21. 21 Alamos – Investment Case Diversified intermediate gold producer Low-cost growth profile Strong balance sheet to support growth Long term track record of delivering shareholder value Catalysts  Q3 2016: 93% increase in combined resources at La Yaqui  Q4 2016: La Yaqui EIA approved  Q4 2016: Met consolidated 2016 production guidance  Q4 2016: Achieved year-end target of 7,000 tpd from UG at YD  Q1 2017: Received Forestry Permits for Kirazlı project 2017: Kirazlı & Ağı Dağı feasibility studies & Çamyurt PEA Q3 2017: Lynn Lake feasibility study H2 2017: Initial production at La Yaqui
  • 23. 23 Board of Directors and Executive and Management Team Paul J. Murphy Chairman John A. McCluskey Director Mark J. Daniel Director Patrick D. Downey Director David Fleck Director David Gower Director Claire M. C. Kennedy Director Ronald E. Smith Director Kenneth Stowe Director John A. McCluskey President and Chief Executive Officer Jamie Porter Chief Financial Officer Peter MacPhail Chief Operating Officer Christine Barwell Vice President, Human Resources Chris Bostwick Vice President, Technical Services Luis Chavez Senior Vice President, Mexico Andrew Cormier Vice President, Development & Construction Nils Engelstad Vice President, General Counsel Greg Fisher Vice President, Finance Aoife McGrath Vice President, Exploration Scott Parsons Vice President, Investor Relations Colin Webster Vice President, Sustainability & External Affairs Board of Directors Executive and Management Team
  • 24. 24 Sustainability • Our Objectives • As we pursue further growth, we will continue to measure our success as an organization by our performance in achievement of our sustainability objectives: • Protecting the health and well-being of our employees • Creating shared value with our host communities and countries • Ensuring that our operations are net-positive for the environment • Over the years, Alamos has been recognized for its achievements in these areas: Clean Industry Certification from PROFEPA • Alamos was certified as an Industria Limpia (clean industry) in recognition of the excellence of environmental management at Mulatos CSR Award from Mexican Center for Philanthropy (CEMEFI) • Signifies exceptional record of CSR performance; • 2015 marked the 7th consecutive year for Alamos
  • 25. 25 1 Please refer to Cautionary Notes on non-GAAP Measures and Additional GAAP Measures. 2 Excludes capitalized exploration. 3 For the purposes of calculating mine-site all-in sustaining costs at individual mine sites, the Company does not include an allocation of corporate and administrative and share based compensation expenses to the mine sites. 4 Cost of sales includes mining and processing costs, royalties, and amortization expense 2017 Guidance 2017 Guidance 2016 Guidance Young-Davidson Mulatos El Chanate Total Total Gold production (000’s ounces) 200-210 150-160 50-60 400-430 392 (actual) Cost of Sales (in millions) (4) $215 $157 $70 $442 $420 Cost of Sales ($/oz)(4) $1,050 $1,015 $1,265 $1,065 $1,091 Total cash costs ($/oz)(1) $625 $815 $1,200 $765 $800 All-in sustaining costs ($/oz)(1) $940 $975 Mine-site all-in sustaining costs ($/oz) (1),(3) $775 $890 $1,200 - - Capital expenditures (in millions) Sustaining capital(1) $30-35 $8-10 $2 $40-47 $51-61 Growth capital(1) $40-45 $25-30 (2) - $65-75 $60-70 Total – Operating Mines(1) $70-80 $33-40 $2 $105-122 $111-131 Total – Development Projects $35 Total Consolidated Budget $140-157 $138-158 Corporate & Administrative (in millions) $16 $16
  • 26. 26 $287 ($315) -$2,250 -$1,750 -$1,250 -$750 -$250 $250 $750 Randgold Pan American Tahoe Centerra OceanaGold Alamos Detour B2Gold IAMGOLD Eldorado New Gold Kinross Yamana Cash Total Debt Strong Balance Sheet 1 Cash, cash equivalents & available for sale securities Source: Factset and company disclosure. Based on financial statements for the period ending September 30, 2016. Please refer to Cautionary Notes on non-GAAP Measures and Additional GAAP Measures. Well positioned in any gold price environment Cash1 / (Total Debt) (US$m) 1
  • 27. 27 Young-Davidson – Increasing Grade & Productivity 1 Cost of sales includes mining and processing costs, royalties and amortization. 2 Please refer to Cautionary Notes on non-GAAP Measures and Additional GAAP Measures. 3 Excludes Net Realizable Value (“NRV”) inventory adjustments. See associated MD&A for a full reconciliation. 4 Excludes hydro rebate not attributable to Q4/15 Underground ramp up driving production higher and unit costs lower Q1/13 Q2/13 Q3/13 Q4/13 Q1/14 Q2/14 Q3/14 Q4/14 Q1/15 Q2/15 Q3/15 Q4/15 Q1/16 Q2/16 Q3/16 Q4/16 Gold ounces produced 28,281 29,252 30,099 33,106 35,104 40,166 40,538 40,945 38,098 39,365 38,201 44,694 39,065 42,644 43,629 44,662 Cost of sales1 (US$/oz) Pre-commercial production $1,677 $1,625 $1,370 $1,211 $1,216 $1,298 $1,165 $986 $1,058 $1,182 $1,032 Total cash costs per oz. (2,3) $694 $716 $666 $850 $1,009 $871 $723 $719 $745 $697 $681 $617 $616 $738 $607 Mine-site AISC per oz.(2,3) $1,059 $1,254 $1,357 $1,270 $1,315 $1,144 $959 $912 $987 $1,008 $979 $980 $846 $965 $849 Underground mine Tonnes mined per day 1,130 1,611 1,417 2,590 2,611 3,595 3,753 4,140 4,130 5,149 5,081 5,911 5,776 6,123 5,467 6,600 Grades (g/t) 2.7 2.5 2.8 3.1 2.8 3.3 3.1 3.0 3.0 2.6 2.6 2.6 2.6 2.4 2.8 Development metres 1,941 2,445 2,620 2,986 3,772 3,545 3,269 3,438 3,409 3,789 3,619 3,769 3,490 3,168 2,677 Unit UG mining costs (US$) Pre-commercial production $46 $45 $41 $39 $39 $33 $32 $294 $31 $34 $34 Unit UG mining costs (CAD$) $51 $49 $45 $44 $48 $41 $41 $384 $42 $44 $45 Mill processing facility Tonnes processed per day 6,466 7,017 6,747 6,969 7,163 8,230 7,670 7,757 7,186 7,677 7,680 7,630 7,342 7,006 6,833 Grades (inc. OP stockpile) 1.8 1.7 1.7 2.0 1.8 2.2 1.9 2.0 2.0 2.0 1.9 2.2 2.1 2.1 2.4 Recoveries (%) 86% 85% 89% 88% 87% 88% 90% 88% 86% 88% 92% 91% 90% 92% 93% $0 $5 $10 $15 $20 $25 $30 $35 $40 $45 $50 1,500 2,500 3,500 4,500 5,500 6,500 Q1/14 Q2/14 Q3/14 Q4/14 Q1/15 Q2/15 Q3/15 Q4/15 Q1/16 Q2/16 Q3/16 Q4/16 UnitUGminingcosts(US$/t) UndergroundTPD Underground tonnes mined per day Unit UG mining costs (US$/t)
  • 28. 28 Young-Davidson – Development Schedule Please refer to Cautionary Notes on non-GAAP Measures and Additional GAAP Measures. Declining capital intensity 2016 2017 2018 2019  Commissioning of MCM shaft  Transition to 100% owner development  Ramp up to 7,000 tpd • Raise boring of lower NG shaft • Completion of MCM waste pass • Shaft bottom infrastructure • Northgate shaft hoisting from 8900L
  • 29. 29 Young-Davidson – Long Section MCM Wastepass East Wastepass Productivity improvements & declining costs Developing the underground to support ramp up of underground mining Milled grade higher Declining capital intensity Higher underground mining rates driving: Production growth
  • 31. 31 Mulatos – La Yaqui Project Area For more information, see press releases dated September 12, 2016 “Alamos Reports Significant Interim Increase in Mineral Resources at La Yaqui” and March 24, 2016 “Alamos Reports Mineral Reserves and Resources for the Year-Ended 2015” and September 21, 2015 “Alamos Announces Discovery of New Zones of Mineralization at Cerro Pelon and La Yaqui”.
  • 32. 32 Mulatos – La Yaqui Conceptual Cross Section Zone 1 For more information, see press releases dated September 12, 2016 “Alamos Reports Significant Interim Increase in Mineral Resources at La Yaqui” and March 24, 2016 “Alamos Reports Mineral Reserves and Resources for the Year- Ended 2015” and September 21, 2015 “Alamos Announces Discovery of New Zones of Mineralization at Cerro Pelon and La Yaqui”.
  • 33. 33 Mulatos – La Yaqui Conceptual Cross Section Zone 2 For more information, see press releases dated September 12, 2016 “Alamos Reports Significant Interim Increase in Mineral Resources at La Yaqui” and March 24, 2016 “Alamos Reports Mineral Reserves and Resources for the Year- Ended 2015” and September 21, 2015 “Alamos Announces Discovery of New Zones of Mineralization at Cerro Pelon and La Yaqui”.
  • 34. 34 Mulatos – Cerro Pelon Project Area RESULTS IN RESERVE CONES 15PEL056: 46m @ 1.13g/t Au (2 – 48m) 15PEL066: 27m @ 2.74g/t Au (34– 61m) 15PEL069: 20m @ 2.54g/t Au (52 - 72m) & 34m @ 6.67g/t Au (134 - 168m) 15PEL070: 44m @ 1.43g/t Au (11 – 55m) 15PEL073: 33m @ 3.20g/t Au (4 – 37m) RESULTS IN RESOURCE CONES 15PEL012: 50m @ 14.47g/t Au (157-207m) 15PEL020: 35m @ 9.65g/t Au (157 - 192m) 15PEL075: 9m @ 2.69g/t Au (121 - 130m) 15PEL077: 52m @ 1.35g/t Au (41 - 93 m) & 6m @ 1.47g/t Au (97 - 103 m) 15PEL085: 14m @ 10.63g/t Au (24 - 138m) 16PEL018: 47m @ 7.79g/t Au (88 – 135m) 16PEL021: 41m @ 0.92g/t Au (81 - 122m) See press release dated August 10, 2016 “Alamos Reports Second Quarter 2016 Results and Provides Exploration Update at Mulatos”.
  • 35. 35 Mulatos – Cerro Pelon Project Area Conceptual Long Section (Looking West) Highlight intercepts from the 2015 exploration program at Cerro Pelon, including several previously released results as indicated by * For more information, see press releases dated March 24, 2016 “Alamos Reports Mineral Reserves and Resources for the Year-Ended 2015” and September 21, 2015 “Alamos Announces Discovery of New Zones of Mineralization at Cerro Pelon and La Yaqui”.
  • 36. 36 Best In Class Portfolio of Assets MULATOS 2017E Au Production 150-160k oz 2017E Au Total Cash Costs US$815/oz 2P Au Reserves 1.5m oz (44.7mt @ 1.07 g/t) Total Au M&I Resources 3.0m oz (81.1mt @ 1.14 g/t) Total Au Inf. Resources 0.6m oz (13.8mt @ 1.25 g/t) EL CHANATE 2017E Au Production 50-60k oz 2017E Au Total Cash Costs US$1,200/oz 2P Au Reserves 0.5m oz (19.3mt @ 0.75 g/t) Total Au M&I Resources 0.1m oz (2.3mt @ 0.86 g/t) QUARTZ MOUNTAIN Stage Advanced Exploration Total Au M&I Resources 0.3m oz (12.2mt @ 0.87 g/t) Total Au Inf. Resources 1.1m oz (39.2mt @0.91 g/t) YOUNG-DAVIDSON 2017E Au Production 200-210k oz 2017E Au Total Cash Costs US$625/oz 2P Au Reserves 3.9m oz (45.7mt @ 2.64 g/t) Total Au M&I Resources 1.0m oz (9.7mt @ 3.05 g/t) Total Au Inf. Resources 0.3m oz (3.6mt @ 2.74g/t) AĞI DAĞI Stage Permitting Est. Annual Production 143k oz Est. Total Cash Costs US$611/oz Total Au M&I Resources 1.7m oz (90.1mt @ 0.59 g/t) Total Au Inf. Resources 0.2m oz (16.8mt @ 0.46 g/t) Producing Assets Exploration / Development Assets Toronto Head Office ESPERANZA Stage Permitting Est. Annual Production +100k oz Est. Total Cash Costs ~US$500/oz Total Au M&I Resources 1.1m oz (34.4mt @ 0.98 g/t) KIRAZLI Stage Permitting Est. Annual Production 99k oz Est. Total Cash Costs US$515/oz Total Au M&I Resources 0.8m oz (32.7mt @ 0.72 g/t) Total Au Inf. Resources 0.1m oz (5.7mt @ 0.59 g/t) ÇAMYURT Stage Resource Dev. Total Au M&I Resources 0.5m oz (17.7mt @ 0.89 g/t) Total Au Inf. Resources 0.1m oz (2.8mt @0.95 g/t) LYNN LAKE Stage Feasibility Est. Annual Production 145k oz Est. Total Cash Costs C$530/oz Total Au M&I Resources 2.6m oz (40.3mt @ 2.03 g/t) Total Au Inf. Resources 2.1m oz (50.7mt @ 1.28 g/t) Diversified production Low-cost growth Safe jurisdictions Consensus NPV by Geography1 Consensus NPV by Stage1 Production 79% Development 21% Canada 64% Mexico 24% Turkey 12% Please refer to Cautionary Notes on non-GAAP Measures and Additional GAAP Measures. Note: Mineral resources are exclusive of mineral reserves. See mineral reserve and resource estimates and associated footnotes in appendix. 1Consensus analyst estimates
  • 37. 37 Long Life Reserve Base Reserve Life Index (on Operating Assets)2 Gold Mineral Reserves & Resources1 1 See mineral reserve and resource estimates and associated footnotes in appendix. 2 Source: TD Securities. 2015 Y/E operating gold reserves/2017E gold production; adjusted for asset sales. 5.9 5.9 11.1 4.6 0 5 10 15 20 25 Mineral Reserves Mineral Reserves & Resources Auoz(millions) Inferred Mineral Resources M&I Mineral Resources P&P Mineral Reserves 26.1 19.2 14.5 13.8 11.6 10.7 10.4 10.3 9.7 9.5 8.2 6.8 4.4 0 5 10 15 20 25 30 DGC ELD NEM AGI GG ABX KGC AUY AEM IMG SMF NGD P Reservelifeindex(years)
  • 38. 38 2015 Proven and Probable Mineral Reserves PROVEN AND PROBABLE MINERAL RESERVES AS AT DECEMBER 31, 2015 PROVEN PROBABLE PROVEN + PROBABLE TONNES GRADE CONTAINED TONNES GRADE CONTAINED TONNES GRADE CONTAINED (000) (G/T AU) OUNCES (000) (000) (G/T AU) OUNCES (000) (000) (G/T AU) OUNCES (000) Young-Davidson Surface 1,396 0.82 37 - 0.00 - 1,396 0.82 37 Underground 14,282 2.73 1,255 30,008 2.68 2,582 44,290 2.69 3,837 Total Young-Davidson 15,678 2.56 1,292 30,008 2.68 2,582 45,686 2.64 3,874 Mulatos Mulatos Main Pits 5,248 0.98 165 27,654 0.85 756 32,902 0.87 921 San Carlos Underground 83 15.49 42 77 7.66 19 161 11.73 61 Stockpiles 6,485 1.45 302 - - - 6,485 1.45 302 La Yaqui 474 1.52 23 1,438 1.42 66 1,912 1.45 89 Cerro Pelon 960 1.70 53 2,293 1.59 117 3,253 1.63 170 Total Mulatos 13,251 1.37 585 31,462 0.95 958 44,713 1.07 1,543 El Chanate El Chanate Open Pit 11,480 0.55 204 7,837 0.64 161 19,317 0.59 365 El Chanate Leach Pad Inv. - - 98 - - - - - 98 Total El Chanate 11,480 0.82 302 7,837 0.64 161 19,317 0.75 463 Total Alamos 40,409 1.68 2,178 69,307 1.66 3,702 109,716 1.67 5,880
  • 39. 39 2015 Total Measured and Indicated Mineral Resources MEASURED AND INDICATED GOLD MINERAL RESOURCES (AS AT DECEMBER 31, 2015) MEASURED RESOURCES INDICATED RESOURCES TOTAL MEASURED AND INDICATED TONNES GRADE OUNCES TONNES GRADE OUNCES TONNES GRADE OUNCES (000'S) (G/T AU) (000'S) (000'S) (G/T AU) (000'S) (000'S) (G/T AU) (000'S) Young-Davidson – Surface 496 1.13 18 1,242 1.28 51 1,739 1.24 69 Young-Davidson – Underground 4,248 3.47 474 3,707 3.43 408 7,955 3.45 883 Total Young-Davidson 4,744 3.23 493 4,949 2.89 460 9,694 3.05 952 Mulatos 8,625 1.24 343 65,921 1.08 2,287 74,546 1.10 2,630 San Carlos UG 236 6.03 46 367 5.42 64 603 5.66 110 La Yaqui - - - 4,050 1.14 149 4,050 1.14 149 Cerro Pelon 117 2.75 10 455 2.52 37 572 2.57 47 Carricito 58 0.82 2 1,297 0.82 34 1,355 0.82 36 Total Mulatos 9,036 1.38 401 72,090 1.11 2,571 81,126 1.14 2,972 El Chanate 765 0.66 16 1,563 0.95 48 2,327 0.86 64 Lynn Lake 15,010 1.99 960 25,293 2.05 1,669 40,303 2.03 2,629 Esperanza 19,226 1.01 622 15,126 0.95 462 34,352 0.98 1,083 Orion - - - 554 3.66 65 554 3.66 65 Ağı Dağı 2,008 0.67 44 88,044 0.58 1,651 90,052 0.59 1,695 Kirazli 837 1.13 31 31,897 0.71 727 32,734 0.72 758 Çamyurt 513 1.00 17 17,208 0.89 492 17,721 0.89 509 Total Turkey 3,358 0.84 91 137,149 0.65 2,871 140,507 0.66 2,961 Quartz Mountain 214 0.95 7 11,942 0.87 333 12,156 0.87 339 Alamos - Total 52,353 1.54 2,588 268,665 0.98 8,477 321,018 1.07 11,066 MEASURED AND INDICATED SILVER MINERAL RESOURCES (AS AT DECEMBER 31, 2015) MEASURED RESOURCES INDICATED RESOURCES TOTAL MEASURED AND INDICATED TONNES GRADE OUNCES TONNES GRADE OUNCES TONNES GRADE OUNCES (000'S) (G/T AG) (000'S) (000'S) (G/T AG) (000'S) (000'S) (G/T AG) (000'S) Esperanza 19,226 7.25 4,482 15,126 9.16 4,455 34,352 8.09 8,936 Orion - - - 554 309 5,503 554 309 5,503 Ağı Dağı 2,008 4.87 314 88,044 4.07 11,535 90,052 4.09 11,849 Kirazli 837 12.79 344 31,897 8.64 8,857 32,734 8.74 9,202 Çamyurt 513 5.63 93 17,208 6.15 3,404 17,721 6.14 3,496 Alamos - Total 22,584 7.21 5,233 152,829 6.87 33,754 175,413 6.91 38,987
  • 40. 40 2015 Total Inferred Mineral Resources INFERRED GOLD MINERAL RESOURCES (AS AT DECEMBER 31, 2015) TONNES GRADE OUNCES (000'S) (G/T AU) (000'S) Young-Davidson - Surface 31 0.99 1 Young-Davidson - Underground 3,523 2.76 312 Total Young-Davidson 3,554 2.74 313 Mulatos 7,078 0.90 205 San Carlos UG 162 4.93 26 La Yaqui 5,524 1.68 298 Cerro Pelon 109 1.23 4 Carricito 900 0.74 22 Total Mulatos 13,773 1.25 555 El Chanate 101 0.36 1 Lynn Lake 50,704 1.28 2,089 Esperanza 718 0.80 18 Orion 91 3.33 10 Ağı Dağı 16,760 0.46 245 Kirazli 5,689 0.59 108 Çamyurt 2,791 0.95 85 Total Turkey 25,240 0.54 438 Quartz Mountain 39,205 0.91 1,147 Alamos - Total 133,386 1.07 4,572 INFERRED SILVER MINERAL RESOURCES (as at DECEMBER 31, 2015) TONNES GRADE OUNCES (000'S) (G/T AG) (000'S) Esperanza 718 15.04 347 Orion 91 95.00 275 Ağı Dağı 16,760 2.85 1,534 Kirazli 5,689 8.96 1,638 Çamyurt 2,791 5.77 518 Alamos - Total 26,049 5.15 4,312
  • 41. 41 Notes to Mineral Reserve and Resource Estimates Notes to Mineral Reserve and Resource Tables: • The Company’s mineral reserves and mineral resource as at December 31, 2015 are classified in accordance with the Canadian Institute of Mining Metallurgy and Petroleum’s “CIM Standards on Mineral Resources and Reserves, Definition and Guidelines” as per Canadian Securities Administrator’s NI 43-101 requirements. La Yaqui mineral resources are as at September 1, 2016. • Mineral resources are not mineral reserves and do not have demonstrated economic viability. • Mineral resources are exclusive of mineral reserves. • Mineral reserve cut-off grade for the Mulatos Mine, the Cerro Pelon Pit and the La Yaqui Pit are determined as a net of process value of $0.10 per tonne for each model block • All Measured, indicated and inferred mineral resources are pit constrained with the exception of the Mulatos Main Pits on the Mulatos property which have no economic restrictions and are tabulated at a gold cut-off grade of 0.5 grams per tonne. • Mineral Reserve estimates assumed a gold price of $1,250 per ounce and Mineral Resource estimates assumed a gold price of $1,400 per ounce, except as follows: Orion assumed a gold price of $850 per ounce and a silver price of $13.00 per ounce for resources. Lynn Lake assumed a gold price of $1,550 per ounce with an assumption of the Canadian dollar at parity with the United States dollar. Metal prices, cutoff grades and metallurgical recoveries are set out in the table below. • El Chanate mineral reserve ounces include a December 31, 2015 inventory of 98,000 recoverable ounces contained within the heap leach pad. • Lynn Lake mineral resources represent 100% of the Lynn Lake Project. Alamos completed the acquisition of Carlisle Goldfields Limited (Lynn Lake Project) on January 7th, 2016. • Orion Mineral Resources are reflected on a 50% basis. Following the completion of a joint venture agreement, Minera Frisco, S.A.B. de C.V. has a 50% interest in the Orion project. Qualified Persons: Chris Bostwick, FAusIMM, Alamos Gold’s Vice President, Technical Services, has reviewed and approved the scientific and technical information contained in this presentation. Chris Bostwick is a Qualified Person within the meaning of Canadian Securities Administrator’s National Instrument 43-101 (“NI 43-101”). The independent Qualified Person’s for the National Instrument 43-101 compliant mineral reserve and resource estimates are detailed in the following table. Mineral Resources Jeffrey Volk, CPG, FAusIMM Director - Reserves and Resource, Alamos Gold Inc. Young-Davidson, El Chanate, San Carlos U/G, Lynn Lake, Orion Marc Jutras, P.Eng Principal, Ginto Consulting Inc. Mulatos Pits, Cerro Pelon, La Yaqui, Carricito, Esperanza, Ağı Dağı, Kirazli, Çamyurt, Quartz Mountain Mineral Reserves Chris Bostwick, FAusIMM VP Technical Services, Alamos Gold Inc. Young-Davidson, El Chanate, San Carlos Underground Herb Welhener, SME-QP VP, Independent Mining Consultants Inc. Mulatos Pits, Cerro Pelon, La Yaqui RESOURCES RESERVES GOLD PRICE CUTOFF GOLD PRICE CUTOFF MET RECOVERY Mulatos: Mulatos Main Open Pit $1,400 0.5 $1,250 see notes >50% San Carlos Underground $1,400 2.5 $1,250 3.27 70% Cerro Pelon $1,400 0.3 $1,250 see notes 75% La Yaqui $1,400 0.3 $1,250 see notes 50-85% Carricito $1,400 0.3 n/a n/a >50% Young-Davidson - Surface $1,400 0.5 $1,250 0.5 91% Young-Davidson - Underground $1,400 1.3 $1,250 1.9 91% El Chanate $1,400 0.15 $1,250 0.15 30-65% Lynn Lake $1,555 0.4 n/a n/a 89-92% Esperanza $1,400 0.4 n/a n/a 60-72% Orion $850 2.0 n/a n/a 92% Ağı Dağı $1,400 0.2 n/a n/a 80% Kirazli $1,400 0.2 n/a n/a 81% Çamyurt $1,400 0.2 n/a n/a 78% Quartz Mountain $1,400 0.21 Oxide, 0.6 Sulfide n/a n/a 65-80%
  • 42. 42 Scott K. Parsons, CFA VP, Investor Relations 416.368.9932 x 5439 sparsons@alamosgold.com