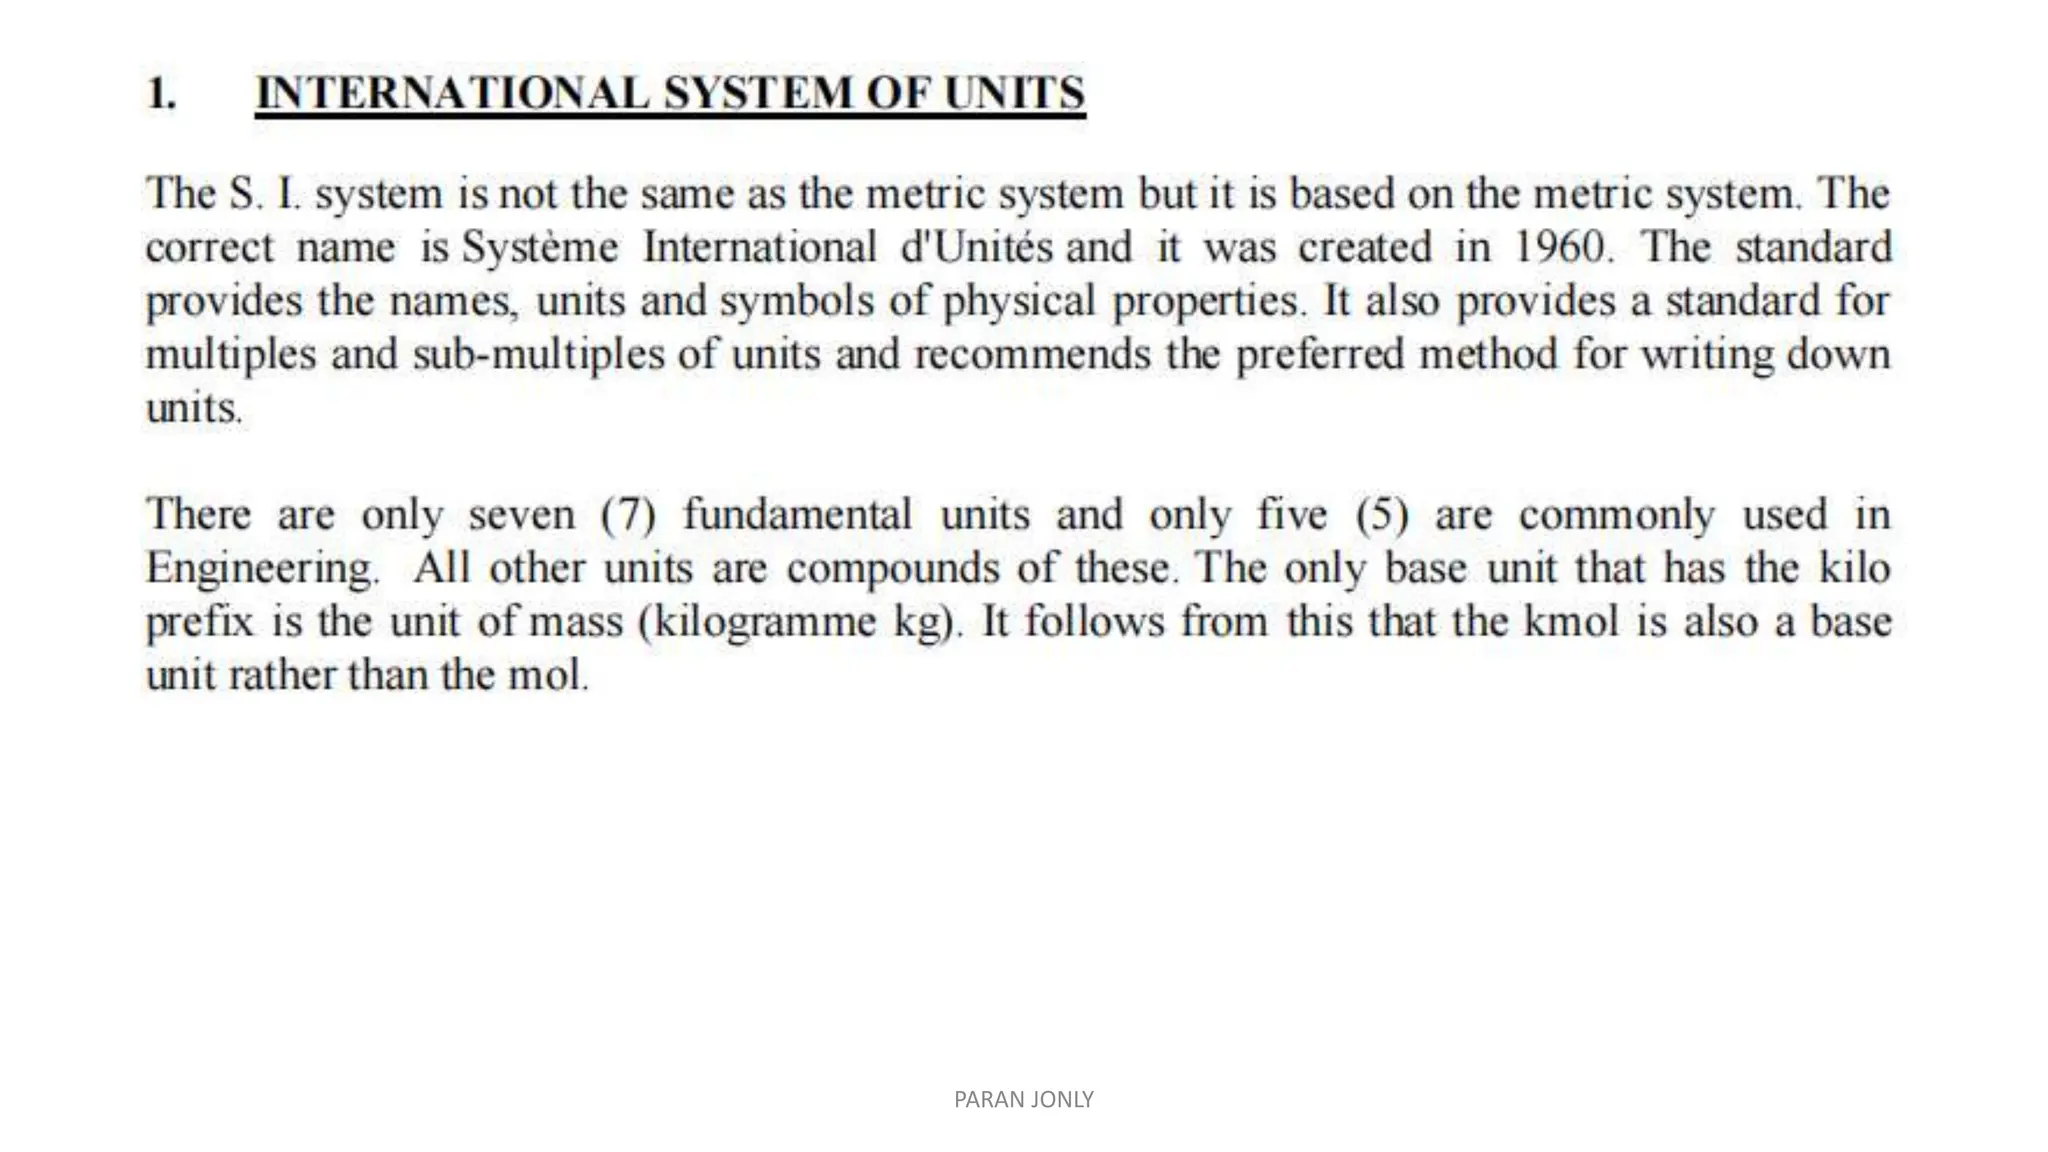
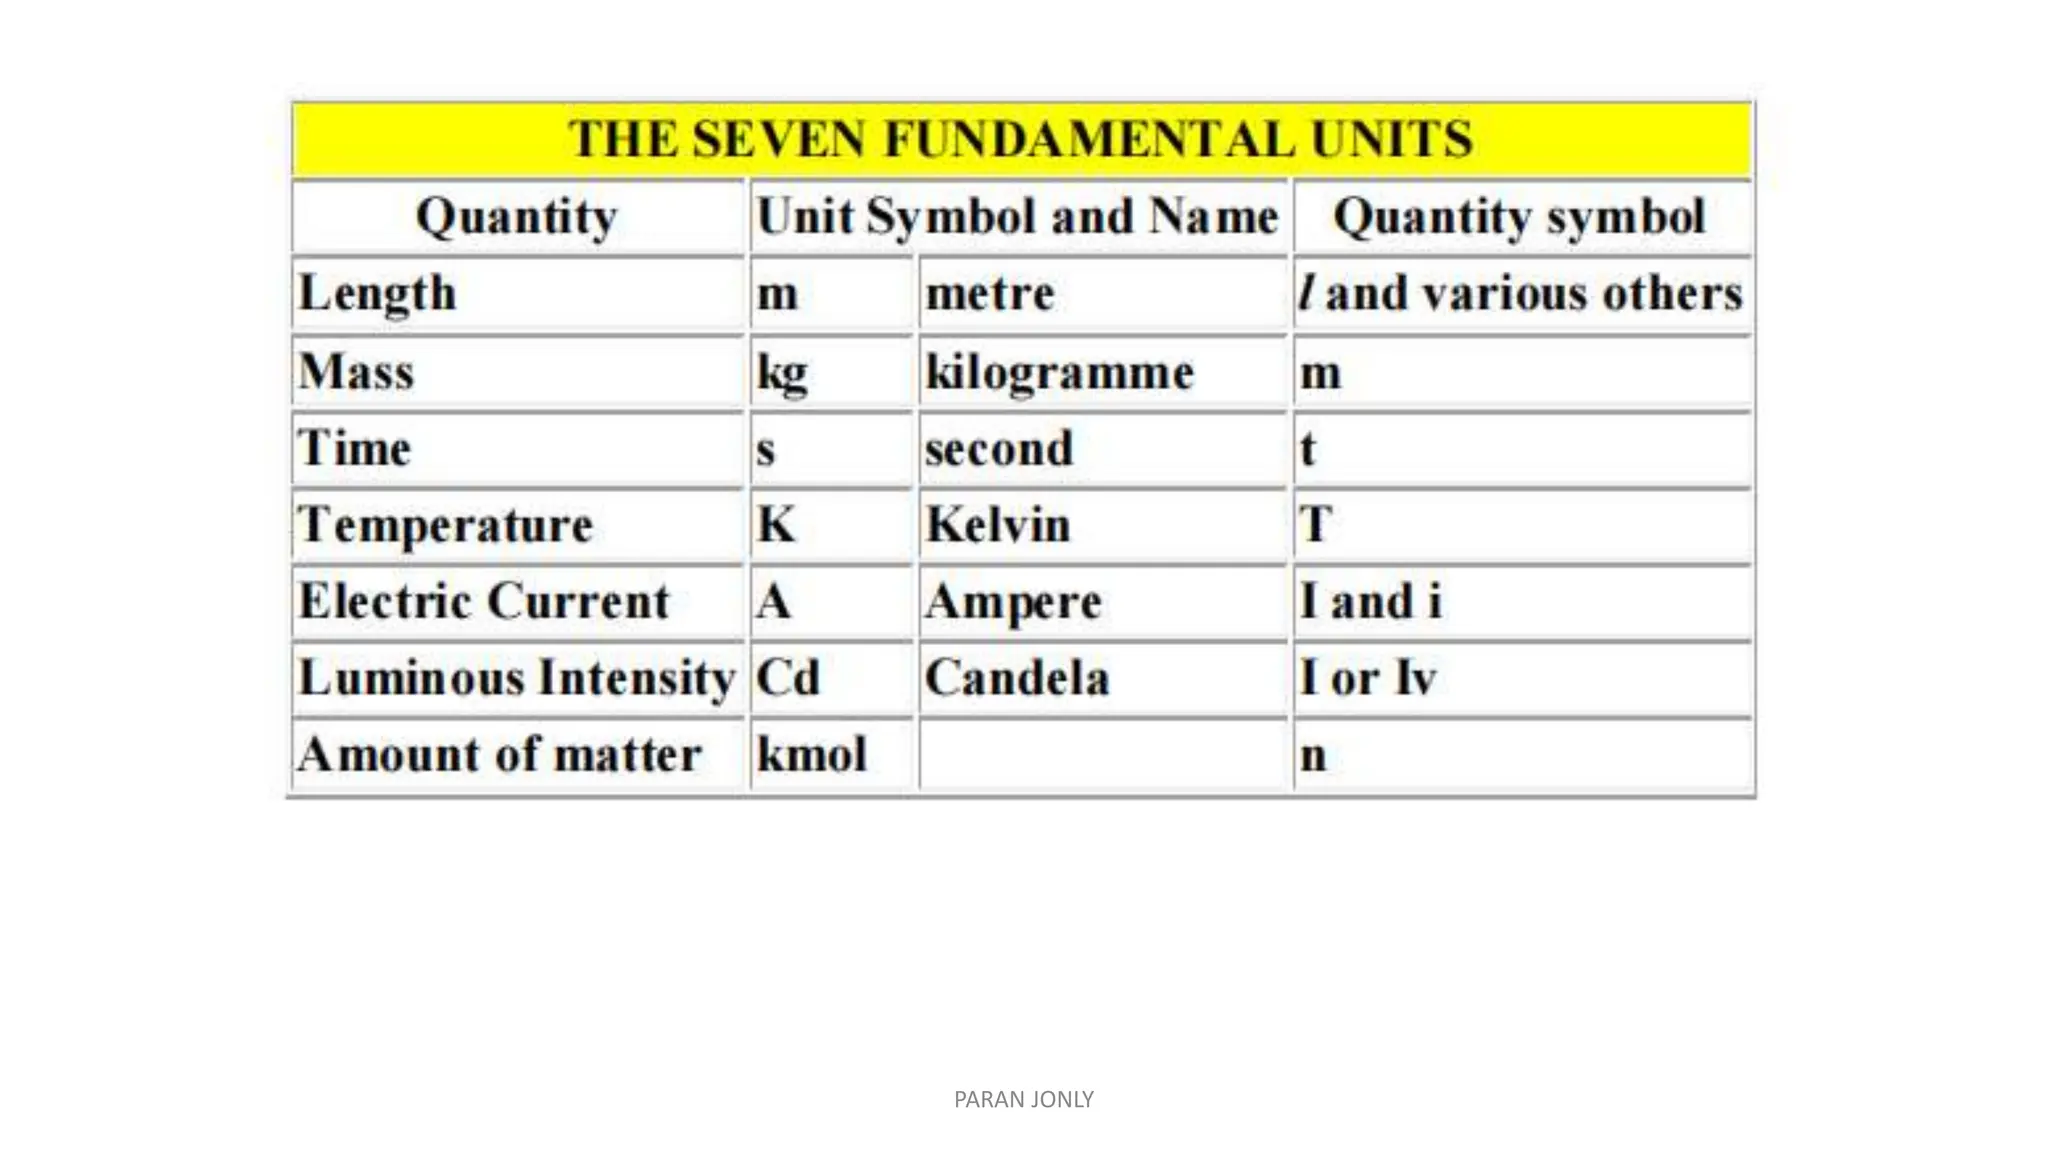
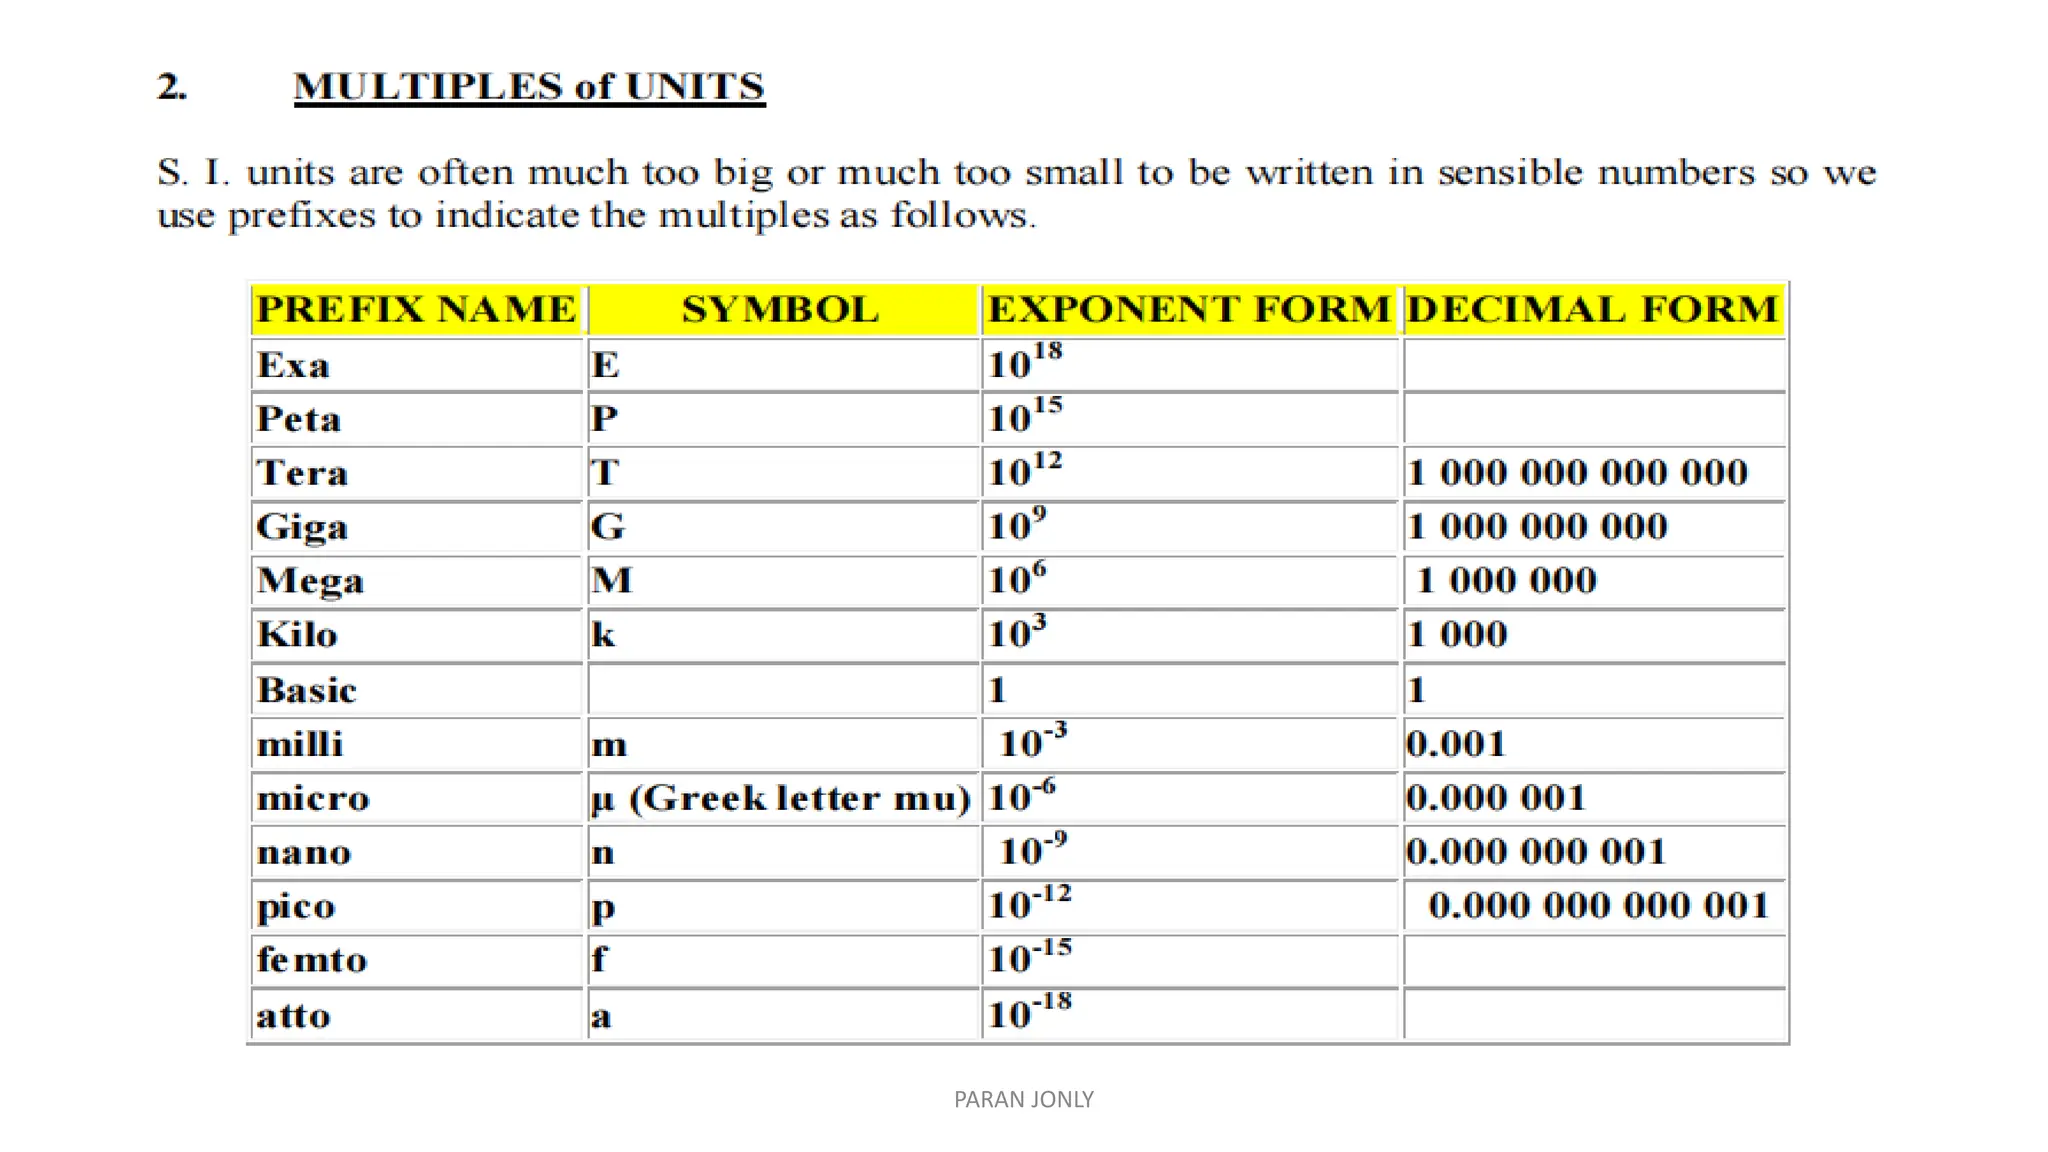
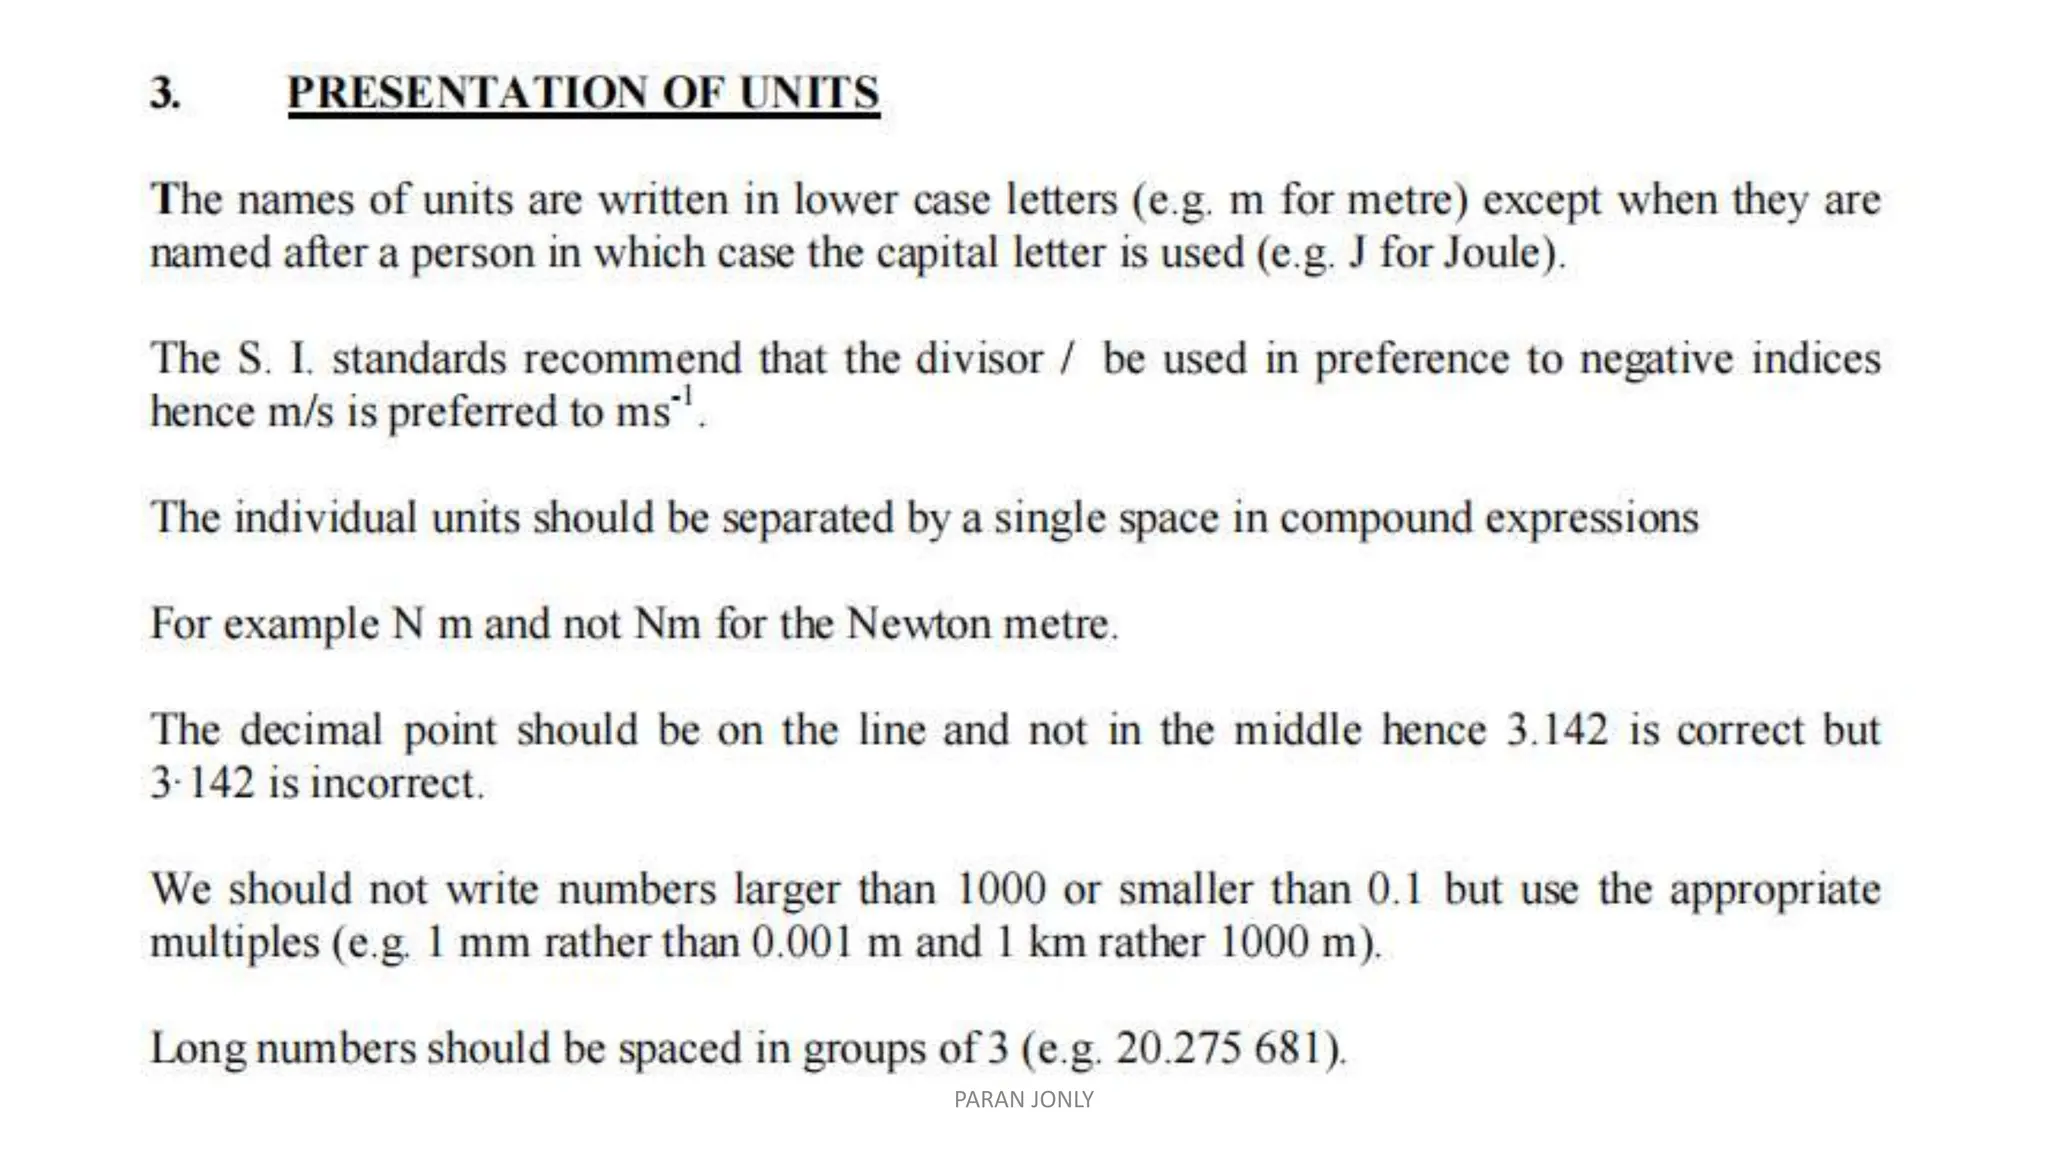
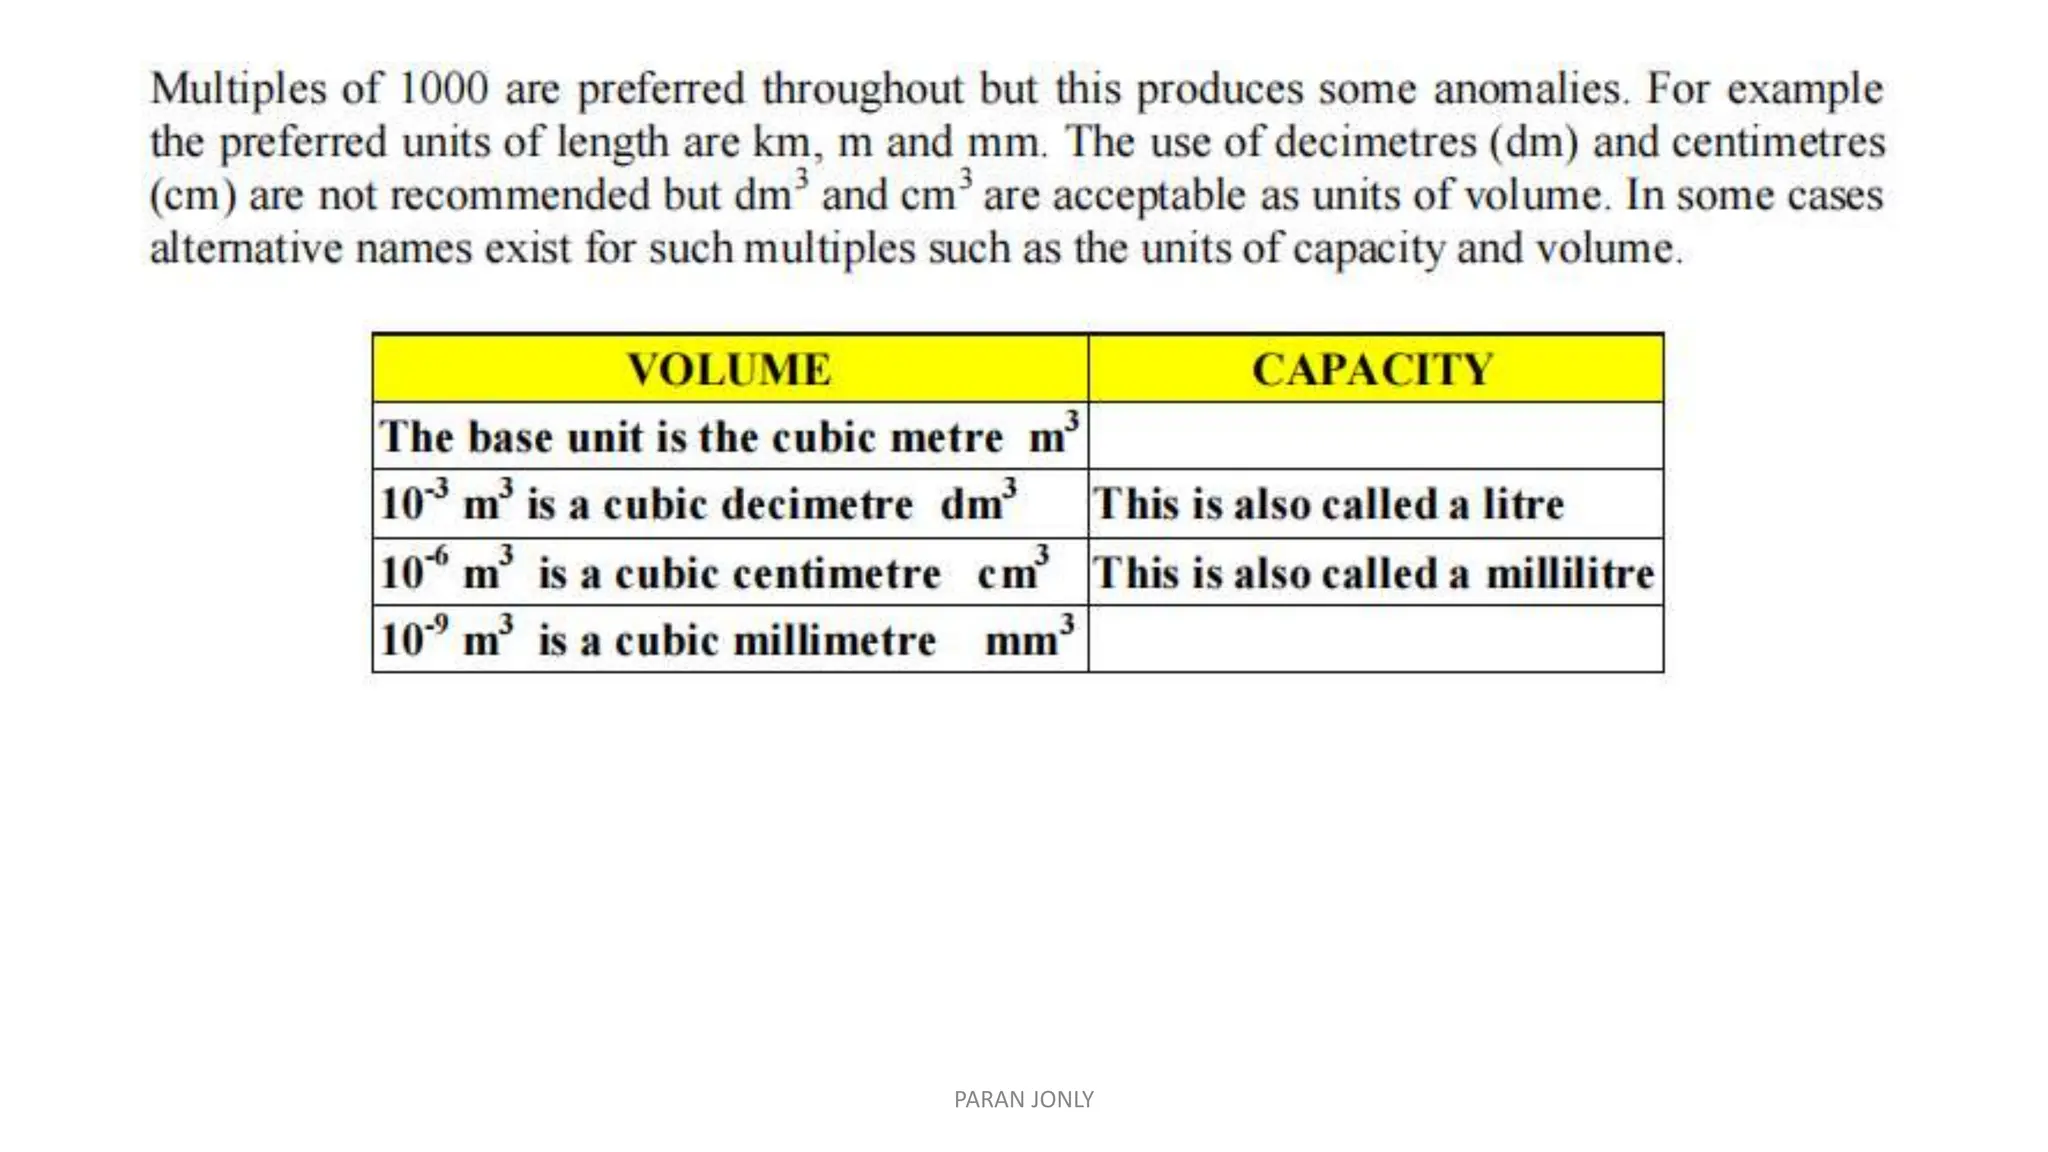
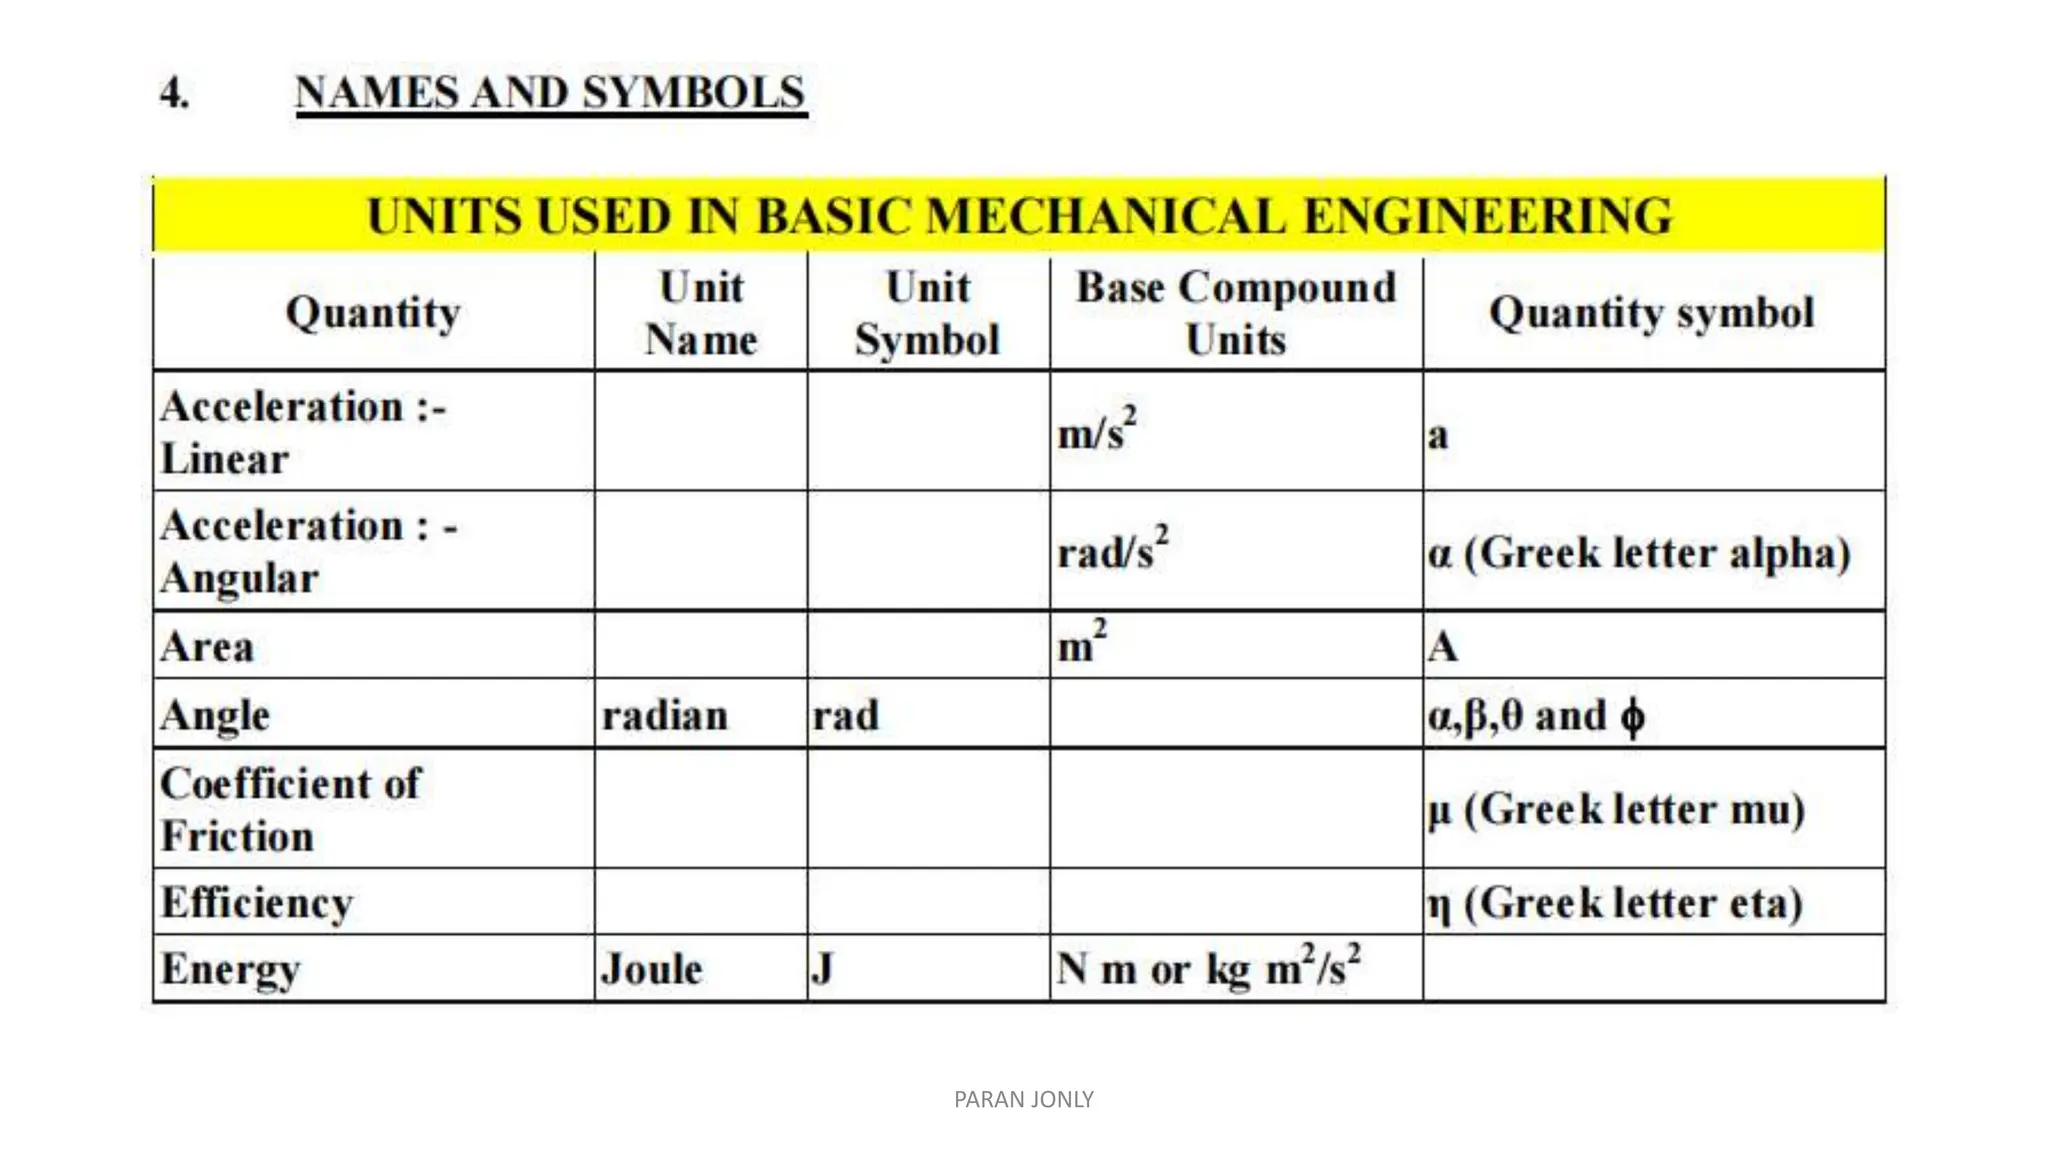
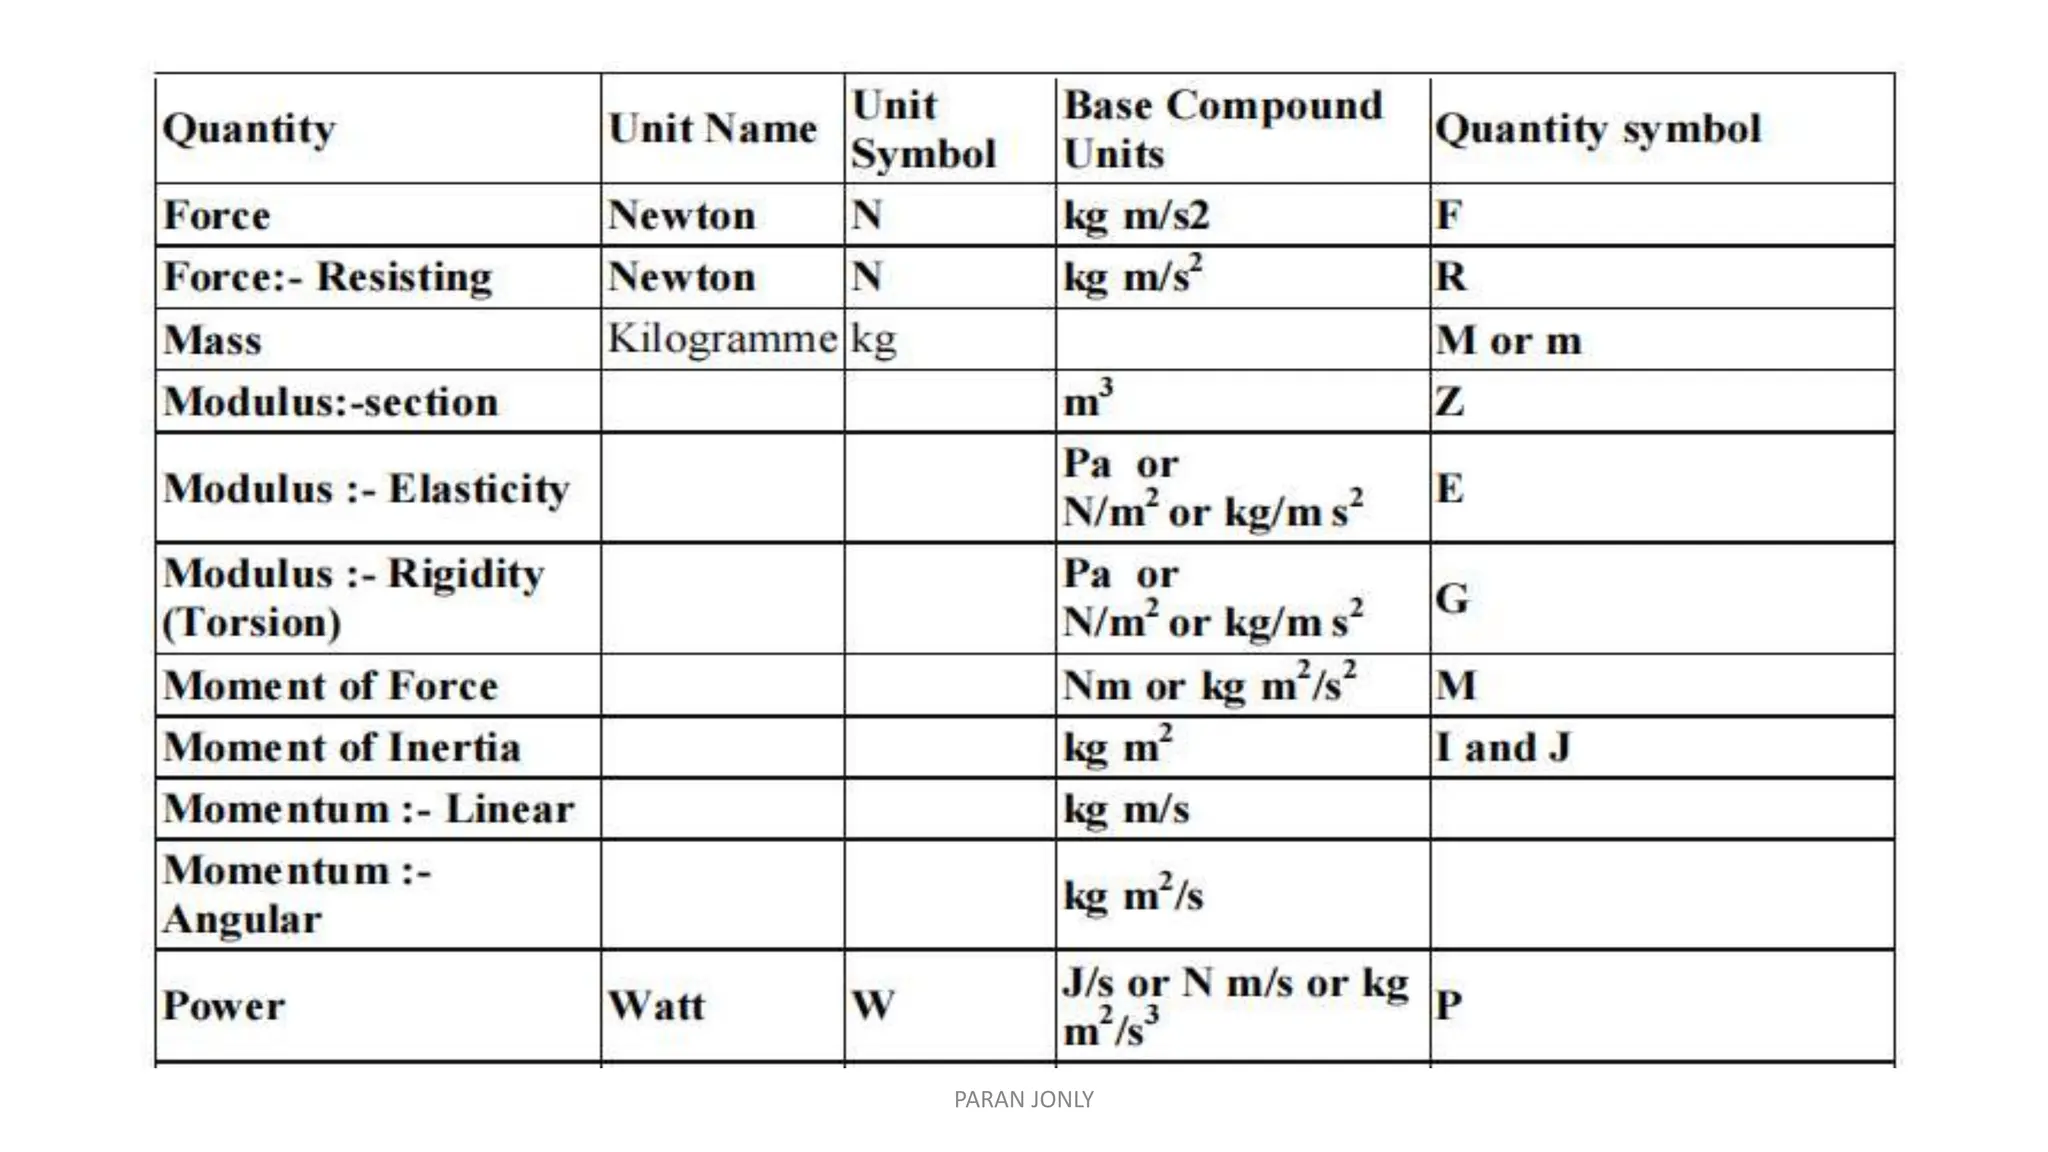
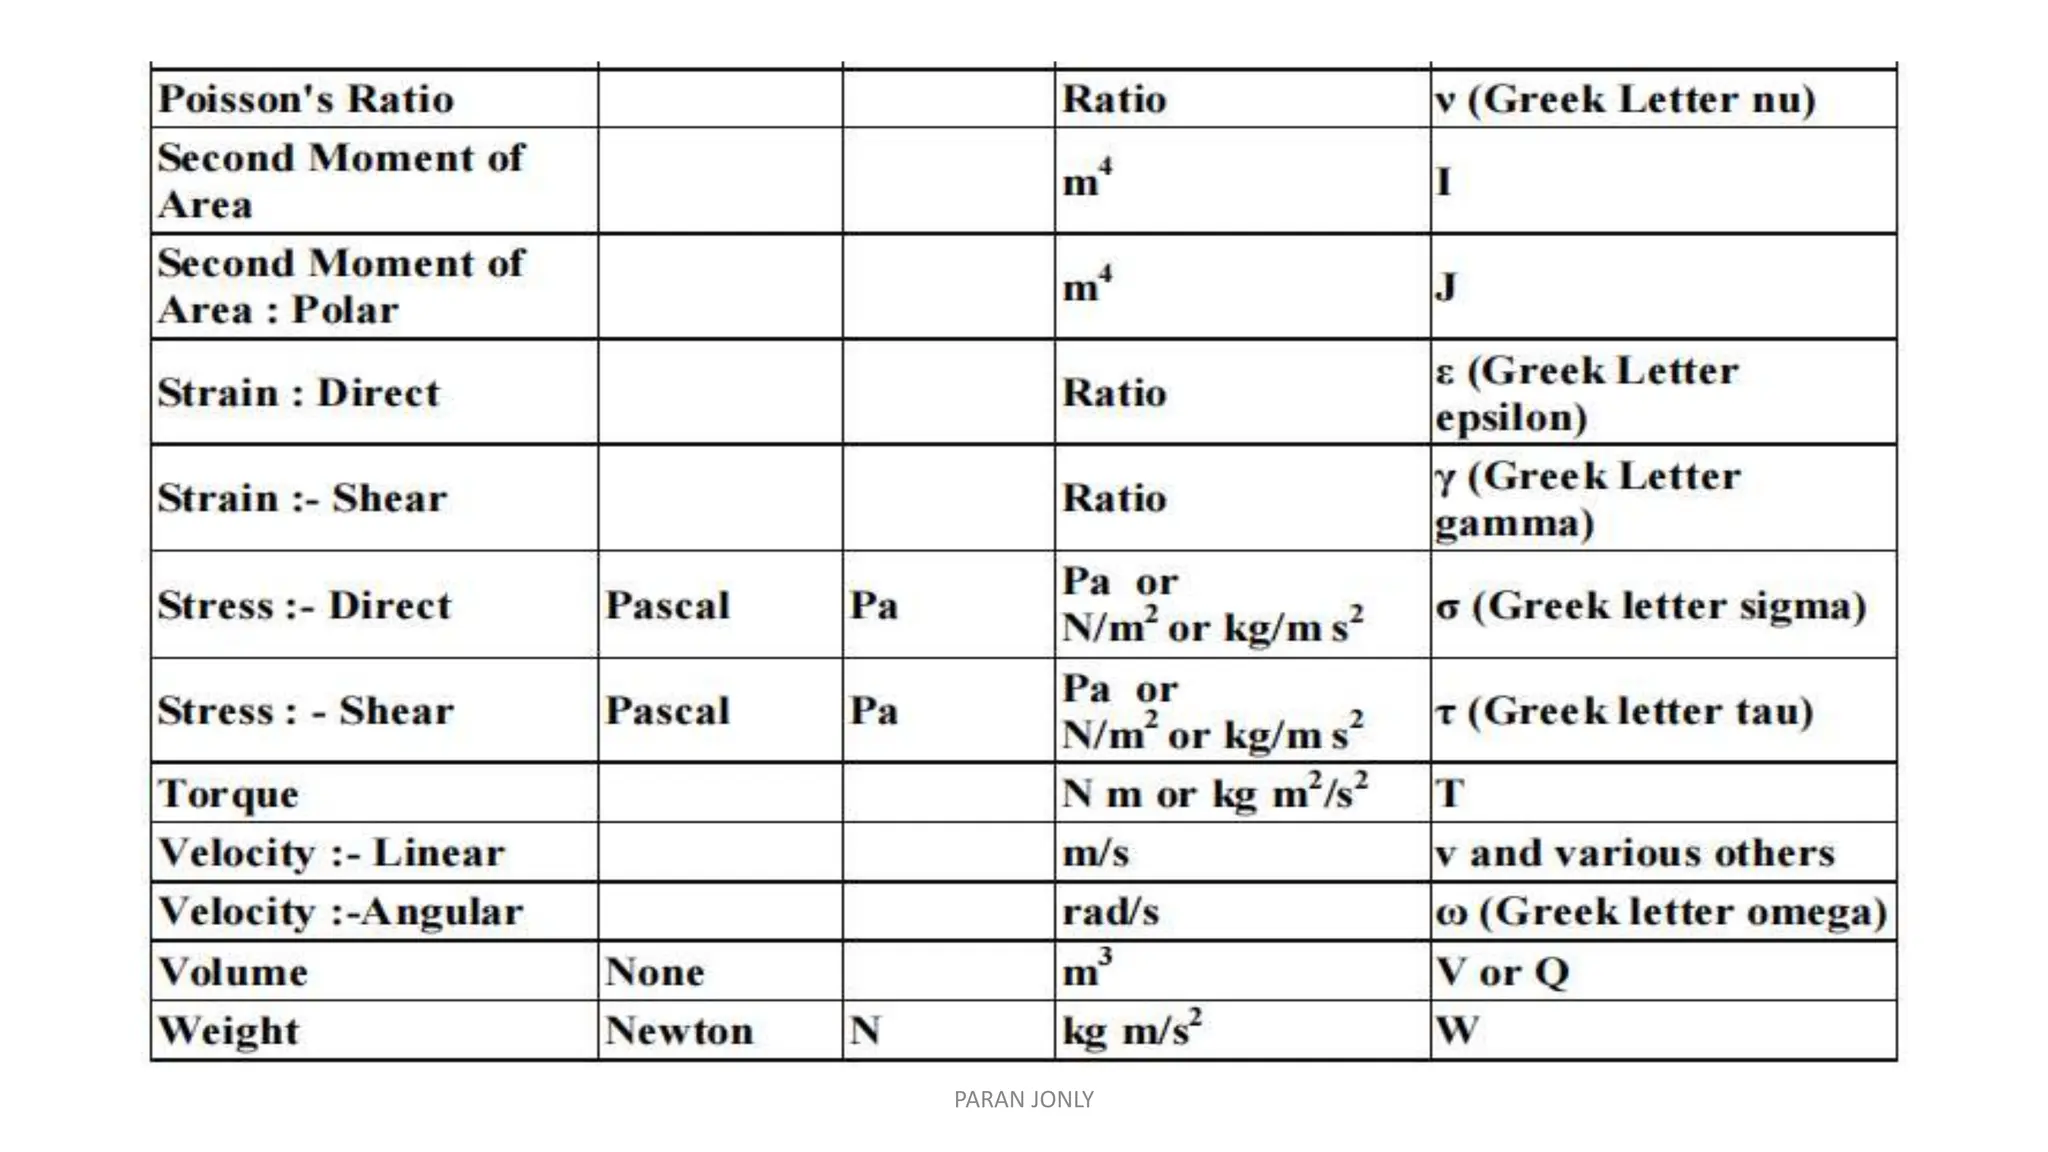
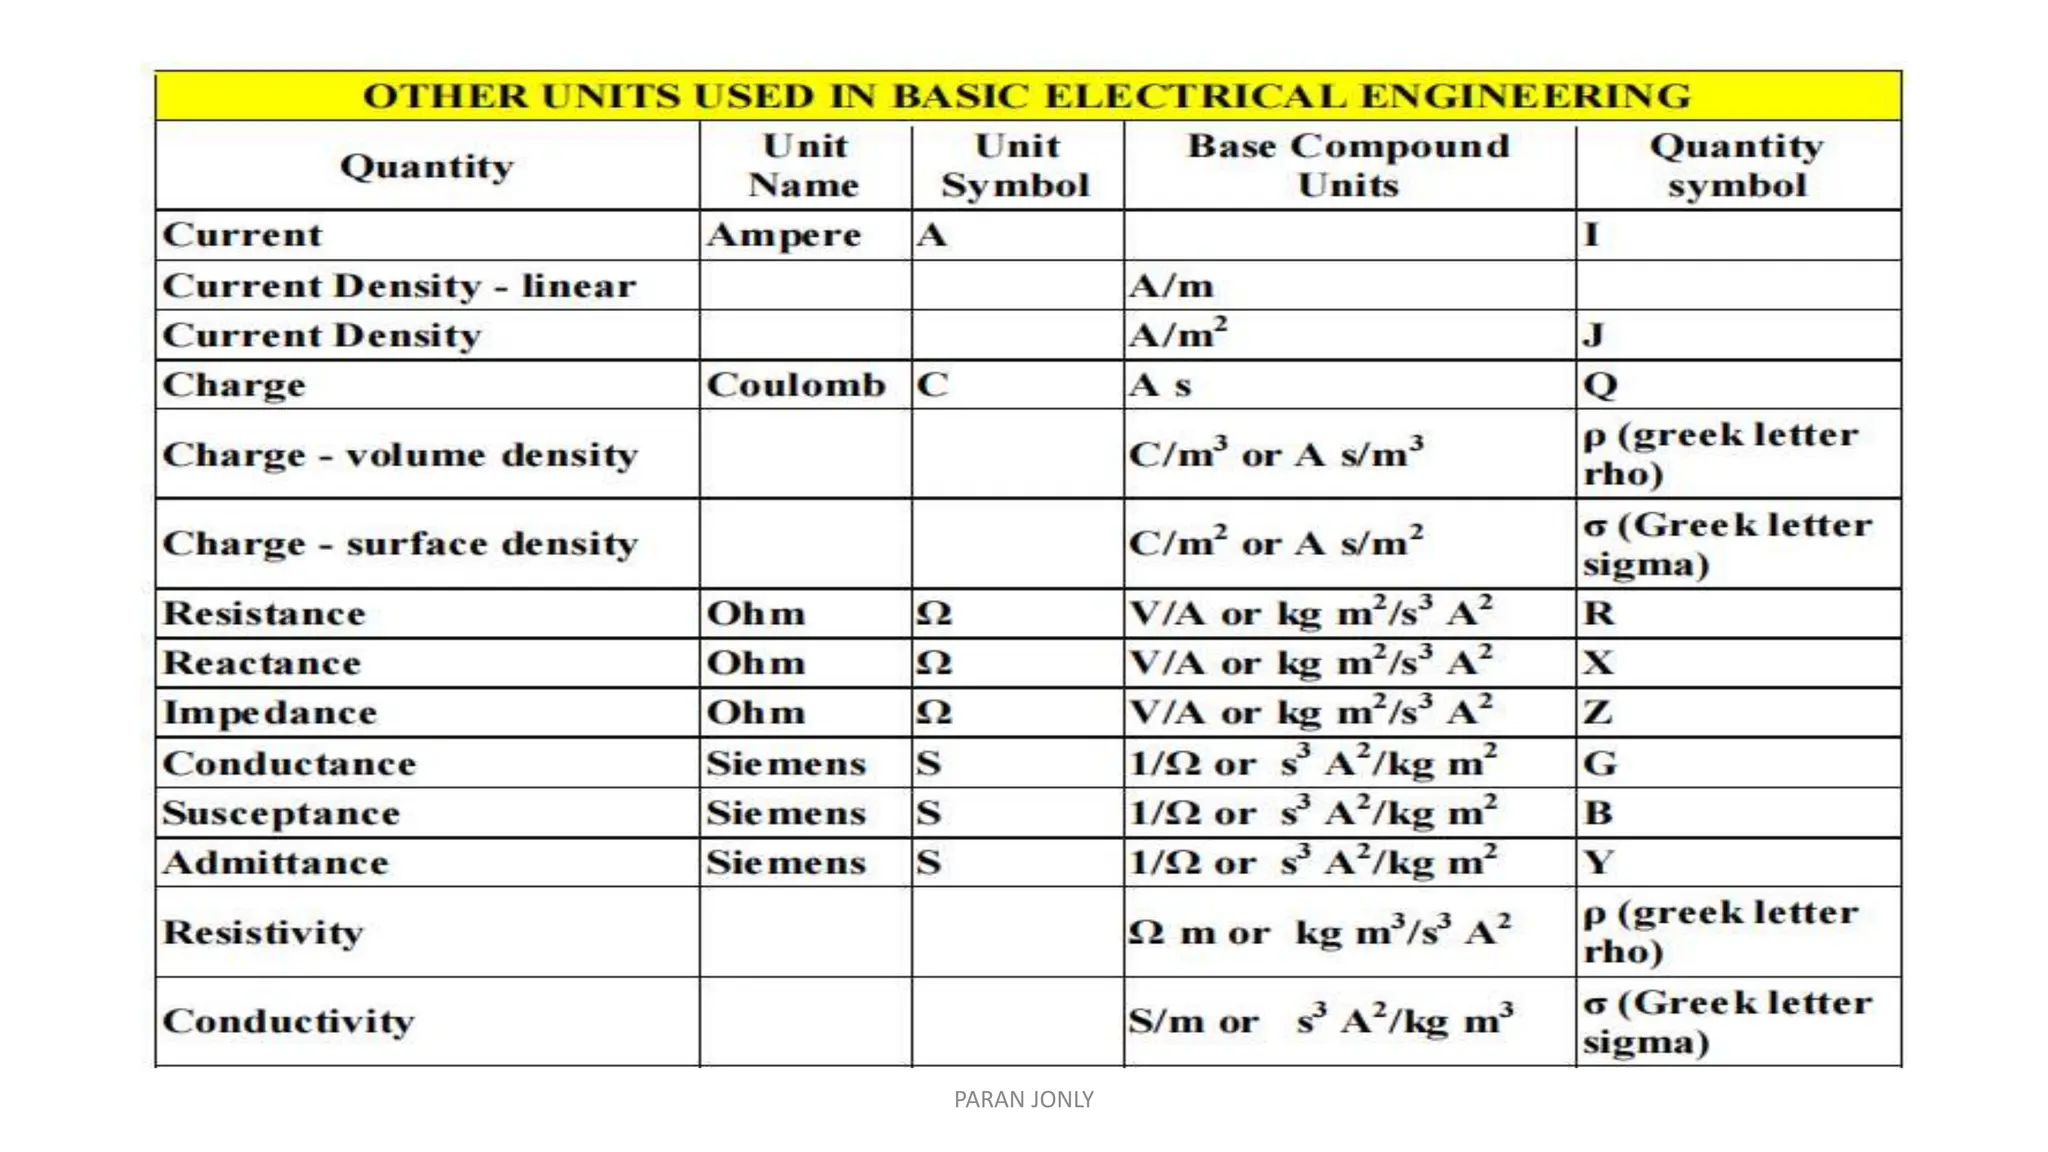
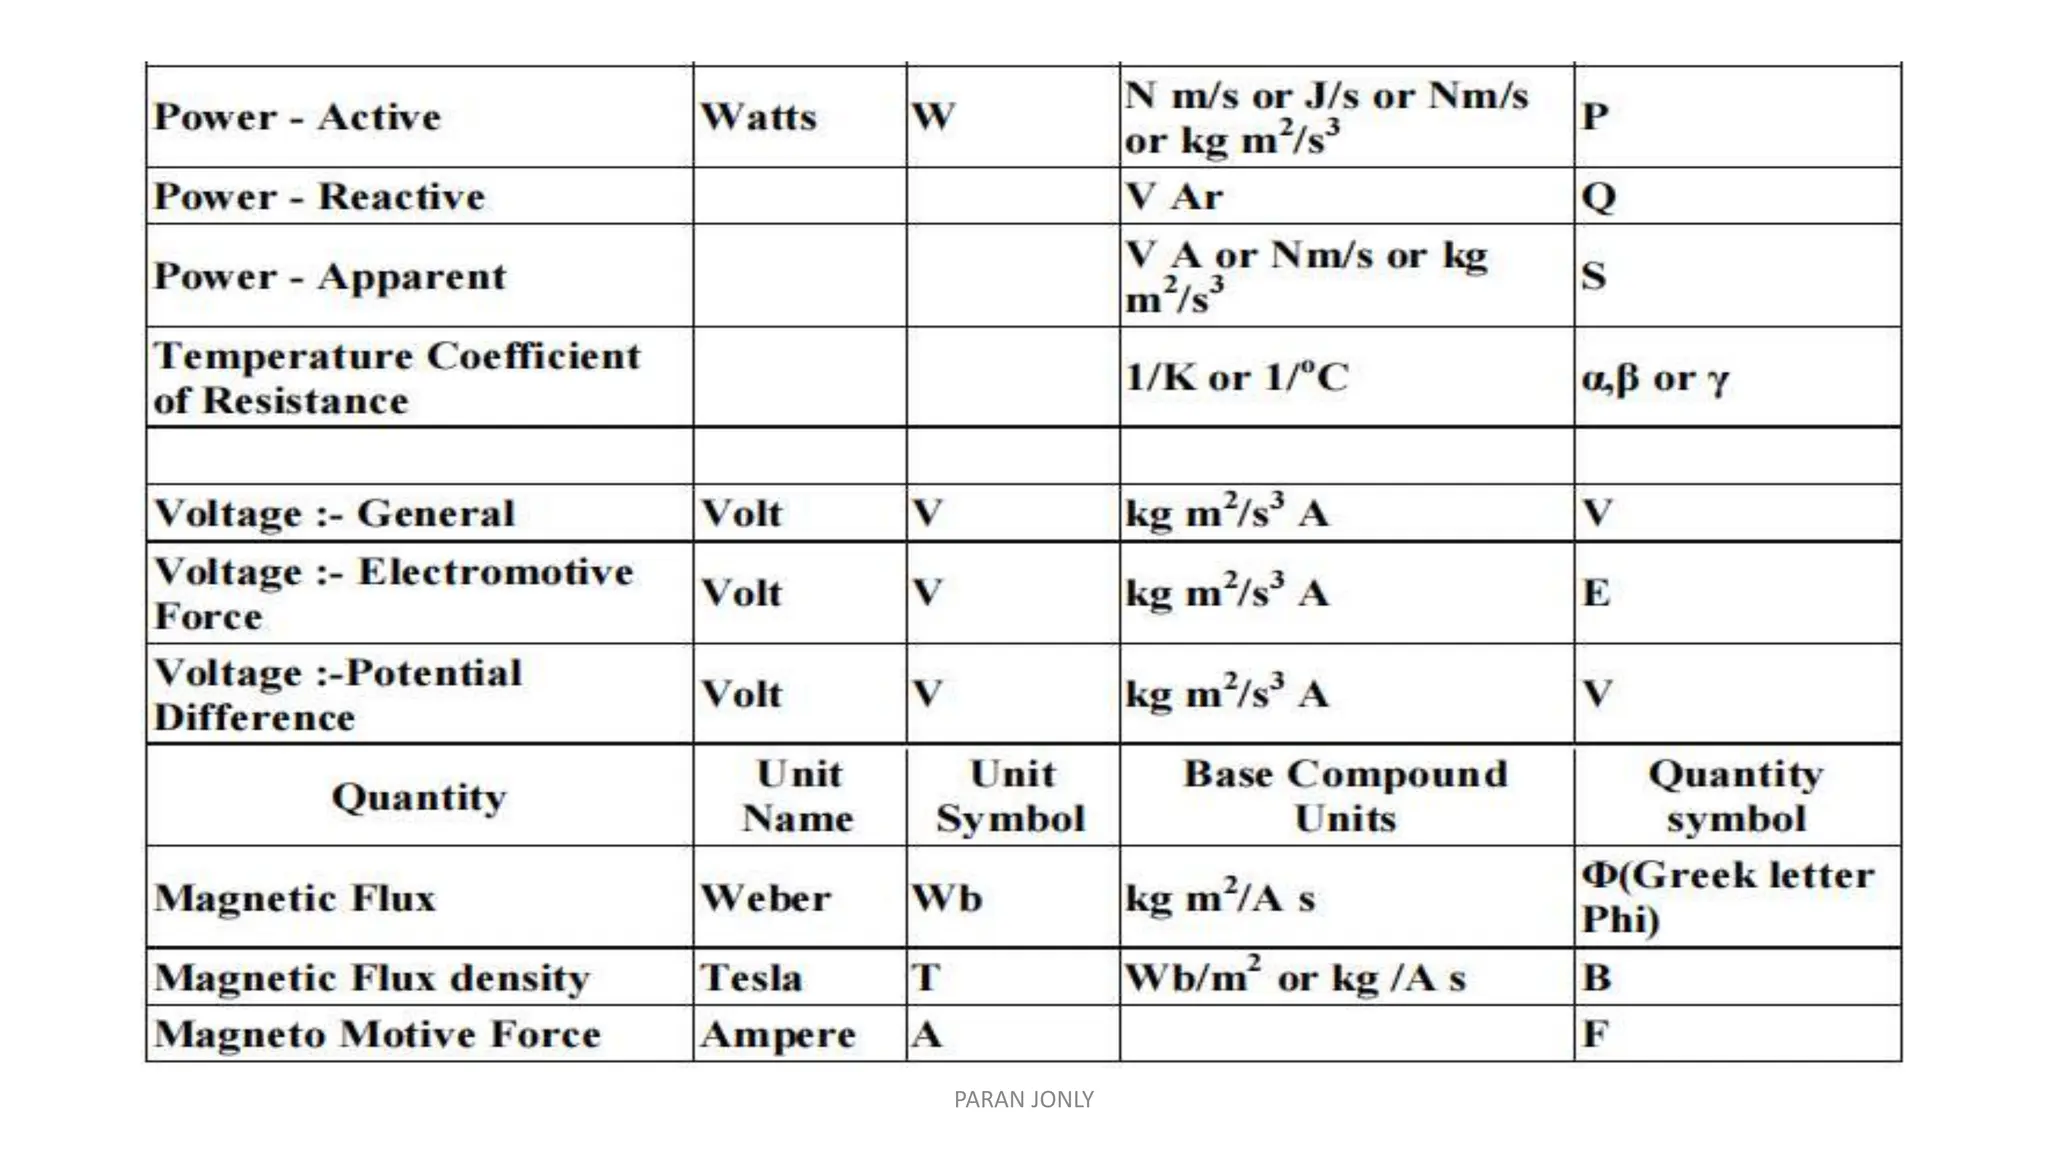
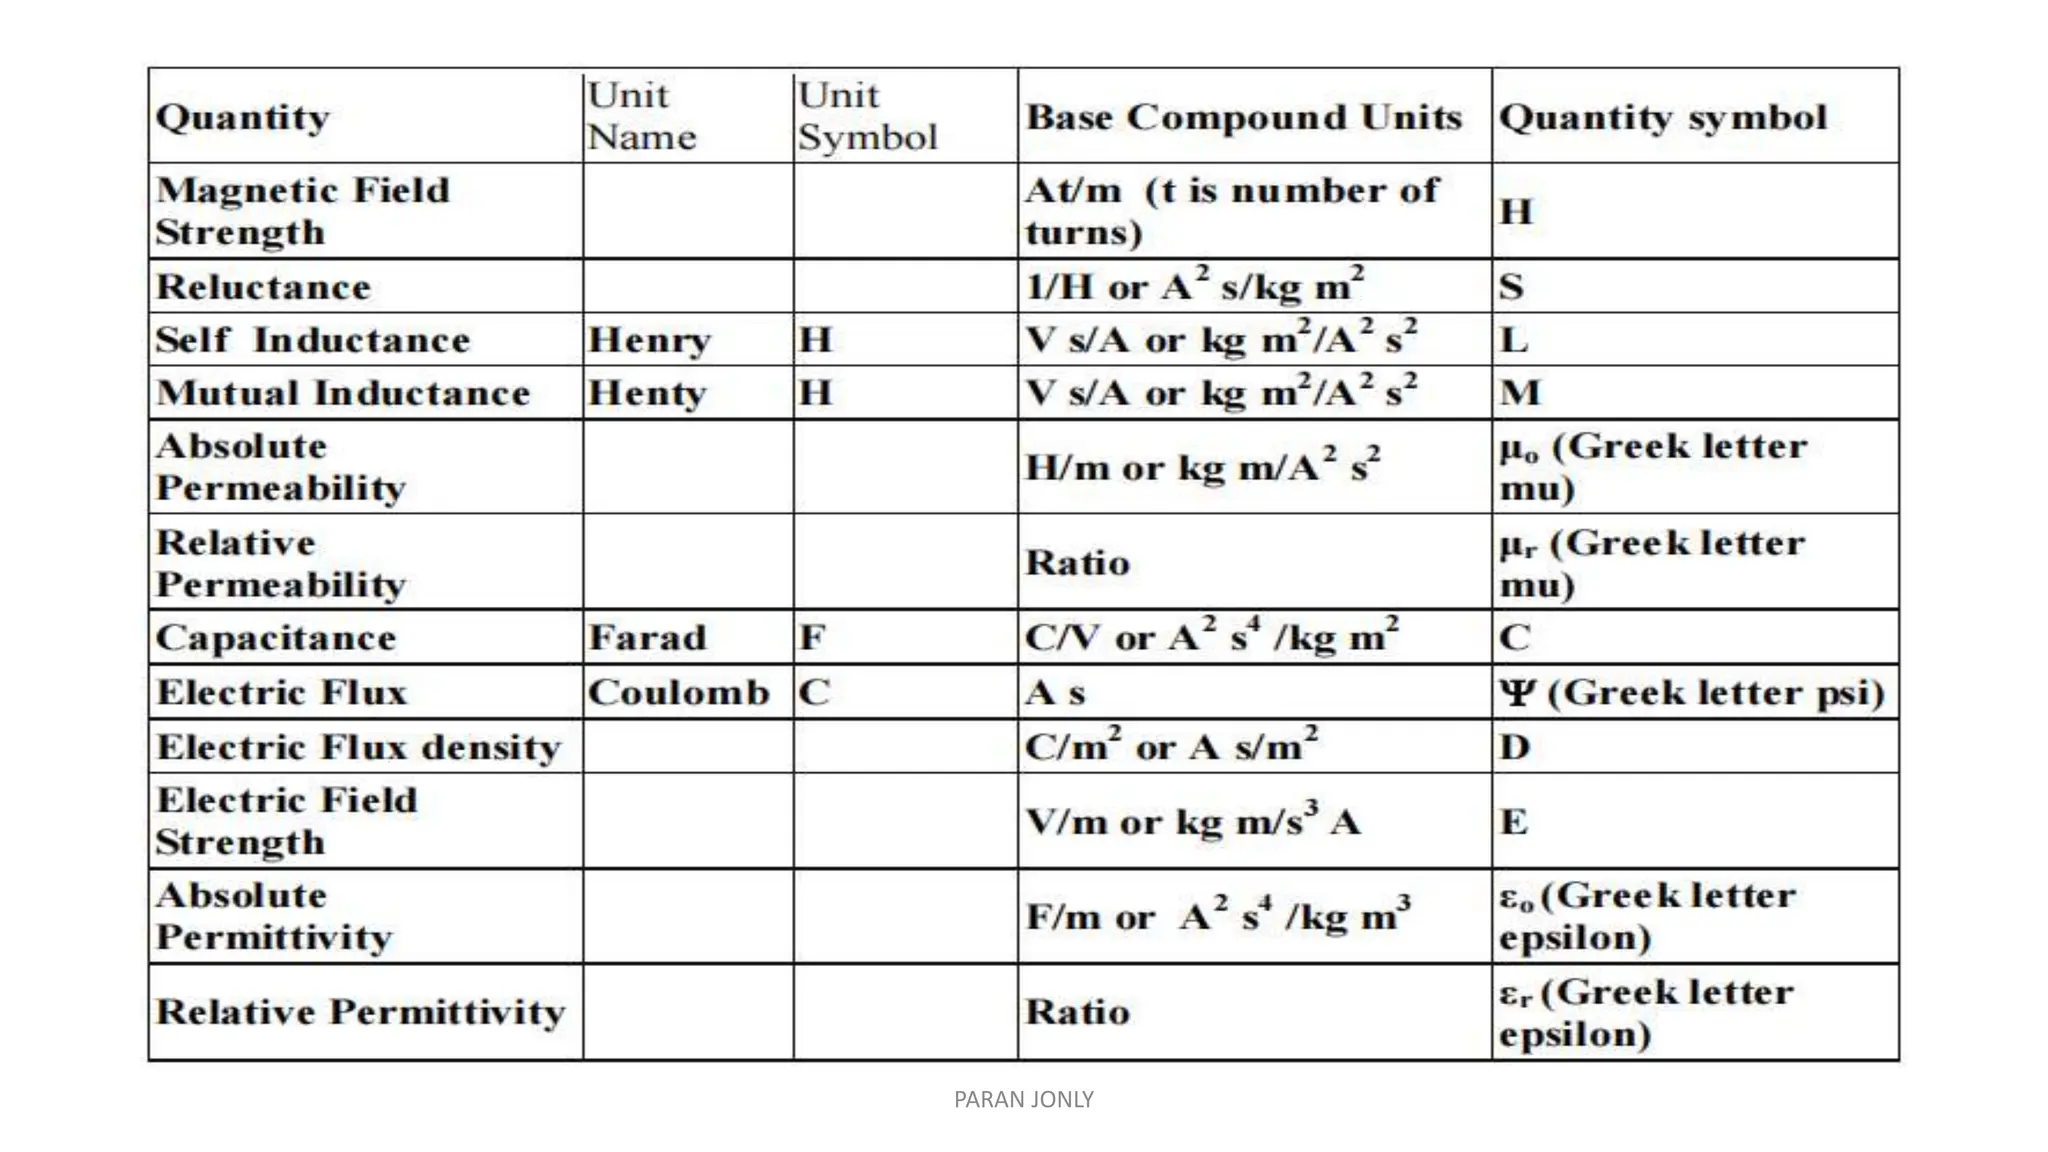
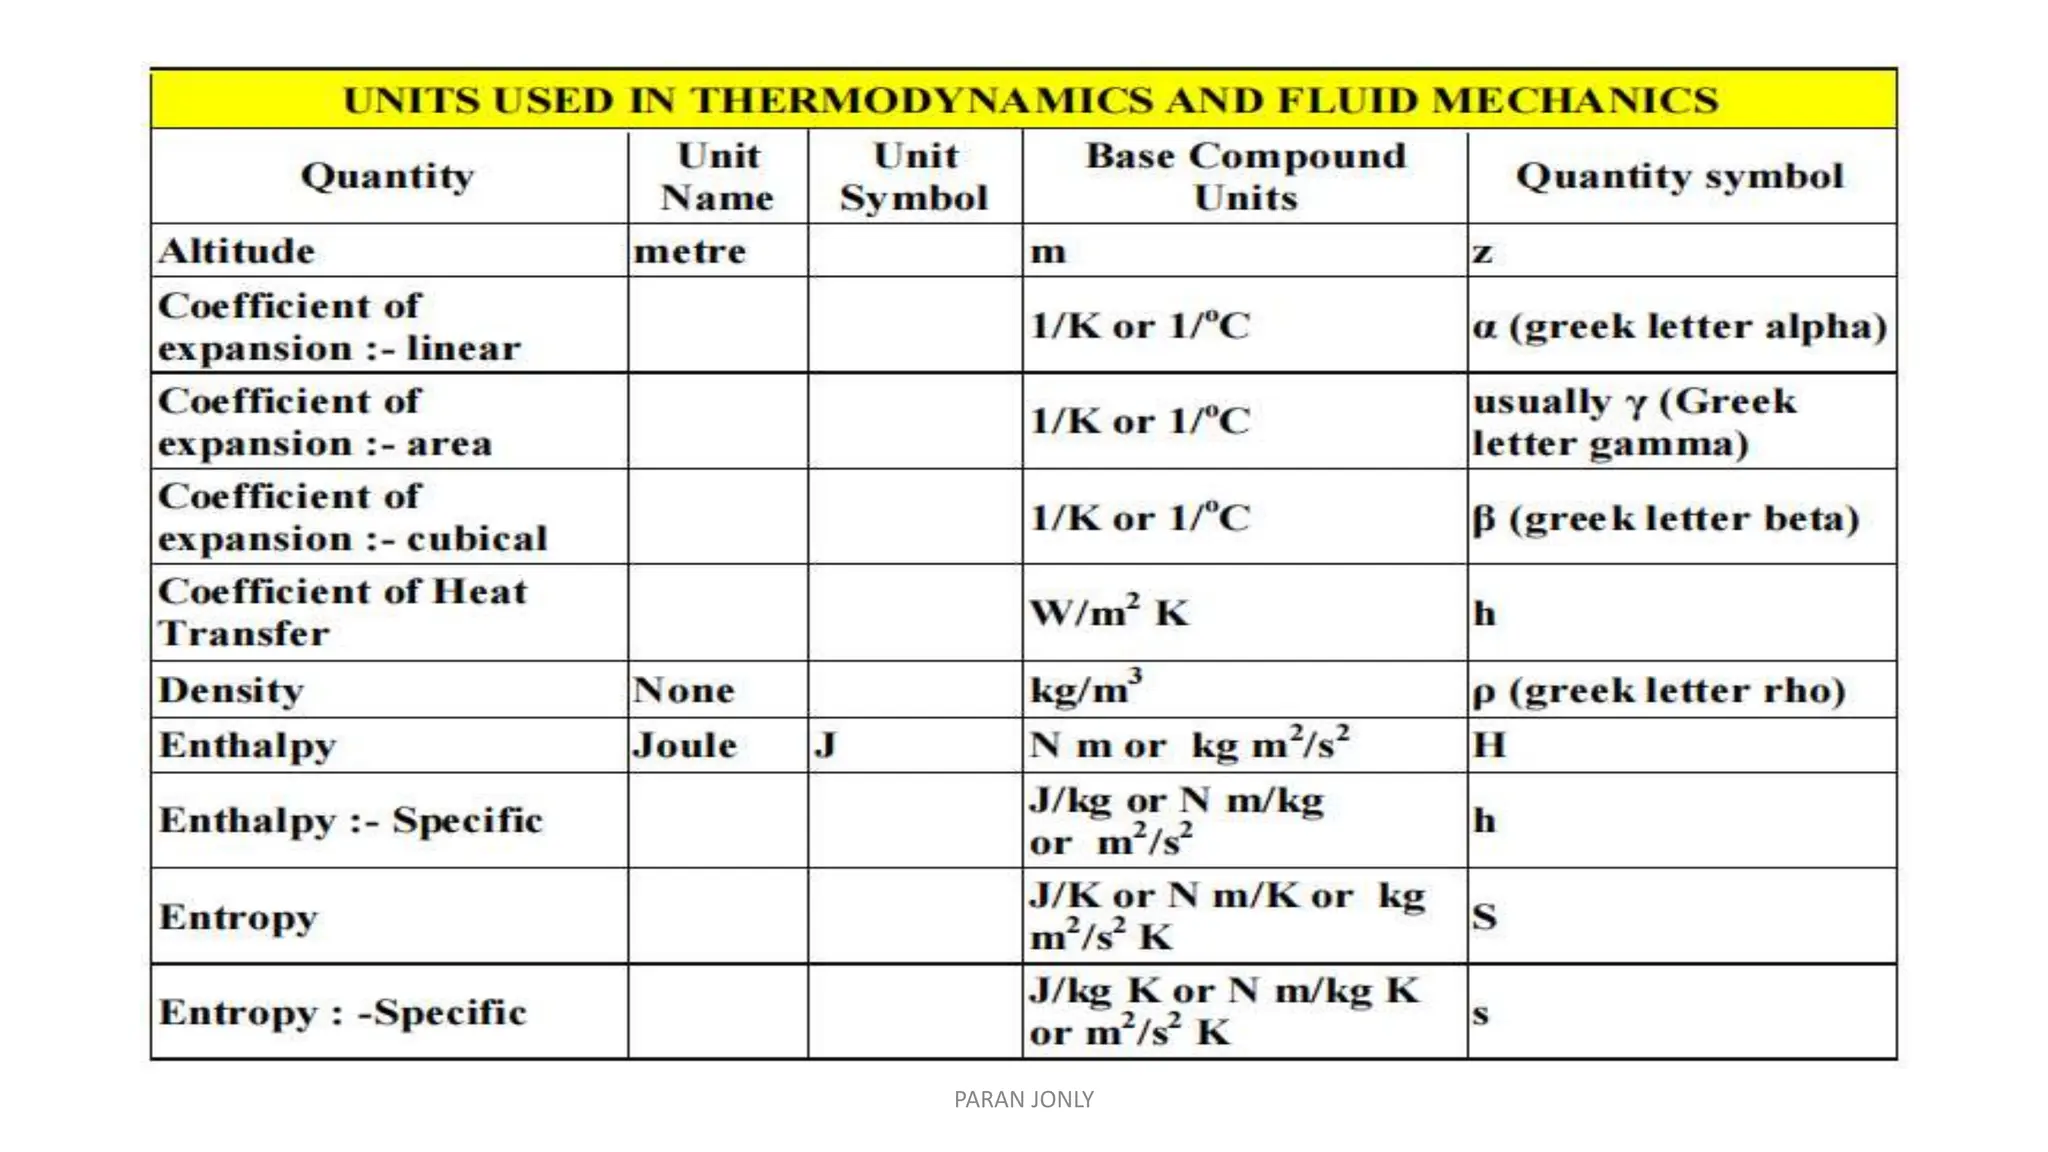
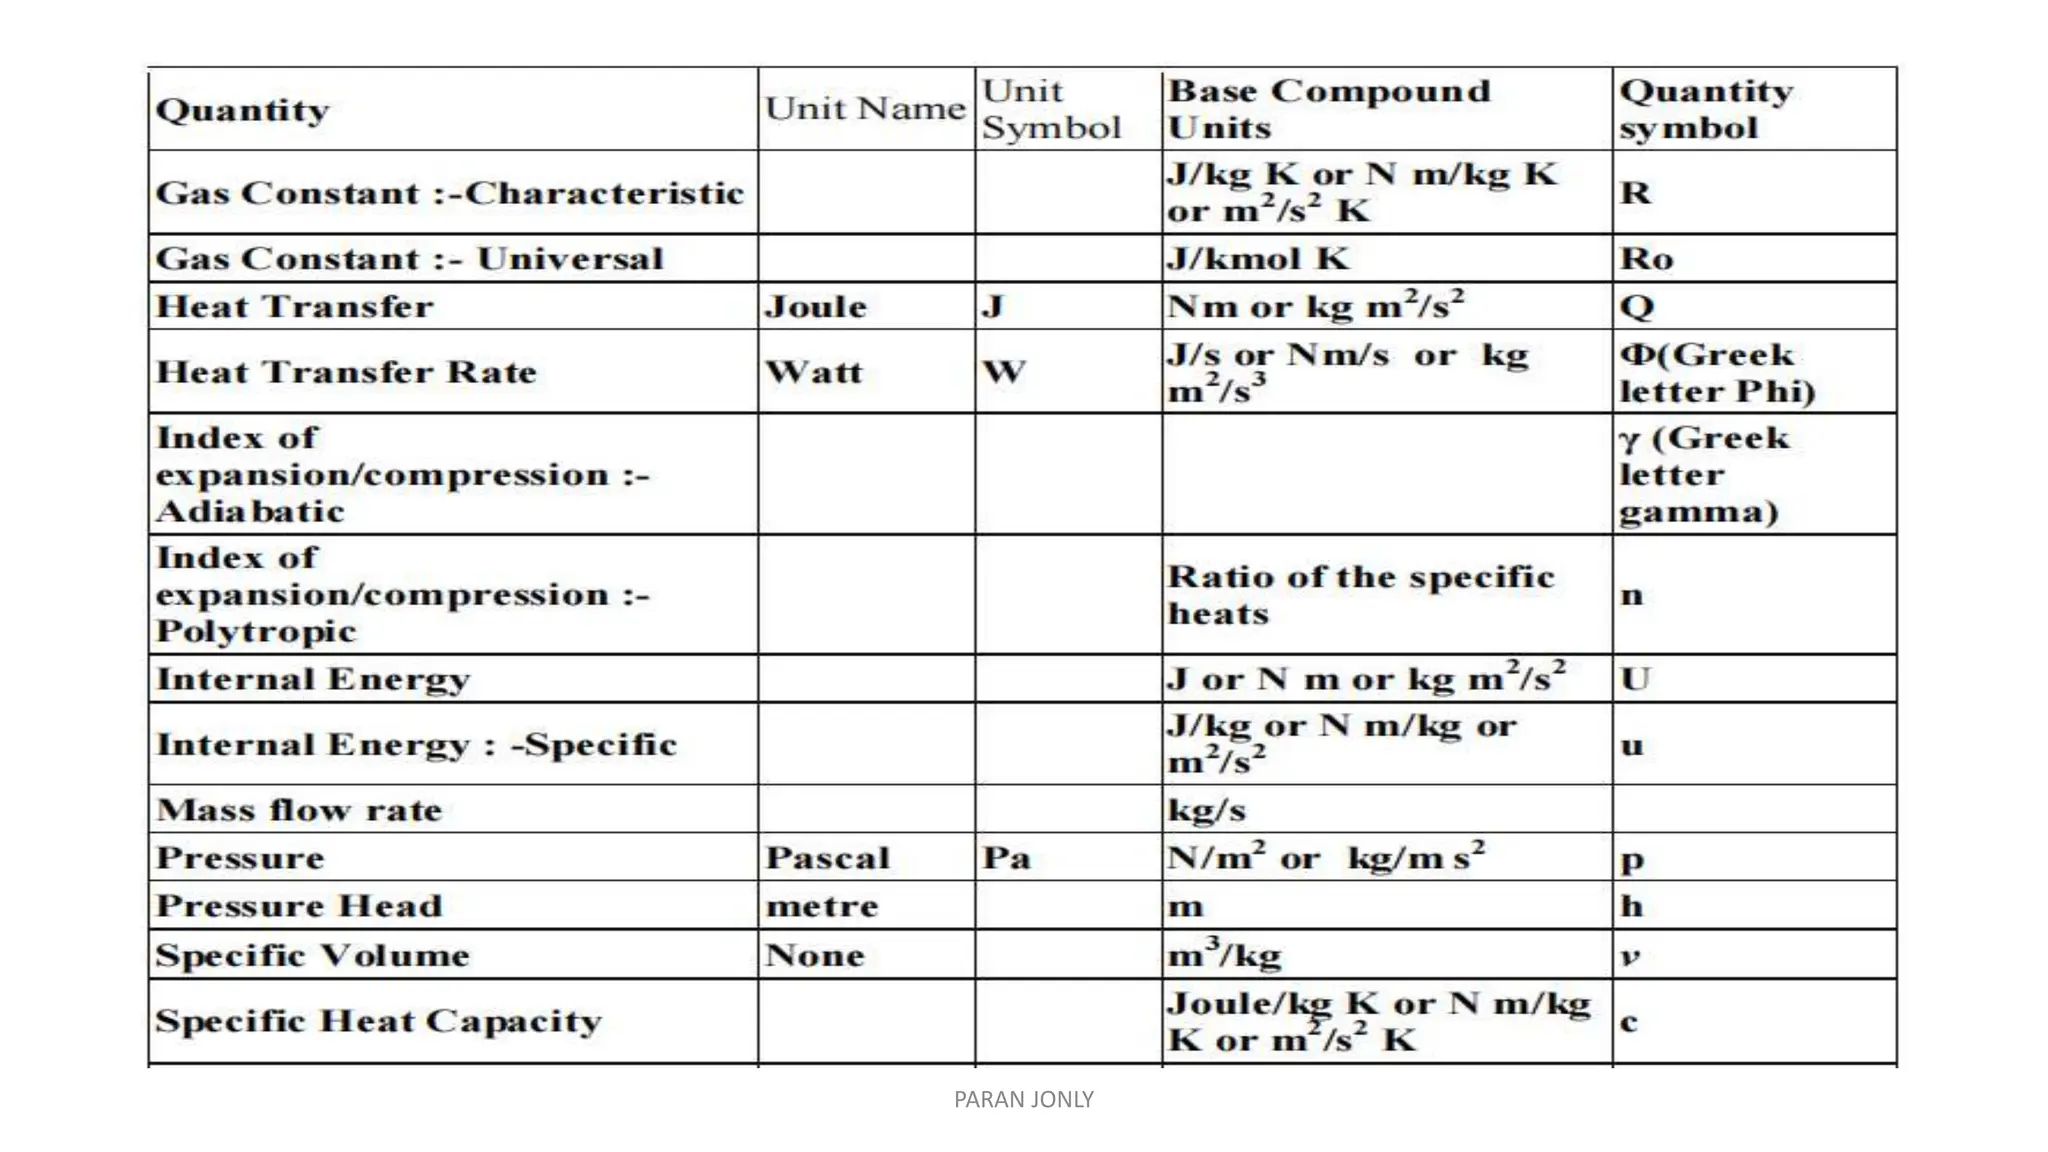
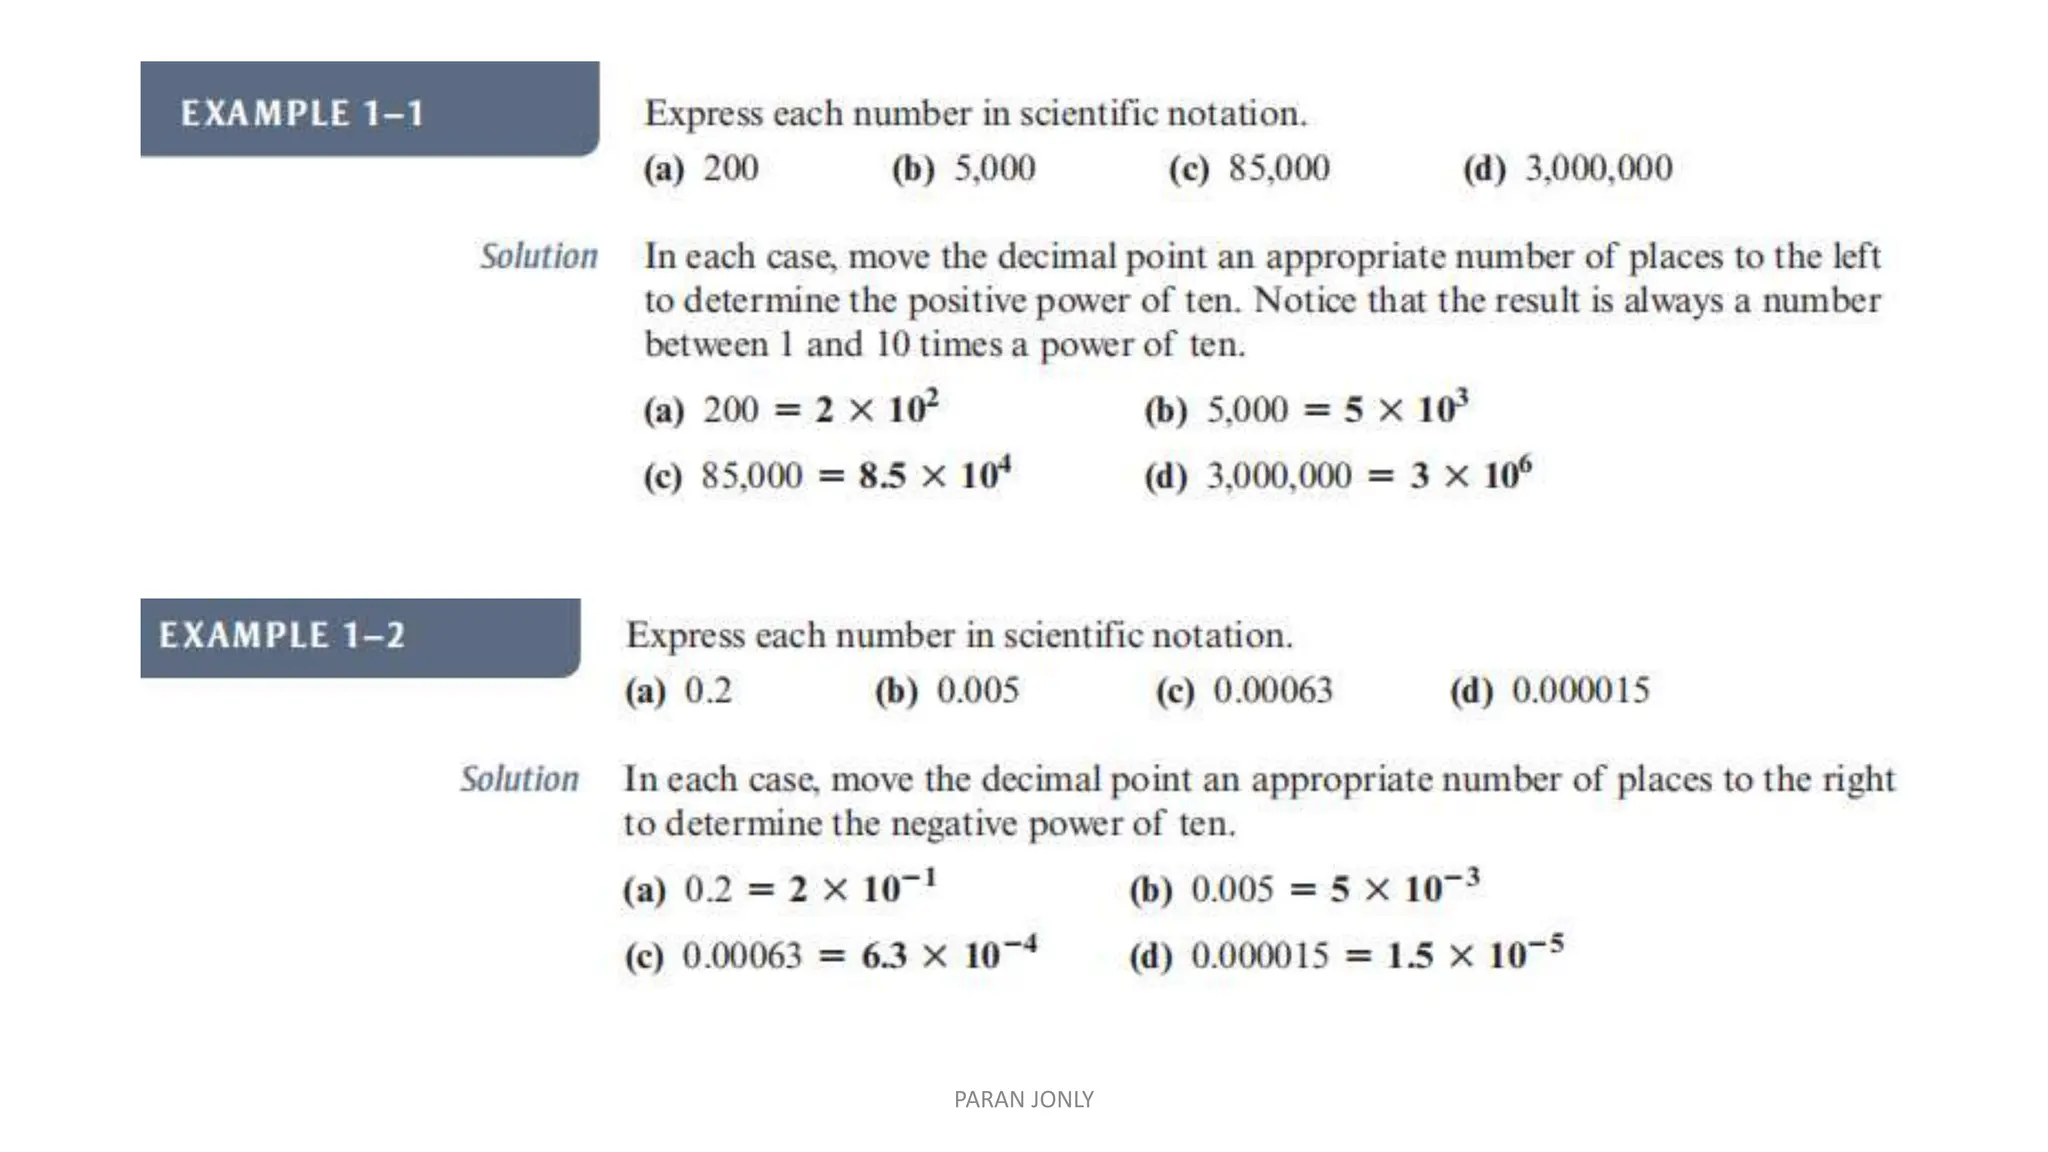
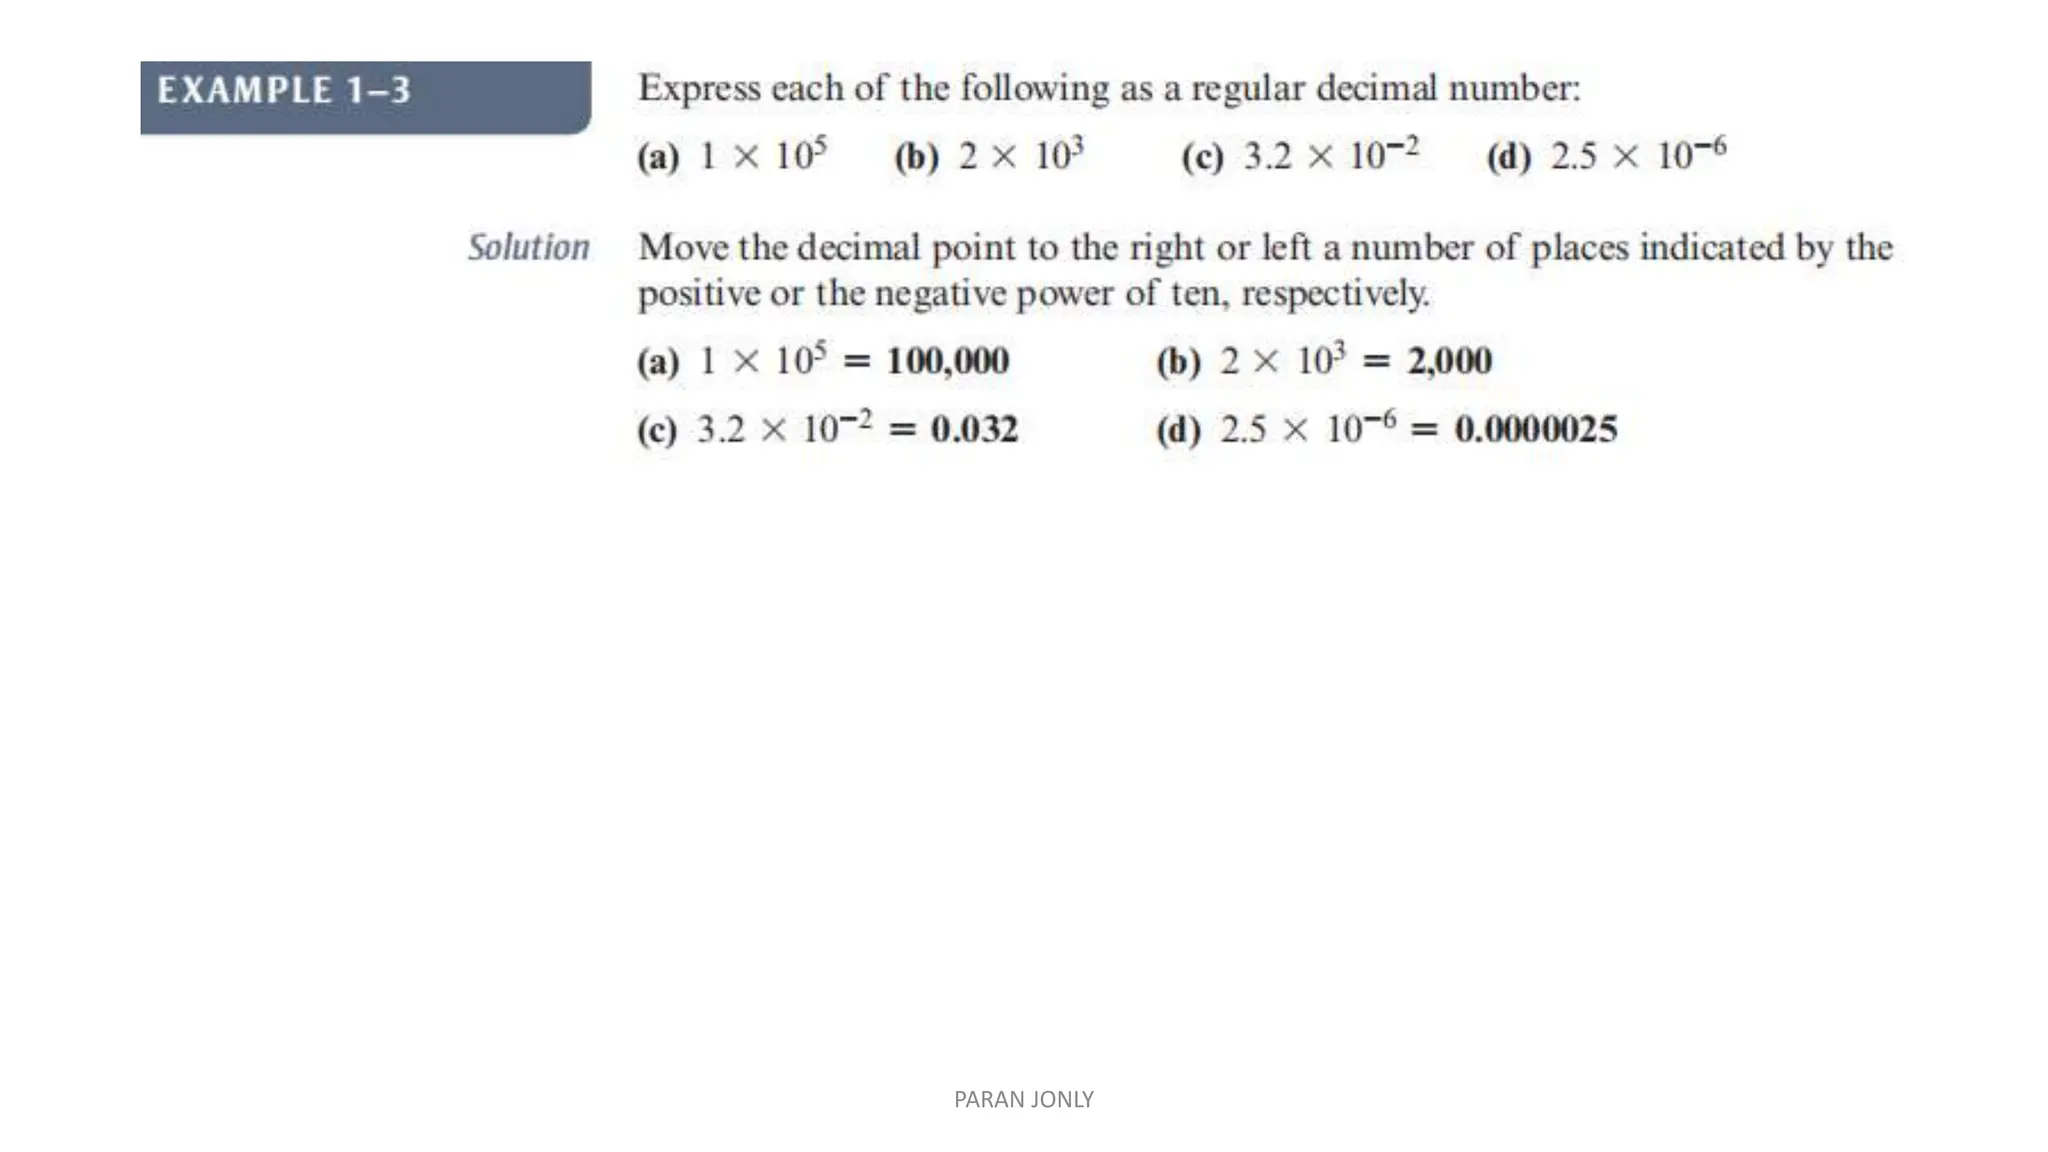
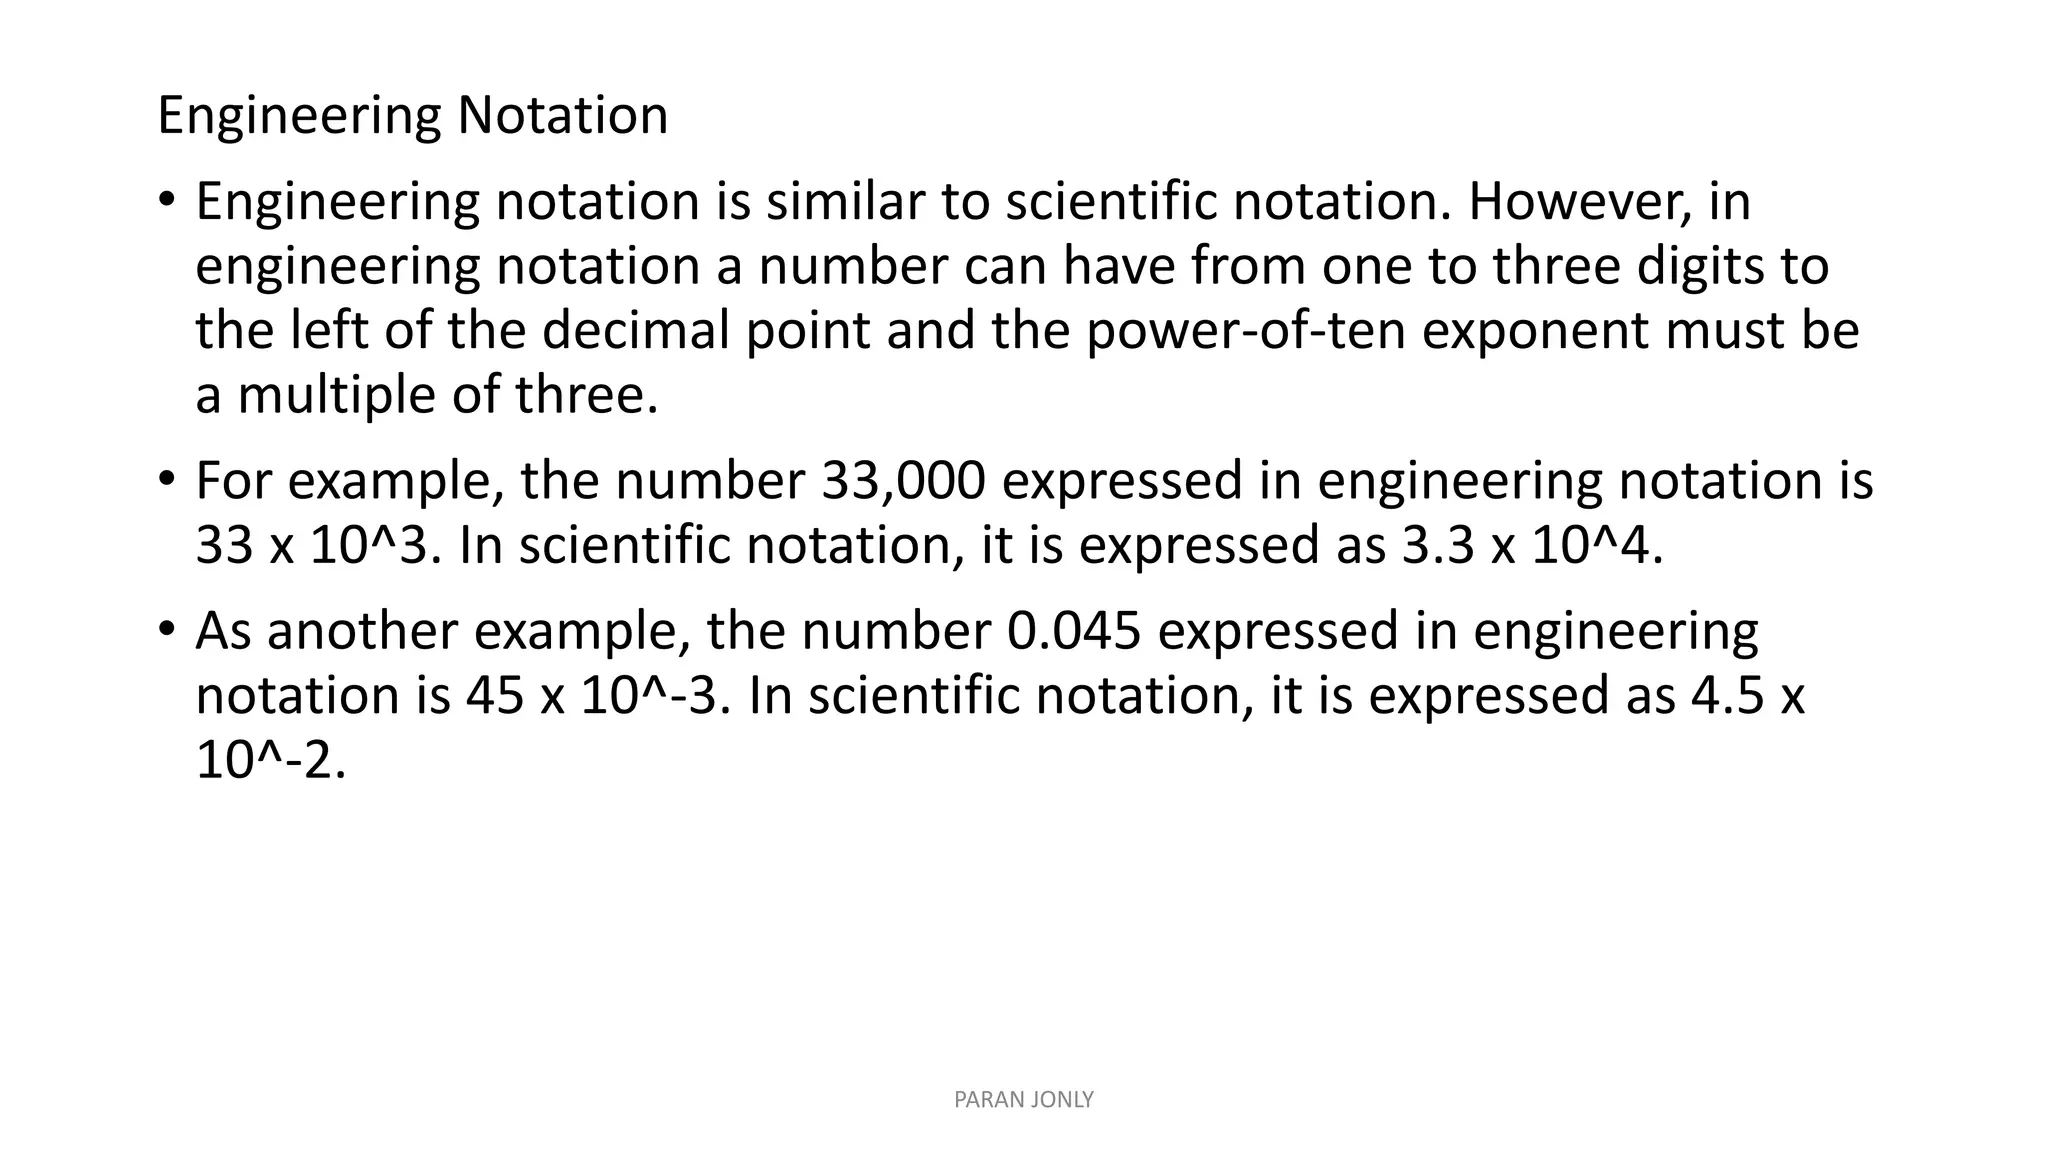
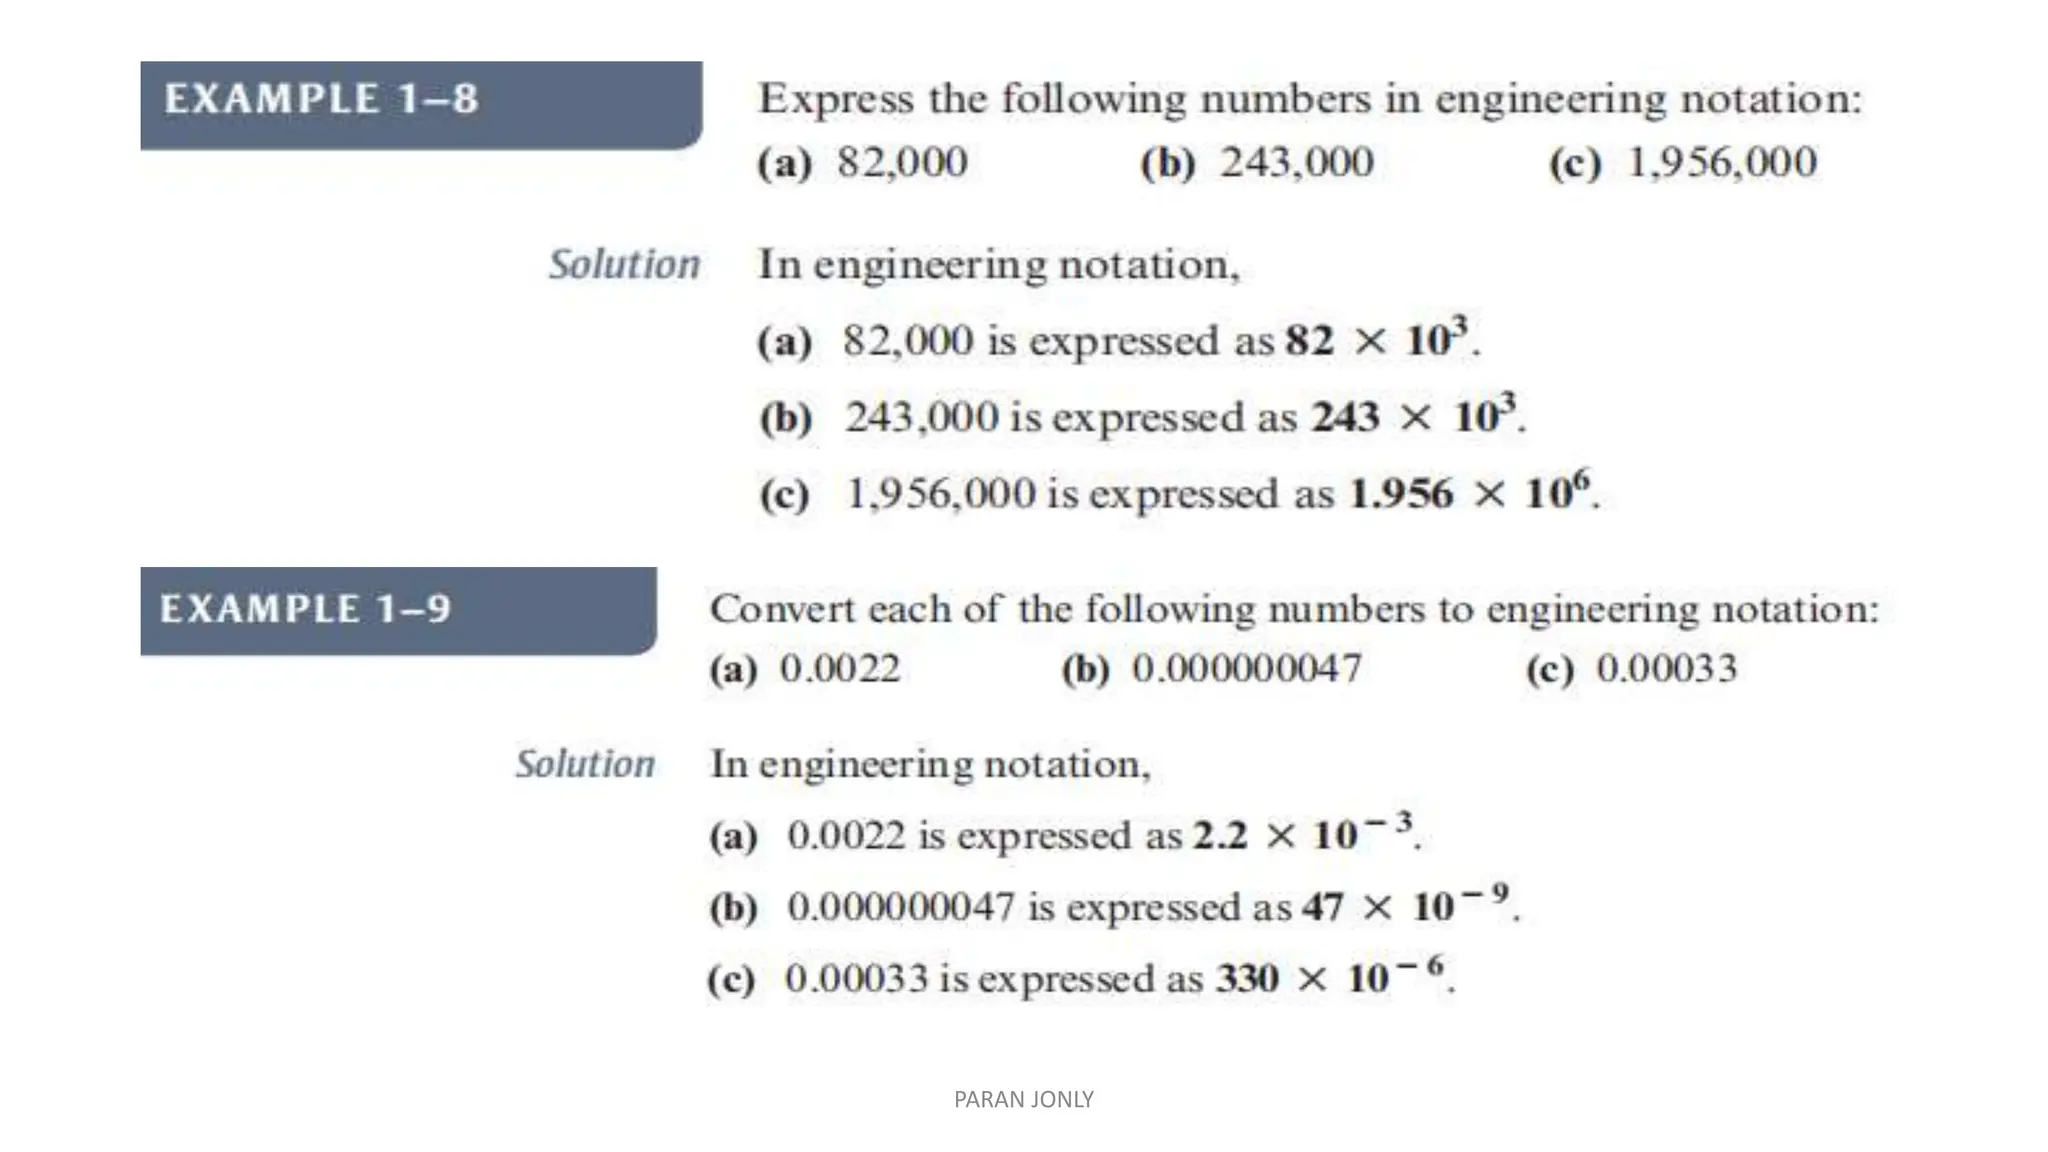
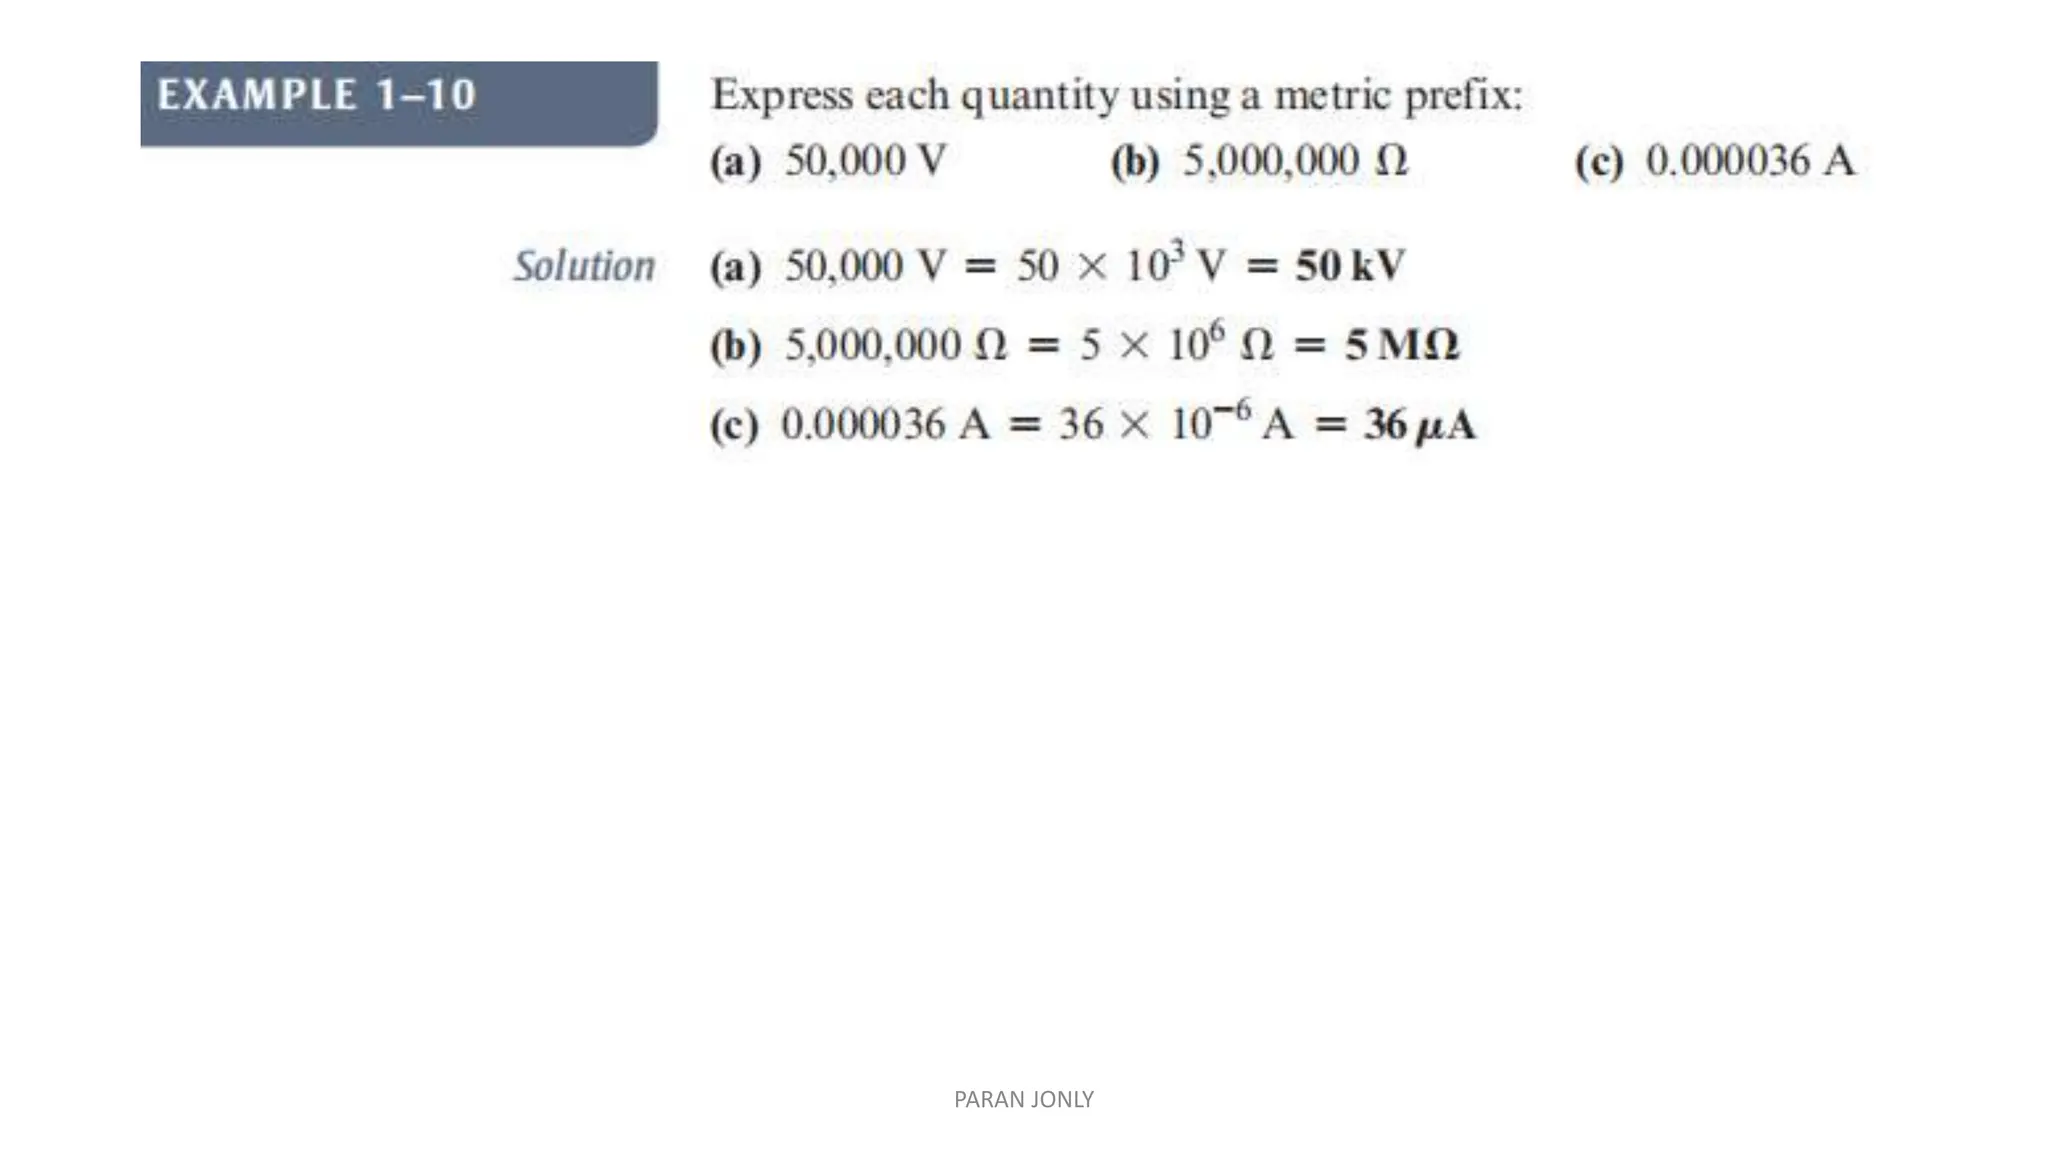
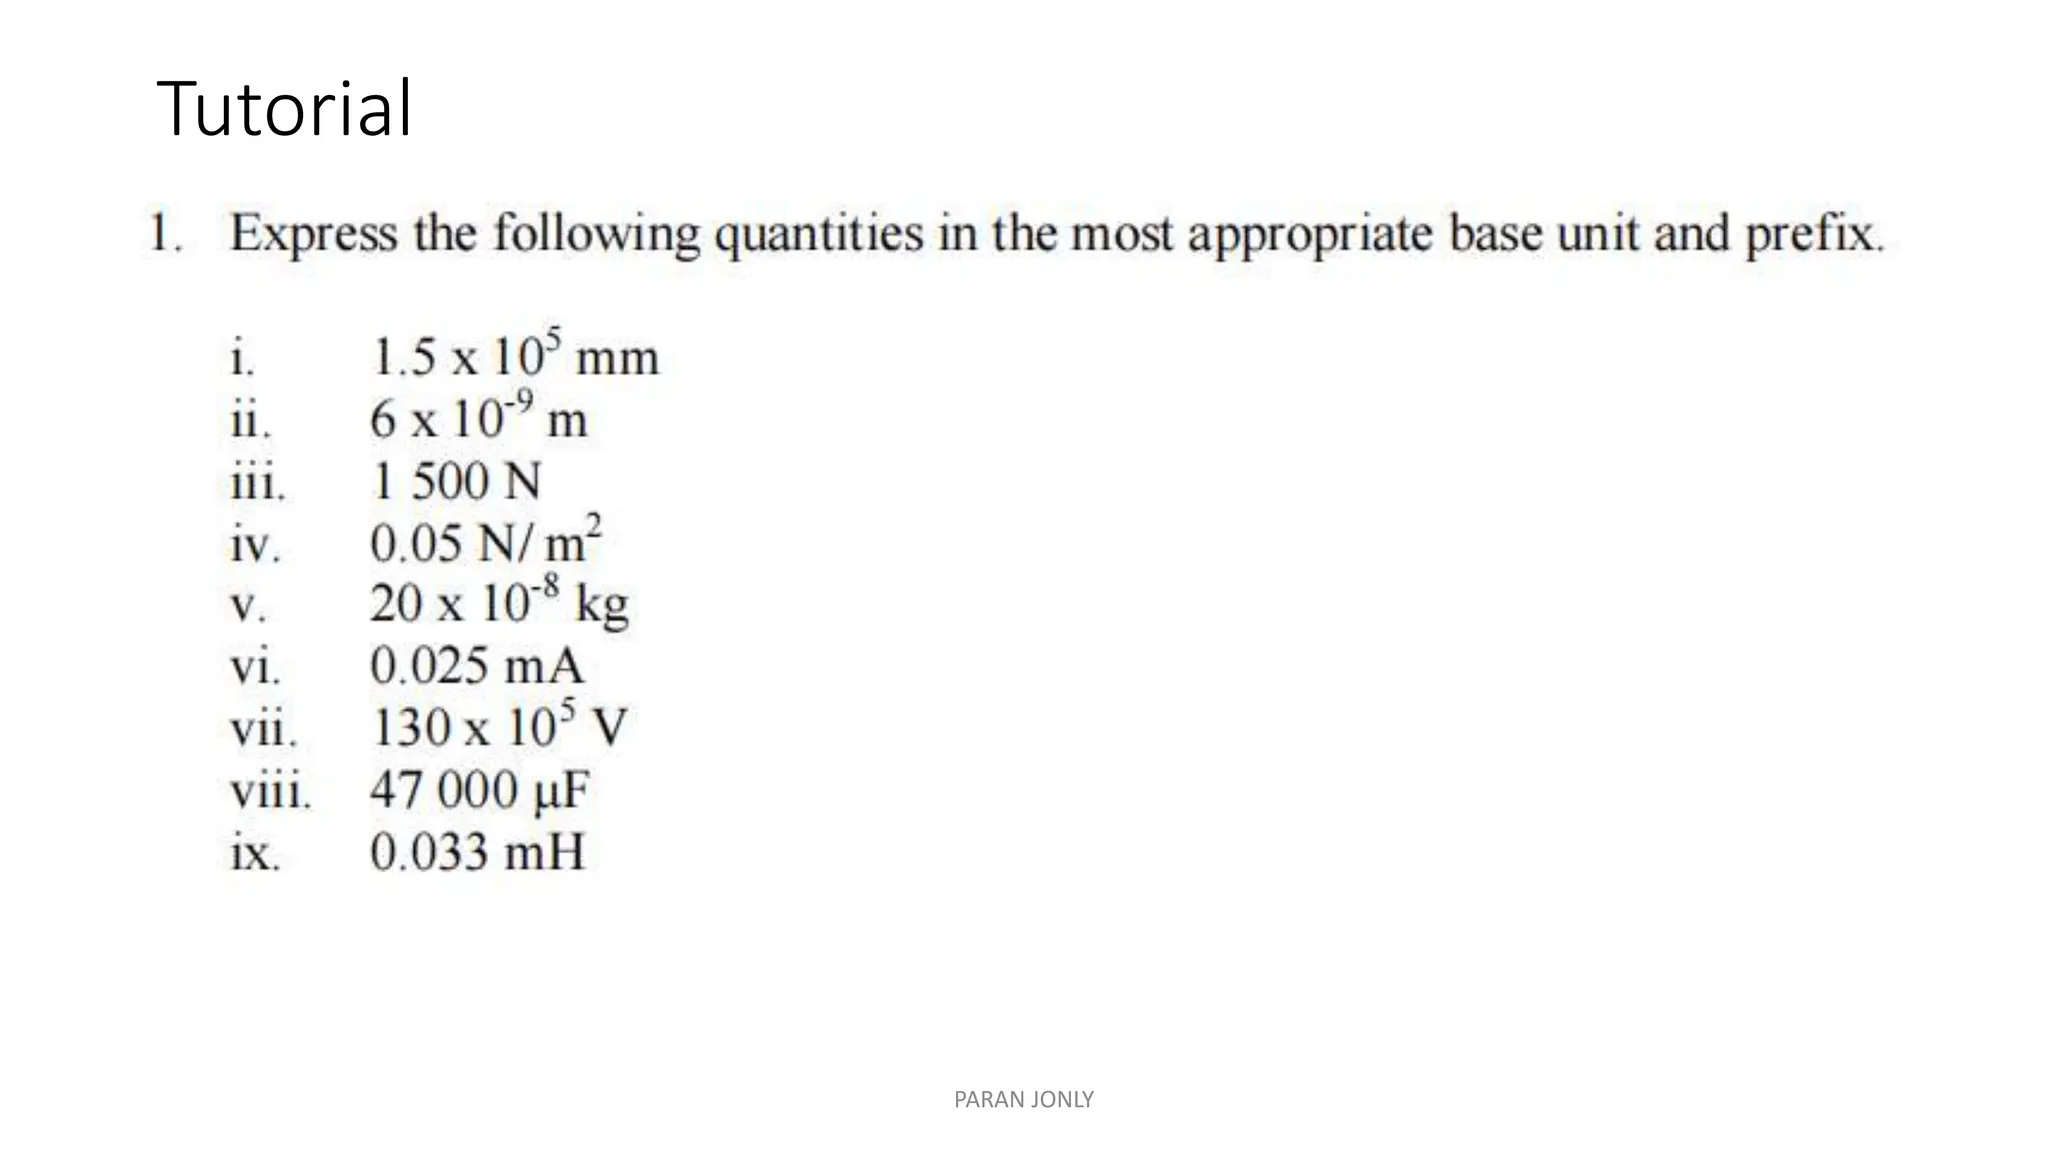
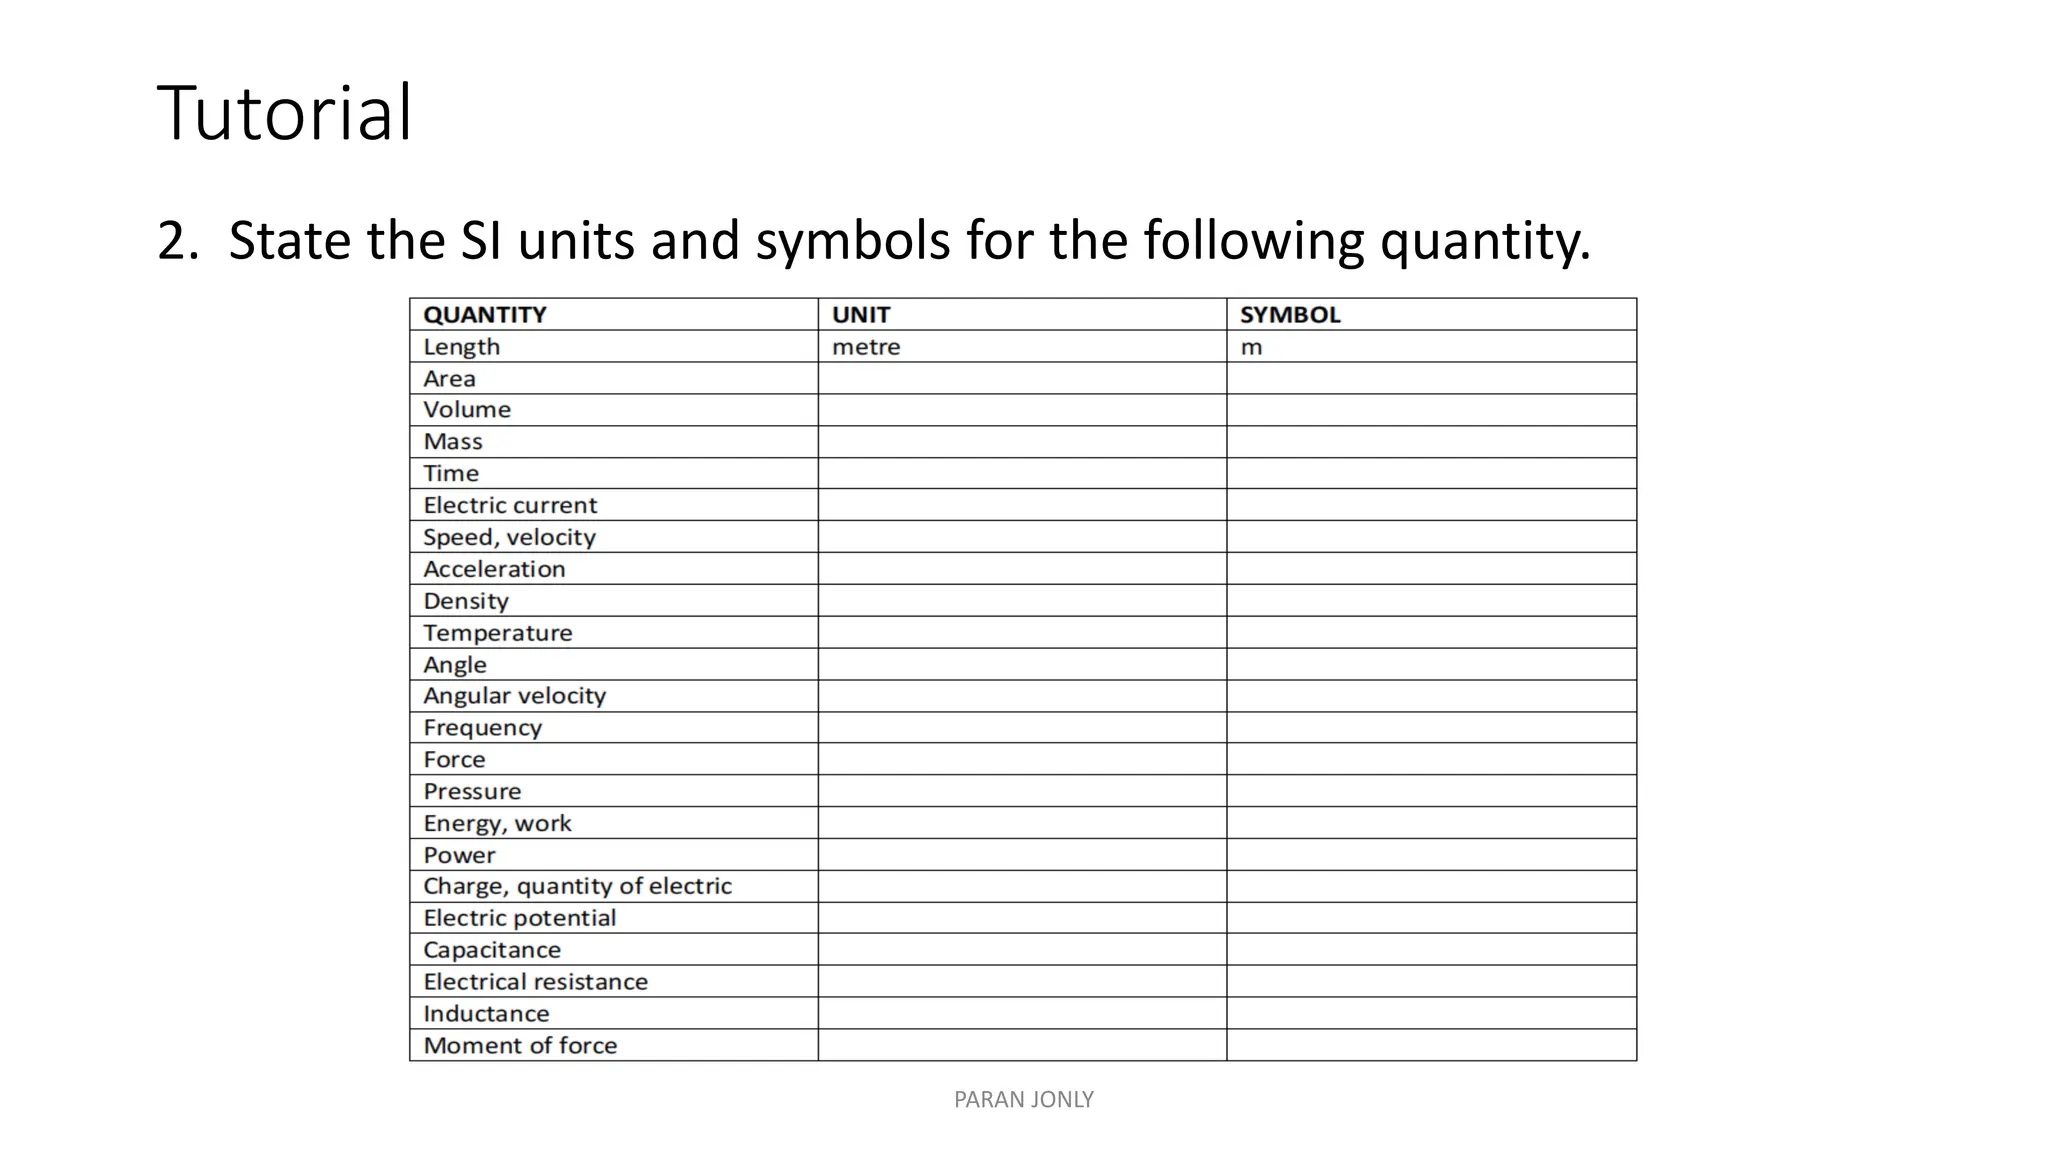
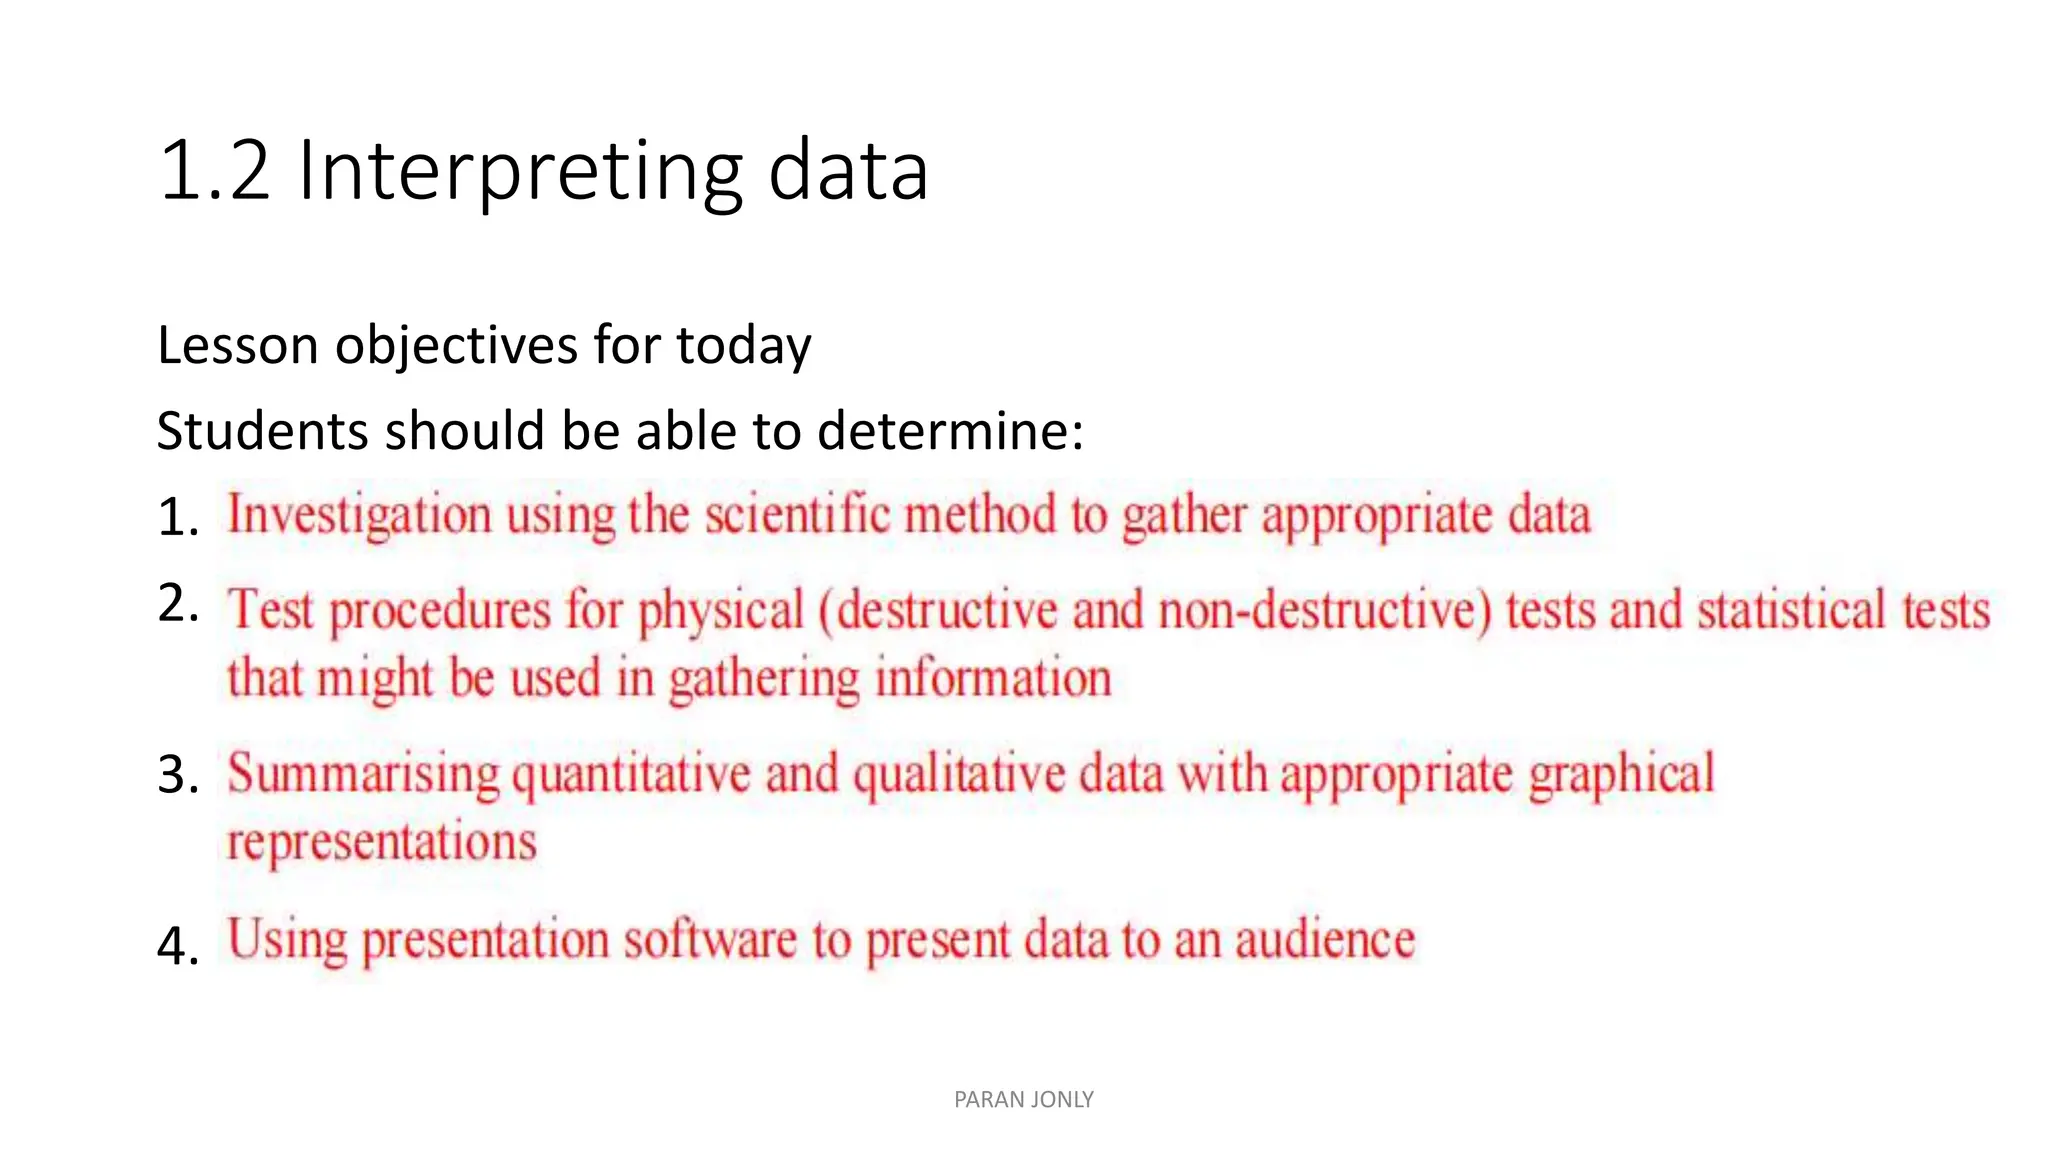
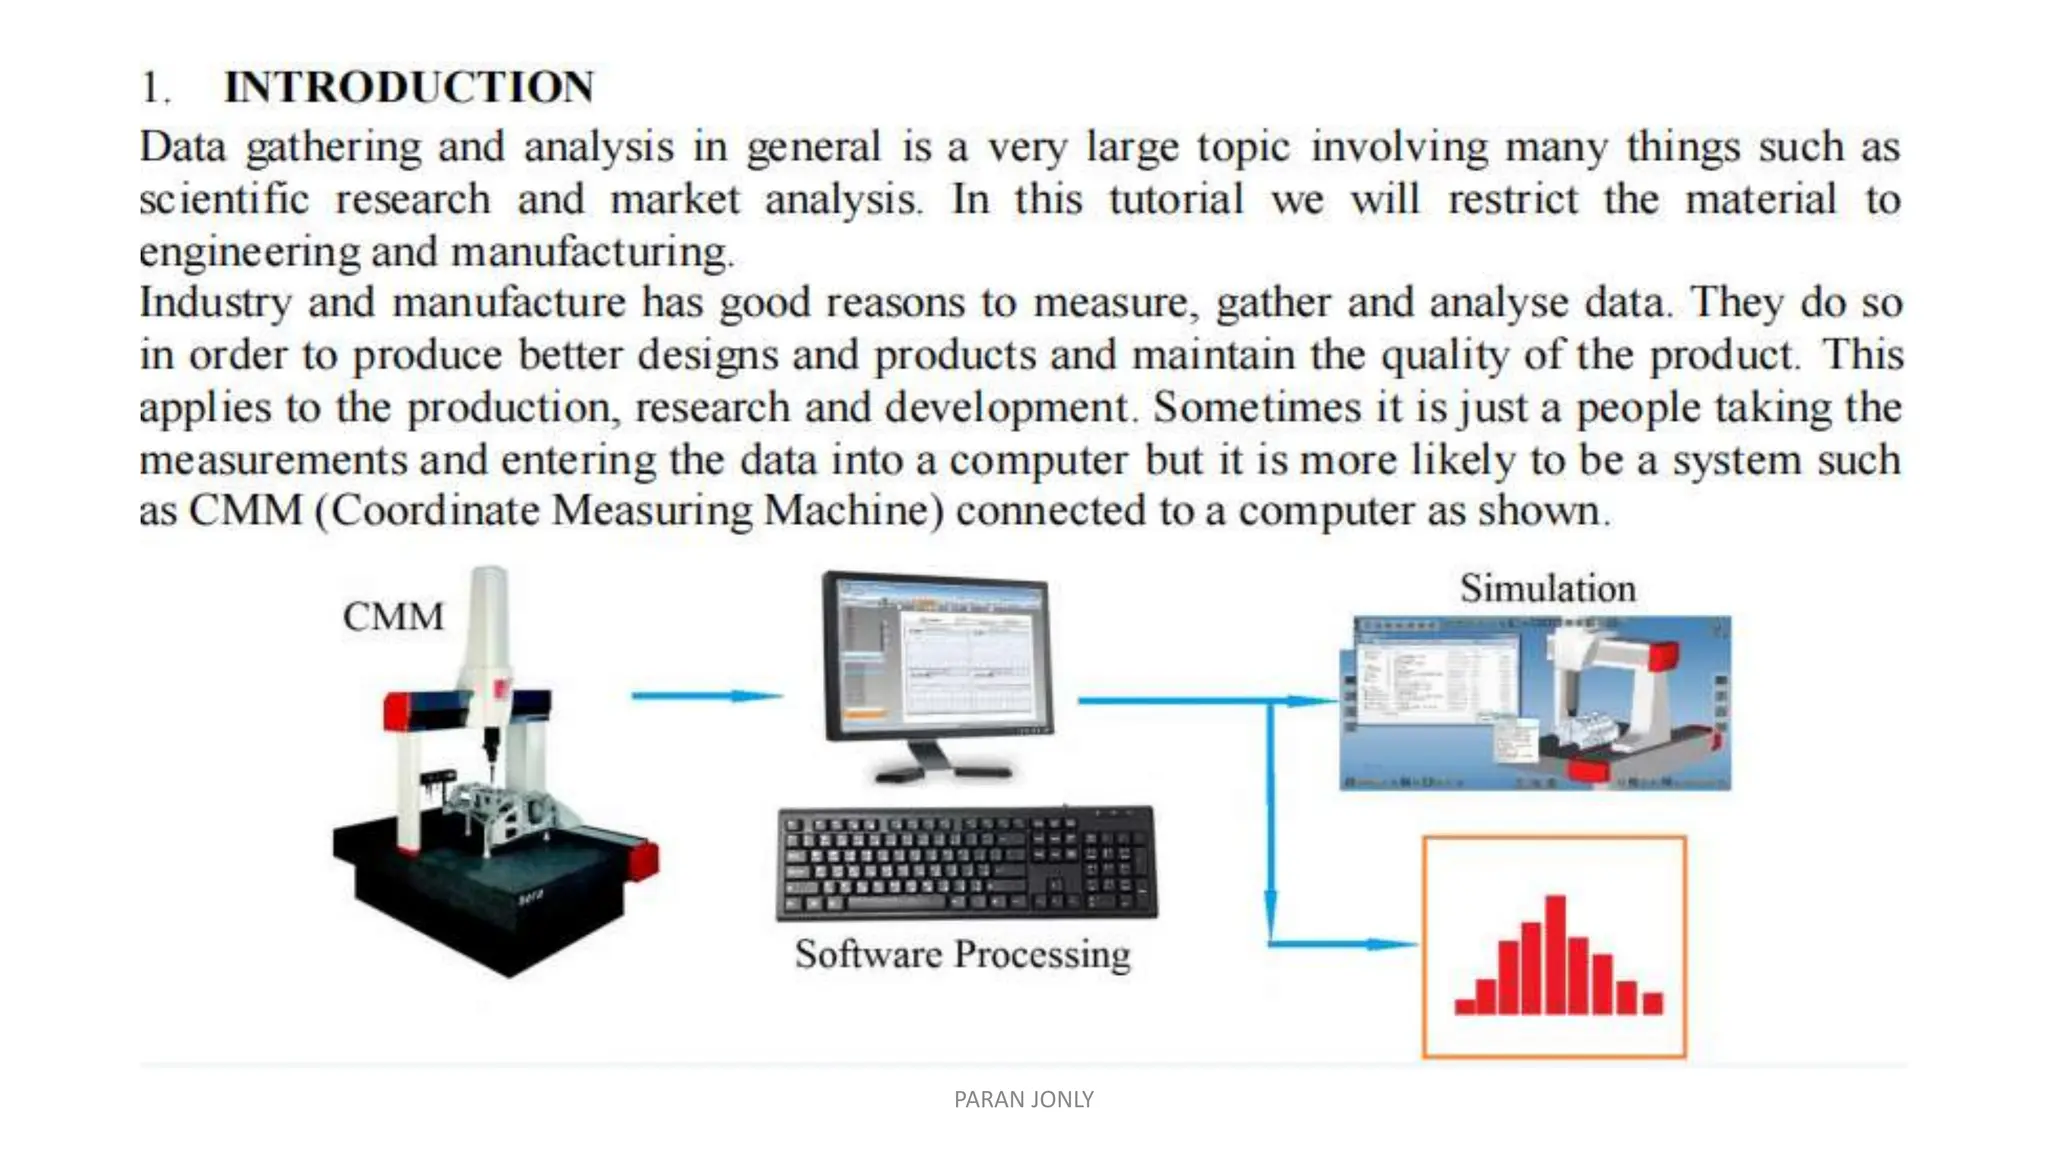
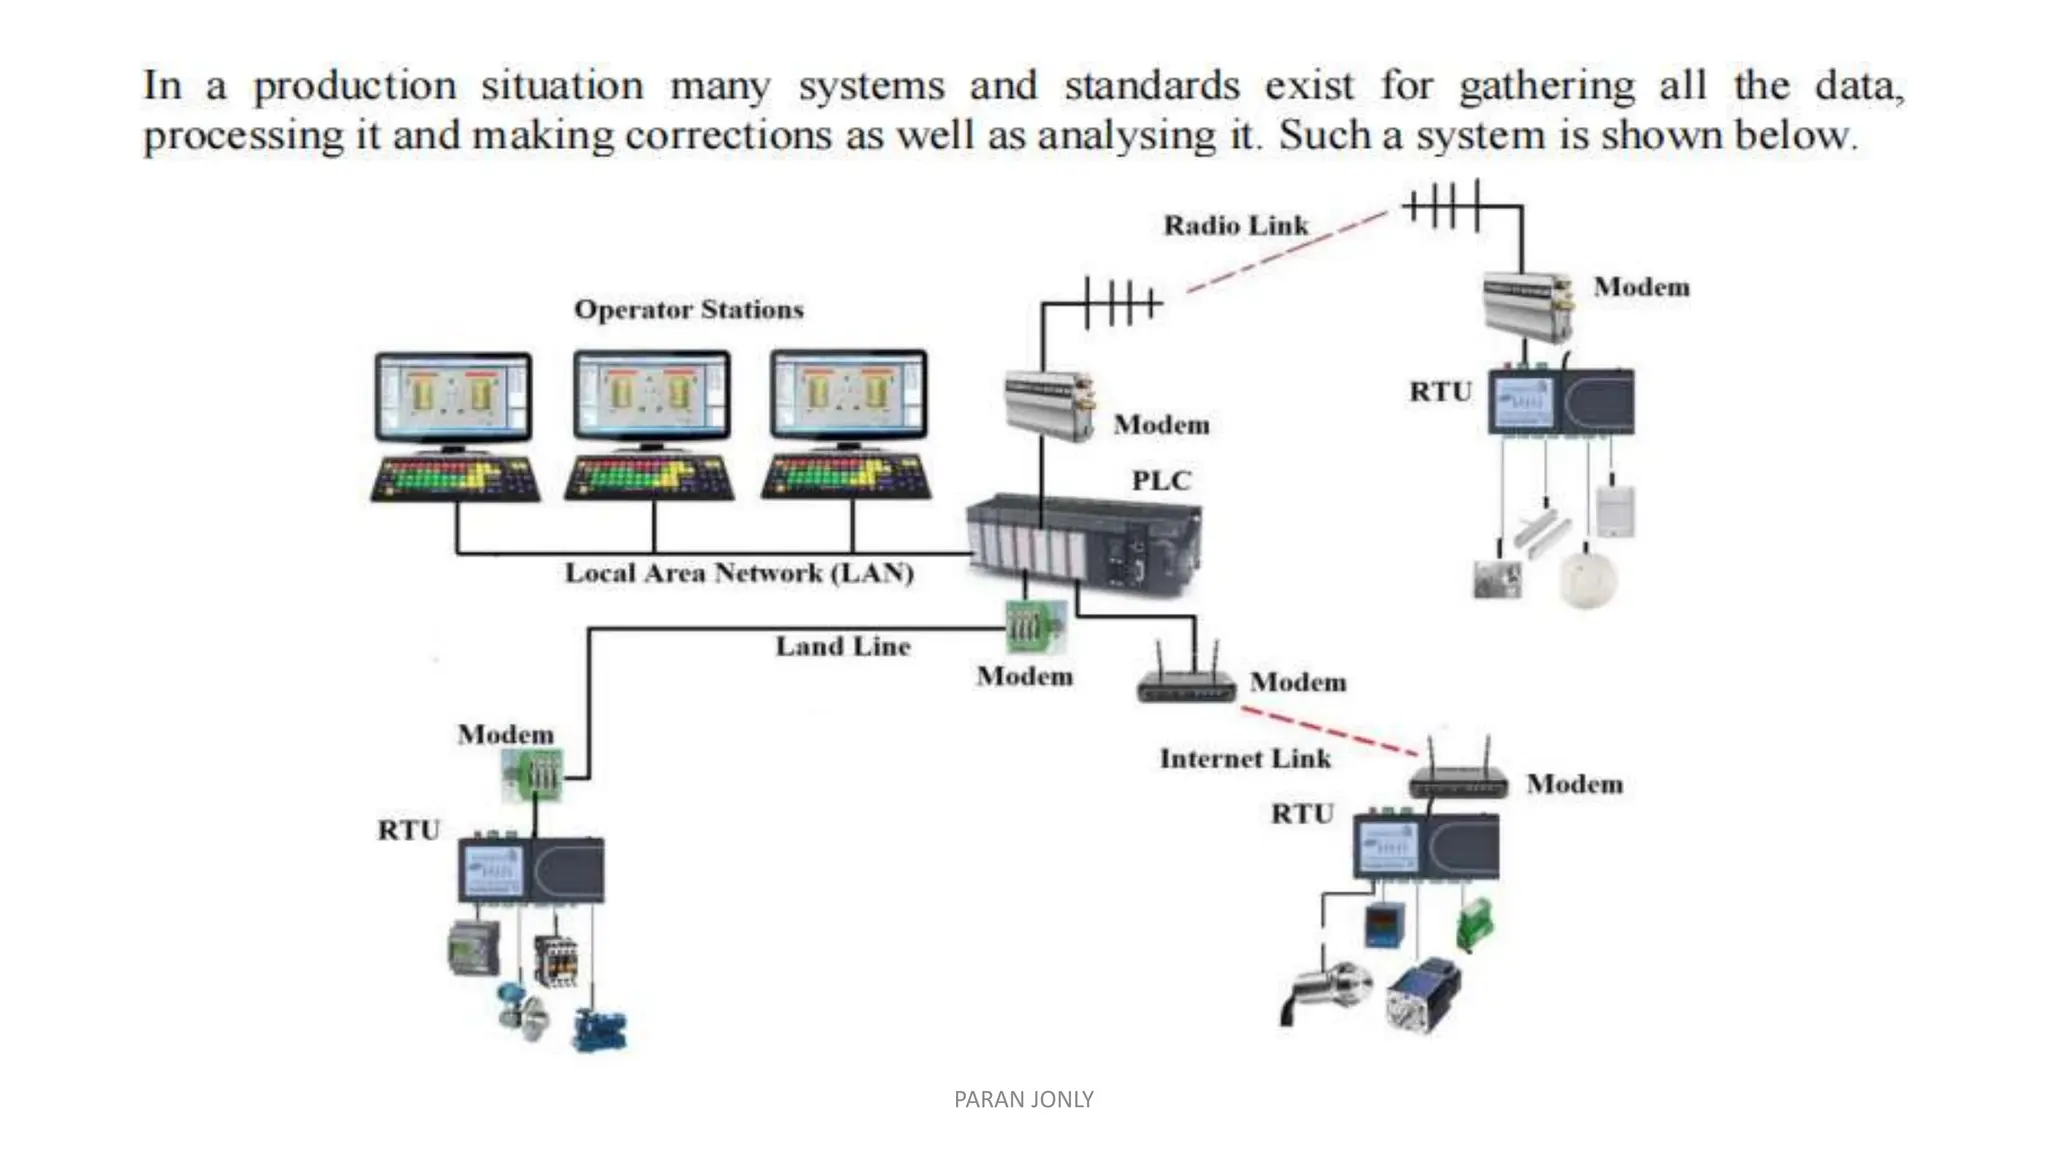
LEARNING OUTCOME 1:
EXAMINE SCIENTIFIC DATA USING BOTH
QUANTATIVE
AND COMPUTATIONAL METHODS
PEARSON BTEC LEVEL 5 HND DIPLOMA IN ELECTRICAL
AND ELECTRONIC ENGINEERING
ENGINEERING SCIENCE
T/615/1477
PARAN JONLY
LO1 Content Lists:
1.1. International system of units
1.1.1 The basic dimensions in the physical world and the corresponding SI base Units
1.1.2 SI derived units with special names and symbols
1.1.3 SI prefixes and their representation with engineering notation
1.2. Interpreting data
1.2.1 Investigation using the scientific method to gather appropriate data
1.2.2 Test procedures for physical (destructive and non-destructive) tests and statistical
tests that might be used in gathering information
1.2.3 Summarising quantitative and qualitative data with appropriate graphical
representations
1.2.4 Using presentation software to present data to an audience
PREPARED BY: Ts. PARAN JONLY
1.1 International System of Units
Lesson objectives for today
Students should be able to determine:
1. s
2. s
3. s
PARAN JONLY
PARAN JONLY
PARAN JONLY
PARAN JONLY
PARAN JONLY
PARAN JONLY
PARAN JONLY
PARAN JONLY
PARAN JONLY
PARAN JONLY
PARAN JONLY
PARAN JONLY
PARAN JONLY
PARAN JONLY
PARAN JONLY
PARAN JONLY
PARAN JONLY
6. Scientific Notation
• Scientific notation provides a convenient method to represent large
and small numbers and to perform calculations involving such
numbers.
• In scientific notation, a quantity is expressed as a product of a
number between 1 and 10 and a power of ten.
• For example, the quantity 150,000 is expressed in scientific notation
as 1.5 x 10^5, and the quantity 0.00022 is expressed as 2.2 x 10^-4.
PARAN JONLY
PARAN JONLY
PARAN JONLY
Engineering Notation
• Engineering notation is similar to scientific notation. However, in
engineering notation a number can have from one to three digits to
the left of the decimal point and the power-of-ten exponent must be
a multiple of three.
• For example, the number 33,000 expressed in engineering notation is
33 x 10^3. In scientific notation, it is expressed as 3.3 x 10^4.
• As another example, the number 0.045 expressed in engineering
notation is 45 x 10^-3. In scientific notation, it is expressed as 4.5 x
10^-2.
PARAN JONLY
PARAN JONLY
PARAN JONLY
Tutorial
PARAN JONLY
Tutorial
2. State the SI units and symbols for the following quantity.
PARAN JONLY
1.2 Interpreting data
Lesson objectives for today
Students should be able to determine:
1. s
2. s
3. s
4. r
PARAN JONLY
1.2.1 Investigation using the scientific method to
gather appropriate data
• The scientific method is a series of processes that people can use to
gather knowledge about the world around them, improve that
knowledge, and, through gaining knowledge, attempt to explain why
and/or how things occur.
• This method involves making observations, forming questions,
making hypotheses, doing an experiment, analyzing the data, and
forming a conclusion.
• Every scientific experiment performed is an example of the scientific
method in action, but it is also used by non-scientists in everyday
situations.
PARAN JONLY
Scientific Method Steps
• The exact steps of the scientific method vary from source to source,
but the general procedure is the same: acquiring knowledge through
observation and testing.
PARAN JONLY
1. Making an Observation
• Any information that you gather through your senses is an
observation.
• Scientists use standard tools and methods to make and record
observations.
Type of observation:
Qualitative Observation: Characteristics or observations that describe.
Ex. The mouse is gray.
Quantitative Observation: Observation that uses numbers to describe
Ex. The mouse is 10cm long
PARAN JONLY
2. Asking a Question
• Asking a question helps focus the purpose of the investigation. Scientists often
ask a question after making an observation.
• For example, students observing deformed frogs might ask, “Could something
in the water be causing the deformities?”
3. Forming a Hypothesis
• Hypothesis is a possible explanation or answer to a question that is based on
observation and can be tested. aka: Educated Guess
• A statement of cause and effect that can be used to set up a test for a
hypothesis is called a prediction.
Example
• Will an ice cube float in water?
• If an ice cube is placed in water, then it will float.
PARAN JONLY
4. Performing an Experiment
• Under Control - A controlled experiment tests only one factor at a
time and consists of a control group and one or more experimental
groups.
• Designing an Experiment - Designing a good experiment requires
planning and a consideration of all factors.
• Independent Variable - The factor that can be changed.
• Dependent Variable - What you measure in an experiment and what
is affected during the experiment.
• Collecting Data - Scientists keep clear, accurate, honest records of
their data so that other scientists can repeat the experiment and
verify the results.
PARAN JONLY
5. Analyzing Data
• After they finish their tests, scientists must analyze the results. Analyzing the
results helps scientists explain and focus on the effect of the variable.
6. Forming a Conclusion
• Scientists must conclude if the results of their tests support the hypothesis.
• Proving that a hypothesis is not true can be as valuable as proving that it is
true.
7. Communicate Results
• After finishing an investigation, scientists communicate their results. Sharing
allows other scientists to repeat experiments to see if they get the same
results.
• Sometimes, new data lead scientists to change their hypotheses.
PARAN JONLY
PARAN JONLY
PARAN JONLY
PARAN JONLY
1.2.2 Test Procedures for physical (destructive & non-
destructive) tests and statistical tests
PARAN JONLY
PARAN JONLY
PARAN JONLY
PARAN JONLY
PARAN JONLY
PARAN JONLY
PARAN JONLY
1.2.3. Summarising quantitative and qualitative
data with appropriate graphical representations.
Tabular and Graphical Procedures
PARAN JONLY
PARAN JONLY
Mean, Mode & Median
1. The mean is the average of a data set.
2. The mode is the most common number in a data set.
3. The median is the middle of the set of numbers.
PARAN JONLY
Refer to this page
• Study this page as it related to the example in the next page.
• https://courses.lumenlearning.com/introstats1/chapter/histograms-
frequency-polygons-and-time-series-graphs/
PARAN JONLY
PARAN JONLY
PARAN JONLY
PARAN JONLY
PARAN JONLY
PARAN JONLY
Example 1
Guests staying at Marada Inn were asked to rate the quality of their
accommodations as being excellent, above average, average, below
average, or poor. The ratings provided by a sample of 20 guests are:
PARAN JONLY
Solution
PARAN JONLY
Example 2
Hudson Auto Repair
The manager of Hudson Auto would like to have a better understanding
of the cost of parts used in the engine tune-ups performed in the shop.
She examines 50 customer invoices for tune-ups. The costs of parts,
rounded to the nearest dollar, are listed on the next slide.
Sample of Parts Cost for 50 Tune-ups
PARAN JONLY
Solution:
PARAN JONLY
PARAN JONLY
PARAN JONLY
Then plot a scatter/dot diagram and histogram using Microsoft excel.
PARAN JONLY
Your dot plot should be look like this
PARAN JONLY
PARAN JONLY
Your histogram should be look like this
PARAN JONLY
PARAN JONLY
PARAN JONLY
PARAN JONLY
PARAN JONLY
PARAN JONLY
PARAN JONLY
PARAN JONLY
PARAN JONLY
Exercise
The tensile strength in megapascals for 15 samples of tin were determined
and found to be:
34.61, 34.57, 34.40, 34.63, 34.63, 34.51, 34.49, 34.61, 34.52, 34.55,
34.58, 34.53, 34.44, 34.48 and 34.40
Calculate the mean and standard deviation from the mean for these 15
values, correct to 4 significant figures.
34.53 MPa, standard deviation 0.07474 MPa
PARAN JONLY

Scientific Data Using Quantitative and Qualitative Data

  • 1.
    LEARNING OUTCOME 1: EXAMINESCIENTIFIC DATA USING BOTH QUANTATIVE AND COMPUTATIONAL METHODS PEARSON BTEC LEVEL 5 HND DIPLOMA IN ELECTRICAL AND ELECTRONIC ENGINEERING ENGINEERING SCIENCE T/615/1477 PARAN JONLY
  • 2.
    LO1 Content Lists: 1.1.International system of units 1.1.1 The basic dimensions in the physical world and the corresponding SI base Units 1.1.2 SI derived units with special names and symbols 1.1.3 SI prefixes and their representation with engineering notation 1.2. Interpreting data 1.2.1 Investigation using the scientific method to gather appropriate data 1.2.2 Test procedures for physical (destructive and non-destructive) tests and statistical tests that might be used in gathering information 1.2.3 Summarising quantitative and qualitative data with appropriate graphical representations 1.2.4 Using presentation software to present data to an audience PREPARED BY: Ts. PARAN JONLY
  • 3.
    1.1 International Systemof Units Lesson objectives for today Students should be able to determine: 1. s 2. s 3. s PARAN JONLY
  • 4.
  • 5.
  • 6.
  • 7.
  • 8.
  • 9.
  • 10.
  • 11.
  • 12.
  • 13.
  • 14.
  • 15.
  • 16.
  • 17.
  • 18.
  • 19.
  • 20.
    6. Scientific Notation •Scientific notation provides a convenient method to represent large and small numbers and to perform calculations involving such numbers. • In scientific notation, a quantity is expressed as a product of a number between 1 and 10 and a power of ten. • For example, the quantity 150,000 is expressed in scientific notation as 1.5 x 10^5, and the quantity 0.00022 is expressed as 2.2 x 10^-4. PARAN JONLY
  • 21.
  • 22.
  • 23.
    Engineering Notation • Engineeringnotation is similar to scientific notation. However, in engineering notation a number can have from one to three digits to the left of the decimal point and the power-of-ten exponent must be a multiple of three. • For example, the number 33,000 expressed in engineering notation is 33 x 10^3. In scientific notation, it is expressed as 3.3 x 10^4. • As another example, the number 0.045 expressed in engineering notation is 45 x 10^-3. In scientific notation, it is expressed as 4.5 x 10^-2. PARAN JONLY
  • 24.
  • 25.
  • 26.
  • 27.
    Tutorial 2. State theSI units and symbols for the following quantity. PARAN JONLY
  • 28.
    1.2 Interpreting data Lessonobjectives for today Students should be able to determine: 1. s 2. s 3. s 4. r PARAN JONLY
  • 29.
    1.2.1 Investigation usingthe scientific method to gather appropriate data • The scientific method is a series of processes that people can use to gather knowledge about the world around them, improve that knowledge, and, through gaining knowledge, attempt to explain why and/or how things occur. • This method involves making observations, forming questions, making hypotheses, doing an experiment, analyzing the data, and forming a conclusion. • Every scientific experiment performed is an example of the scientific method in action, but it is also used by non-scientists in everyday situations. PARAN JONLY
  • 30.
    Scientific Method Steps •The exact steps of the scientific method vary from source to source, but the general procedure is the same: acquiring knowledge through observation and testing. PARAN JONLY
  • 31.
    1. Making anObservation • Any information that you gather through your senses is an observation. • Scientists use standard tools and methods to make and record observations. Type of observation: Qualitative Observation: Characteristics or observations that describe. Ex. The mouse is gray. Quantitative Observation: Observation that uses numbers to describe Ex. The mouse is 10cm long PARAN JONLY
  • 32.
    2. Asking aQuestion • Asking a question helps focus the purpose of the investigation. Scientists often ask a question after making an observation. • For example, students observing deformed frogs might ask, “Could something in the water be causing the deformities?” 3. Forming a Hypothesis • Hypothesis is a possible explanation or answer to a question that is based on observation and can be tested. aka: Educated Guess • A statement of cause and effect that can be used to set up a test for a hypothesis is called a prediction. Example • Will an ice cube float in water? • If an ice cube is placed in water, then it will float. PARAN JONLY
  • 33.
    4. Performing anExperiment • Under Control - A controlled experiment tests only one factor at a time and consists of a control group and one or more experimental groups. • Designing an Experiment - Designing a good experiment requires planning and a consideration of all factors. • Independent Variable - The factor that can be changed. • Dependent Variable - What you measure in an experiment and what is affected during the experiment. • Collecting Data - Scientists keep clear, accurate, honest records of their data so that other scientists can repeat the experiment and verify the results. PARAN JONLY
  • 34.
    5. Analyzing Data •After they finish their tests, scientists must analyze the results. Analyzing the results helps scientists explain and focus on the effect of the variable. 6. Forming a Conclusion • Scientists must conclude if the results of their tests support the hypothesis. • Proving that a hypothesis is not true can be as valuable as proving that it is true. 7. Communicate Results • After finishing an investigation, scientists communicate their results. Sharing allows other scientists to repeat experiments to see if they get the same results. • Sometimes, new data lead scientists to change their hypotheses. PARAN JONLY
  • 35.
  • 36.
  • 37.
  • 38.
    1.2.2 Test Proceduresfor physical (destructive & non- destructive) tests and statistical tests PARAN JONLY
  • 39.
  • 40.
  • 41.
  • 42.
  • 43.
  • 44.
  • 45.
    1.2.3. Summarising quantitativeand qualitative data with appropriate graphical representations. Tabular and Graphical Procedures PARAN JONLY
  • 46.
  • 47.
    Mean, Mode &Median 1. The mean is the average of a data set. 2. The mode is the most common number in a data set. 3. The median is the middle of the set of numbers. PARAN JONLY
  • 48.
    Refer to thispage • Study this page as it related to the example in the next page. • https://courses.lumenlearning.com/introstats1/chapter/histograms- frequency-polygons-and-time-series-graphs/ PARAN JONLY
  • 49.
  • 50.
  • 51.
  • 52.
  • 53.
  • 54.
    Example 1 Guests stayingat Marada Inn were asked to rate the quality of their accommodations as being excellent, above average, average, below average, or poor. The ratings provided by a sample of 20 guests are: PARAN JONLY
  • 55.
  • 56.
    Example 2 Hudson AutoRepair The manager of Hudson Auto would like to have a better understanding of the cost of parts used in the engine tune-ups performed in the shop. She examines 50 customer invoices for tune-ups. The costs of parts, rounded to the nearest dollar, are listed on the next slide. Sample of Parts Cost for 50 Tune-ups PARAN JONLY
  • 57.
  • 58.
  • 59.
  • 60.
    Then plot ascatter/dot diagram and histogram using Microsoft excel. PARAN JONLY
  • 61.
    Your dot plotshould be look like this PARAN JONLY
  • 62.
  • 63.
    Your histogram shouldbe look like this PARAN JONLY
  • 64.
  • 65.
  • 66.
  • 67.
  • 68.
  • 69.
  • 70.
  • 71.
  • 72.
    Exercise The tensile strengthin megapascals for 15 samples of tin were determined and found to be: 34.61, 34.57, 34.40, 34.63, 34.63, 34.51, 34.49, 34.61, 34.52, 34.55, 34.58, 34.53, 34.44, 34.48 and 34.40 Calculate the mean and standard deviation from the mean for these 15 values, correct to 4 significant figures. 34.53 MPa, standard deviation 0.07474 MPa PARAN JONLY