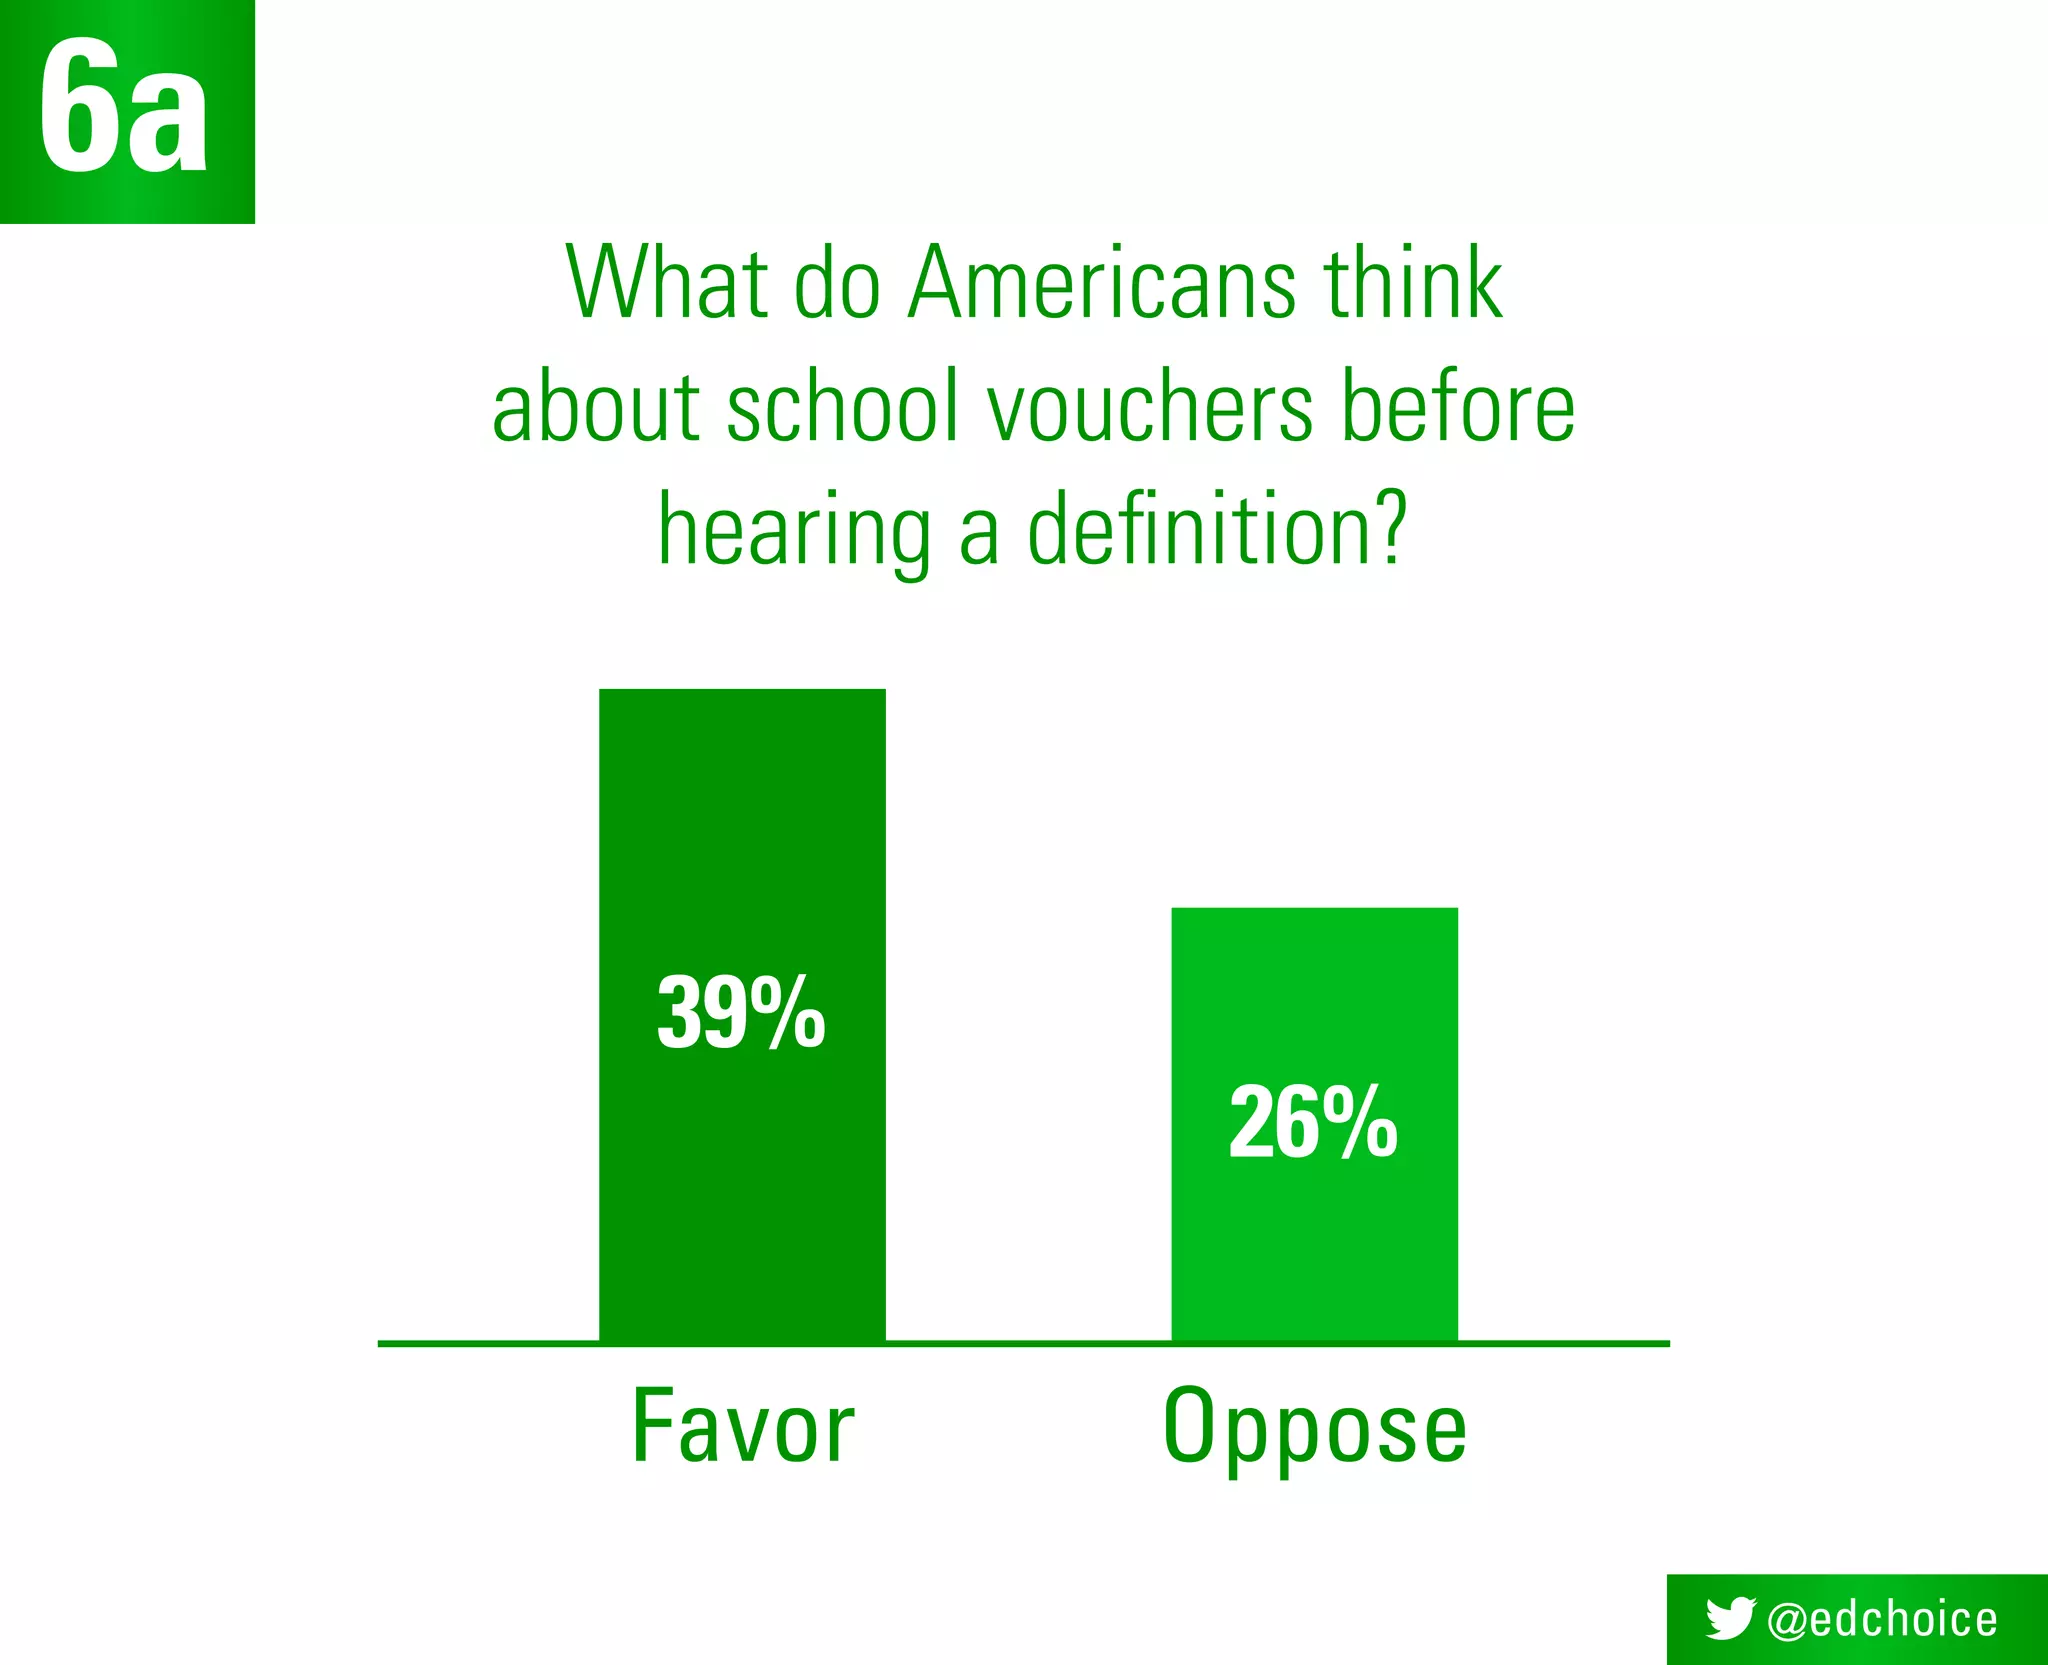
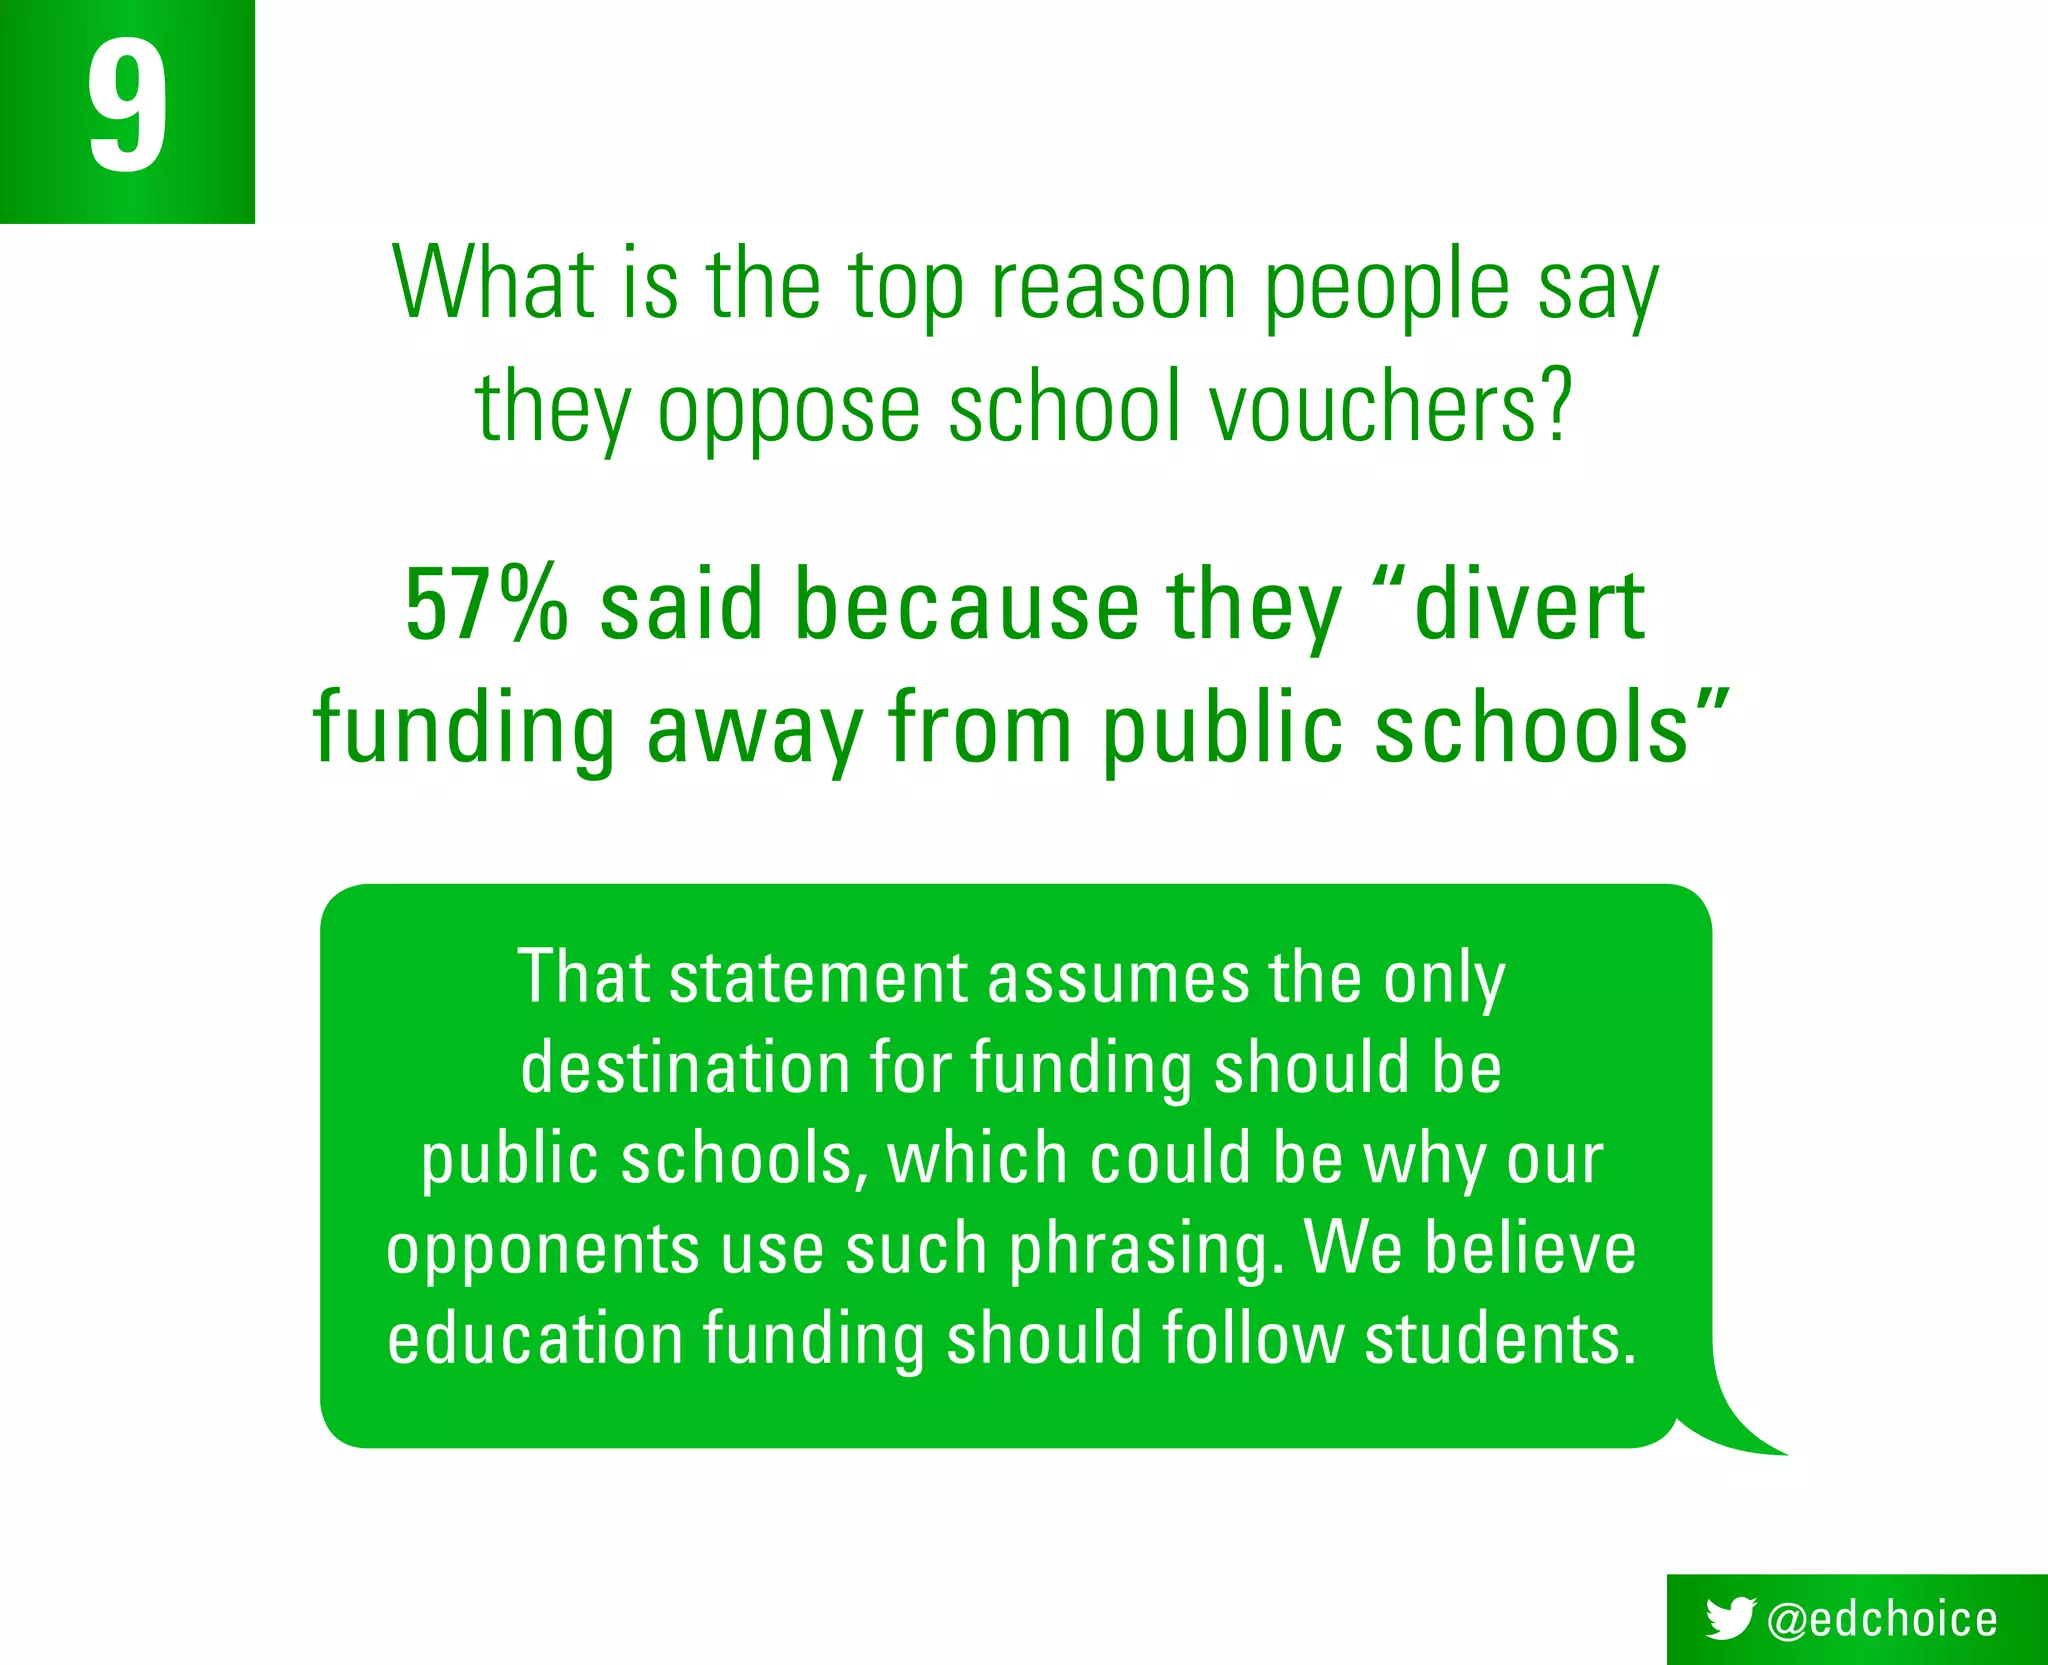
TOP 15
FINDINGS
By the Friedman Foundation for Educational Choice
edchoice.org/NationalSurvey2015
SCHOOLING IN
AMERICA SURVEY
FROM THE
2015
@edchoice
How many people rank education
as the No. 1 issue facing America?
One out of six
1
@edchoice
How do Americans rate
the federal government’s
performance in K–12 education?
Fair/Poor
Good/Excellent
77%
20%
2
@edchoice
Do Americans roughly know how much
we spend per pupil on K–12 education?
The national average per-pupil
spending amount is nearly $10,700.
Do
Don’t
3
14%
86%
@edchoice
How do public school parents rate
their local public schools?
A or B C D or F
4
47%
34%
17%
@edchoice
Which school type do Americans say
they would prefer their children attend?
5
vs. actual enrollments:
PRIVATE SCHOOL
PUBLIC SCHOOL
CHARTER SCHOOL
HOME SCHOOL
41%
36%
12%
9%
9.4%
83.8%
4%
2.8%
PRIVATE SCHOOL
PUBLIC SCHOOL
CHARTER SCHOOL
HOME SCHOOL
@edchoice
What do Americans think
about school vouchers before
hearing a definition?
6a
Favor Oppose
39%
26%
@edchoice
After hearing a definition
of school vouchers, do
Americans’ opinions change?
6b
Favor FavorOppose Oppose
61% 63%
33% 30%
General Public School Parents
@edchoice
How many Americans are unfamiliar
with the concept of school vouchers?
Our
estimate:
35%
7
@edchoice
What are Americans’ top two
reasons for supporting vouchers?
8
1.
2.
Access to schools having
better academics (38%)
More freedom and flexibility
for parents (28%)
@edchoice
What is the top reason people say
they oppose school vouchers?
9
57% said because they “divert
funding away from public schools”
That statement assumes the only
destination for funding should be
public schools, which could be why our
opponents use such phrasing. We believe
education funding should follow students.
@edchoice
What do Americans think about
education savings accounts (ESAs)?
10
General Public School Parents
66% of split-sample respondents
said ESAs should be universal
62% Favor 63% Favor
28% Oppose 27% Oppose
10% Don’t Know
	/Refused
10% Don’t Know
	/Refused
@edchoice
What do Americans think about
tax-credit scholarships?
11
Favor FavorOppose Oppose
60% 61%
29% 27%
General Public School Parents
@edchoice
What do school parents
think of testing?
12
48% of school parents say kids
spend 16 days or more—nearly one
in 10 days of the school year—on
standardized testing
47% of school parents say
the amount of time spent on
standardized testing is “too high”
@edchoice
When it comes to state government
intervention in schools with low student
performance, how many Americans rate each
of these solutions as useful for families?
13
said supply vouchers/scholarships
said convert them to charter schools
said replace personnel
said close the school
41%
26%
25%
18%
@edchoice
What do Americans think about
Common Core State Standards?
14
General Public School Parents
50% Favor 47% Favor
40% Oppose 46% Oppose
10% Don’t Know
	/Refused
7% Don’t Know
	/Refused
Strongly Favor Strongly Oppose
19% 24%
@edchoice
How do education interest
groups influence voters with their
endorsements of political candidates?
15
POSITIVELY NEGATIVELY
VS.
Teachers’
Union
Teachers’
Union
Parent
Advocacy
Group
Parent
Advocacy
Group
46%
25%
50%
16%
For more on this report, visit
edchoice.org/NationalSurvey2015
To contact the author,
Research Director Paul DiPerna,
email paul@edchoice.org.

Top 15 Findings from the 2015 Schooling in America Survey

  • 1.
    TOP 15 FINDINGS By theFriedman Foundation for Educational Choice edchoice.org/NationalSurvey2015 SCHOOLING IN AMERICA SURVEY FROM THE 2015
  • 2.
    @edchoice How many peoplerank education as the No. 1 issue facing America? One out of six 1
  • 3.
    @edchoice How do Americansrate the federal government’s performance in K–12 education? Fair/Poor Good/Excellent 77% 20% 2
  • 4.
    @edchoice Do Americans roughlyknow how much we spend per pupil on K–12 education? The national average per-pupil spending amount is nearly $10,700. Do Don’t 3 14% 86%
  • 5.
    @edchoice How do publicschool parents rate their local public schools? A or B C D or F 4 47% 34% 17%
  • 6.
    @edchoice Which school typedo Americans say they would prefer their children attend? 5 vs. actual enrollments: PRIVATE SCHOOL PUBLIC SCHOOL CHARTER SCHOOL HOME SCHOOL 41% 36% 12% 9% 9.4% 83.8% 4% 2.8% PRIVATE SCHOOL PUBLIC SCHOOL CHARTER SCHOOL HOME SCHOOL
  • 7.
    @edchoice What do Americansthink about school vouchers before hearing a definition? 6a Favor Oppose 39% 26%
  • 8.
    @edchoice After hearing adefinition of school vouchers, do Americans’ opinions change? 6b Favor FavorOppose Oppose 61% 63% 33% 30% General Public School Parents
  • 9.
    @edchoice How many Americansare unfamiliar with the concept of school vouchers? Our estimate: 35% 7
  • 10.
    @edchoice What are Americans’top two reasons for supporting vouchers? 8 1. 2. Access to schools having better academics (38%) More freedom and flexibility for parents (28%)
  • 11.
    @edchoice What is thetop reason people say they oppose school vouchers? 9 57% said because they “divert funding away from public schools” That statement assumes the only destination for funding should be public schools, which could be why our opponents use such phrasing. We believe education funding should follow students.
  • 12.
    @edchoice What do Americansthink about education savings accounts (ESAs)? 10 General Public School Parents 66% of split-sample respondents said ESAs should be universal 62% Favor 63% Favor 28% Oppose 27% Oppose 10% Don’t Know /Refused 10% Don’t Know /Refused
  • 13.
    @edchoice What do Americansthink about tax-credit scholarships? 11 Favor FavorOppose Oppose 60% 61% 29% 27% General Public School Parents
  • 14.
    @edchoice What do schoolparents think of testing? 12 48% of school parents say kids spend 16 days or more—nearly one in 10 days of the school year—on standardized testing 47% of school parents say the amount of time spent on standardized testing is “too high”
  • 15.
    @edchoice When it comesto state government intervention in schools with low student performance, how many Americans rate each of these solutions as useful for families? 13 said supply vouchers/scholarships said convert them to charter schools said replace personnel said close the school 41% 26% 25% 18%
  • 16.
    @edchoice What do Americansthink about Common Core State Standards? 14 General Public School Parents 50% Favor 47% Favor 40% Oppose 46% Oppose 10% Don’t Know /Refused 7% Don’t Know /Refused Strongly Favor Strongly Oppose 19% 24%
  • 17.
    @edchoice How do educationinterest groups influence voters with their endorsements of political candidates? 15 POSITIVELY NEGATIVELY VS. Teachers’ Union Teachers’ Union Parent Advocacy Group Parent Advocacy Group 46% 25% 50% 16%
  • 18.
    For more onthis report, visit edchoice.org/NationalSurvey2015 To contact the author, Research Director Paul DiPerna, email paul@edchoice.org.