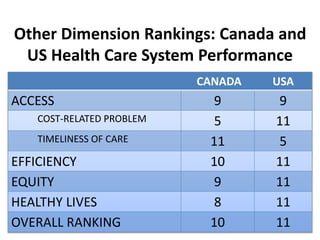
International Health Policy and Practice:
Comparing the U.S. and Canada on
Effectiveness and Patient-centered Care
Eric Schneider, MD, MSc
Senior Vice President for Policy and Research
Outline
• Why compare countries’ health care systems?
• The Commonwealth Fund International Survey
Program
• Are we as good as our neighbors to the
north/south?
Why Compare Countries’ Health Care Systems?
“Americans have the best
health care system in the
world” - 2004
President Delivers State
of the Union Speech
International Trends in Health Spending
Health spending per capita
($US PPP)
Total health spending as
percent of GDP
Note: PPP = Purchasing power parity.
Source: OECD Health Data 2014; U.S. National Health Expenditure Accounts.
0
1000
2000
3000
4000
5000
6000
7000
8000
9000
10000
1980
1984
1988
1992
1996
2000
2004
2008
2012
US
SWIZ
GER
CAN
FR
JPN
UK
0.0
2.0
4.0
6.0
8.0
10.0
12.0
14.0
16.0
18.0
1980
1984
1988
1992
1996
2000
2004
2008
2012
US
FR
SWIZ
GER
CAN
JPN
UK
$9,077
$4,602
10.9%
16.9%
Adults’ Views of Health Care System, 2013
Source: 2013 Commonwealth Fund International Health Policy Survey in Eleven Countries.
25
40
42
42
44
46
47
48
51
54
63
48
49
50
48
46
42
45
43
44
40
33
27
11
8
10
10
12
8
9
5
7
4
0% 20% 40% 60% 80% 100%
US
FR
CAN
GER
SWE
NOR
NZ
AUS
NETH
SWIZ
UK
Works well, only minor changes Fundamental changes Completely rebuild
Percent of adults
• 17th year of an 11-country survey (Since 1998)
 Initially: Australia, Canada, New Zealand, U.K., and U.S.
 Recent years: France, Germany, Netherlands, Norway,
Sweden, Switzerland
Commonwealth Fund Annual International Surveys
• 3-year survey cycle:
 General population:
 1998, 2001, 2004, 2007, 2010, 2013
 Sicker/Older population:
 1999, 2002, 2005, 2008, 2011, 2014
 Physicians:
 2000, 2006, 2009, 2012, 2015 (in field)
What do we hope to learn?
• Shared goals and strategies: for reform and
increasing transferability of innovations
• Measurement: expanding portfolio of
internationally comparable metrics to
compare country performance and track
reforms, to know “what works” and “what
doesn’t”
Areas Studied
 Quality improvement
 Chronic illness/management
 Use of the ED
 Hospital care
 Medications
 System complexity
 Health care coverage
 Demographics
 Views of the health system
 Access and affordability
 Primary care
 Doctor-patient relationship
 Prevention/health promotion
 Care coordination
 Health information
technology
 Patient safety
• Focus on objective measures rather than opinions.
• General themes:
Survey Sample
Total
Sample
Minimum Maximum United
States
Canada
2011
Survey of
Sicker
Adults
18,667 750 4,804 1,200 3,958
2012,
Survey of
Primary
Care
Providers
9,776 500 2,124 1,012 2,124
2013,
Survey of
Adults
20,045 1,000 5,412 2,002 5,412
Survey Administration Protocol
• Sicker Adults (2011)
– Mode: Computer-assisted telephone interviews
– Field period: March – June 2011
• Primary Care Physicians (2012)
– Mode: Mail and phone survey of primary care
physicians
– Field period: March – July 2012
• General Population (2013)
– Mode: Computer-assisted telephone interviews
– Field period: February- June 2013
“Mirror, Mirror” Ranking of
Health Care System Performance
Mirror, Mirror:
Dimensions and Indicators
QUALITY
(44 indicators)
ACCESS
(12
indicators)
EFFICIENCY
(11 indicators)
EQUITY
(High/low
income
comparison 10
indicators)
HEALTHY
LIVES
(WHO and
OECD data, 3
indicators)
Effective Care
(13)
Cost-
Related
Access (5)
Expenditures
(2)
Access to care
(10)
Mortality
amenable to
health care (1)
Safe Care (7) Timeliness
of Care (7)
Administrative
Burden (4)
Infant
Mortality (1)
Coordinated Care
(13)
Duplication (3) Healthy Life
Expectancy (1)
Patient-Centered
Care (11)
Tech usage (2)
Media Coverage of IHP Survey Findings
Mirror, Mirror is the
most frequently viewed
publication on the
Fund’s website
134,000
233,608
0
50,000
100,000
150,000
200,000
250,000
Mirror, Mirror 2010 Mirror, Mirror 2014
Page Views*
*Views since June 2014 for 2014 edition; views from 2010-2013 for 2010 edition.
Findings published annually in Health Affairs.
Ranking of Canada and US Health Care
System Performance: Effectiveness
CANADA USA
QUALITY CARE 9 5
EFFECTIVE CARE 7 3
SAFE CARE 10 7
COORDINATED CARE 8 6
PATIENT-CENTERED CARE 8 4
Percent of adults who had a chronic condition and:
Managing Patients with Chronic Conditions:
U.S. and Canada Older Adults
15
Source: 2014 Commonwealth Fund International Health Policy
Survey of Older Adults in Eleven Countries.
Health care professional
discussed goals and
gave instructions on
symptoms
Had a treatment plan
for their condition they
could carry out in their
daily life
Had a health care
professional that
contacted them
between visits
Had a health care
professional they
could contact to ask
questions
46
76
16
67
58
83
30
84
0 25 50 75 100
Canada US
Prevention: U.S. and Canada
23
39
35
51
54
69
30
49
52
67
70
77
0 25 50 75 100
Canada US
Physicians reporting it is
easy to print out list of
patients due or overdue for
tests/preventive care
Patients receive reminders
for preventive care
Patients sent computerized
reminder notices for
preventive or follow-up care
Doctor talked with patient
about exercise or physical
activity
Doctor talked with patient
about healthy diet and
healthy eating
Doctor talked with patient
about health risks and
ways to quit smoking
Percent reported:
Source: The Commonwealth Fund: 2014 Update “ Mirror, Mirror on the Wall”
Safe Care Measures: US and Canada
*Base: had a lab test ordered
Source: The Commonwealth Fund: 2014 Update “Mirror, Mirror on the Wall”
11
5
5
11
11
11
8
5
10
5
0 5 10 15 20 25 30 35 40 45 50
Canada USPercent of Patients who reported:
Believed a medical mistake
was made in treatment or
care in past 2 years
Given wrong medication or
wrong dose at pharmacy or
while hospitalized in past 2
years
Given incorrect results for
a diagnostic or lab test in
past 2 years*
Experienced delays in
being notified about
abnormal test results in
past 2 years*
Hospitalized patients
reporting infection in
hospital or shortly after
Safe Care Measures: US and Canada
Cont’d
Source: The Commonwealth Fund: 2014 Update “ Mirror, Mirror on the Wall”
30
34
58
49
0 20 40 60 80 100
Canada USPercent of Physicians who report
Doctor routinely
receives a
computerized alert or
prompt about a
potential problem with
drug dose or interaction
Doctor routinely
receives reminders
for guideline-based
interventions and/or
tests
Patient-Centered Care: US and Canada,
Communication
67
88
83
73
88
92
0 20 40 60 80 100
Canada USPercent of Patients who report:
*Base: have a regular doctor and tried to contact by phone; **Base: those who had surgery or been hospitalized
Source: The Commonwealth Fund: 2014 Update :Mirror, Mirror on the Wall
Always or often getting
telephone answer from
doctor the same day*
Doctor always or often
explains things in a
way that is easy to
understand
Received clear
instructions about
symptoms to watch for
and when to seek further
care after surgery or
when leaving the
hospital**
Patient-Centered Care: US and Canada,
Continuity and Feedback
64
15
80
57
60
84
0 20 40 60 80 100
Canada USPercent of Patients who report
Source: The Commonwealth Fund: 2014 Update “ Mirror, Mirror on the Wall
With same
doctor 5 years
or more
Doctor routinely
receives and reviews
data on patient
satisfaction and
experiences with care
Regular doctor always
or often knows
important information
about patient’s medical
history
Patient-Centered Care: U.S. and Canada, Engagement
and Patient Preferences
77
67
72
62
66
71
76
80
75
75
0 25 50 75 100
Canada US
Specialist always or often
involves patient as much as
they want in decisions re:
care and RX*
Doctor discussed patient’s
main goals or priorities
caring for condition**
*Base: saw or needed to see specialist in past 2 years; **Base: has chronic condition
Source: The Commonwealth Fund: 2014 Update “ Mirror, Mirror on the Wall”
Specialist always or often
tells you about treatment
choices*
Percent of Patients that Reported:
Regular doctor always or
often encouraged you to
ask questions
Doctor gives clear
instructions about
symptoms/when to seek
further care**
Other Dimension Rankings: Canada and
US Health Care System Performance
CANADA USA
ACCESS 9 9
COST-RELATED PROBLEM 5 11
TIMELINESS OF CARE 11 5
EFFICIENCY 10 11
EQUITY 9 11
HEALTHY LIVES 8 11
OVERALL RANKING 10 11
Conclusions
• Comparison of countries’ health systems with
systematically-collected data can offer a useful
antidote to conventional wisdom
• We expect the results to inform national
policy discussions about delivery system
reform, especially in the U.S.
Survey Co-funders in 2014
• Australia: New South Wales Bureau of Health Information.
• Canada: Canadian Institute for Health Information, Canadian Institutes
of Health Research, Health Quality Ontario, Commissaire à la Santé et
au Bien-être du Québec, and Health Quality Council of Alberta.
• France: Haute Autorité de Santé and Caisse Nationale d’Assurance
Maladie des Travailleurs Salariés.
• Germany: Federal Ministry of Health and the National Institute for
Quality Measurement in Health Care.
• Netherlands: Ministry of Health, Welfare, and Sport and the Scientific
Institute for Quality of Healthcare at Radboud University Nijmegen
Medical Centre.
• Norway: Norwegian Knowledge Centre for the Health Services.
• Sweden: Ministry of Health and Social Affairs.
• Switzerland: Federal Office of Public Health.
• United Kingdom: The Health Foundation.
Acknowledgements
CMWF IHP Survey Team
References
1.Karen Davis, Kristof Stremikis, David Squires, and
Cathy Schoen. Mirror, Mirror On The Wall. Online:
The Commonwealth Fund 2014.
2. Commonwealth Fund Commission, Why Not the
Best? 2011.
3. Institute of Medicine, Crossing the Quality
Chasm, 2001.
APPENDIX
Calculation of Ranks
• Countries ranked by calculating means and
ranking scores from highest to lowest
• Tied observations assigned the score that would
be assigned if no tie occurred
• Summary ranking created for each Scorecard
domain of quality and access by averaging
individual ranked scores within each country
and ranking these averages from highest to
lowest (1=highest; 11=lowest)

International Health Policy and Practice: Comparing the U.S. and Canada on Effectiveness and Patient-Centered Care

  • 1.
    International Health Policyand Practice: Comparing the U.S. and Canada on Effectiveness and Patient-centered Care Eric Schneider, MD, MSc Senior Vice President for Policy and Research
  • 2.
    Outline • Why comparecountries’ health care systems? • The Commonwealth Fund International Survey Program • Are we as good as our neighbors to the north/south?
  • 3.
    Why Compare Countries’Health Care Systems? “Americans have the best health care system in the world” - 2004 President Delivers State of the Union Speech
  • 4.
    International Trends inHealth Spending Health spending per capita ($US PPP) Total health spending as percent of GDP Note: PPP = Purchasing power parity. Source: OECD Health Data 2014; U.S. National Health Expenditure Accounts. 0 1000 2000 3000 4000 5000 6000 7000 8000 9000 10000 1980 1984 1988 1992 1996 2000 2004 2008 2012 US SWIZ GER CAN FR JPN UK 0.0 2.0 4.0 6.0 8.0 10.0 12.0 14.0 16.0 18.0 1980 1984 1988 1992 1996 2000 2004 2008 2012 US FR SWIZ GER CAN JPN UK $9,077 $4,602 10.9% 16.9%
  • 5.
    Adults’ Views ofHealth Care System, 2013 Source: 2013 Commonwealth Fund International Health Policy Survey in Eleven Countries. 25 40 42 42 44 46 47 48 51 54 63 48 49 50 48 46 42 45 43 44 40 33 27 11 8 10 10 12 8 9 5 7 4 0% 20% 40% 60% 80% 100% US FR CAN GER SWE NOR NZ AUS NETH SWIZ UK Works well, only minor changes Fundamental changes Completely rebuild Percent of adults
  • 6.
    • 17th yearof an 11-country survey (Since 1998)  Initially: Australia, Canada, New Zealand, U.K., and U.S.  Recent years: France, Germany, Netherlands, Norway, Sweden, Switzerland Commonwealth Fund Annual International Surveys • 3-year survey cycle:  General population:  1998, 2001, 2004, 2007, 2010, 2013  Sicker/Older population:  1999, 2002, 2005, 2008, 2011, 2014  Physicians:  2000, 2006, 2009, 2012, 2015 (in field)
  • 7.
    What do wehope to learn? • Shared goals and strategies: for reform and increasing transferability of innovations • Measurement: expanding portfolio of internationally comparable metrics to compare country performance and track reforms, to know “what works” and “what doesn’t”
  • 8.
    Areas Studied  Qualityimprovement  Chronic illness/management  Use of the ED  Hospital care  Medications  System complexity  Health care coverage  Demographics  Views of the health system  Access and affordability  Primary care  Doctor-patient relationship  Prevention/health promotion  Care coordination  Health information technology  Patient safety • Focus on objective measures rather than opinions. • General themes:
  • 9.
    Survey Sample Total Sample Minimum MaximumUnited States Canada 2011 Survey of Sicker Adults 18,667 750 4,804 1,200 3,958 2012, Survey of Primary Care Providers 9,776 500 2,124 1,012 2,124 2013, Survey of Adults 20,045 1,000 5,412 2,002 5,412
  • 10.
    Survey Administration Protocol •Sicker Adults (2011) – Mode: Computer-assisted telephone interviews – Field period: March – June 2011 • Primary Care Physicians (2012) – Mode: Mail and phone survey of primary care physicians – Field period: March – July 2012 • General Population (2013) – Mode: Computer-assisted telephone interviews – Field period: February- June 2013
  • 11.
    “Mirror, Mirror” Rankingof Health Care System Performance
  • 12.
    Mirror, Mirror: Dimensions andIndicators QUALITY (44 indicators) ACCESS (12 indicators) EFFICIENCY (11 indicators) EQUITY (High/low income comparison 10 indicators) HEALTHY LIVES (WHO and OECD data, 3 indicators) Effective Care (13) Cost- Related Access (5) Expenditures (2) Access to care (10) Mortality amenable to health care (1) Safe Care (7) Timeliness of Care (7) Administrative Burden (4) Infant Mortality (1) Coordinated Care (13) Duplication (3) Healthy Life Expectancy (1) Patient-Centered Care (11) Tech usage (2)
  • 13.
    Media Coverage ofIHP Survey Findings Mirror, Mirror is the most frequently viewed publication on the Fund’s website 134,000 233,608 0 50,000 100,000 150,000 200,000 250,000 Mirror, Mirror 2010 Mirror, Mirror 2014 Page Views* *Views since June 2014 for 2014 edition; views from 2010-2013 for 2010 edition. Findings published annually in Health Affairs.
  • 14.
    Ranking of Canadaand US Health Care System Performance: Effectiveness CANADA USA QUALITY CARE 9 5 EFFECTIVE CARE 7 3 SAFE CARE 10 7 COORDINATED CARE 8 6 PATIENT-CENTERED CARE 8 4
  • 15.
    Percent of adultswho had a chronic condition and: Managing Patients with Chronic Conditions: U.S. and Canada Older Adults 15 Source: 2014 Commonwealth Fund International Health Policy Survey of Older Adults in Eleven Countries. Health care professional discussed goals and gave instructions on symptoms Had a treatment plan for their condition they could carry out in their daily life Had a health care professional that contacted them between visits Had a health care professional they could contact to ask questions 46 76 16 67 58 83 30 84 0 25 50 75 100 Canada US
  • 16.
    Prevention: U.S. andCanada 23 39 35 51 54 69 30 49 52 67 70 77 0 25 50 75 100 Canada US Physicians reporting it is easy to print out list of patients due or overdue for tests/preventive care Patients receive reminders for preventive care Patients sent computerized reminder notices for preventive or follow-up care Doctor talked with patient about exercise or physical activity Doctor talked with patient about healthy diet and healthy eating Doctor talked with patient about health risks and ways to quit smoking Percent reported: Source: The Commonwealth Fund: 2014 Update “ Mirror, Mirror on the Wall”
  • 17.
    Safe Care Measures:US and Canada *Base: had a lab test ordered Source: The Commonwealth Fund: 2014 Update “Mirror, Mirror on the Wall” 11 5 5 11 11 11 8 5 10 5 0 5 10 15 20 25 30 35 40 45 50 Canada USPercent of Patients who reported: Believed a medical mistake was made in treatment or care in past 2 years Given wrong medication or wrong dose at pharmacy or while hospitalized in past 2 years Given incorrect results for a diagnostic or lab test in past 2 years* Experienced delays in being notified about abnormal test results in past 2 years* Hospitalized patients reporting infection in hospital or shortly after
  • 18.
    Safe Care Measures:US and Canada Cont’d Source: The Commonwealth Fund: 2014 Update “ Mirror, Mirror on the Wall” 30 34 58 49 0 20 40 60 80 100 Canada USPercent of Physicians who report Doctor routinely receives a computerized alert or prompt about a potential problem with drug dose or interaction Doctor routinely receives reminders for guideline-based interventions and/or tests
  • 19.
    Patient-Centered Care: USand Canada, Communication 67 88 83 73 88 92 0 20 40 60 80 100 Canada USPercent of Patients who report: *Base: have a regular doctor and tried to contact by phone; **Base: those who had surgery or been hospitalized Source: The Commonwealth Fund: 2014 Update :Mirror, Mirror on the Wall Always or often getting telephone answer from doctor the same day* Doctor always or often explains things in a way that is easy to understand Received clear instructions about symptoms to watch for and when to seek further care after surgery or when leaving the hospital**
  • 20.
    Patient-Centered Care: USand Canada, Continuity and Feedback 64 15 80 57 60 84 0 20 40 60 80 100 Canada USPercent of Patients who report Source: The Commonwealth Fund: 2014 Update “ Mirror, Mirror on the Wall With same doctor 5 years or more Doctor routinely receives and reviews data on patient satisfaction and experiences with care Regular doctor always or often knows important information about patient’s medical history
  • 21.
    Patient-Centered Care: U.S.and Canada, Engagement and Patient Preferences 77 67 72 62 66 71 76 80 75 75 0 25 50 75 100 Canada US Specialist always or often involves patient as much as they want in decisions re: care and RX* Doctor discussed patient’s main goals or priorities caring for condition** *Base: saw or needed to see specialist in past 2 years; **Base: has chronic condition Source: The Commonwealth Fund: 2014 Update “ Mirror, Mirror on the Wall” Specialist always or often tells you about treatment choices* Percent of Patients that Reported: Regular doctor always or often encouraged you to ask questions Doctor gives clear instructions about symptoms/when to seek further care**
  • 22.
    Other Dimension Rankings:Canada and US Health Care System Performance CANADA USA ACCESS 9 9 COST-RELATED PROBLEM 5 11 TIMELINESS OF CARE 11 5 EFFICIENCY 10 11 EQUITY 9 11 HEALTHY LIVES 8 11 OVERALL RANKING 10 11
  • 23.
    Conclusions • Comparison ofcountries’ health systems with systematically-collected data can offer a useful antidote to conventional wisdom • We expect the results to inform national policy discussions about delivery system reform, especially in the U.S.
  • 24.
    Survey Co-funders in2014 • Australia: New South Wales Bureau of Health Information. • Canada: Canadian Institute for Health Information, Canadian Institutes of Health Research, Health Quality Ontario, Commissaire à la Santé et au Bien-être du Québec, and Health Quality Council of Alberta. • France: Haute Autorité de Santé and Caisse Nationale d’Assurance Maladie des Travailleurs Salariés. • Germany: Federal Ministry of Health and the National Institute for Quality Measurement in Health Care. • Netherlands: Ministry of Health, Welfare, and Sport and the Scientific Institute for Quality of Healthcare at Radboud University Nijmegen Medical Centre. • Norway: Norwegian Knowledge Centre for the Health Services. • Sweden: Ministry of Health and Social Affairs. • Switzerland: Federal Office of Public Health. • United Kingdom: The Health Foundation.
  • 25.
  • 26.
    References 1.Karen Davis, KristofStremikis, David Squires, and Cathy Schoen. Mirror, Mirror On The Wall. Online: The Commonwealth Fund 2014. 2. Commonwealth Fund Commission, Why Not the Best? 2011. 3. Institute of Medicine, Crossing the Quality Chasm, 2001.
  • 27.
  • 28.
    Calculation of Ranks •Countries ranked by calculating means and ranking scores from highest to lowest • Tied observations assigned the score that would be assigned if no tie occurred • Summary ranking created for each Scorecard domain of quality and access by averaging individual ranked scores within each country and ranking these averages from highest to lowest (1=highest; 11=lowest)