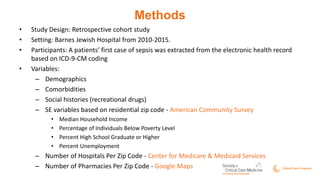
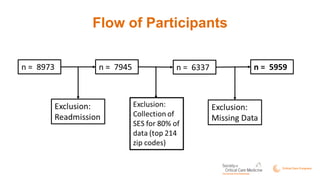
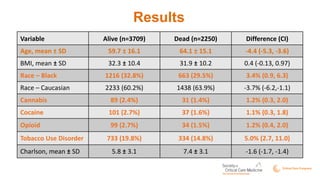
Examining the Influence of Social,
Socioeconomic (SES), and Medical
Histories on Sepsis-Related Mortality
Sai Dodda, Student Pharmacist Class
of 2021
Background and Study Objective
• Sepsis is a leading cause of hospital mortality
– In 2014, 35% of hospitalizations that resulted in death
• Previously identified variables include: race, co-
morbidities, SES (household income), and BMI
• Goal: Understand the relationships between
pre-admission variables (SES, medical, and
social histories) and in-hospital mortality
Methods
• Study Design: Retrospective cohort study
• Setting: Barnes Jewish Hospital from 2010-2015.
• Participants: A patients’ first case of sepsis was extracted from the electronic health record
based on ICD-9-CM coding
• Variables:
– Demographics
– Comorbidities
– Social histories (recreational drugs)
– SE variables based on residential zip code - American Community Survey
• Median Household Income
• Percentage of Individuals Below Poverty Level
• Percent High School Graduate or Higher
• Percent Unemployment
– Number of Hospitals Per Zip Code - Center for Medicare & Medicaid Services
– Number of Pharmacies Per Zip Code - Google Maps
Analysis
• Evaluate differences between survivors and non-
survivors relative to pre-admission variables
• Analytic methods
– Descriptive Statistics
– Inferential Statistics
• Chi-Square Analysis
• Independent Samples T-test
Flow of Participants
Study Population
Age, mean ± standard deviation (SD) 61.3 ± 15.9
BMI 32.1 ± 10.4)
Race
- Black
- Caucasian
- Unknown
- Others
1879 (31.5%)
3671 (61.6%)
305 (5.1%)
104 (1.7%)
Male 3276 (55%)
Median Household Income (per zip code)
- Less than $40,000
- $40,000 to $79,999
- Above $80,000
2376 (39.9%)
3160 (53%)
423 (7.1%)
Percentage of Individuals Below Poverty Level, mean ± SD 16.8 ± 11.4
Percent High School Graduate or Higher, mean ± SD 87.4 ± 7.3
Unemployment Percent, mean ± SD 9.4 ± 6.2
Number of Pharmacies, mean ± SD 5.31 ± 4.0
Charlson Score, mean ± SD 6.4 ± 3.2
Results
Variable Alive (n=3709) Dead (n=2250) Difference (CI)
Age, mean ± SD 59.7 ± 16.1 64.1 ± 15.1 -4.4 (-5.3, -3.6)
BMI, mean ± SD 32.3 ± 10.4 31.9 ± 10.2 0.4 (-0.13, 0.97)
Race – Black 1216 (32.8%) 663 (29.5%) 3.4% (0.9, 6.3)
Race – Caucasian 2233 (60.2%) 1438 (63.9%) -3.7% (-6.2,-1.1)
Cannabis 89 (2.4%) 31 (1.4%) 1.2% (0.3, 2.0)
Cocaine 101 (2.7%) 37 (1.6%) 1.1% (0.3, 1.8)
Opioid 99 (2.7%) 34 (1.5%) 1.2% (0.4, 2.0)
Tobacco Use Disorder 733 (19.8%) 334 (14.8%) 5.0% (2.7, 11.0)
Charlson, mean ± SD 5.8 ± 3.1 7.4 ± 3.1 -1.6 (-1.7, -1.4)
Results
Alive (n=3709) Dead (n=2250) Difference (CI)
Median Household Income 46998 ± 19927 48271 ± 20569 -$1273 (-2330,-217)
Percentage of Individuals Below
Poverty Level
19.4 ± 11.4 18.6 ± 11.3 0.8% (0.2, 1.4)
Percent High School Graduate or
Higher
87.2 ± 7.4 87.7 ± 7.2 -0.44% (-0.82,-0.06)
Unemployment Percent 9.6 ± 6.1 9.3 ± 6.2 -0.3 (-0.62,0.02)
Number of Pharmacies 5.3 ± 4.0 5.4 ± 4.0 0.1 (-0.11,0.31)
All comparisons per the patient’s residential zip code
Discussion/Conclusion
• Contrary results from what is expected in terms of SES, race,
and social history
– African American race patients tend to have less mortality
– Presence of recreational drug use corresponds to less mortality
– Higher household income, lower poverty, and higher education per
zip code correspond to less mortality
• Next Steps
– Evaluation of the contrary results
– Regression Analysis
– Cluster Modeling
– Apply this data to other outcomes (hospital length of stay, type and
number of organ dysfunctions, type of infection)
Acknowledgements
• Dr. Scott Micek, PharmD, BCPS, FCCP
• Dr. Tiffany Osborne, MD, MPH
• Marin H. Kollef, MD, FACP, FCCP
• Dr. Randi Foraker, PhD, MA, FAHA

SCCM presentation

  • 1.
    Examining the Influenceof Social, Socioeconomic (SES), and Medical Histories on Sepsis-Related Mortality Sai Dodda, Student Pharmacist Class of 2021
  • 2.
    Background and StudyObjective • Sepsis is a leading cause of hospital mortality – In 2014, 35% of hospitalizations that resulted in death • Previously identified variables include: race, co- morbidities, SES (household income), and BMI • Goal: Understand the relationships between pre-admission variables (SES, medical, and social histories) and in-hospital mortality
  • 3.
    Methods • Study Design:Retrospective cohort study • Setting: Barnes Jewish Hospital from 2010-2015. • Participants: A patients’ first case of sepsis was extracted from the electronic health record based on ICD-9-CM coding • Variables: – Demographics – Comorbidities – Social histories (recreational drugs) – SE variables based on residential zip code - American Community Survey • Median Household Income • Percentage of Individuals Below Poverty Level • Percent High School Graduate or Higher • Percent Unemployment – Number of Hospitals Per Zip Code - Center for Medicare & Medicaid Services – Number of Pharmacies Per Zip Code - Google Maps
  • 4.
    Analysis • Evaluate differencesbetween survivors and non- survivors relative to pre-admission variables • Analytic methods – Descriptive Statistics – Inferential Statistics • Chi-Square Analysis • Independent Samples T-test
  • 5.
  • 6.
    Study Population Age, mean± standard deviation (SD) 61.3 ± 15.9 BMI 32.1 ± 10.4) Race - Black - Caucasian - Unknown - Others 1879 (31.5%) 3671 (61.6%) 305 (5.1%) 104 (1.7%) Male 3276 (55%) Median Household Income (per zip code) - Less than $40,000 - $40,000 to $79,999 - Above $80,000 2376 (39.9%) 3160 (53%) 423 (7.1%) Percentage of Individuals Below Poverty Level, mean ± SD 16.8 ± 11.4 Percent High School Graduate or Higher, mean ± SD 87.4 ± 7.3 Unemployment Percent, mean ± SD 9.4 ± 6.2 Number of Pharmacies, mean ± SD 5.31 ± 4.0 Charlson Score, mean ± SD 6.4 ± 3.2
  • 7.
    Results Variable Alive (n=3709)Dead (n=2250) Difference (CI) Age, mean ± SD 59.7 ± 16.1 64.1 ± 15.1 -4.4 (-5.3, -3.6) BMI, mean ± SD 32.3 ± 10.4 31.9 ± 10.2 0.4 (-0.13, 0.97) Race – Black 1216 (32.8%) 663 (29.5%) 3.4% (0.9, 6.3) Race – Caucasian 2233 (60.2%) 1438 (63.9%) -3.7% (-6.2,-1.1) Cannabis 89 (2.4%) 31 (1.4%) 1.2% (0.3, 2.0) Cocaine 101 (2.7%) 37 (1.6%) 1.1% (0.3, 1.8) Opioid 99 (2.7%) 34 (1.5%) 1.2% (0.4, 2.0) Tobacco Use Disorder 733 (19.8%) 334 (14.8%) 5.0% (2.7, 11.0) Charlson, mean ± SD 5.8 ± 3.1 7.4 ± 3.1 -1.6 (-1.7, -1.4)
  • 8.
    Results Alive (n=3709) Dead(n=2250) Difference (CI) Median Household Income 46998 ± 19927 48271 ± 20569 -$1273 (-2330,-217) Percentage of Individuals Below Poverty Level 19.4 ± 11.4 18.6 ± 11.3 0.8% (0.2, 1.4) Percent High School Graduate or Higher 87.2 ± 7.4 87.7 ± 7.2 -0.44% (-0.82,-0.06) Unemployment Percent 9.6 ± 6.1 9.3 ± 6.2 -0.3 (-0.62,0.02) Number of Pharmacies 5.3 ± 4.0 5.4 ± 4.0 0.1 (-0.11,0.31) All comparisons per the patient’s residential zip code
  • 9.
    Discussion/Conclusion • Contrary resultsfrom what is expected in terms of SES, race, and social history – African American race patients tend to have less mortality – Presence of recreational drug use corresponds to less mortality – Higher household income, lower poverty, and higher education per zip code correspond to less mortality • Next Steps – Evaluation of the contrary results – Regression Analysis – Cluster Modeling – Apply this data to other outcomes (hospital length of stay, type and number of organ dysfunctions, type of infection)
  • 10.
    Acknowledgements • Dr. ScottMicek, PharmD, BCPS, FCCP • Dr. Tiffany Osborne, MD, MPH • Marin H. Kollef, MD, FACP, FCCP • Dr. Randi Foraker, PhD, MA, FAHA