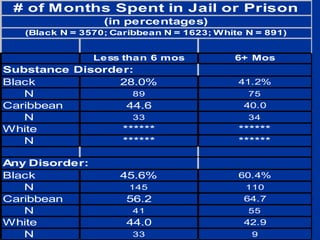
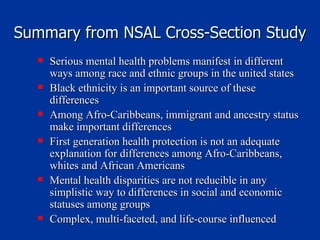
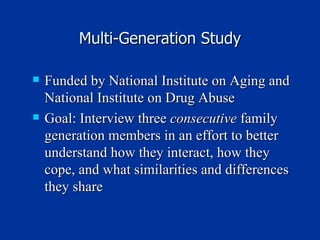
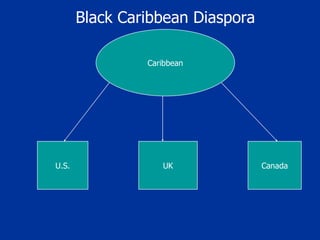
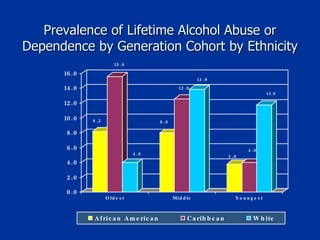
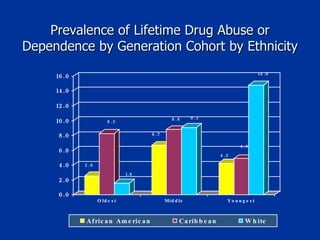
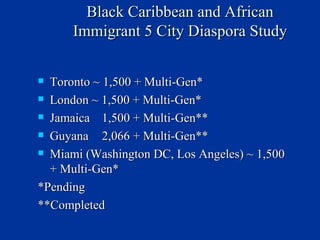
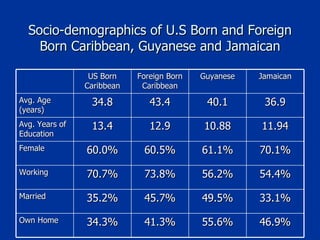
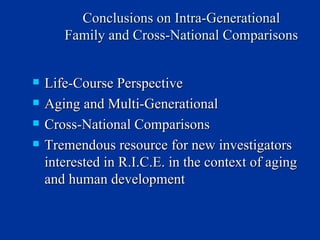
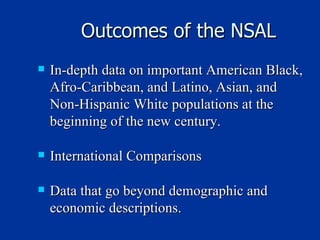
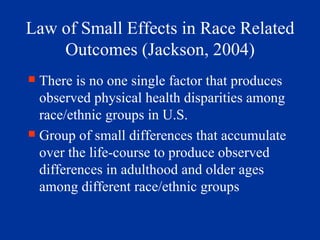
James S. Jackson  Program for Research on Black Americans Institute for Social Research University of Michigan Appreciation to the staff and faculty of PRBA. Funding for the projects discussed in this talk provided by  NIA, NIDA, OBSSR, NSF, and NIMH.  Talk presented at Center for Substance Abuse Treatment Satellite Session Linking Research to Practice: Addressing Racial and Ethnic Health Disparities in Substance Abuse Treatment and HIV/AIDS. San Juan, Puerto Rico, June  14, 2008 Race, Ethnicity and National Origin in  Conducting Mental Health Research in  Black Populations
R.I.C.E. R ace I mmigration C ulture E thnicity (and Gender, Age, and SES)
Race Matters Even if we don’t know what “IT” is
Nature of Race in United States One Drop Rule Association with Intelligence and Character  Real Discrimination in housing, schooling, occupation, and related areas of life
Biological and Social Perspectives on Race Self–reported (or other reported) race/ethnicity most often used categorization in both biological and social research Why should we observe such large and both consistent (African Americans), and inconsistent (Caribbeans, Latinos, Asians, etc), disparities among race/ethnic groups
However we construe race (ethnicity, etc) there are two processes operative Biological Social – Self & Other Far-fetched to think that biological process alone could account for observed group differences in health in U.S. as I have reviewed here Social processes must play a major role
Self and Other Race Perceptions Self  Other Yes Black Not Black Yes Black African American Hispanic Afro Caribbean Not Black Hispanic Afro Caribbean Non-Hispanic White
Non-Minority Minority Difference Clinical Appropriateness  and Need  Patient Preferences   The Operation of Healthcare  Systems and the Legal and  Regulatory Climate  Discrimination: Biases and Prejudice, Stereotyping, and Uncertainty UNKNOWN Disparity Quality of Health Care/Health Figure 1:  Differences and Disparities: Populations with Equal Access to Health Care Populations with Equal Access to Health Care
Law of Small Effects in Race Related Outcomes (Jackson, 2004) There is no one single factor that produces observed physical health disparities among race/ethnic groups in U.S. Group of small differences that accumulate over the life-course to produce observed differences in adulthood and older ages among different race/ethnic groups
Some Candidates Gene/gene and gene/environment interactions Discrimination and perceived racism (stress process) Accumulated stress (weathering, allostatic load, etc.) Life course selection  Cultural factors Behavioral differences SES and institutional arrangement
Disparities in Demographic, Economic, and Social Resources: Structural Inequalities Blacks disproportionately in comparison to Non-Hispanic Whites remain materially disadvantaged and geographically segregated, especially in poor, core urban areas There are large disparities in living arrangements favoring non-Hispanic Whites
Disparities in Health Status, Health Services and Mental Health: Physical and Psychological Inequalities Large disparities in all cause and specific cause death rates exist among ethnic and racial groups – these differences are not due in any simple way to socioeconomic status Infant mortality rates have declined but large difference exist between African Americans and whites There are large disparities in health care utilization between blacks and whites in this country
Health Disparities by Age, Aging and the Life-Course There are links from childhood (infancy, neonatal, pregnancy, etc.) social conditions to race/ethnic disparities in adulthood and older age (e.g. Warner & Hayward, 2003) Over the life course blacks more than any other group live the fewest years and a high proportion of these years is in poor health (e.g. Hayward & Heron, 2002) Health, race, ethnicity and mobility (SES) are linked in complex ways across childhood, adolescence, adulthood, and old age (e.g. Hayward et al, 2003; Whitfield & Hayward, 2003; Crimmins et al, 2000; Crimmins & Saito, 2001)
National Survey of  American Life Feb 2001-Present
NSAL Sampling Areas
Sample Design 6,082 Adult face-to-face interviews 3,570 African Americans [70.7%] 1,621 Afro-Caribbeans [77.3%] 891 Non-Hispanic Whites* [69.7%] 1170 African American and Afro-Caribbean Adolescent face-to-face interviews [80.4%] Parents/Guardians self-administered interviews Age 18 and older  English Speaking only  * Includes 891 Whites living in predominantly African American neighborhoods, and 115 whites living in areas with an African American population of less than 10%.
Areas Covered Disorders Risk Factors Social Psychological Material Study Specific Foci
Areas Covered Neighborhood Religion  Cognitive Functioning Psychological Resources Health Problems Employment Family and Friends Mental Health (CIDI and Other Mental Health)
Areas Covered (cont.) Use of Help Resources Group and Personal Identity Discrimination Demographics (Including ancestry) Immigration  Politics Detention Technology and 3-Generation Eligibility
Mental Health Sections Screening Questions for Disorders Depression Mania  Panic Disorder  Social Phobia Agoraphobia Generalized Anxiety Disorder Suicidality Substance Use Pharmaco Epidemiology Personality Post-Traumatic Stress Disorder
Mental Health Sections (cont.) 30-Day Symptoms (CES-D) Tobacco Use Eating Disorders Premenstrual Syndrome Obsessive Compulsive Disorder Psychosis Screen Gambling Screen Family History Attention Deficit/Hyperactivity <45 Oppositional Defiant Disorder <45 Conduct Disorder <45 Separation Anxiety Disorder  Services Used
Immigration Status and Ancestry Matter for Afro-Caribbeans
Lifetime Any Disorder**    (in percentages) Source: NSAL, National Survey of American Life, 2004. Note: Adjusted for age. F-Statistics significant, p < .001 *NSAL Whites living in areas with Black population of 10% or more. **Includes 7 disorders asked of all races: Major Depression, Dysthymia, Mania, Panic Disorder, Social Phobia, Generalized Anxiety Disorder, and Agoraphobia White* African American Caribbean
12-Month Any Disorder**  (in percentages) Source: NSAL, National Survey of American Life, 2004. Note: Adjusted for age. First graph: F-Statistic significant, p < .05. Second graph: F-Statistic significant, p < .001. *NSAL Whites living in areas with Black population of 10% or more. **Includes 7 disorders asked of all races: Major Depression, Dysthymia, Mania, Panic Disorder, Social Phobia, Generalized Anxiety Disorder, and Agoraphobia White* African American Caribbean
Age, Ancestry, and Timing of Immigration Matter for Black Caribbeans
Lifetime Any Disorder for Black Caribbeans Over 55 Years of Age Source: NSAL, National Survey of American Life, 2004. F-Statistics significant, p < .001 *NSAL Whites living in areas with Black population of 10% or more. **Includes 7 disorders asked of all races: Major Depression, Dysthymia, Mania, Panic Disorder, Social Phobia, Generalized Anxiety Disorder, and Agoraphobia Over 55 Years of Age at Time of Interview
Lifetime Any Disorder for Black Caribbeans 35 to 54 Years of Age   Source: NSAL, National Survey of American Life, 2004. F-Statistics significant, p < .001 *NSAL Whites living in areas with Black population of 10% or more. **Includes 7 disorders asked of all races: Major Depression, Dysthymia, Mania, Panic Disorder, Social Phobia, Generalized Anxiety Disorder, and Agoraphobia 35 to 54 Year Years of Age at Time of Interview
Lifetime Any Disorder for Black Caribbeans 18 to 34 Years of Age   Source: NSAL, National Survey of American Life, 2004. F-Statistics significant, p < .001 *NSAL Whites living in areas with Black population of 10% or more. **Includes 7 disorders asked of all races: Major Depression, Dysthymia, Mania, Panic Disorder, Social Phobia, Generalized Anxiety Disorder, and Agoraphobia 18 to 34 Years of Age at Time of Interview


Summary from NSAL Cross-Section Study Serious mental health problems manifest in different ways among race and ethnic groups in the united states Black ethnicity is an important source of these differences Among Afro-Caribbeans, immigrant and ancestry status make important differences First generation health protection is not an adequate explanation for differences among Afro-Caribbeans,  whites and African Americans Mental health disparities are not reducible in any simplistic way to differences in social and economic statuses among groups Complex, multi-faceted, and life-course influenced
Family Connections Across  Generations and Nations International Multi-Generational Survey:
Multi-Generation Study Funded by National Institute on Aging and National Institute on Drug Abuse Goal: Interview three  consecutive  family generation members in an effort to better understand how they interact, how they cope, and what similarities and differences they share
Caribbean U.S. UK Canada Black Caribbean Diaspora
Focal and Family Respondents Focal respondents obtained from NSAL (~ 1,612) Family members living in U.S. (~1,803), Caribbean, Europe or Africa (~1,000) Sampling method will maximize family members living internationally
Diagram Organization
Select Caribbean Countries Included Anegada Bahamas  Barbados  British Virgin Islands  Dominican Republic  Grenada  Guyana  Jamaica  Puerto Rico  Saint Croix  Saint John  Saint Thomas  Saint Vincent and The Grenadines  Tortola  Trinidad and Tobago  U.S. Virgin Islands Virgin Gorda Countries included based on distribution of focal respondents in NSAL, and ease of travel and data collection in the countries.
 
International Multi-Generational  Survey: United States Base Core Multi-Generational Respondent Caribbean American/European American/ African American/Asian American Hispanic American Selected Multi-Generational  Family Members United States  Africa  Europe  Asia  Caribbean
NSAL Three-Generation and Caribbean Cross-Section Field period 2005-2006 U.S. Interviews = 2303 (Apr – Dec, 2005) Focal R = 1068, Family R = 1235 African Americans  = 854;  Afro Caribbeans = 655;  Non-Hispanic Whites = 761 388 Triads, 447 Dyads, 234 Single Interviews Jamaica Cross-section = 1218 (Aug – Dec) Guyana Cross-section  = 2068 (July – Aug)
Average Age by Generation Cohort by Ethnicity
Average Years of Education by Generation Cohort by Ethnicity
Average Family Income (2004) Before Taxes by Generation Cohort by Ethnicity
Socio-demographics by Generation Cohort by Ethnicity - Oldest African American Caribbean White Female 69.8% 53.1% 63.2% Employed 32.6% 14.6% 18.4% Home Ownership 68.2% 54.7% 84.2% Married or Living w/ Partner 37.5% 41.3% 50.2% U.S. Born 100.0% 61.8% 98.4%
Socio-demographics by Generation Cohort by Ethnicity - Middle African American Caribbean White Female 62.8% 56.9% 55.3% Employed 76.2% 77.5% 72.1% Home Ownership 60.3% 63.3% 83.0% Married or Living w/ Partner 49.8% 44.8% 69.3% U.S. Born 98.9% 61.4% 98.3%
Socio-demographics by Generation Cohort by Ethnicity - Youngest African American Caribbean White Female 54.6% 67.1% 59.0% Employed 66.5% 53.4% 67.1% Home Ownership 41.3% 45.1% 56.0% Married or Living w/ Partner 27.5% 22.0% 42.2% U.S. Born 99.2% 81.5% 98.9%
Made Changes in Behaviors  by Ever Been Tested H54.  Ever Been Tested for HIV/AIDS? H55. Made Changes in Behaviors?
Chances of Getting HIV/AIDS  by Ever Been Tested H54.  Ever Been Tested for HIV/AIDS? H56. Your Chances of Getting HIV/AIDS?
Chances of Getting HIV/AIDS by  Made Changes in Behaviors H55. Made Changes in Your Sexual or Other Behaviors due to HIV/AIDS? H56. Your Chances of Getting HIV/AIDS?
Percent Changed Sexual Behavior Due to AIDS/HIV by Generation Cohort by Ethnicity
Chances of Getting HIV Virus by Ethnicity - Oldest
Chances of Getting HIV Virus by Ethnicity - Middle
Chances of Getting HIV Virus by Ethnicity - Youngest
Prevalence of Lifetime Major Depressive Disorder by Generation Cohort by Race
Prevalence of 12-Month Major Depressive Disorder by Generation Cohort by Race
Prevalence of Lifetime Bipolar* Disorder by Generation Cohort by Race *Combination of Bipolar I, Bipolar II, Subthreshold
Prevalence of Lifetime Alcohol Abuse or Dependence by Generation Cohort by Ethnicity
Prevalence of Lifetime Drug Abuse or Dependence by Generation Cohort by Ethnicity
Black Caribbean and African Immigrant 5 City Diaspora Study Toronto ~ 1,500 + Multi-Gen* London ~ 1,500 + Multi-Gen* Jamaica  1,500 + Multi-Gen** Guyana  2,066 + Multi-Gen** Miami (Washington DC, Los Angeles) ~ 1,500 + Multi-Gen* *Pending **Completed
Socio-demographics of U.S Born and Foreign Born Caribbean, Guyanese and Jamaican US Born Caribbean Foreign Born Caribbean Guyanese Jamaican Avg. Age (years) 34.8 43.4 40.1 36.9 Avg. Years of Education 13.4 12.9 10.88 11.94 Female 60.0% 60.5% 61.1% 70.1% Working 70.7% 73.8% 56.2% 54.4% Married 35.2% 45.7% 49.5% 33.1% Own Home 34.3% 41.3% 55.6% 46.9%
Percent of Respondents “Screened Into” Lifetime Major Depressive Disorder, Mania, Substance Abuse or Dependence US Born Caribbean Foreign Born Caribbean Guyanese Jamaican Depression 60.9% 46.0% 61.9% 65.3% Mania 27.1% 14.7% 22.7% 23.0% Substance Abuse or Dependence 13.6% 4.8% 7.7% 4.1%
Conclusions on Intra-Generational Family and Cross-National Comparisons Life-Course Perspective Aging and Multi-Generational Cross-National Comparisons Tremendous resource for new investigators interested in R.I.C.E. in the context of aging and human development
International Multi-Generational  Survey: Caribbean Base Core Multi-Generational Respondent Jamaica/Guyana Selected Multi-Generational  Family Members Caribbean/United States/England/Canada /
NSAL Panel Study  Two Wave Face-to-Face Follow-up of NSAL Biomarkers Genotyping Better Phenotyping MD Incidence Assessment Longitudinal Social, Psychological and Contextual Factors
Outcomes of the NSAL In-depth data on important American Black, Afro-Caribbean, and Latino, Asian, and Non-Hispanic White populations at the beginning of the new century. International Comparisons Data that go beyond demographic and economic descriptions.
Outcomes of the NSAL Important social, health, mental health, political, and attitudinal data for new scientific discoveries and public policy relevant decision-making. Large enough samples to investigate within group differences and similarities – especially environmental influences.
Thank You
Websites for NSAL and CPES Information: http://rcgd.isr.umich.edu/prba/nsal.htm http://www.icpsr.umich.edu/sumprog/courses/2007-03-44.html   http://www.icpsr.umich.edu/training/index.html

conferences.jbsinternational.com

  • 1.
    James S. Jackson Program for Research on Black Americans Institute for Social Research University of Michigan Appreciation to the staff and faculty of PRBA. Funding for the projects discussed in this talk provided by NIA, NIDA, OBSSR, NSF, and NIMH. Talk presented at Center for Substance Abuse Treatment Satellite Session Linking Research to Practice: Addressing Racial and Ethnic Health Disparities in Substance Abuse Treatment and HIV/AIDS. San Juan, Puerto Rico, June 14, 2008 Race, Ethnicity and National Origin in Conducting Mental Health Research in Black Populations
  • 2.
    R.I.C.E. R aceI mmigration C ulture E thnicity (and Gender, Age, and SES)
  • 3.
    Race Matters Evenif we don’t know what “IT” is
  • 4.
    Nature of Racein United States One Drop Rule Association with Intelligence and Character Real Discrimination in housing, schooling, occupation, and related areas of life
  • 5.
    Biological and SocialPerspectives on Race Self–reported (or other reported) race/ethnicity most often used categorization in both biological and social research Why should we observe such large and both consistent (African Americans), and inconsistent (Caribbeans, Latinos, Asians, etc), disparities among race/ethnic groups
  • 6.
    However we construerace (ethnicity, etc) there are two processes operative Biological Social – Self & Other Far-fetched to think that biological process alone could account for observed group differences in health in U.S. as I have reviewed here Social processes must play a major role
  • 7.
    Self and OtherRace Perceptions Self Other Yes Black Not Black Yes Black African American Hispanic Afro Caribbean Not Black Hispanic Afro Caribbean Non-Hispanic White
  • 8.
    Non-Minority Minority DifferenceClinical Appropriateness and Need Patient Preferences The Operation of Healthcare Systems and the Legal and Regulatory Climate Discrimination: Biases and Prejudice, Stereotyping, and Uncertainty UNKNOWN Disparity Quality of Health Care/Health Figure 1: Differences and Disparities: Populations with Equal Access to Health Care Populations with Equal Access to Health Care
  • 9.
    Law of SmallEffects in Race Related Outcomes (Jackson, 2004) There is no one single factor that produces observed physical health disparities among race/ethnic groups in U.S. Group of small differences that accumulate over the life-course to produce observed differences in adulthood and older ages among different race/ethnic groups
  • 10.
    Some Candidates Gene/geneand gene/environment interactions Discrimination and perceived racism (stress process) Accumulated stress (weathering, allostatic load, etc.) Life course selection Cultural factors Behavioral differences SES and institutional arrangement
  • 11.
    Disparities in Demographic,Economic, and Social Resources: Structural Inequalities Blacks disproportionately in comparison to Non-Hispanic Whites remain materially disadvantaged and geographically segregated, especially in poor, core urban areas There are large disparities in living arrangements favoring non-Hispanic Whites
  • 12.
    Disparities in HealthStatus, Health Services and Mental Health: Physical and Psychological Inequalities Large disparities in all cause and specific cause death rates exist among ethnic and racial groups – these differences are not due in any simple way to socioeconomic status Infant mortality rates have declined but large difference exist between African Americans and whites There are large disparities in health care utilization between blacks and whites in this country
  • 13.
    Health Disparities byAge, Aging and the Life-Course There are links from childhood (infancy, neonatal, pregnancy, etc.) social conditions to race/ethnic disparities in adulthood and older age (e.g. Warner & Hayward, 2003) Over the life course blacks more than any other group live the fewest years and a high proportion of these years is in poor health (e.g. Hayward & Heron, 2002) Health, race, ethnicity and mobility (SES) are linked in complex ways across childhood, adolescence, adulthood, and old age (e.g. Hayward et al, 2003; Whitfield & Hayward, 2003; Crimmins et al, 2000; Crimmins & Saito, 2001)
  • 14.
    National Survey of American Life Feb 2001-Present
  • 15.
  • 16.
    Sample Design 6,082Adult face-to-face interviews 3,570 African Americans [70.7%] 1,621 Afro-Caribbeans [77.3%] 891 Non-Hispanic Whites* [69.7%] 1170 African American and Afro-Caribbean Adolescent face-to-face interviews [80.4%] Parents/Guardians self-administered interviews Age 18 and older English Speaking only * Includes 891 Whites living in predominantly African American neighborhoods, and 115 whites living in areas with an African American population of less than 10%.
  • 17.
    Areas Covered DisordersRisk Factors Social Psychological Material Study Specific Foci
  • 18.
    Areas Covered NeighborhoodReligion Cognitive Functioning Psychological Resources Health Problems Employment Family and Friends Mental Health (CIDI and Other Mental Health)
  • 19.
    Areas Covered (cont.)Use of Help Resources Group and Personal Identity Discrimination Demographics (Including ancestry) Immigration Politics Detention Technology and 3-Generation Eligibility
  • 20.
    Mental Health SectionsScreening Questions for Disorders Depression Mania Panic Disorder Social Phobia Agoraphobia Generalized Anxiety Disorder Suicidality Substance Use Pharmaco Epidemiology Personality Post-Traumatic Stress Disorder
  • 21.
    Mental Health Sections(cont.) 30-Day Symptoms (CES-D) Tobacco Use Eating Disorders Premenstrual Syndrome Obsessive Compulsive Disorder Psychosis Screen Gambling Screen Family History Attention Deficit/Hyperactivity <45 Oppositional Defiant Disorder <45 Conduct Disorder <45 Separation Anxiety Disorder Services Used
  • 22.
    Immigration Status andAncestry Matter for Afro-Caribbeans
  • 23.
    Lifetime Any Disorder** (in percentages) Source: NSAL, National Survey of American Life, 2004. Note: Adjusted for age. F-Statistics significant, p < .001 *NSAL Whites living in areas with Black population of 10% or more. **Includes 7 disorders asked of all races: Major Depression, Dysthymia, Mania, Panic Disorder, Social Phobia, Generalized Anxiety Disorder, and Agoraphobia White* African American Caribbean
  • 24.
    12-Month Any Disorder** (in percentages) Source: NSAL, National Survey of American Life, 2004. Note: Adjusted for age. First graph: F-Statistic significant, p < .05. Second graph: F-Statistic significant, p < .001. *NSAL Whites living in areas with Black population of 10% or more. **Includes 7 disorders asked of all races: Major Depression, Dysthymia, Mania, Panic Disorder, Social Phobia, Generalized Anxiety Disorder, and Agoraphobia White* African American Caribbean
  • 25.
    Age, Ancestry, andTiming of Immigration Matter for Black Caribbeans
  • 26.
    Lifetime Any Disorderfor Black Caribbeans Over 55 Years of Age Source: NSAL, National Survey of American Life, 2004. F-Statistics significant, p < .001 *NSAL Whites living in areas with Black population of 10% or more. **Includes 7 disorders asked of all races: Major Depression, Dysthymia, Mania, Panic Disorder, Social Phobia, Generalized Anxiety Disorder, and Agoraphobia Over 55 Years of Age at Time of Interview
  • 27.
    Lifetime Any Disorderfor Black Caribbeans 35 to 54 Years of Age Source: NSAL, National Survey of American Life, 2004. F-Statistics significant, p < .001 *NSAL Whites living in areas with Black population of 10% or more. **Includes 7 disorders asked of all races: Major Depression, Dysthymia, Mania, Panic Disorder, Social Phobia, Generalized Anxiety Disorder, and Agoraphobia 35 to 54 Year Years of Age at Time of Interview
  • 28.
    Lifetime Any Disorderfor Black Caribbeans 18 to 34 Years of Age Source: NSAL, National Survey of American Life, 2004. F-Statistics significant, p < .001 *NSAL Whites living in areas with Black population of 10% or more. **Includes 7 disorders asked of all races: Major Depression, Dysthymia, Mania, Panic Disorder, Social Phobia, Generalized Anxiety Disorder, and Agoraphobia 18 to 34 Years of Age at Time of Interview
  • 29.
  • 30.
  • 31.
  • 32.
    Summary from NSALCross-Section Study Serious mental health problems manifest in different ways among race and ethnic groups in the united states Black ethnicity is an important source of these differences Among Afro-Caribbeans, immigrant and ancestry status make important differences First generation health protection is not an adequate explanation for differences among Afro-Caribbeans, whites and African Americans Mental health disparities are not reducible in any simplistic way to differences in social and economic statuses among groups Complex, multi-faceted, and life-course influenced
  • 33.
    Family Connections Across Generations and Nations International Multi-Generational Survey:
  • 34.
    Multi-Generation Study Fundedby National Institute on Aging and National Institute on Drug Abuse Goal: Interview three consecutive family generation members in an effort to better understand how they interact, how they cope, and what similarities and differences they share
  • 35.
    Caribbean U.S. UKCanada Black Caribbean Diaspora
  • 36.
    Focal and FamilyRespondents Focal respondents obtained from NSAL (~ 1,612) Family members living in U.S. (~1,803), Caribbean, Europe or Africa (~1,000) Sampling method will maximize family members living internationally
  • 37.
  • 38.
    Select Caribbean CountriesIncluded Anegada Bahamas Barbados British Virgin Islands Dominican Republic Grenada Guyana Jamaica Puerto Rico Saint Croix Saint John Saint Thomas Saint Vincent and The Grenadines Tortola Trinidad and Tobago U.S. Virgin Islands Virgin Gorda Countries included based on distribution of focal respondents in NSAL, and ease of travel and data collection in the countries.
  • 39.
  • 40.
    International Multi-Generational Survey: United States Base Core Multi-Generational Respondent Caribbean American/European American/ African American/Asian American Hispanic American Selected Multi-Generational Family Members United States Africa Europe Asia Caribbean
  • 41.
    NSAL Three-Generation andCaribbean Cross-Section Field period 2005-2006 U.S. Interviews = 2303 (Apr – Dec, 2005) Focal R = 1068, Family R = 1235 African Americans = 854; Afro Caribbeans = 655; Non-Hispanic Whites = 761 388 Triads, 447 Dyads, 234 Single Interviews Jamaica Cross-section = 1218 (Aug – Dec) Guyana Cross-section = 2068 (July – Aug)
  • 42.
    Average Age byGeneration Cohort by Ethnicity
  • 43.
    Average Years ofEducation by Generation Cohort by Ethnicity
  • 44.
    Average Family Income(2004) Before Taxes by Generation Cohort by Ethnicity
  • 45.
    Socio-demographics by GenerationCohort by Ethnicity - Oldest African American Caribbean White Female 69.8% 53.1% 63.2% Employed 32.6% 14.6% 18.4% Home Ownership 68.2% 54.7% 84.2% Married or Living w/ Partner 37.5% 41.3% 50.2% U.S. Born 100.0% 61.8% 98.4%
  • 46.
    Socio-demographics by GenerationCohort by Ethnicity - Middle African American Caribbean White Female 62.8% 56.9% 55.3% Employed 76.2% 77.5% 72.1% Home Ownership 60.3% 63.3% 83.0% Married or Living w/ Partner 49.8% 44.8% 69.3% U.S. Born 98.9% 61.4% 98.3%
  • 47.
    Socio-demographics by GenerationCohort by Ethnicity - Youngest African American Caribbean White Female 54.6% 67.1% 59.0% Employed 66.5% 53.4% 67.1% Home Ownership 41.3% 45.1% 56.0% Married or Living w/ Partner 27.5% 22.0% 42.2% U.S. Born 99.2% 81.5% 98.9%
  • 48.
    Made Changes inBehaviors by Ever Been Tested H54. Ever Been Tested for HIV/AIDS? H55. Made Changes in Behaviors?
  • 49.
    Chances of GettingHIV/AIDS by Ever Been Tested H54. Ever Been Tested for HIV/AIDS? H56. Your Chances of Getting HIV/AIDS?
  • 50.
    Chances of GettingHIV/AIDS by Made Changes in Behaviors H55. Made Changes in Your Sexual or Other Behaviors due to HIV/AIDS? H56. Your Chances of Getting HIV/AIDS?
  • 51.
    Percent Changed SexualBehavior Due to AIDS/HIV by Generation Cohort by Ethnicity
  • 52.
    Chances of GettingHIV Virus by Ethnicity - Oldest
  • 53.
    Chances of GettingHIV Virus by Ethnicity - Middle
  • 54.
    Chances of GettingHIV Virus by Ethnicity - Youngest
  • 55.
    Prevalence of LifetimeMajor Depressive Disorder by Generation Cohort by Race
  • 56.
    Prevalence of 12-MonthMajor Depressive Disorder by Generation Cohort by Race
  • 57.
    Prevalence of LifetimeBipolar* Disorder by Generation Cohort by Race *Combination of Bipolar I, Bipolar II, Subthreshold
  • 58.
    Prevalence of LifetimeAlcohol Abuse or Dependence by Generation Cohort by Ethnicity
  • 59.
    Prevalence of LifetimeDrug Abuse or Dependence by Generation Cohort by Ethnicity
  • 60.
    Black Caribbean andAfrican Immigrant 5 City Diaspora Study Toronto ~ 1,500 + Multi-Gen* London ~ 1,500 + Multi-Gen* Jamaica 1,500 + Multi-Gen** Guyana 2,066 + Multi-Gen** Miami (Washington DC, Los Angeles) ~ 1,500 + Multi-Gen* *Pending **Completed
  • 61.
    Socio-demographics of U.SBorn and Foreign Born Caribbean, Guyanese and Jamaican US Born Caribbean Foreign Born Caribbean Guyanese Jamaican Avg. Age (years) 34.8 43.4 40.1 36.9 Avg. Years of Education 13.4 12.9 10.88 11.94 Female 60.0% 60.5% 61.1% 70.1% Working 70.7% 73.8% 56.2% 54.4% Married 35.2% 45.7% 49.5% 33.1% Own Home 34.3% 41.3% 55.6% 46.9%
  • 62.
    Percent of Respondents“Screened Into” Lifetime Major Depressive Disorder, Mania, Substance Abuse or Dependence US Born Caribbean Foreign Born Caribbean Guyanese Jamaican Depression 60.9% 46.0% 61.9% 65.3% Mania 27.1% 14.7% 22.7% 23.0% Substance Abuse or Dependence 13.6% 4.8% 7.7% 4.1%
  • 63.
    Conclusions on Intra-GenerationalFamily and Cross-National Comparisons Life-Course Perspective Aging and Multi-Generational Cross-National Comparisons Tremendous resource for new investigators interested in R.I.C.E. in the context of aging and human development
  • 64.
    International Multi-Generational Survey: Caribbean Base Core Multi-Generational Respondent Jamaica/Guyana Selected Multi-Generational Family Members Caribbean/United States/England/Canada /
  • 65.
    NSAL Panel Study Two Wave Face-to-Face Follow-up of NSAL Biomarkers Genotyping Better Phenotyping MD Incidence Assessment Longitudinal Social, Psychological and Contextual Factors
  • 66.
    Outcomes of theNSAL In-depth data on important American Black, Afro-Caribbean, and Latino, Asian, and Non-Hispanic White populations at the beginning of the new century. International Comparisons Data that go beyond demographic and economic descriptions.
  • 67.
    Outcomes of theNSAL Important social, health, mental health, political, and attitudinal data for new scientific discoveries and public policy relevant decision-making. Large enough samples to investigate within group differences and similarities – especially environmental influences.
  • 68.
  • 69.
    Websites for NSALand CPES Information: http://rcgd.isr.umich.edu/prba/nsal.htm http://www.icpsr.umich.edu/sumprog/courses/2007-03-44.html http://www.icpsr.umich.edu/training/index.html