Download free for 30 days
Sign in
Upload
Language (EN)
Support
Business
Mobile
Social Media
Marketing
Technology
Art & Photos
Career
Design
Education
Presentations & Public Speaking
Government & Nonprofit
Healthcare
Internet
Law
Leadership & Management
Automotive
Engineering
Software
Recruiting & HR
Retail
Sales
Services
Science
Small Business & Entrepreneurship
Food
Environment
Economy & Finance
Data & Analytics
Investor Relations
Sports
Spiritual
News & Politics
Travel
Self Improvement
Real Estate
Entertainment & Humor
Health & Medicine
Devices & Hardware
Lifestyle
Change Language
Language
English
Español
Português
Français
Deutsche
Cancel
Save
Submit search
EN
Uploaded by
Rajiv Academy for Technology & Management Mathura
PPT, PDF
19 views
Scaling & Measurement Techniques unit 3.ppt
validity,and reliability or attitude scaling and Techniques
Leadership & Management
◦
Read more
0
Save
Share
Embed
Embed presentation
Download
Download to read offline
1
/ 59
2
/ 59
3
/ 59
4
/ 59
5
/ 59
6
/ 59
7
/ 59
8
/ 59
9
/ 59
10
/ 59
11
/ 59
12
/ 59
13
/ 59
14
/ 59
15
/ 59
16
/ 59
17
/ 59
18
/ 59
19
/ 59
20
/ 59
21
/ 59
22
/ 59
23
/ 59
24
/ 59
25
/ 59
26
/ 59
27
/ 59
28
/ 59
29
/ 59
30
/ 59
31
/ 59
32
/ 59
33
/ 59
34
/ 59
35
/ 59
36
/ 59
37
/ 59
38
/ 59
39
/ 59
40
/ 59
41
/ 59
42
/ 59
43
/ 59
44
/ 59
45
/ 59
46
/ 59
47
/ 59
48
/ 59
49
/ 59
50
/ 59
51
/ 59
52
/ 59
53
/ 59
54
/ 59
55
/ 59
56
/ 59
57
/ 59
58
/ 59
59
/ 59
More Related Content
PPTX
Scaling and measurement technique
by
Siddharth Gupta
PPTX
BRM 203 UNIT 3 Scaling & mesurement technique Dr Kanchan.pptx
by
Dr. Kanchan Kumari
PPT
Research methodology week09
by
anukkr
PPTX
Business research methods
by
lankapothu nagarjuna reddy
PPT
Chapter 6 Measurments and Scalling.ppt Lecture 1 Intro to Management
by
DrMuhammadNawazKhan
PPT
RM9.ppt
by
narman1402
PPT
ARM Module 3 advanced research methodology
by
vasupradeep2
PPT
Research Methodology Research Design Relaibility
by
RAJUSHATHABOINA
Scaling and measurement technique
by
Siddharth Gupta
BRM 203 UNIT 3 Scaling & mesurement technique Dr Kanchan.pptx
by
Dr. Kanchan Kumari
Research methodology week09
by
anukkr
Business research methods
by
lankapothu nagarjuna reddy
Chapter 6 Measurments and Scalling.ppt Lecture 1 Intro to Management
by
DrMuhammadNawazKhan
RM9.ppt
by
narman1402
ARM Module 3 advanced research methodology
by
vasupradeep2
Research Methodology Research Design Relaibility
by
RAJUSHATHABOINA
Similar to Scaling & Measurement Techniques unit 3.ppt
PPTX
Reliability & Validity
by
Ikbal Ahmed
PPT
Chp8 - Research Methods for Business By Authors Uma Sekaran and Roger Bougie
by
Hassan Usman
PPTX
C6 - MEASUREMENT AND SCALE (RESEARCH).pptx
by
2022831176
PPT
23APR_NR_Data collection Methods_Part 3.ppt
by
kowsalram20
PPT
23APR_NR_Data collection Methods_Part 3.ppt
by
kowsalram20
PPTX
Research Methodology3_Measurement.pptx
by
AamirMaqsood8
PPTX
UNIT 3 Measurement and scaling.pptx university
by
anjalimalle2002
PPT
Scales and Measurement and surrounding etc
by
lucbrouillard381
PPTX
Data is required to make a decision in any business situation. The researcher...
by
ranjithas22
PPTX
Data is required to make a decision in any business situation. The researcher...
by
ranjithas22
PPTX
Unit 3.pptx
by
Wasimreza6
PPTX
measurement and scaling techniques
by
Akanksha Gupta
PPT
BRM Unit II
by
Murugan Saravanan
PDF
Measurement and Scaling - Business Research.pdf
by
mohammadp124b019
PPTX
Measuring scaling new.pptx
by
Renu Lamba
PPTX
eeMba ii rm unit-3.1 measurement & scaling a
by
Rai University
PPTX
Business Research Method - Unit III, AKTU, Lucknow Syllabus
by
Kartikeya Singh
PPT
attitude mesurement and scaling
by
Nancy Dawar
PDF
7 measurement & questionnaires design (Dr. Mai,2014)
by
Phong Đá
PPTX
Mesurement and Scaling (4).pptx
by
AkashSubedar
Reliability & Validity
by
Ikbal Ahmed
Chp8 - Research Methods for Business By Authors Uma Sekaran and Roger Bougie
by
Hassan Usman
C6 - MEASUREMENT AND SCALE (RESEARCH).pptx
by
2022831176
23APR_NR_Data collection Methods_Part 3.ppt
by
kowsalram20
23APR_NR_Data collection Methods_Part 3.ppt
by
kowsalram20
Research Methodology3_Measurement.pptx
by
AamirMaqsood8
UNIT 3 Measurement and scaling.pptx university
by
anjalimalle2002
Scales and Measurement and surrounding etc
by
lucbrouillard381
Data is required to make a decision in any business situation. The researcher...
by
ranjithas22
Data is required to make a decision in any business situation. The researcher...
by
ranjithas22
Unit 3.pptx
by
Wasimreza6
measurement and scaling techniques
by
Akanksha Gupta
BRM Unit II
by
Murugan Saravanan
Measurement and Scaling - Business Research.pdf
by
mohammadp124b019
Measuring scaling new.pptx
by
Renu Lamba
eeMba ii rm unit-3.1 measurement & scaling a
by
Rai University
Business Research Method - Unit III, AKTU, Lucknow Syllabus
by
Kartikeya Singh
attitude mesurement and scaling
by
Nancy Dawar
7 measurement & questionnaires design (Dr. Mai,2014)
by
Phong Đá
Mesurement and Scaling (4).pptx
by
AkashSubedar
More from Rajiv Academy for Technology & Management Mathura
PPT
Applied Data Analysis.ppt
by
Rajiv Academy for Technology & Management Mathura
PPTX
Safety stock.pptx Material management notes
by
Rajiv Academy for Technology & Management Mathura
PPTX
Procurement.pptx material management notes
by
Rajiv Academy for Technology & Management Mathura
DOCX
Research Methodology notes (Unit 1st) For MBA Students
by
Rajiv Academy for Technology & Management Mathura
PPTX
Framework for Circular Economy Industrial Cluster Ecosystems to.pptx
by
Rajiv Academy for Technology & Management Mathura
DOCX
Research Design notes Unit 2 for MBA students
by
Rajiv Academy for Technology & Management Mathura
PDF
store management.pdf notes graduation students
by
Rajiv Academy for Technology & Management Mathura
DOCX
sampling : Probability sample & Non Probability sampleunit4.docx
by
Rajiv Academy for Technology & Management Mathura
PPTX
Materials-Management notes b.ecom-PPT-1.pptx
by
Rajiv Academy for Technology & Management Mathura
PDF
channel distribution.pdf notes for graduation students
by
Rajiv Academy for Technology & Management Mathura
PPTX
INTERNATIONAL TRADE subject for B.ecom 4th sem
by
Rajiv Academy for Technology & Management Mathura
PPTX
trade Barriers.pptx from international trade
by
Rajiv Academy for Technology & Management Mathura
DOC
Data Analysis, Hypothesis ,Report writing Unit 5 RM.doc
by
Rajiv Academy for Technology & Management Mathura
PPTX
Basic Concepts about Income Tax 1st lecture.pptx
by
Rajiv Academy for Technology & Management Mathura
DOCX
statistics MBA first year Unit - first.docx
by
Rajiv Academy for Technology & Management Mathura
DOC
hr analytics three units.doc notes for mba
by
Rajiv Academy for Technology & Management Mathura
PPTX
Import-Export License & Open General License (OGL.pptx
by
Rajiv Academy for Technology & Management Mathura
PPTX
LIFO (Last-In, First-Out) Inventory Method.pptx
by
Rajiv Academy for Technology & Management Mathura
DOC
lecture notes for MBA notes Unit - 2.doc
by
Rajiv Academy for Technology & Management Mathura
Applied Data Analysis.ppt
by
Rajiv Academy for Technology & Management Mathura
Safety stock.pptx Material management notes
by
Rajiv Academy for Technology & Management Mathura
Procurement.pptx material management notes
by
Rajiv Academy for Technology & Management Mathura
Research Methodology notes (Unit 1st) For MBA Students
by
Rajiv Academy for Technology & Management Mathura
Framework for Circular Economy Industrial Cluster Ecosystems to.pptx
by
Rajiv Academy for Technology & Management Mathura
Research Design notes Unit 2 for MBA students
by
Rajiv Academy for Technology & Management Mathura
store management.pdf notes graduation students
by
Rajiv Academy for Technology & Management Mathura
sampling : Probability sample & Non Probability sampleunit4.docx
by
Rajiv Academy for Technology & Management Mathura
Materials-Management notes b.ecom-PPT-1.pptx
by
Rajiv Academy for Technology & Management Mathura
channel distribution.pdf notes for graduation students
by
Rajiv Academy for Technology & Management Mathura
INTERNATIONAL TRADE subject for B.ecom 4th sem
by
Rajiv Academy for Technology & Management Mathura
trade Barriers.pptx from international trade
by
Rajiv Academy for Technology & Management Mathura
Data Analysis, Hypothesis ,Report writing Unit 5 RM.doc
by
Rajiv Academy for Technology & Management Mathura
Basic Concepts about Income Tax 1st lecture.pptx
by
Rajiv Academy for Technology & Management Mathura
statistics MBA first year Unit - first.docx
by
Rajiv Academy for Technology & Management Mathura
hr analytics three units.doc notes for mba
by
Rajiv Academy for Technology & Management Mathura
Import-Export License & Open General License (OGL.pptx
by
Rajiv Academy for Technology & Management Mathura
LIFO (Last-In, First-Out) Inventory Method.pptx
by
Rajiv Academy for Technology & Management Mathura
lecture notes for MBA notes Unit - 2.doc
by
Rajiv Academy for Technology & Management Mathura
Scaling & Measurement Techniques unit 3.ppt
1.
Copyright© Dorling Kindersley India Pvt Ltd Copyright© Dorling Kindersley India Pvt Ltd Business Research Methods Naval
Bajpai Chapter 3 Measurement and Scaling
2.
Copyright© Dorling Kindersley India Pvt Ltd Business Research Methods Naval
Bajpai Learning Objectives Upon completion of this chapter, you will be able to: Understand the scale of measurement and four levels of data measurement Understand the criteria for good measurement Learn about the various established measurement scales used in business research Understand the factors to be considered in selecting the appropriate measurement scales
3.
Copyright© Dorling Kindersley India Pvt Ltd WHAT SHOULD BE
MEASURED? The measurement of physical properties is not a complex deal, whereas measurement of psychological properties requires a careful attention of a researcher. The quality of the research always depends on the fact that what measurement techniques are adopted by the researcher and how these fit in the prevailing research circumstances. Business Research Methods Naval Bajpai
4.
Copyright© Dorling Kindersley India Pvt Ltd Business Research Methods Naval
Bajpai Scales of Measurement Nominal scale Ordinal scale Interval scale Ratio scale
5.
Copyright© Dorling Kindersley India Pvt Ltd Business Research Methods Naval
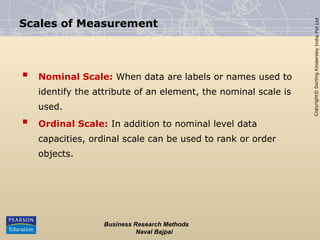
Bajpai Scales of Measurement Nominal Scale: When data are labels or names used to identify the attribute of an element, the nominal scale is used. Ordinal Scale: In addition to nominal level data capacities, ordinal scale can be used to rank or order objects.
6.
Copyright© Dorling Kindersley India Pvt Ltd Business Research Methods Naval
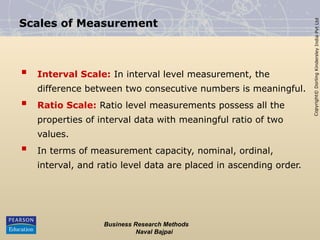
Bajpai Scales of Measurement Interval Scale: In interval level measurement, the difference between two consecutive numbers is meaningful. Ratio Scale: Ratio level measurements possess all the properties of interval data with meaningful ratio of two values. In terms of measurement capacity, nominal, ordinal, interval, and ratio level data are placed in ascending order.
7.
Copyright© Dorling Kindersley India Pvt Ltd Business Research Methods Naval
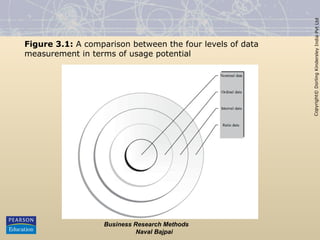
Bajpai Figure 3.1: A comparison between the four levels of data measurement in terms of usage potential
8.
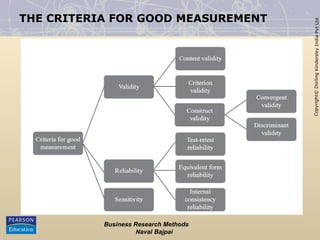
Copyright© Dorling Kindersley India Pvt Ltd THE CRITERIA FOR
GOOD MEASUREMENT Business Research Methods Naval Bajpai
9.
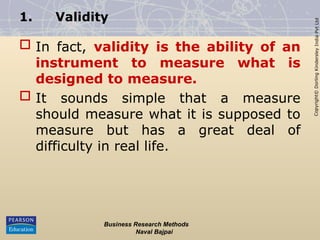
Copyright© Dorling Kindersley India Pvt Ltd 1. Validity In
fact, validity is the ability of an instrument to measure what is designed to measure. It sounds simple that a measure should measure what it is supposed to measure but has a great deal of difficulty in real life. Business Research Methods Naval Bajpai
10.
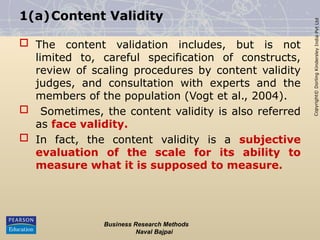
Copyright© Dorling Kindersley India Pvt Ltd 1(a)Content Validity The
content validation includes, but is not limited to, careful specification of constructs, review of scaling procedures by content validity judges, and consultation with experts and the members of the population (Vogt et al., 2004). Sometimes, the content validity is also referred as face validity. In fact, the content validity is a subjective evaluation of the scale for its ability to measure what it is supposed to measure. Business Research Methods Naval Bajpai
11.
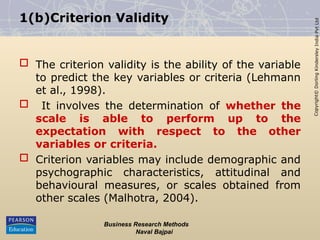
Copyright© Dorling Kindersley India Pvt Ltd 1(b)Criterion Validity The
criterion validity is the ability of the variable to predict the key variables or criteria (Lehmann et al., 1998). It involves the determination of whether the scale is able to perform up to the expectation with respect to the other variables or criteria. Criterion variables may include demographic and psychographic characteristics, attitudinal and behavioural measures, or scales obtained from other scales (Malhotra, 2004). Business Research Methods Naval Bajpai
12.
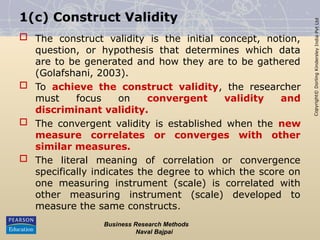
Copyright© Dorling Kindersley India Pvt Ltd 1(c) Construct Validity
The construct validity is the initial concept, notion, question, or hypothesis that determines which data are to be generated and how they are to be gathered (Golafshani, 2003). To achieve the construct validity, the researcher must focus on convergent validity and discriminant validity. The convergent validity is established when the new measure correlates or converges with other similar measures. The literal meaning of correlation or convergence specifically indicates the degree to which the score on one measuring instrument (scale) is correlated with other measuring instrument (scale) developed to measure the same constructs. Business Research Methods Naval Bajpai
13.
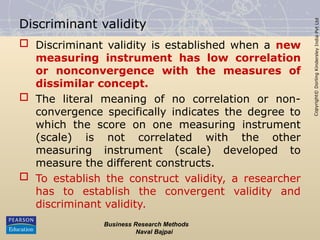
Copyright© Dorling Kindersley India Pvt Ltd Discriminant validity Discriminant
validity is established when a new measuring instrument has low correlation or nonconvergence with the measures of dissimilar concept. The literal meaning of no correlation or non- convergence specifically indicates the degree to which the score on one measuring instrument (scale) is not correlated with the other measuring instrument (scale) developed to measure the different constructs. To establish the construct validity, a researcher has to establish the convergent validity and discriminant validity. Business Research Methods Naval Bajpai
14.
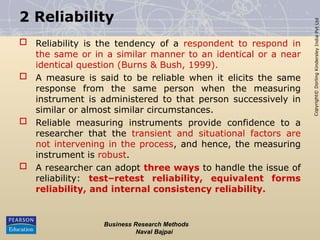
Copyright© Dorling Kindersley India Pvt Ltd 2 Reliability Reliability
is the tendency of a respondent to respond in the same or in a similar manner to an identical or a near identical question (Burns & Bush, 1999). A measure is said to be reliable when it elicits the same response from the same person when the measuring instrument is administered to that person successively in similar or almost similar circumstances. Reliable measuring instruments provide confidence to a researcher that the transient and situational factors are not intervening in the process, and hence, the measuring instrument is robust. A researcher can adopt three ways to handle the issue of reliability: test–retest reliability, equivalent forms reliability, and internal consistency reliability. Business Research Methods Naval Bajpai
15.
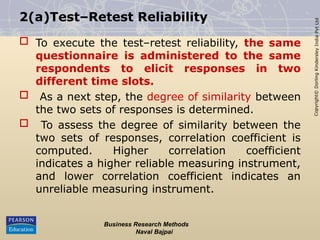
Copyright© Dorling Kindersley India Pvt Ltd 2(a)Test–Retest Reliability To
execute the test–retest reliability, the same questionnaire is administered to the same respondents to elicit responses in two different time slots. As a next step, the degree of similarity between the two sets of responses is determined. To assess the degree of similarity between the two sets of responses, correlation coefficient is computed. Higher correlation coefficient indicates a higher reliable measuring instrument, and lower correlation coefficient indicates an unreliable measuring instrument. Business Research Methods Naval Bajpai
16.
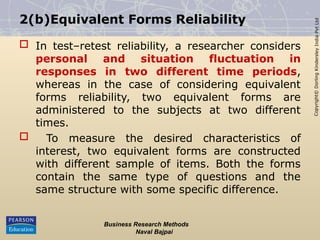
Copyright© Dorling Kindersley India Pvt Ltd 2(b)Equivalent Forms Reliability
In test–retest reliability, a researcher considers personal and situation fluctuation in responses in two different time periods, whereas in the case of considering equivalent forms reliability, two equivalent forms are administered to the subjects at two different times. To measure the desired characteristics of interest, two equivalent forms are constructed with different sample of items. Both the forms contain the same type of questions and the same structure with some specific difference. Business Research Methods Naval Bajpai
17.
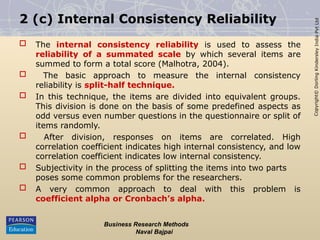
Copyright© Dorling Kindersley India Pvt Ltd 2 (c) Internal
Consistency Reliability The internal consistency reliability is used to assess the reliability of a summated scale by which several items are summed to form a total score (Malhotra, 2004). The basic approach to measure the internal consistency reliability is split-half technique. In this technique, the items are divided into equivalent groups. This division is done on the basis of some predefined aspects as odd versus even number questions in the questionnaire or split of items randomly. After division, responses on items are correlated. High correlation coefficient indicates high internal consistency, and low correlation coefficient indicates low internal consistency. Subjectivity in the process of splitting the items into two parts poses some common problems for the researchers. A very common approach to deal with this problem is coefficient alpha or Cronbach’s alpha. Business Research Methods Naval Bajpai
18.
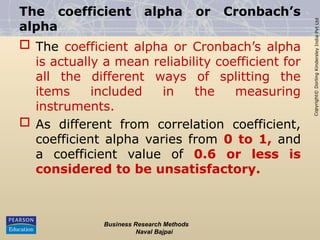
Copyright© Dorling Kindersley India Pvt Ltd The coefficient alpha
or Cronbach’s alpha The coefficient alpha or Cronbach’s alpha is actually a mean reliability coefficient for all the different ways of splitting the items included in the measuring instruments. As different from correlation coefficient, coefficient alpha varies from 0 to 1, and a coefficient value of 0.6 or less is considered to be unsatisfactory. Business Research Methods Naval Bajpai
19.
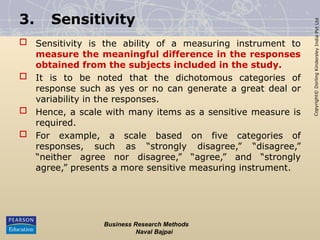
Copyright© Dorling Kindersley India Pvt Ltd 3. Sensitivity Sensitivity
is the ability of a measuring instrument to measure the meaningful difference in the responses obtained from the subjects included in the study. It is to be noted that the dichotomous categories of response such as yes or no can generate a great deal or variability in the responses. Hence, a scale with many items as a sensitive measure is required. For example, a scale based on five categories of responses, such as “strongly disagree,” “disagree,” “neither agree nor disagree,” “agree,” and “strongly agree,” presents a more sensitive measuring instrument. Business Research Methods Naval Bajpai
20.
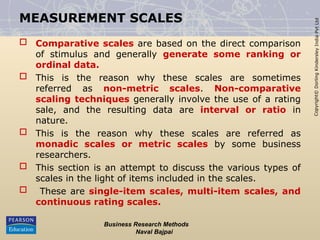
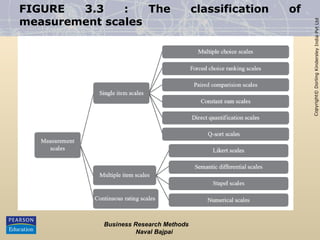
Copyright© Dorling Kindersley India Pvt Ltd MEASUREMENT SCALES Comparative
scales are based on the direct comparison of stimulus and generally generate some ranking or ordinal data. This is the reason why these scales are sometimes referred as non-metric scales. Non-comparative scaling techniques generally involve the use of a rating sale, and the resulting data are interval or ratio in nature. This is the reason why these scales are referred as monadic scales or metric scales by some business researchers. This section is an attempt to discuss the various types of scales in the light of items included in the scales. These are single-item scales, multi-item scales, and continuous rating scales. Business Research Methods Naval Bajpai
21.
Copyright© Dorling Kindersley India Pvt Ltd FIGURE 3.3 :
The classification of measurement scales Business Research Methods Naval Bajpai
22.
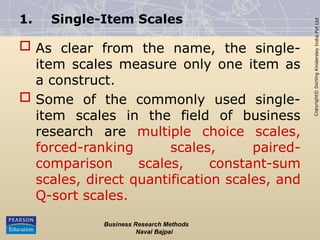
Copyright© Dorling Kindersley India Pvt Ltd 1. Single-Item Scales
As clear from the name, the single- item scales measure only one item as a construct. Some of the commonly used single- item scales in the field of business research are multiple choice scales, forced-ranking scales, paired- comparison scales, constant-sum scales, direct quantification scales, and Q-sort scales. Business Research Methods Naval Bajpai
23.
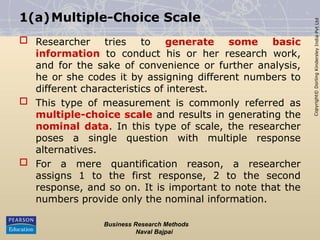
Copyright© Dorling Kindersley India Pvt Ltd 1(a)Multiple-Choice Scale Researcher
tries to generate some basic information to conduct his or her research work, and for the sake of convenience or further analysis, he or she codes it by assigning different numbers to different characteristics of interest. This type of measurement is commonly referred as multiple-choice scale and results in generating the nominal data. In this type of scale, the researcher poses a single question with multiple response alternatives. For a mere quantification reason, a researcher assigns 1 to the first response, 2 to the second response, and so on. It is important to note that the numbers provide only the nominal information. Business Research Methods Naval Bajpai
24.
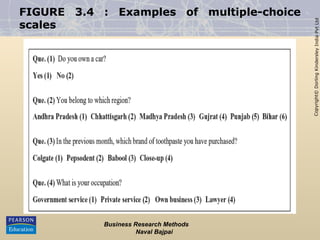
Copyright© Dorling Kindersley India Pvt Ltd FIGURE 3.4 :
Examples of multiple-choice scales Business Research Methods Naval Bajpai
25.
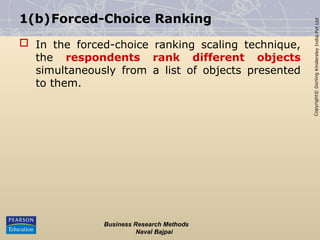
Copyright© Dorling Kindersley India Pvt Ltd 1(b)Forced-Choice Ranking In
the forced-choice ranking scaling technique, the respondents rank different objects simultaneously from a list of objects presented to them. Business Research Methods Naval Bajpai
26.
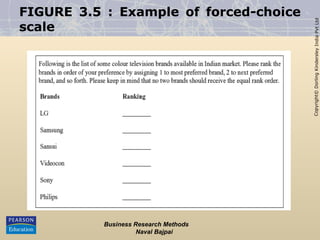
Copyright© Dorling Kindersley India Pvt Ltd FIGURE 3.5 :
Example of forced-choice scale Business Research Methods Naval Bajpai
27.
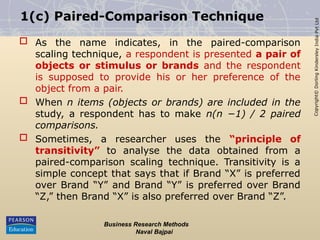
Copyright© Dorling Kindersley India Pvt Ltd 1(c) Paired-Comparison Technique
As the name indicates, in the paired-comparison scaling technique, a respondent is presented a pair of objects or stimulus or brands and the respondent is supposed to provide his or her preference of the object from a pair. When n items (objects or brands) are included in the study, a respondent has to make n(n −1) / 2 paired comparisons. Sometimes, a researcher uses the “principle of transitivity” to analyse the data obtained from a paired-comparison scaling technique. Transitivity is a simple concept that says that if Brand “X” is preferred over Brand “Y” and Brand “Y” is preferred over Brand “Z,” then Brand “X” is also preferred over Brand “Z”. Business Research Methods Naval Bajpai
28.
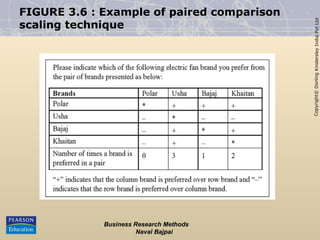
Copyright© Dorling Kindersley India Pvt Ltd FIGURE 3.6 :
Example of paired comparison scaling technique Business Research Methods Naval Bajpai
29.
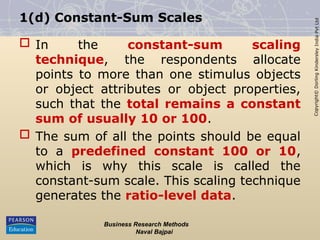
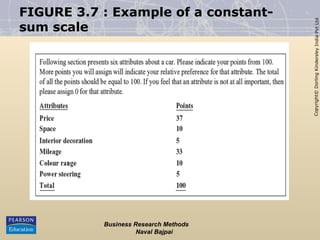
Copyright© Dorling Kindersley India Pvt Ltd 1(d) Constant-Sum Scales
In the constant-sum scaling technique, the respondents allocate points to more than one stimulus objects or object attributes or object properties, such that the total remains a constant sum of usually 10 or 100. The sum of all the points should be equal to a predefined constant 100 or 10, which is why this scale is called the constant-sum scale. This scaling technique generates the ratio-level data. Business Research Methods Naval Bajpai
30.
Copyright© Dorling Kindersley India Pvt Ltd FIGURE 3.7 :
Example of a constant- sum scale Business Research Methods Naval Bajpai
31.
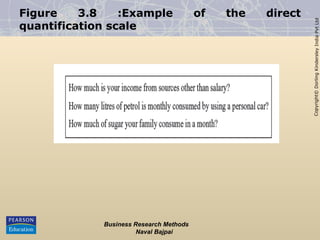
Copyright© Dorling Kindersley India Pvt Ltd 1(e) Direct Quantification
Scale The simplest form of obtaining information is to directly ask a question related to some characteristics of interest resulting in ratio-scaled data. Researchers generally ask a question related to payment intention of consumers. Business Research Methods Naval Bajpai
32.
Copyright© Dorling Kindersley India Pvt Ltd Figure 3.8 :Example
of the direct quantification scale Business Research Methods Naval Bajpai
33.
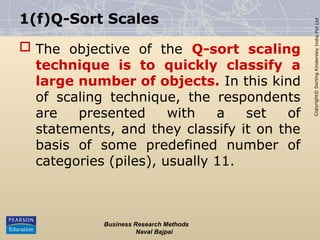
Copyright© Dorling Kindersley India Pvt Ltd 1(f)Q-Sort Scales The
objective of the Q-sort scaling technique is to quickly classify a large number of objects. In this kind of scaling technique, the respondents are presented with a set of statements, and they classify it on the basis of some predefined number of categories (piles), usually 11. Business Research Methods Naval Bajpai
34.
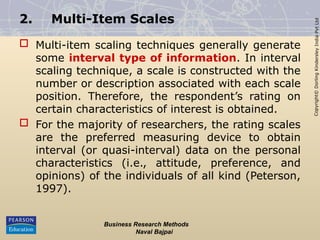
Copyright© Dorling Kindersley India Pvt Ltd 2. Multi-Item Scales
Multi-item scaling techniques generally generate some interval type of information. In interval scaling technique, a scale is constructed with the number or description associated with each scale position. Therefore, the respondent’s rating on certain characteristics of interest is obtained. For the majority of researchers, the rating scales are the preferred measuring device to obtain interval (or quasi-interval) data on the personal characteristics (i.e., attitude, preference, and opinions) of the individuals of all kind (Peterson, 1997). Business Research Methods Naval Bajpai
35.
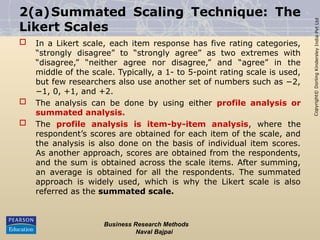
Copyright© Dorling Kindersley India Pvt Ltd 2(a)Summated Scaling Technique:
The Likert Scales In a Likert scale, each item response has five rating categories, “strongly disagree” to “strongly agree” as two extremes with “disagree,” “neither agree nor disagree,” and “agree” in the middle of the scale. Typically, a 1- to 5-point rating scale is used, but few researchers also use another set of numbers such as −2, −1, 0, +1, and +2. The analysis can be done by using either profile analysis or summated analysis. The profile analysis is item-by-item analysis, where the respondent’s scores are obtained for each item of the scale, and the analysis is also done on the basis of individual item scores. As another approach, scores are obtained from the respondents, and the sum is obtained across the scale items. After summing, an average is obtained for all the respondents. The summated approach is widely used, which is why the Likert scale is also referred as the summated scale. Business Research Methods Naval Bajpai
36.
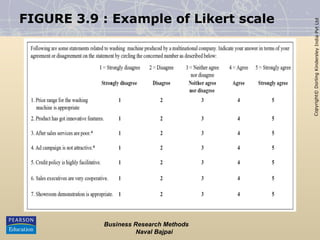
Copyright© Dorling Kindersley India Pvt Ltd FIGURE 3.9 :
Example of Likert scale Business Research Methods Naval Bajpai
37.
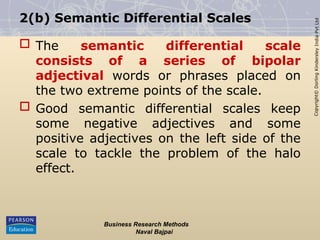
Copyright© Dorling Kindersley India Pvt Ltd 2(b) Semantic Differential
Scales The semantic differential scale consists of a series of bipolar adjectival words or phrases placed on the two extreme points of the scale. Good semantic differential scales keep some negative adjectives and some positive adjectives on the left side of the scale to tackle the problem of the halo effect. Business Research Methods Naval Bajpai
38.
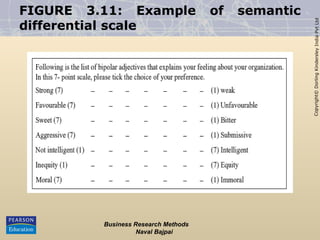
Copyright© Dorling Kindersley India Pvt Ltd FIGURE 3.11: Example
of semantic differential scale Business Research Methods Naval Bajpai
39.
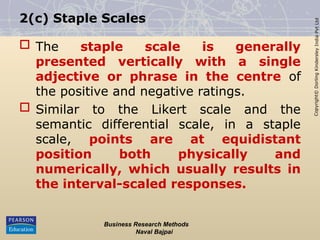
Copyright© Dorling Kindersley India Pvt Ltd 2(c) Staple Scales
The staple scale is generally presented vertically with a single adjective or phrase in the centre of the positive and negative ratings. Similar to the Likert scale and the semantic differential scale, in a staple scale, points are at equidistant position both physically and numerically, which usually results in the interval-scaled responses. Business Research Methods Naval Bajpai
40.
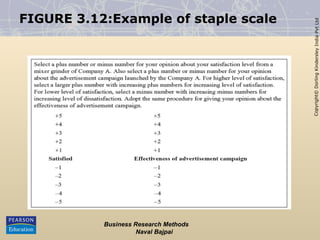
Copyright© Dorling Kindersley India Pvt Ltd FIGURE 3.12:Example of
staple scale Business Research Methods Naval Bajpai
41.
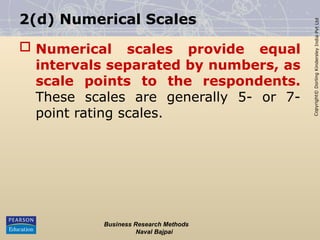
Copyright© Dorling Kindersley India Pvt Ltd 2(d) Numerical Scales
Numerical scales provide equal intervals separated by numbers, as scale points to the respondents. These scales are generally 5- or 7- point rating scales. Business Research Methods Naval Bajpai
42.
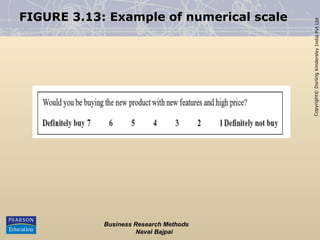
Copyright© Dorling Kindersley India Pvt Ltd FIGURE 3.13: Example
of numerical scale Business Research Methods Naval Bajpai
43.
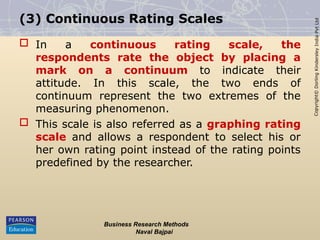
Copyright© Dorling Kindersley India Pvt Ltd (3) Continuous Rating
Scales In a continuous rating scale, the respondents rate the object by placing a mark on a continuum to indicate their attitude. In this scale, the two ends of continuum represent the two extremes of the measuring phenomenon. This scale is also referred as a graphing rating scale and allows a respondent to select his or her own rating point instead of the rating points predefined by the researcher. Business Research Methods Naval Bajpai
44.
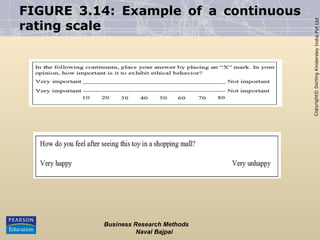
Copyright© Dorling Kindersley India Pvt Ltd FIGURE 3.14: Example
of a continuous rating scale Business Research Methods Naval Bajpai
45.
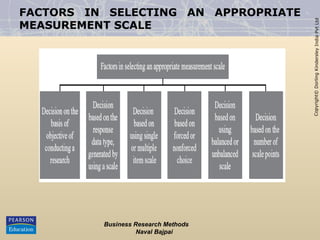
Copyright© Dorling Kindersley India Pvt Ltd FACTORS IN SELECTING
AN APPROPRIATE MEASUREMENT SCALE Business Research Methods Naval Bajpai
46.
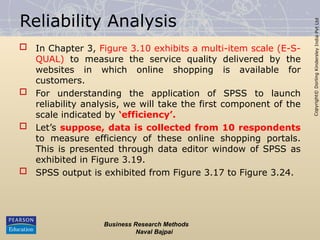
Copyright© Dorling Kindersley India Pvt Ltd Reliability Analysis In
Chapter 3, Figure 3.10 exhibits a multi-item scale (E-S- QUAL) to measure the service quality delivered by the websites in which online shopping is available for customers. For understanding the application of SPSS to launch reliability analysis, we will take the first component of the scale indicated by ‘efficiency’. Let’s suppose, data is collected from 10 respondents to measure efficiency of these online shopping portals. This is presented through data editor window of SPSS as exhibited in Figure 3.19. SPSS output is exhibited from Figure 3.17 to Figure 3.24. Business Research Methods Naval Bajpai
47.
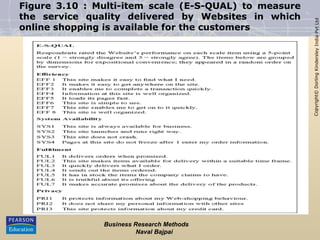
Copyright© Dorling Kindersley India Pvt Ltd Figure 3.10 :
Multi-item scale (E-S-QUAL) to measure the service quality delivered by Websites in which online shopping is available for the customers Business Research Methods Naval Bajpai
48.
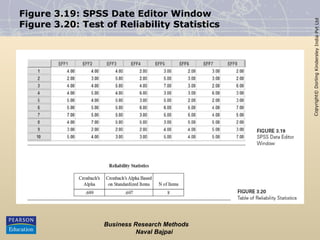
Copyright© Dorling Kindersley India Pvt Ltd Figure 3.19: SPSS
Date Editor Window Figure 3.20: Test of Reliability Statistics Business Research Methods Naval Bajpai
49.
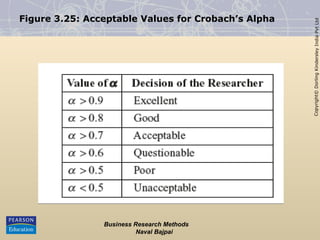
Copyright© Dorling Kindersley India Pvt Ltd Figure 3.25: Acceptable
Values for Crobach’s Alpha Business Research Methods Naval Bajpai
50.
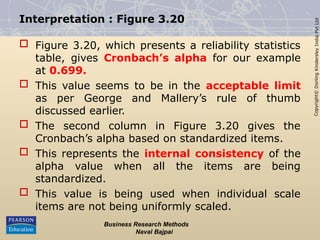
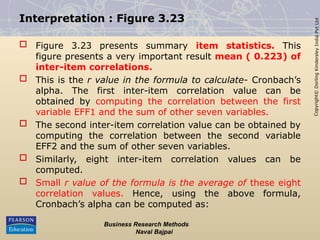
Copyright© Dorling Kindersley India Pvt Ltd Interpretation : Figure
3.20 Figure 3.20, which presents a reliability statistics table, gives Cronbach’s alpha for our example at 0.699. This value seems to be in the acceptable limit as per George and Mallery’s rule of thumb discussed earlier. The second column in Figure 3.20 gives the Cronbach’s alpha based on standardized items. This represents the internal consistency of the alpha value when all the items are being standardized. This value is being used when individual scale items are not being uniformly scaled. Business Research Methods Naval Bajpai
51.
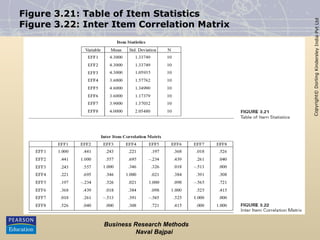
Copyright© Dorling Kindersley India Pvt Ltd Figure 3.21: Table
of Item Statistics Figure 3.22: Inter Item Correlation Matrix Business Research Methods Naval Bajpai
52.
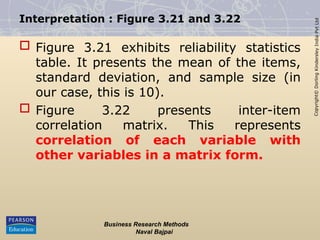
Copyright© Dorling Kindersley India Pvt Ltd Interpretation : Figure
3.21 and 3.22 Figure 3.21 exhibits reliability statistics table. It presents the mean of the items, standard deviation, and sample size (in our case, this is 10). Figure 3.22 presents inter-item correlation matrix. This represents correlation of each variable with other variables in a matrix form. Business Research Methods Naval Bajpai
53.
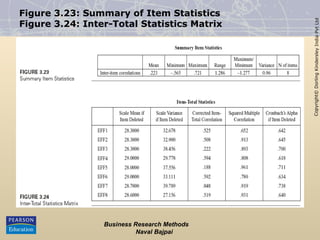
Copyright© Dorling Kindersley India Pvt Ltd Figure 3.23: Summary
of Item Statistics Figure 3.24: Inter-Total Statistics Matrix Business Research Methods Naval Bajpai
54.
Copyright© Dorling Kindersley India Pvt Ltd Interpretation : Figure
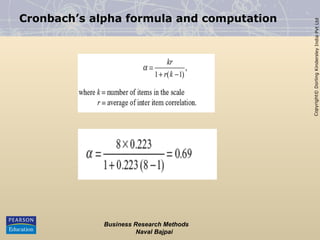
3.23 Figure 3.23 presents summary item statistics. This figure presents a very important result mean ( 0.223) of inter-item correlations. This is the r value in the formula to calculate- Cronbach’s alpha. The first inter-item correlation value can be obtained by computing the correlation between the first variable EFF1 and the sum of other seven variables. The second inter-item correlation value can be obtained by computing the correlation between the second variable EFF2 and the sum of other seven variables. Similarly, eight inter-item correlation values can be computed. Small r value of the formula is the average of these eight correlation values. Hence, using the above formula, Cronbach’s alpha can be computed as: Business Research Methods Naval Bajpai
55.
Copyright© Dorling Kindersley India Pvt Ltd Cronbach’s alpha formula
and computation Business Research Methods Naval Bajpai
56.
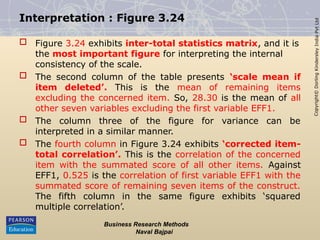
Copyright© Dorling Kindersley India Pvt Ltd Interpretation : Figure
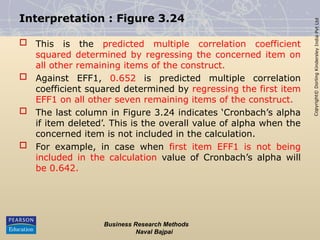
3.24 Figure 3.24 exhibits inter-total statistics matrix, and it is the most important figure for interpreting the internal consistency of the scale. The second column of the table presents ‘scale mean if item deleted’. This is the mean of remaining items excluding the concerned item. So, 28.30 is the mean of all other seven variables excluding the first variable EFF1. The column three of the figure for variance can be interpreted in a similar manner. The fourth column in Figure 3.24 exhibits ‘corrected item- total correlation’. This is the correlation of the concerned item with the summated score of all other items. Against EFF1, 0.525 is the correlation of first variable EFF1 with the summated score of remaining seven items of the construct. The fifth column in the same figure exhibits ‘squared multiple correlation’. Business Research Methods Naval Bajpai
57.
Copyright© Dorling Kindersley India Pvt Ltd Interpretation : Figure
3.24 This is the predicted multiple correlation coefficient squared determined by regressing the concerned item on all other remaining items of the construct. Against EFF1, 0.652 is predicted multiple correlation coefficient squared determined by regressing the first item EFF1 on all other seven remaining items of the construct. The last column in Figure 3.24 indicates ‘Cronbach’s alpha if item deleted’. This is the overall value of alpha when the concerned item is not included in the calculation. For example, in case when first item EFF1 is not being included in the calculation value of Cronbach’s alpha will be 0.642. Business Research Methods Naval Bajpai
58.
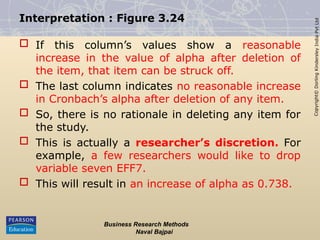
Copyright© Dorling Kindersley India Pvt Ltd Interpretation : Figure
3.24 If this column’s values show a reasonable increase in the value of alpha after deletion of the item, that item can be struck off. The last column indicates no reasonable increase in Cronbach’s alpha after deletion of any item. So, there is no rationale in deleting any item for the study. This is actually a researcher’s discretion. For example, a few researchers would like to drop variable seven EFF7. This will result in an increase of alpha as 0.738. Business Research Methods Naval Bajpai
59.
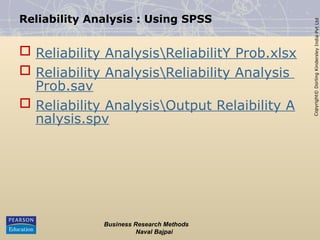
Copyright© Dorling Kindersley India Pvt Ltd Reliability Analysis :
Using SPSS Reliability AnalysisReliabilitY Prob.xlsx Reliability AnalysisReliability Analysis Prob.sav Reliability AnalysisOutput Relaibility A nalysis.spv Business Research Methods Naval Bajpai
Download