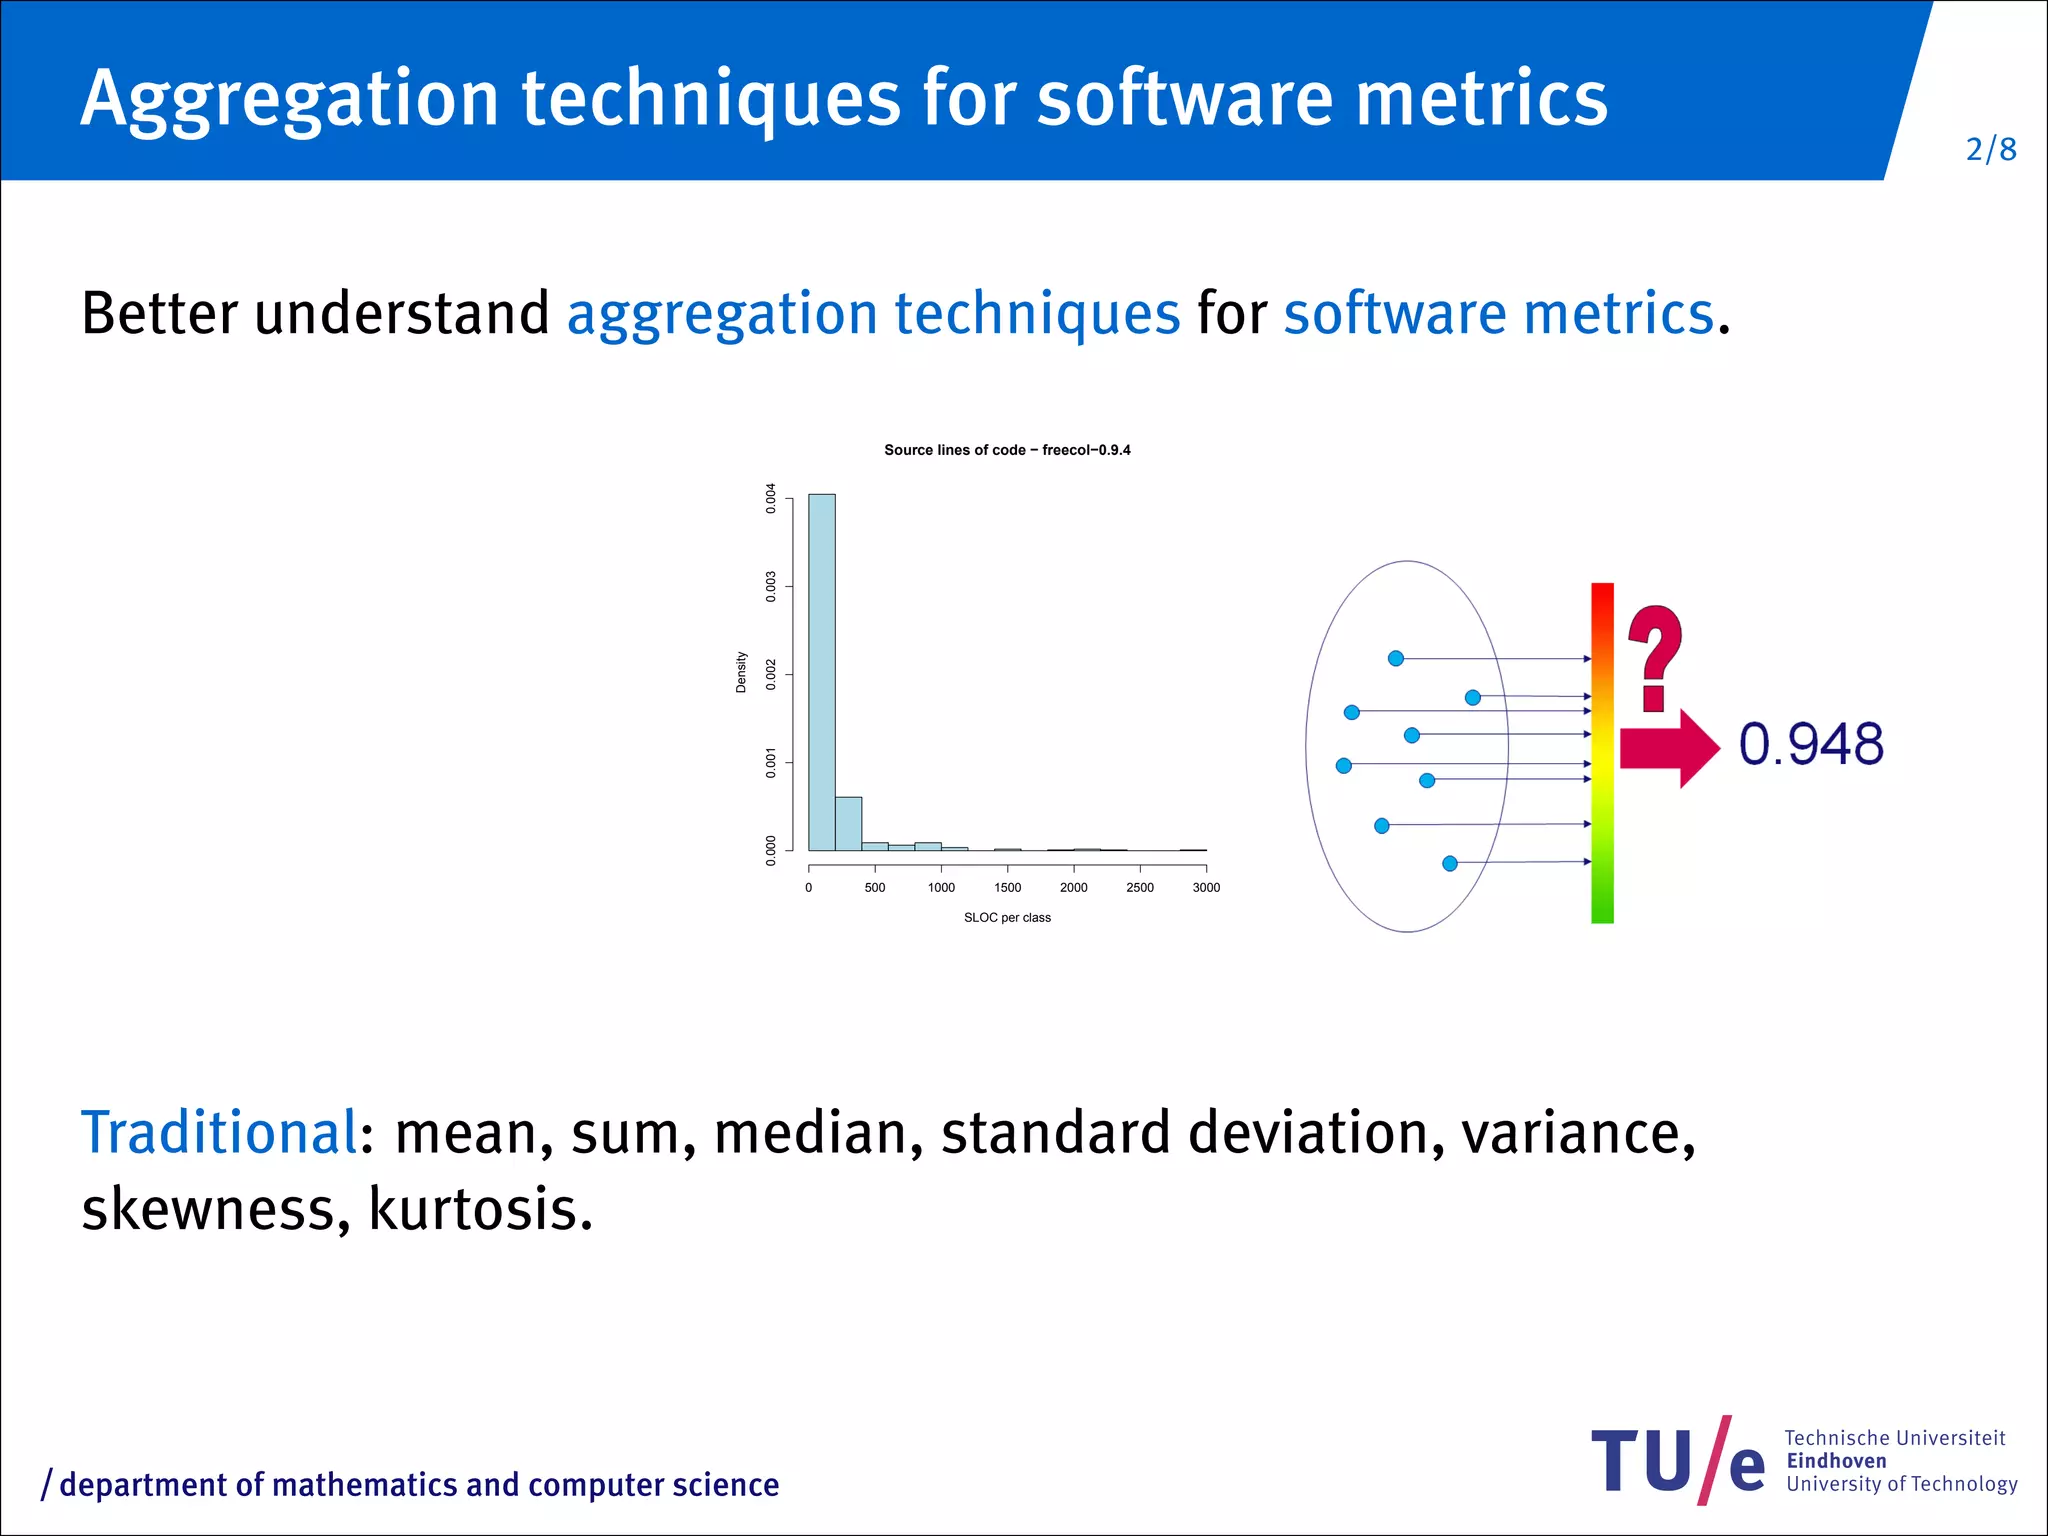
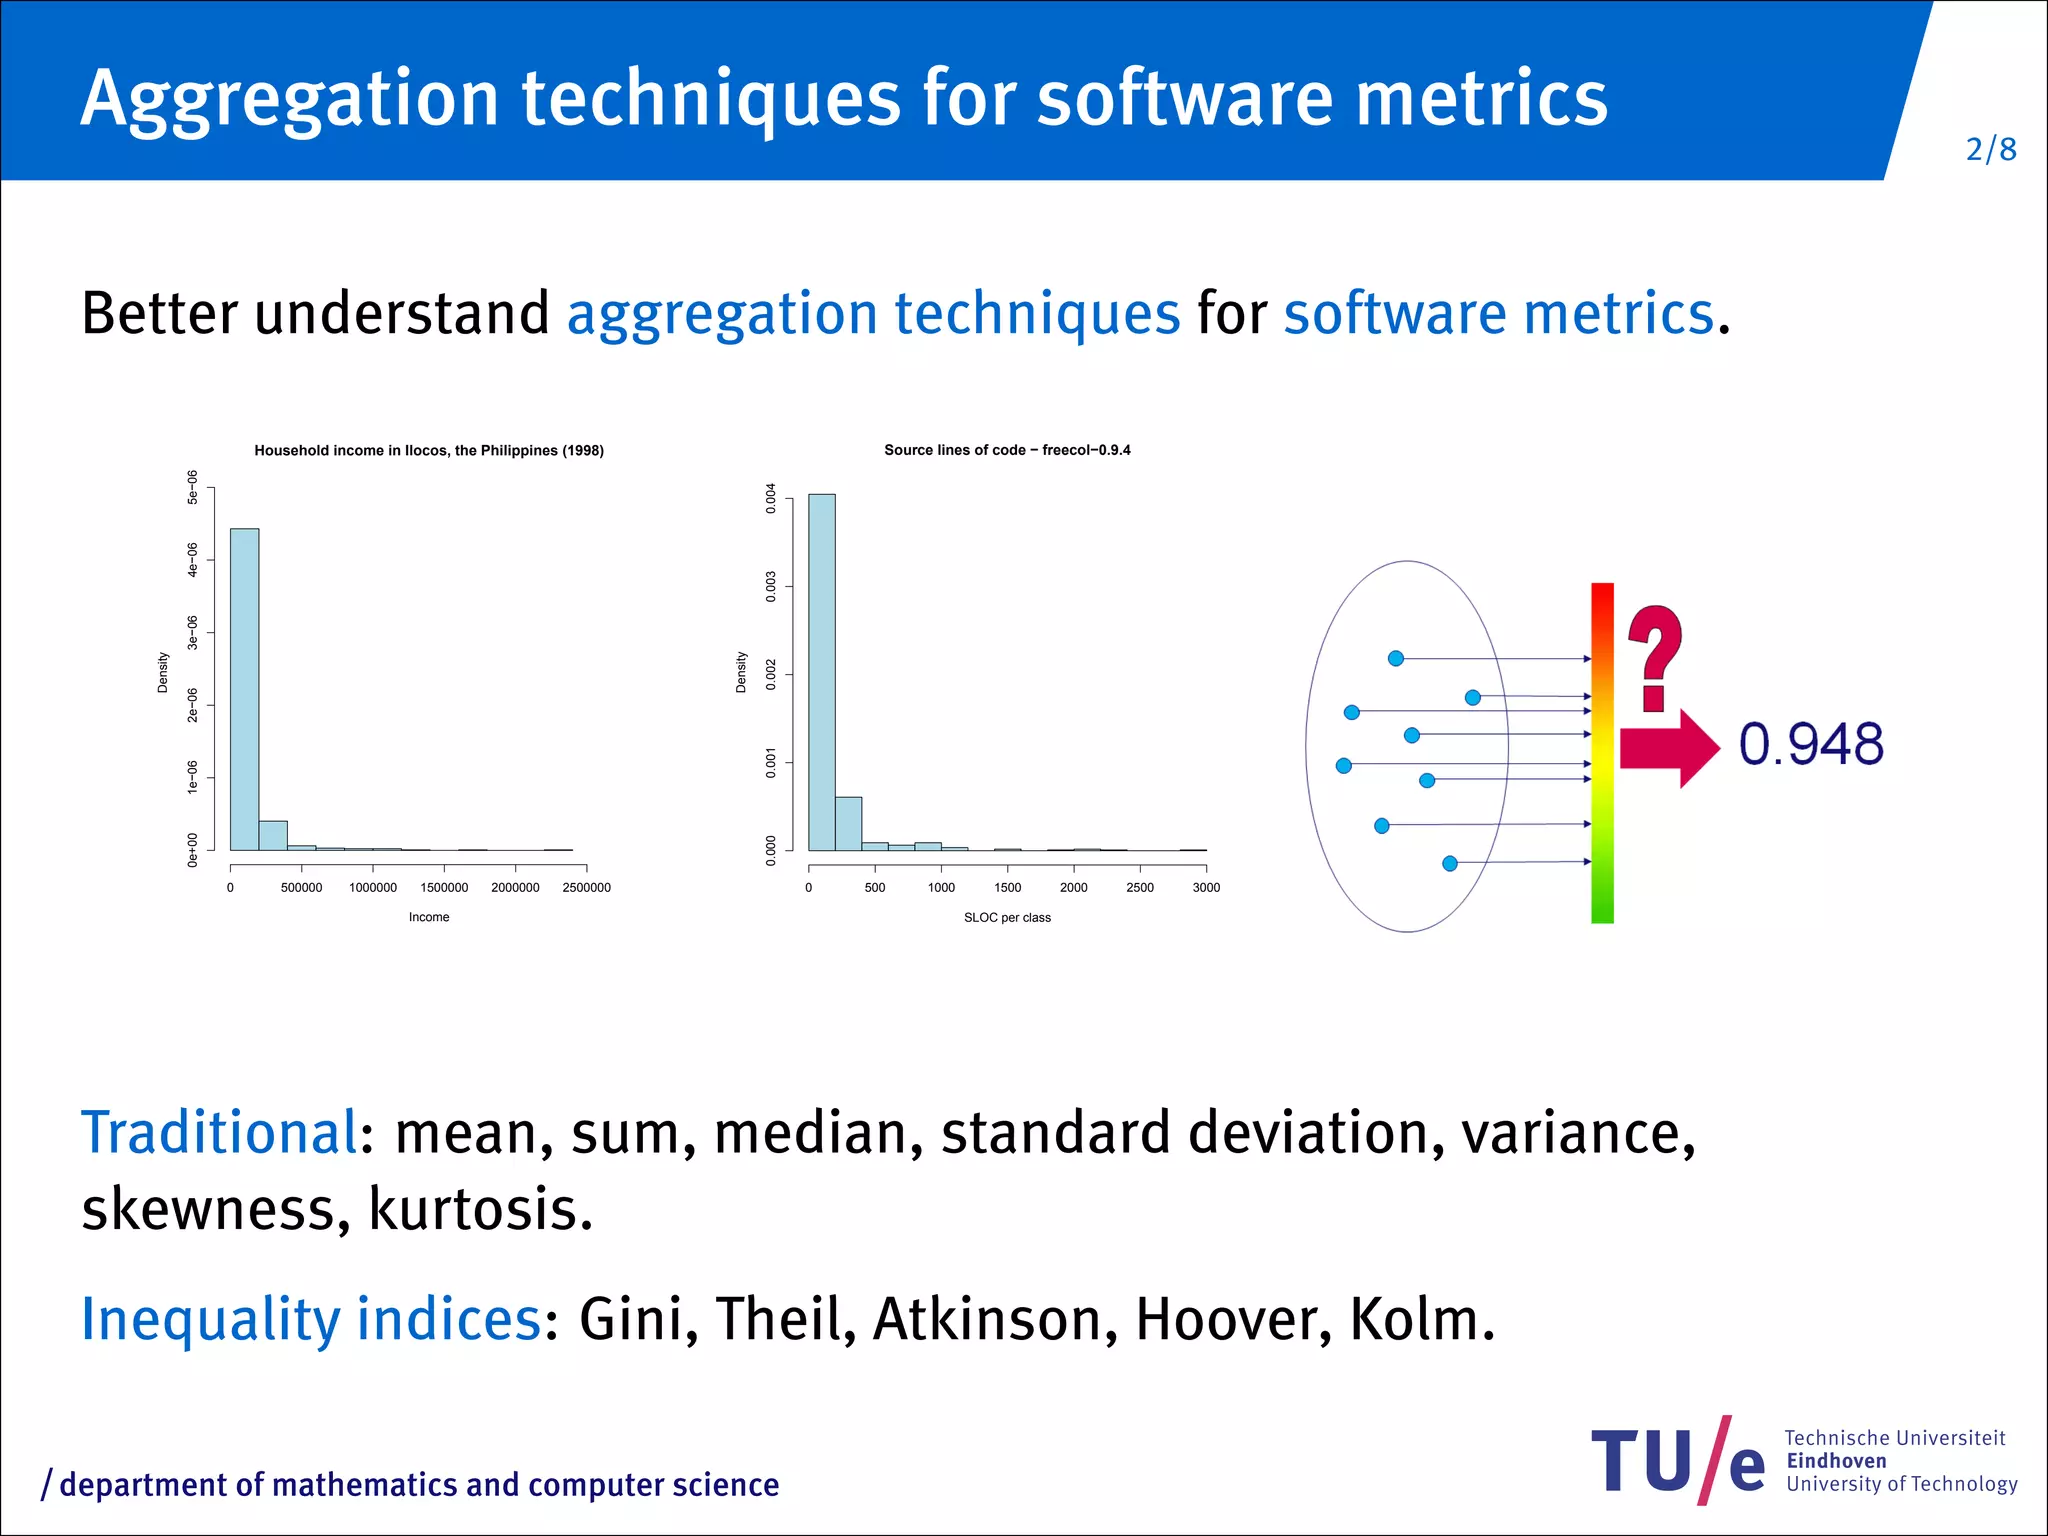
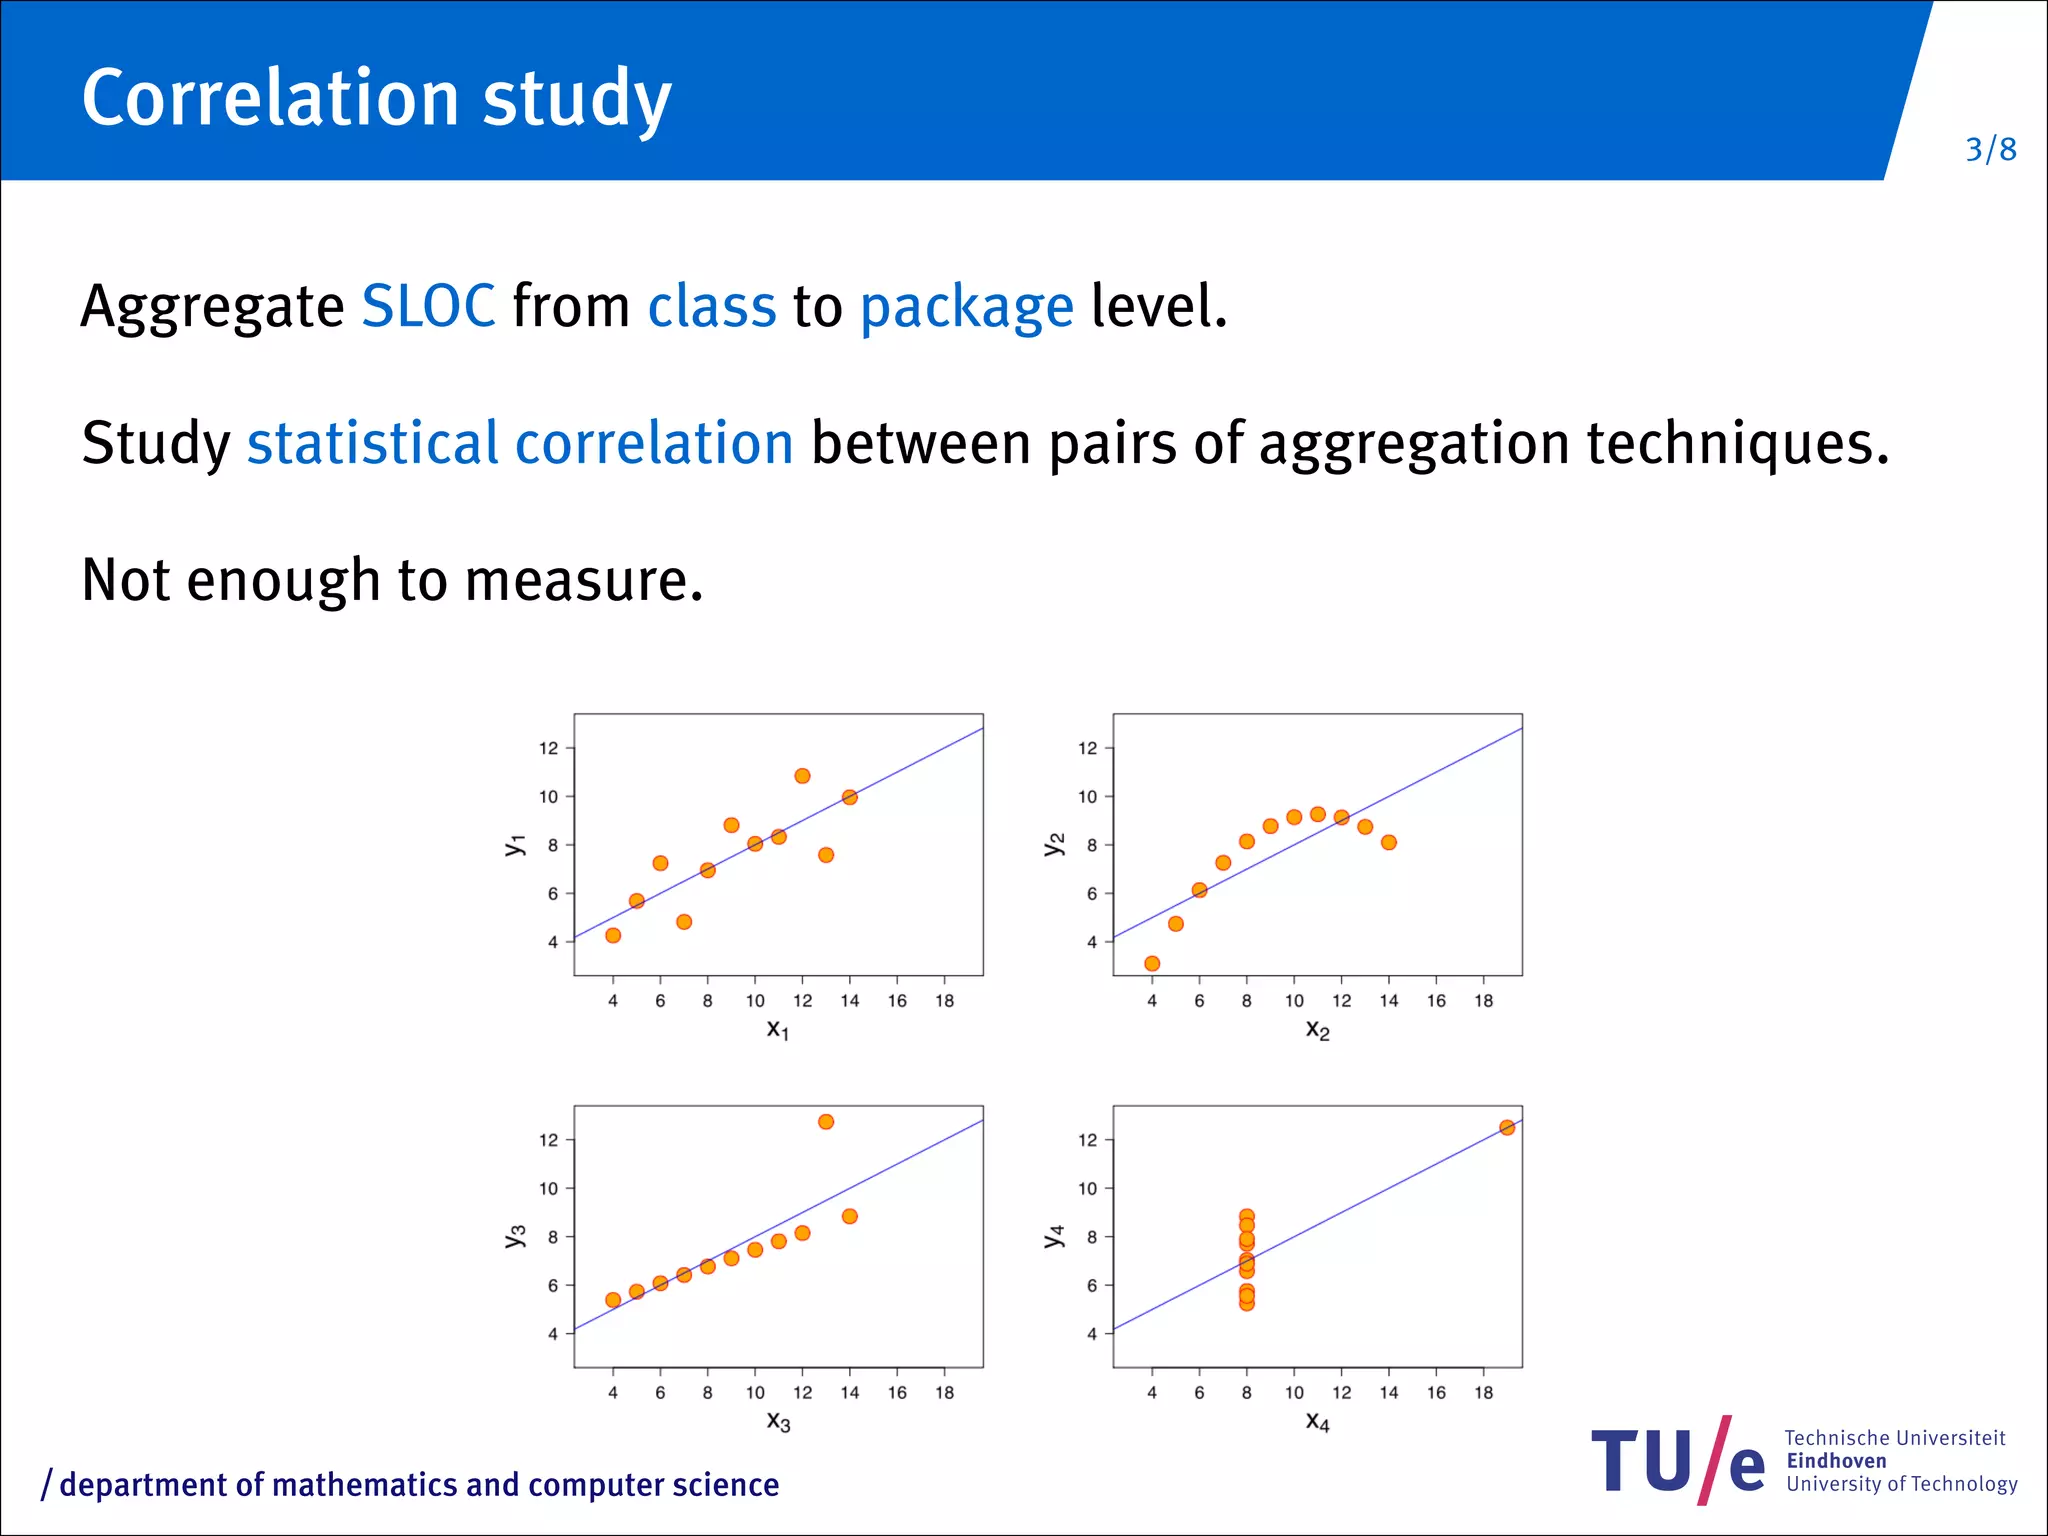
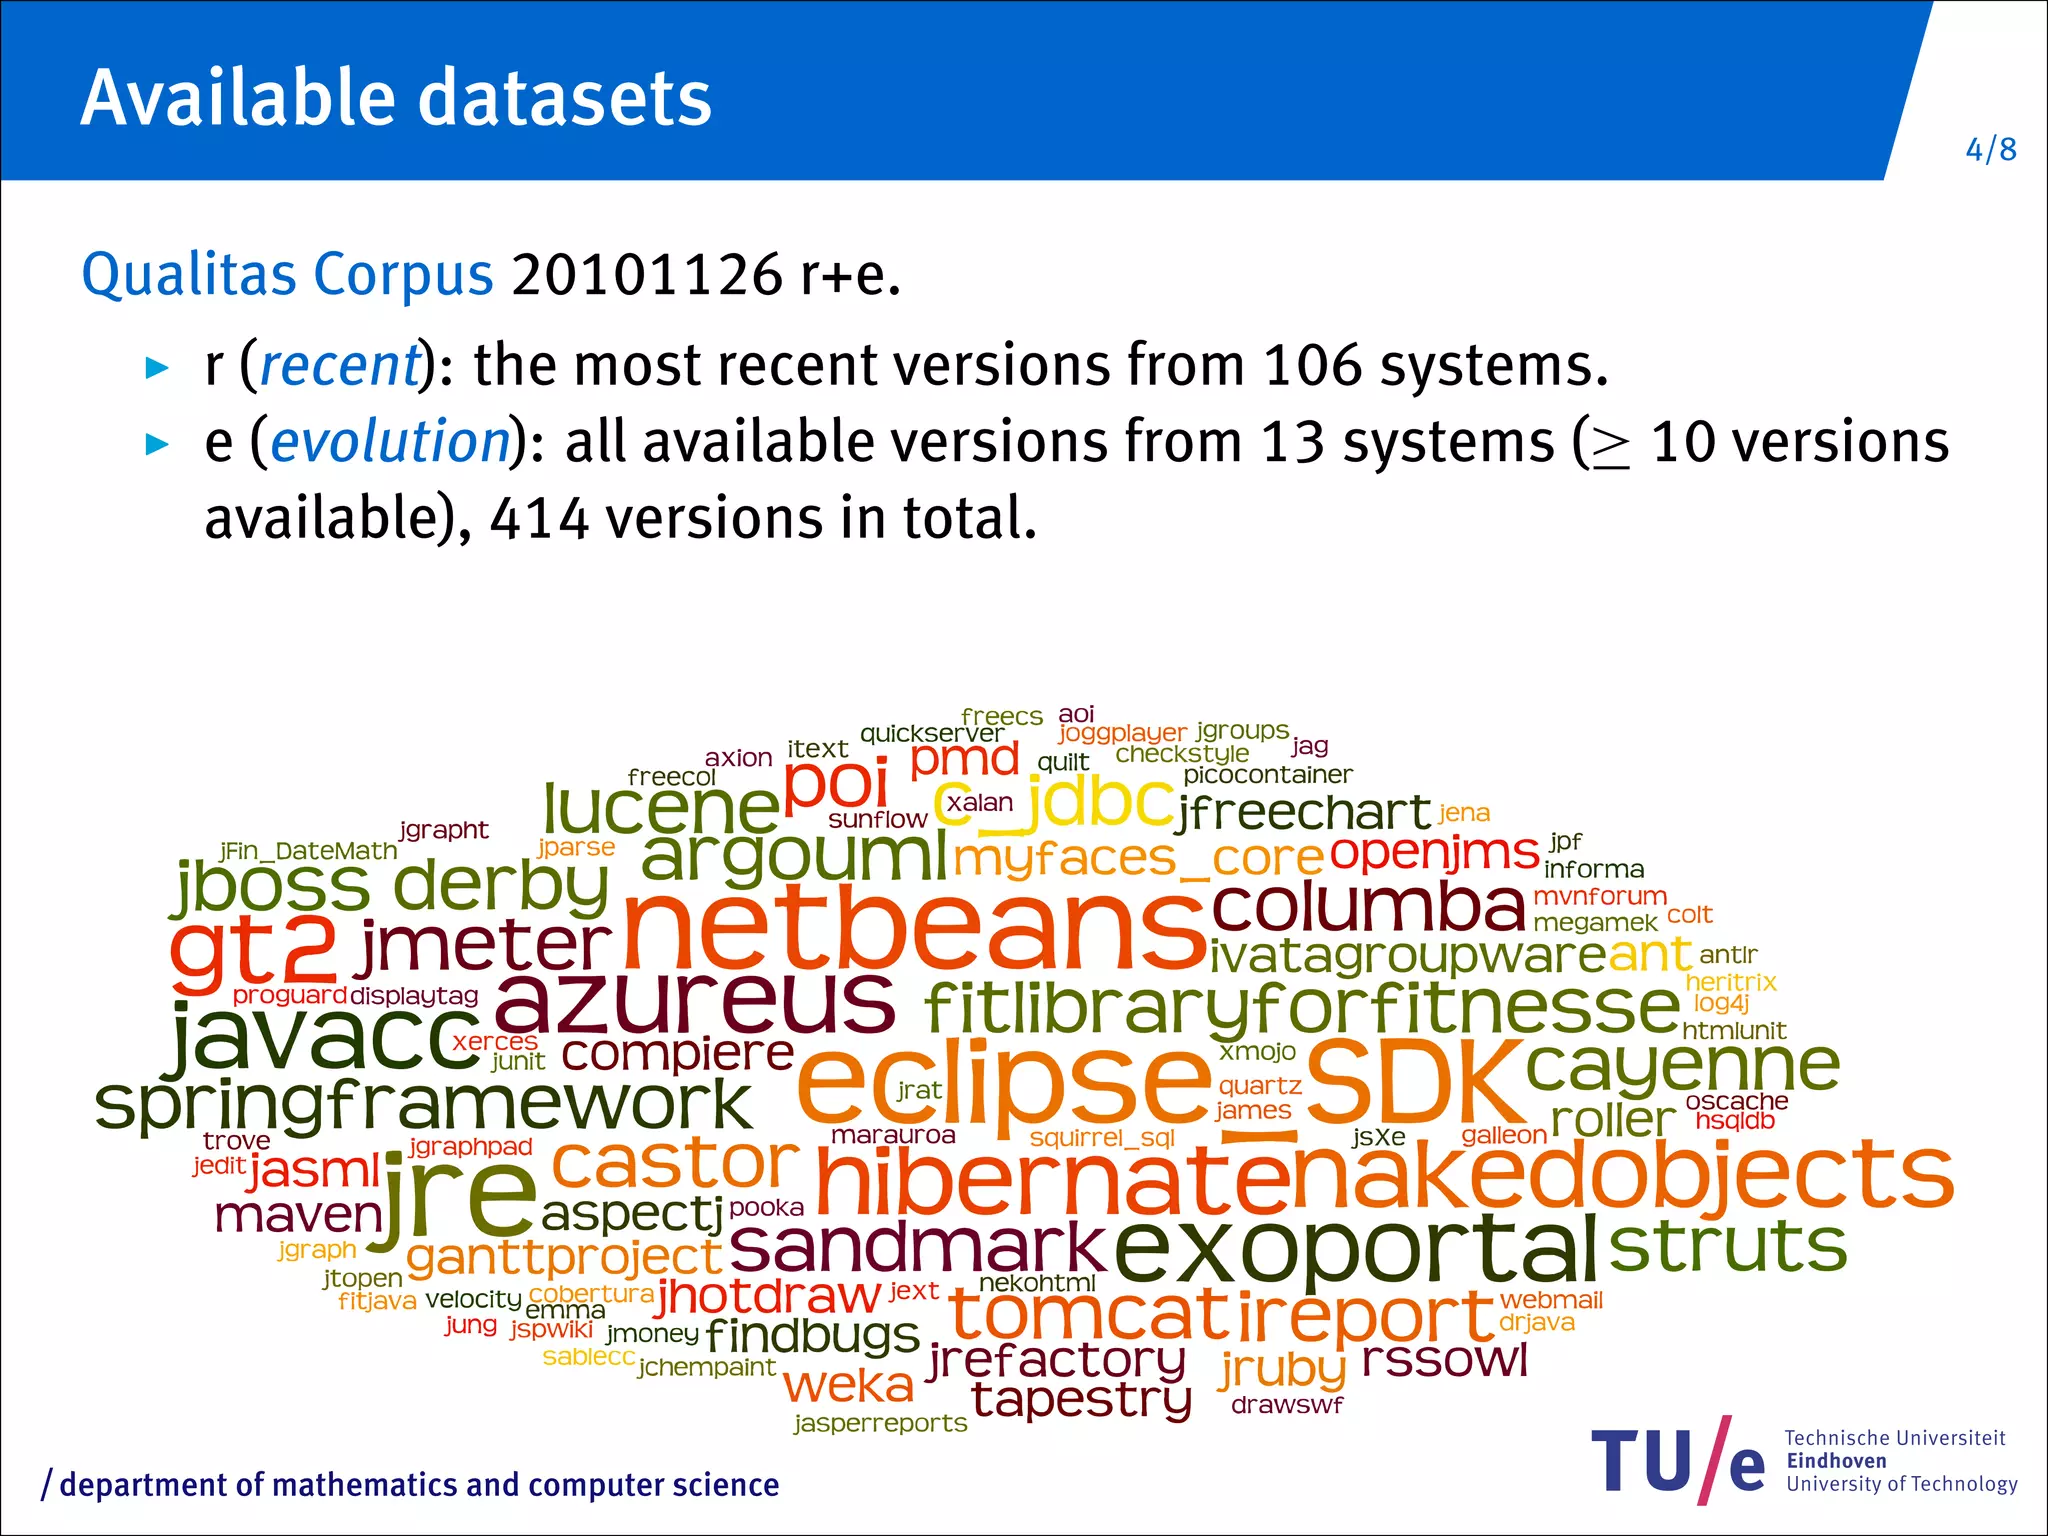
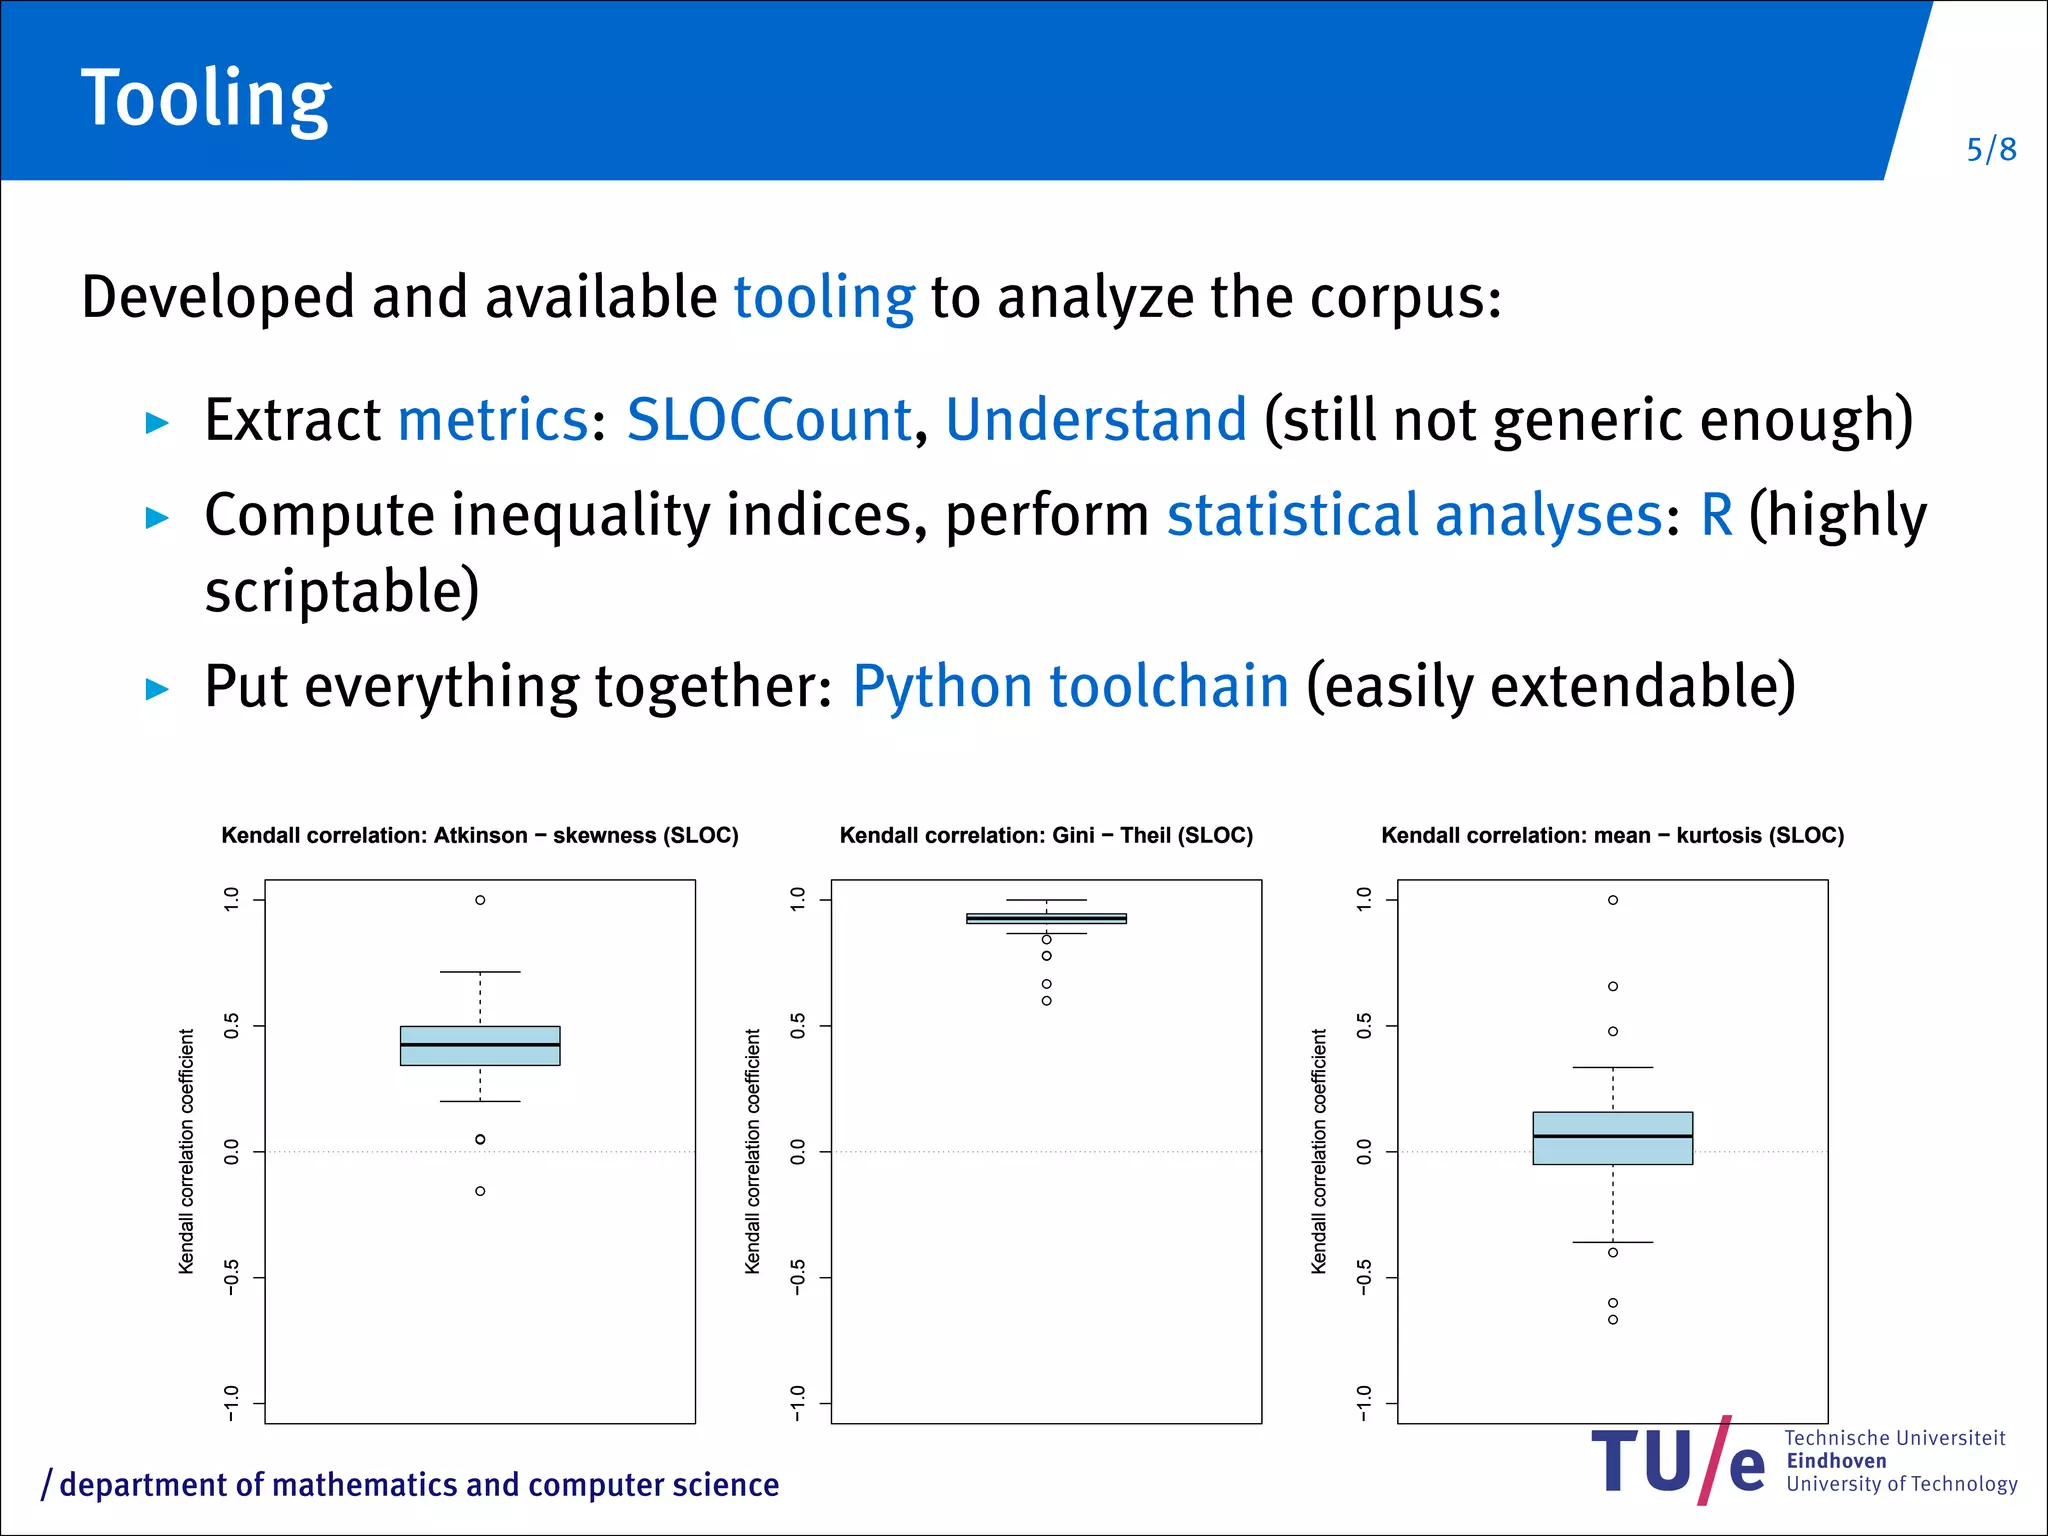
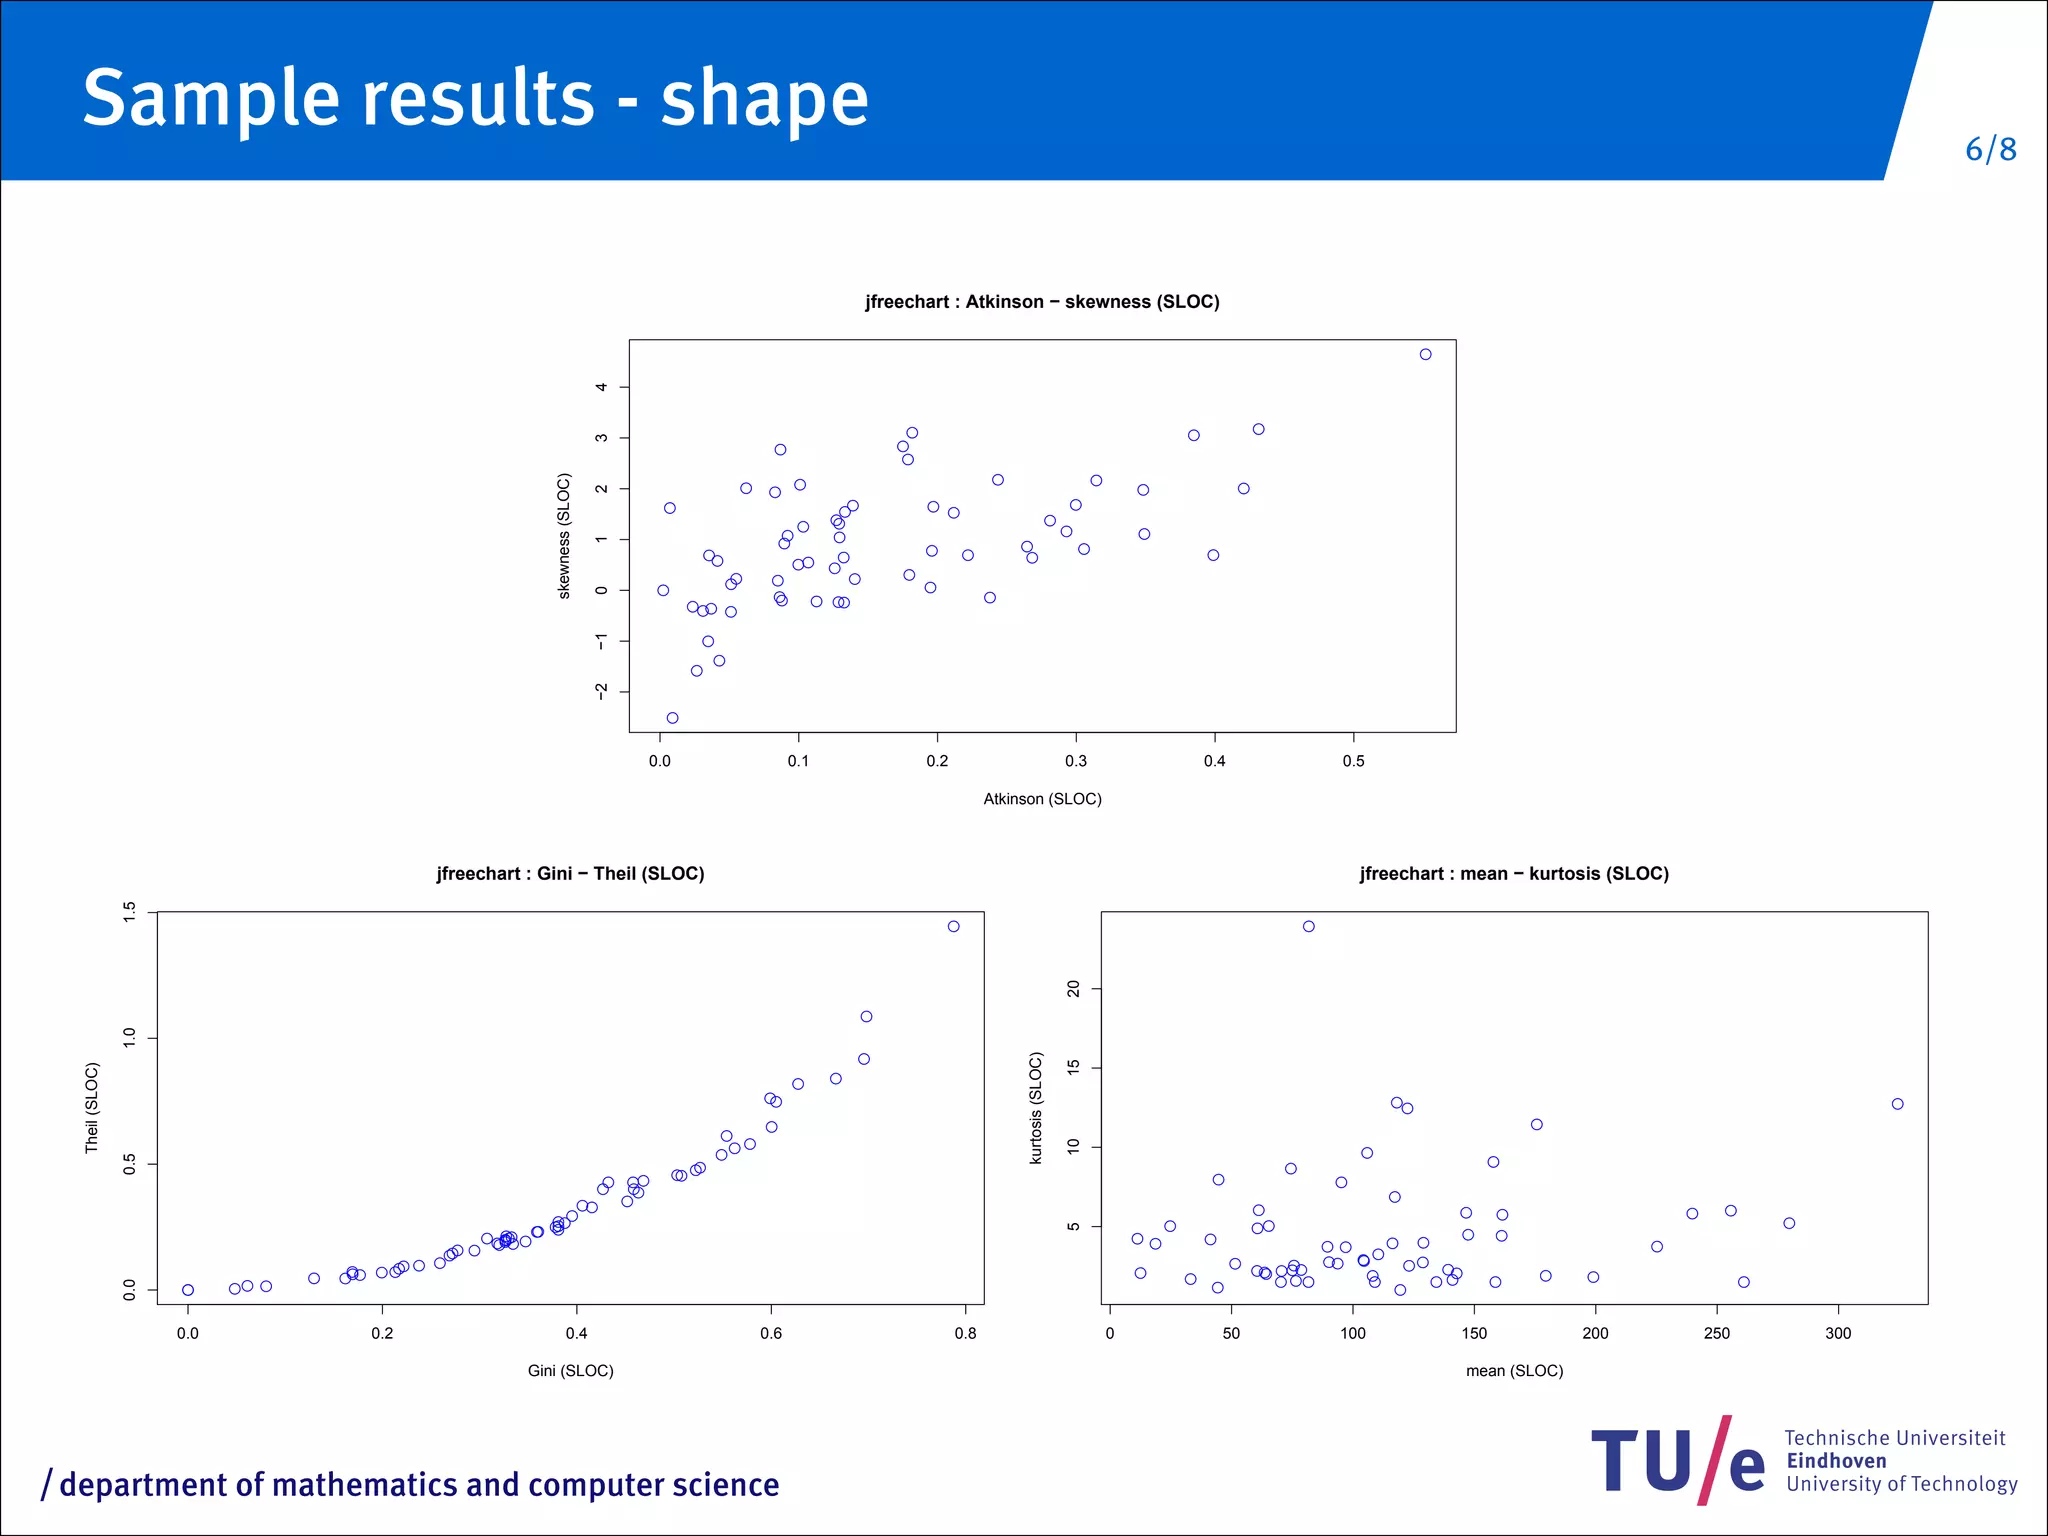
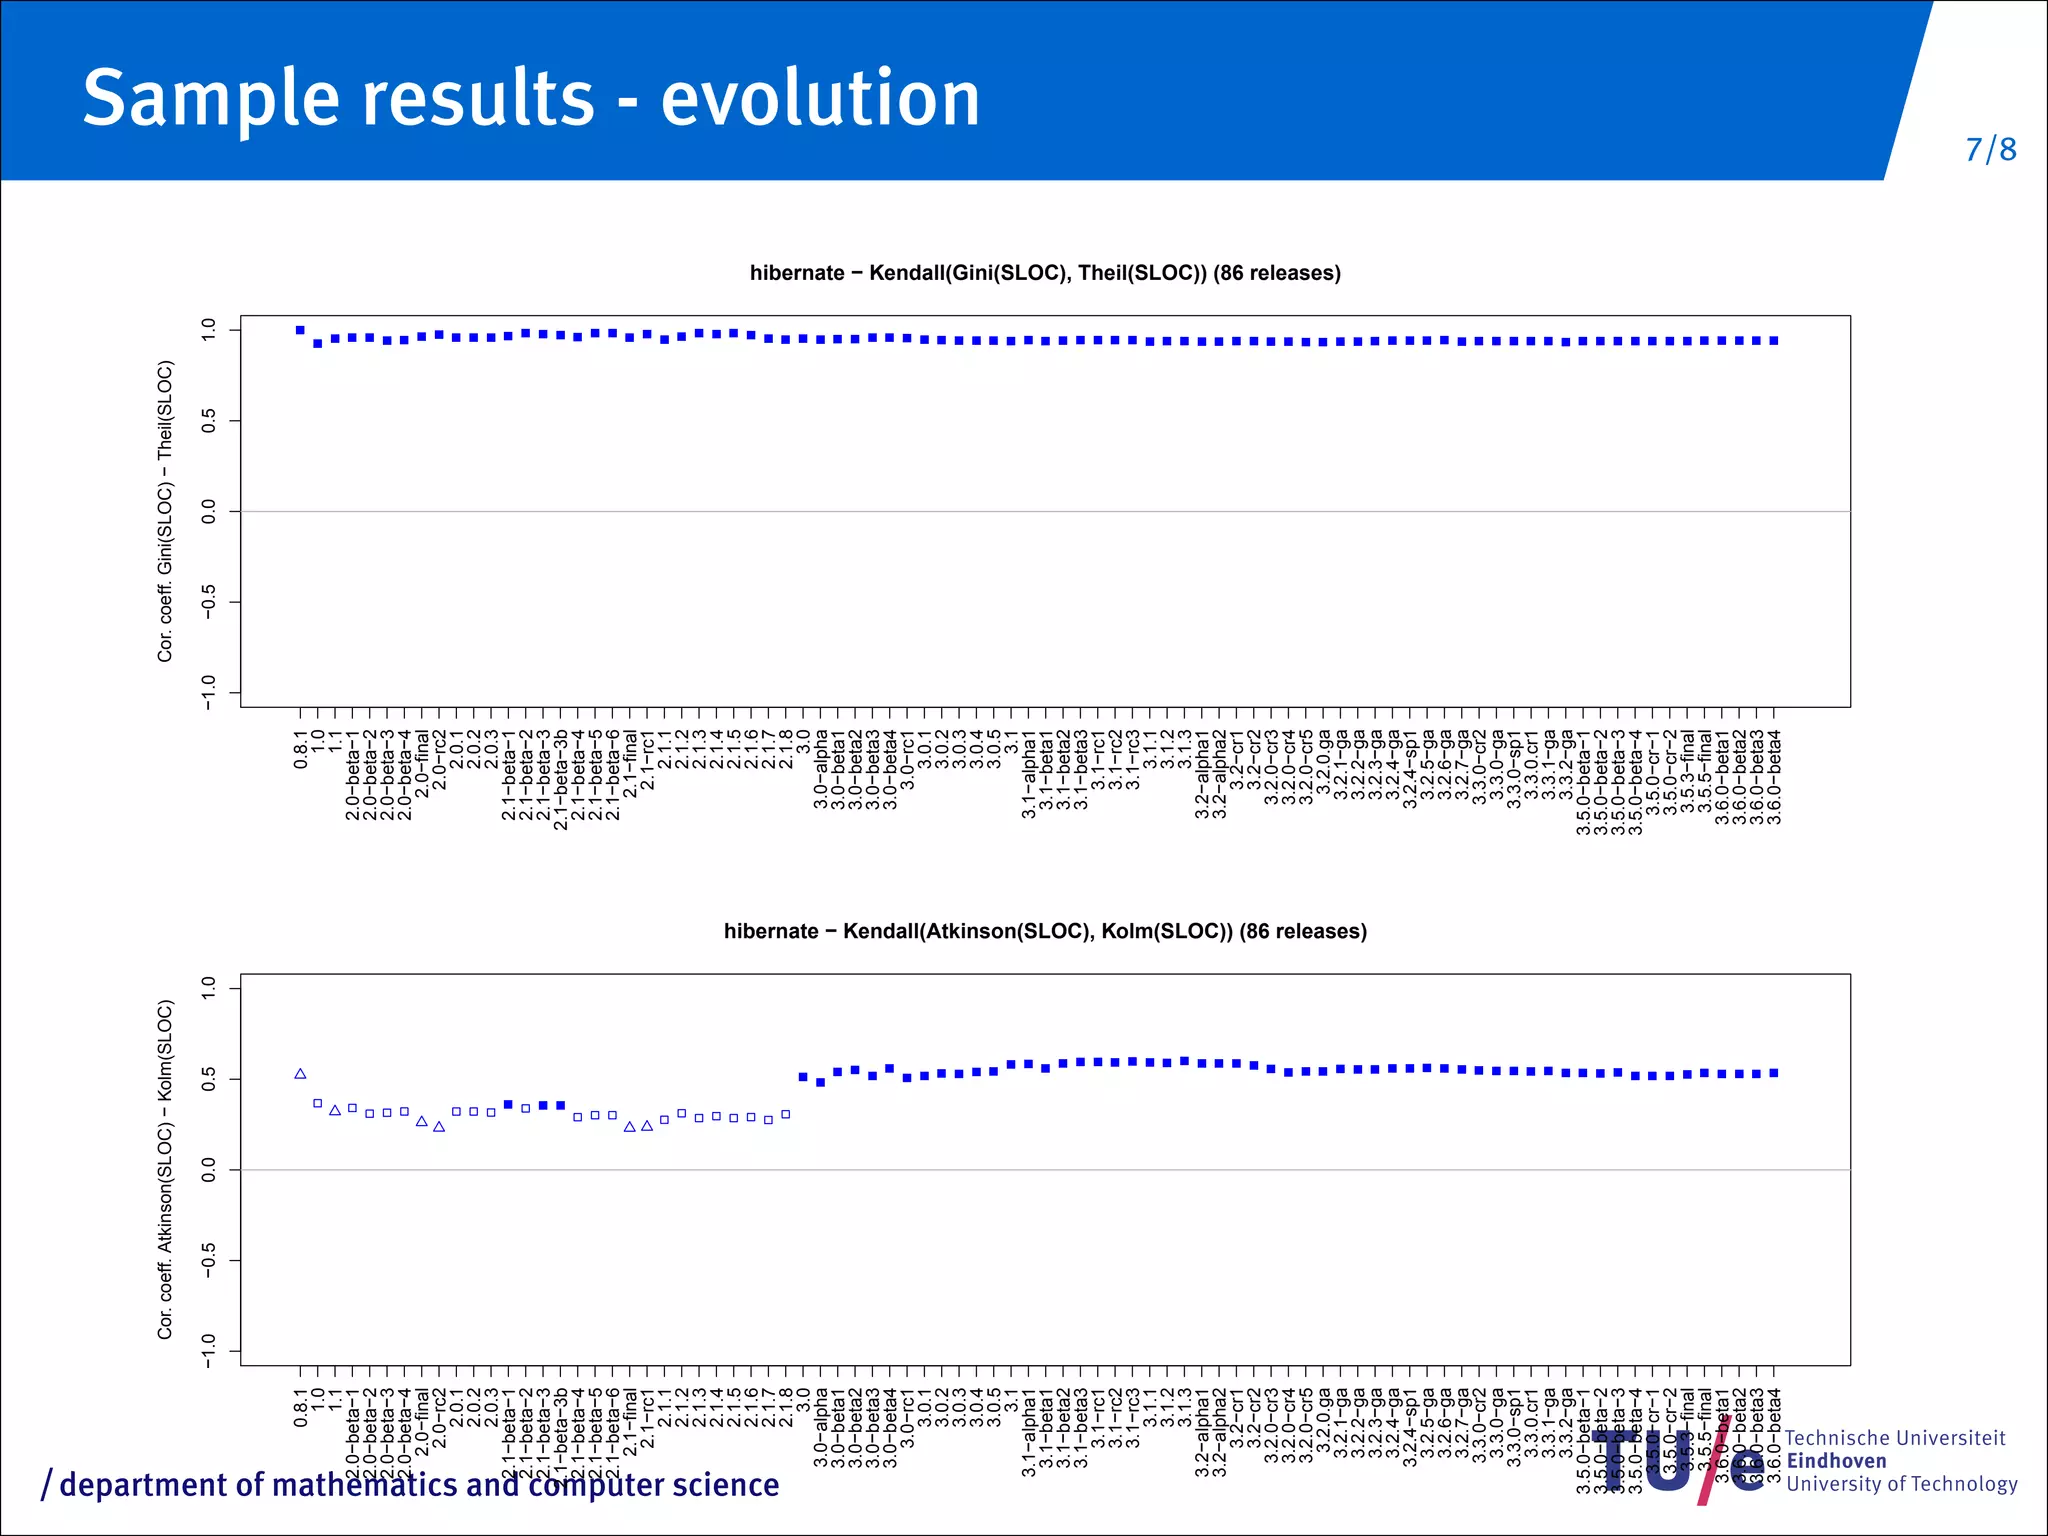
This document discusses aggregation techniques for software metrics. It describes traditional aggregation methods like mean, median, and standard deviation. It also discusses inequality indices like Gini, Theil, and Atkinson. The document outlines available datasets, tools used for analysis including R and Python, and sample results showing correlations between aggregation techniques for different software projects over multiple versions.
Presentation describing our research into a new product called the iClass. The purpose of the project was to create a product catered to college students and conduct research on its potential success in a college market.
In the blink of an eye—less than half a second—dynamic neuronal networks in our brains process, maintain, and act upon an abundance of information. In my research I seek to construct an understanding, from a network perspective, of cognition built upon first principles of neurophysiology and computational models. To do this I incorporate a variety of methods and tools in my research, including intracranial electrophysiological recordings from humans, scalp electroencephalography from healthy younger and older adults, behavioral and neuroimaging studies involving patients with focal brain lesions, data-mining of large-scale databases, and brain-computer interfacing. Specifically my research program aims to answer three questions: 1) What role does the prefrontal cortex play in shaping and coordinating network activity during complex cognition and executive functioning? 2) Under what circumstances is this network altered or disrupted and what are the consequences of such disruption? And, 3) What are the principles that allow for network communication in noisy internal and external environments? My research addresses these questions across multiple scales ranging from basic neurophysiology to population-wide analyses of cognitive data collected from more than 400,000 participants. My goal is to take cognitive science outside of the laboratory and "into the wild" using distributed data collection and large-scale data analysis to help bridge psychology and basic physiology.
Paper: Vasilescu B, Serebrenik A and van den Brand MGJ (2011), "By No Means: A Study on Aggregating Software Metrics", In Proceedings of the 2nd International Workshop on Emerging Trends in Software Metrics, pp. 23-26, ACM.
Frank used these slides during his talk in Chicago.
Paper:
Buchin K, Kusters V, Speckmann B, Staals F and Vasilescu B (2011), "A splitting line model for directional relations", In Proceedings of the 19th SIGSPATIAL International Conference on Advances in Geographic Information Systems. New York, NY, USA ACM.
Feasible study of a light weight prediction system in ChinaOsamu Masutani
Traffic prediction is a key technology of recent traffic information systems. We introduce combination of 3 light-weight and precise prediction methods. We confirmed their predication accuracy outperforms baseline prediction methods, using Chinese FCD based traffic data. And our prototype prediction engine can process data for Beijing 150K links in short time by a reasonable server.
Computing Risk without Numbers: A Semantic Approach to Risk Metrics - Tim Ke...Security B-Sides
Scoring methods are highly reliant on mathematics but what do the numbers really mean? W3C semantic standards allow us to create a more direct meaning-based model. Through set theory and description logics, we can compute classification and ranking through ontological-based reasoning. This method finally addresses the multiple viewpoints and perspectives often found within a large enterprise.
This new release is features-rich, as we added several new functionality: trend analysis (for linear, polynomial, logarithmic, and exponential trends), histograms, spectral analysis (discrete Fourier transform), and more. We also revised the existing correlation function (XCF) to extend support for new methods (e.g. Kendall, Spearman, etc.), and added a statistical test for examining its significance. Finally, NumXL now includes a new unit-root and stationarity test: the Augmented Dickey-Fuller (ADF) test.
http://www.spiderfinancial.com/products/numxl
During the period of this survey more than 30 answers were collected. The intended audience of the questionnaire was a (even small) community of experts and proficient BPMN users. Thus, even if this survey can not be taken into account as representative of a public sentiment about BPMN, this work clearly represents a sight of the experts on how BPMN is used by practitioners in everyday business process modeling chores.
Advances in IOL Technology -Muliti-Focal ImpantsRonan Conlon
A slideshow presentation reviewing the features of multi-focal implants. Pertinent information is presented to help eye care providers to help them guide their patients, on the selection of multi-focal implant. Co-management pearls are provided regarding the post operative care of these patients.
Calvert, Do ‘normal’ traffic conditions really exist? Why modelling variation...flmkessels
Presentation by Simeon Calvert in Masterclass on 16 May 2012 on his phd research on probabilistic traffic flow models and "Help I've got a supervisor".
Kouters, E, Vasilescu, B, Serebrenik, A and van den Brand, MGJ (2012), "Who's who in GNOME: using LSA to merge software repository identities", In Proceedings of the 28th IEEE International Conference on Software Maintenance---Early Research Achievements (ICSM 2012 ERA), pp. 592-595. IEEE.
I used these slides for the Seminar on Open Source Evolution in Brussels, Belgium.
SOS Evol 2012 is an informal international meeting gathering researchers interested in studying the evolution of libre and open source software.
Paper:
Vasilescu B, Serebrenik A and van den Brand MGJ (2011), "You can't control the unfamiliar: A study on the relations between aggregation techniques for software metrics", In Proceedings of the 27th IEEE International Conference on Software Maintenance, pp. 313-322. IEEE.
Alexander used these slides during for his presentation at BeNeVol 2011 in Brussels, Belgium. That is after he blew the fuses in the entire building.
Paper:
Serebrenik A, Vasilescu B and van den Brand M (2011), "Similar tasks, different effort: Why the same amount of functionality requires different development effort?", In Proceedings of the 10th Belgian-Netherlands Software Evolution Seminar, pp. 4-5.
I used these slides during my presentation at BeNeVol 2010 in Lille, France.
Paper:
Vasilescu B, Serebrenik A and van den Brand MGJ (2010), "Comparative study of software metrics' aggregation techniques", In Proceedings of the 9th Belgian-Netherlands Software Evolution Seminar, pp. 80-84.
Biological screening of herbal drugs: Introduction and Need for
Phyto-Pharmacological Screening, New Strategies for evaluating
Natural Products, In vitro evaluation techniques for Antioxidants, Antimicrobial and Anticancer drugs. In vivo evaluation techniques
for Anti-inflammatory, Antiulcer, Anticancer, Wound healing, Antidiabetic, Hepatoprotective, Cardio protective, Diuretics and
Antifertility, Toxicity studies as per OECD guidelines
Introduction to AI for Nonprofits with Tapp NetworkTechSoup
Dive into the world of AI! Experts Jon Hill and Tareq Monaur will guide you through AI's role in enhancing nonprofit websites and basic marketing strategies, making it easy to understand and apply.
A Strategic Approach: GenAI in EducationPeter Windle
Artificial Intelligence (AI) technologies such as Generative AI, Image Generators and Large Language Models have had a dramatic impact on teaching, learning and assessment over the past 18 months. The most immediate threat AI posed was to Academic Integrity with Higher Education Institutes (HEIs) focusing their efforts on combating the use of GenAI in assessment. Guidelines were developed for staff and students, policies put in place too. Innovative educators have forged paths in the use of Generative AI for teaching, learning and assessments leading to pockets of transformation springing up across HEIs, often with little or no top-down guidance, support or direction.
This Gasta posits a strategic approach to integrating AI into HEIs to prepare staff, students and the curriculum for an evolving world and workplace. We will highlight the advantages of working with these technologies beyond the realm of teaching, learning and assessment by considering prompt engineering skills, industry impact, curriculum changes, and the need for staff upskilling. In contrast, not engaging strategically with Generative AI poses risks, including falling behind peers, missed opportunities and failing to ensure our graduates remain employable. The rapid evolution of AI technologies necessitates a proactive and strategic approach if we are to remain relevant.
The Roman Empire A Historical Colossus.pdfkaushalkr1407
The Roman Empire, a vast and enduring power, stands as one of history's most remarkable civilizations, leaving an indelible imprint on the world. It emerged from the Roman Republic, transitioning into an imperial powerhouse under the leadership of Augustus Caesar in 27 BCE. This transformation marked the beginning of an era defined by unprecedented territorial expansion, architectural marvels, and profound cultural influence.
The empire's roots lie in the city of Rome, founded, according to legend, by Romulus in 753 BCE. Over centuries, Rome evolved from a small settlement to a formidable republic, characterized by a complex political system with elected officials and checks on power. However, internal strife, class conflicts, and military ambitions paved the way for the end of the Republic. Julius Caesar’s dictatorship and subsequent assassination in 44 BCE created a power vacuum, leading to a civil war. Octavian, later Augustus, emerged victorious, heralding the Roman Empire’s birth.
Under Augustus, the empire experienced the Pax Romana, a 200-year period of relative peace and stability. Augustus reformed the military, established efficient administrative systems, and initiated grand construction projects. The empire's borders expanded, encompassing territories from Britain to Egypt and from Spain to the Euphrates. Roman legions, renowned for their discipline and engineering prowess, secured and maintained these vast territories, building roads, fortifications, and cities that facilitated control and integration.
The Roman Empire’s society was hierarchical, with a rigid class system. At the top were the patricians, wealthy elites who held significant political power. Below them were the plebeians, free citizens with limited political influence, and the vast numbers of slaves who formed the backbone of the economy. The family unit was central, governed by the paterfamilias, the male head who held absolute authority.
Culturally, the Romans were eclectic, absorbing and adapting elements from the civilizations they encountered, particularly the Greeks. Roman art, literature, and philosophy reflected this synthesis, creating a rich cultural tapestry. Latin, the Roman language, became the lingua franca of the Western world, influencing numerous modern languages.
Roman architecture and engineering achievements were monumental. They perfected the arch, vault, and dome, constructing enduring structures like the Colosseum, Pantheon, and aqueducts. These engineering marvels not only showcased Roman ingenuity but also served practical purposes, from public entertainment to water supply.
Macroeconomics- Movie Location
This will be used as part of your Personal Professional Portfolio once graded.
Objective:
Prepare a presentation or a paper using research, basic comparative analysis, data organization and application of economic information. You will make an informed assessment of an economic climate outside of the United States to accomplish an entertainment industry objective.
Acetabularia Information For Class 9 .docxvaibhavrinwa19
Acetabularia acetabulum is a single-celled green alga that in its vegetative state is morphologically differentiated into a basal rhizoid and an axially elongated stalk, which bears whorls of branching hairs. The single diploid nucleus resides in the rhizoid.
Palestine last event orientationfvgnh .pptxRaedMohamed3
An EFL lesson about the current events in Palestine. It is intended to be for intermediate students who wish to increase their listening skills through a short lesson in power point.
How to Make a Field invisible in Odoo 17Celine George
It is possible to hide or invisible some fields in odoo. Commonly using “invisible” attribute in the field definition to invisible the fields. This slide will show how to make a field invisible in odoo 17.
Model Attribute Check Company Auto PropertyCeline George
In Odoo, the multi-company feature allows you to manage multiple companies within a single Odoo database instance. Each company can have its own configurations while still sharing common resources such as products, customers, and suppliers.
1. Aggregation
of software metrics
Bogdan Vasilescu
b.n.vasilescu@student.tue.nl
Alexander Serebrenik
a.serebrenik@tue.nl
April 7, 2011
2. Aggregation techniques for software metrics 2/8
Better understand aggregation techniques for software metrics.
Source lines of code − freecol−0.9.4
0.004
0.003
Density
0.002
0.001
0.000
0 500 1000 1500 2000 2500 3000
SLOC per class
Traditional: mean, sum, median, standard deviation, variance,
skewness, kurtosis.
/ department of mathematics and computer science
3. Aggregation techniques for software metrics 2/8
Better understand aggregation techniques for software metrics.
Household income in Ilocos, the Philippines (1998) Source lines of code − freecol−0.9.4
5e−06
0.004
4e−06
0.003
3e−06
Density
Density
0.002
2e−06
0.001
1e−06
0e+00
0.000
0 500000 1000000 1500000 2000000 2500000 0 500 1000 1500 2000 2500 3000
Income SLOC per class
Traditional: mean, sum, median, standard deviation, variance,
skewness, kurtosis.
Inequality indices: Gini, Theil, Atkinson, Hoover, Kolm.
/ department of mathematics and computer science
4. Correlation study 3/8
Aggregate SLOC from class to package level.
Study statistical correlation between pairs of aggregation techniques.
Not enough to measure.
/ department of mathematics and computer science
5. Available datasets 4/8
Qualitas Corpus 20101126 r+e.
r (recent): the most recent versions from 106 systems.
e (evolution): all available versions from 13 systems (≥ 10 versions
available), 414 versions in total.
/ department of mathematics and computer science
6. Tooling 5/8
Developed and available tooling to analyze the corpus:
Extract metrics: SLOCCount, Understand (still not generic enough)
Compute inequality indices, perform statistical analyses: R (highly
scriptable)
Put everything together: Python toolchain (easily extendable)
Kendall correlation: Atkinson − skewness (SLOC) Kendall correlation: Gini − Theil (SLOC) Kendall correlation: mean − kurtosis (SLOC)
1.0
1.0
1.0
q q
q
q
q q
q
0.5
0.5
0.5
q
Kendall correlation coefficient
q
0.0
0.0
0.0
q
q
−0.5
−0.5
−0.5
q
q
−1.0
−1.0
−1.0
/ department of mathematics and computer science