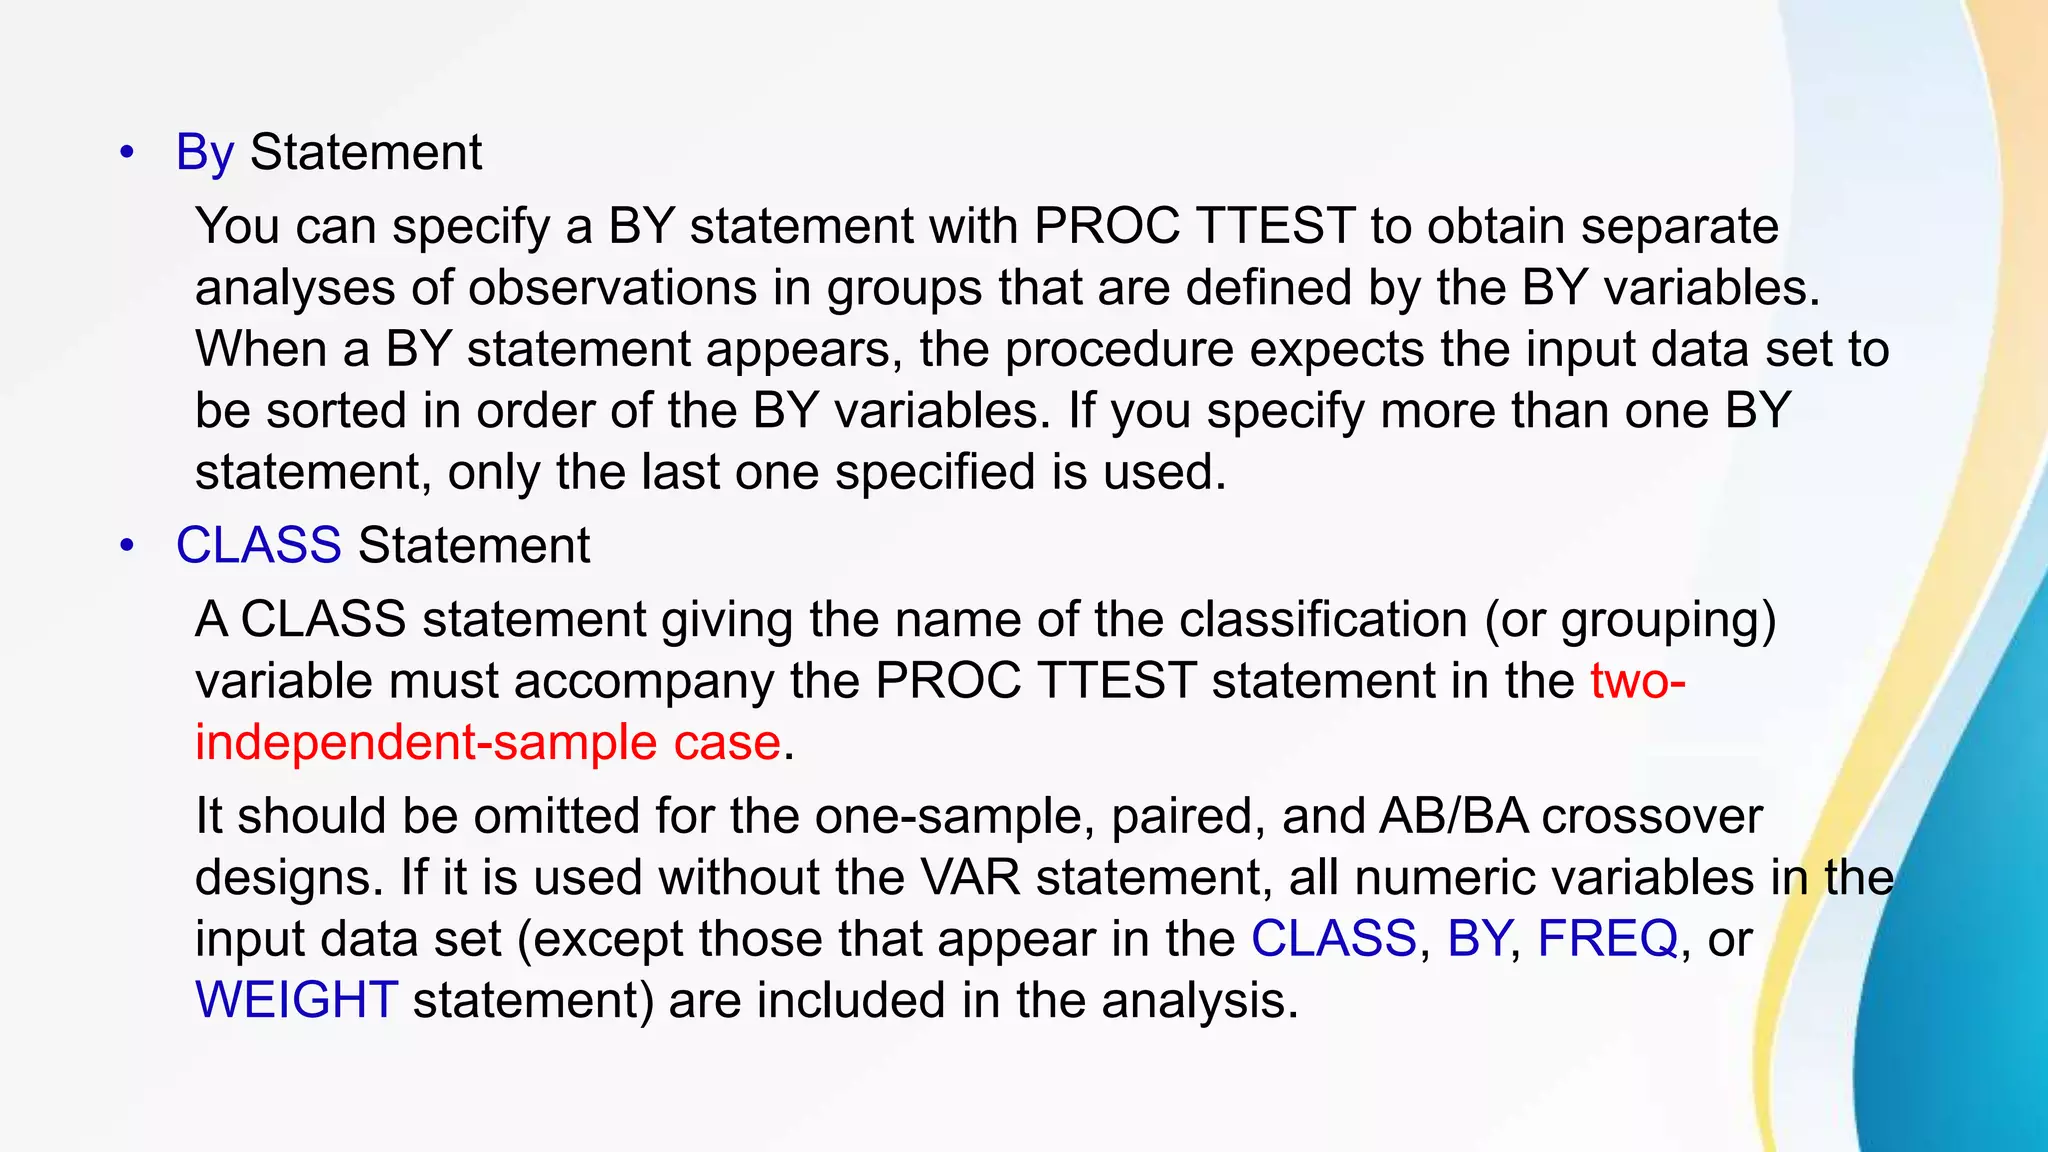
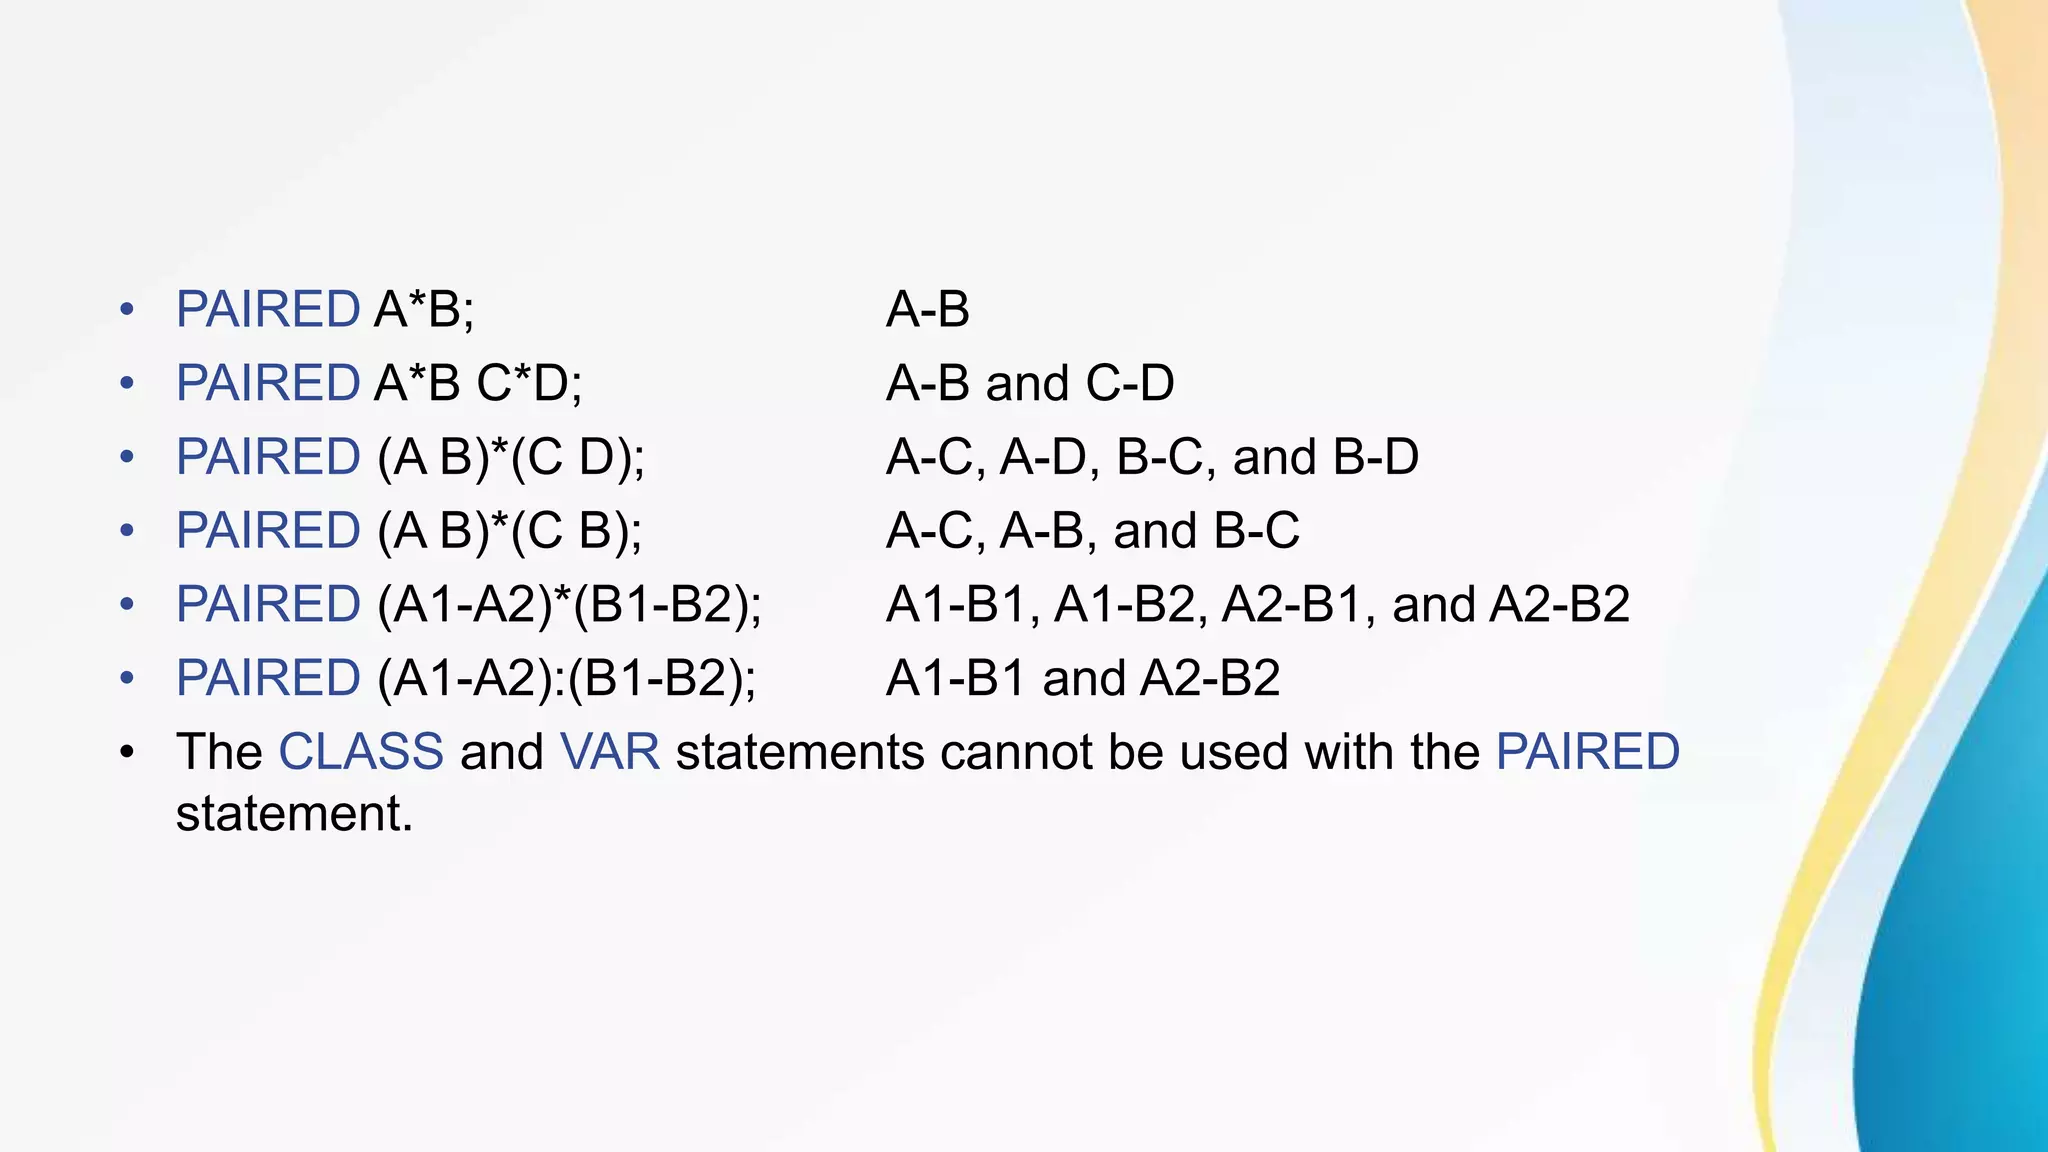
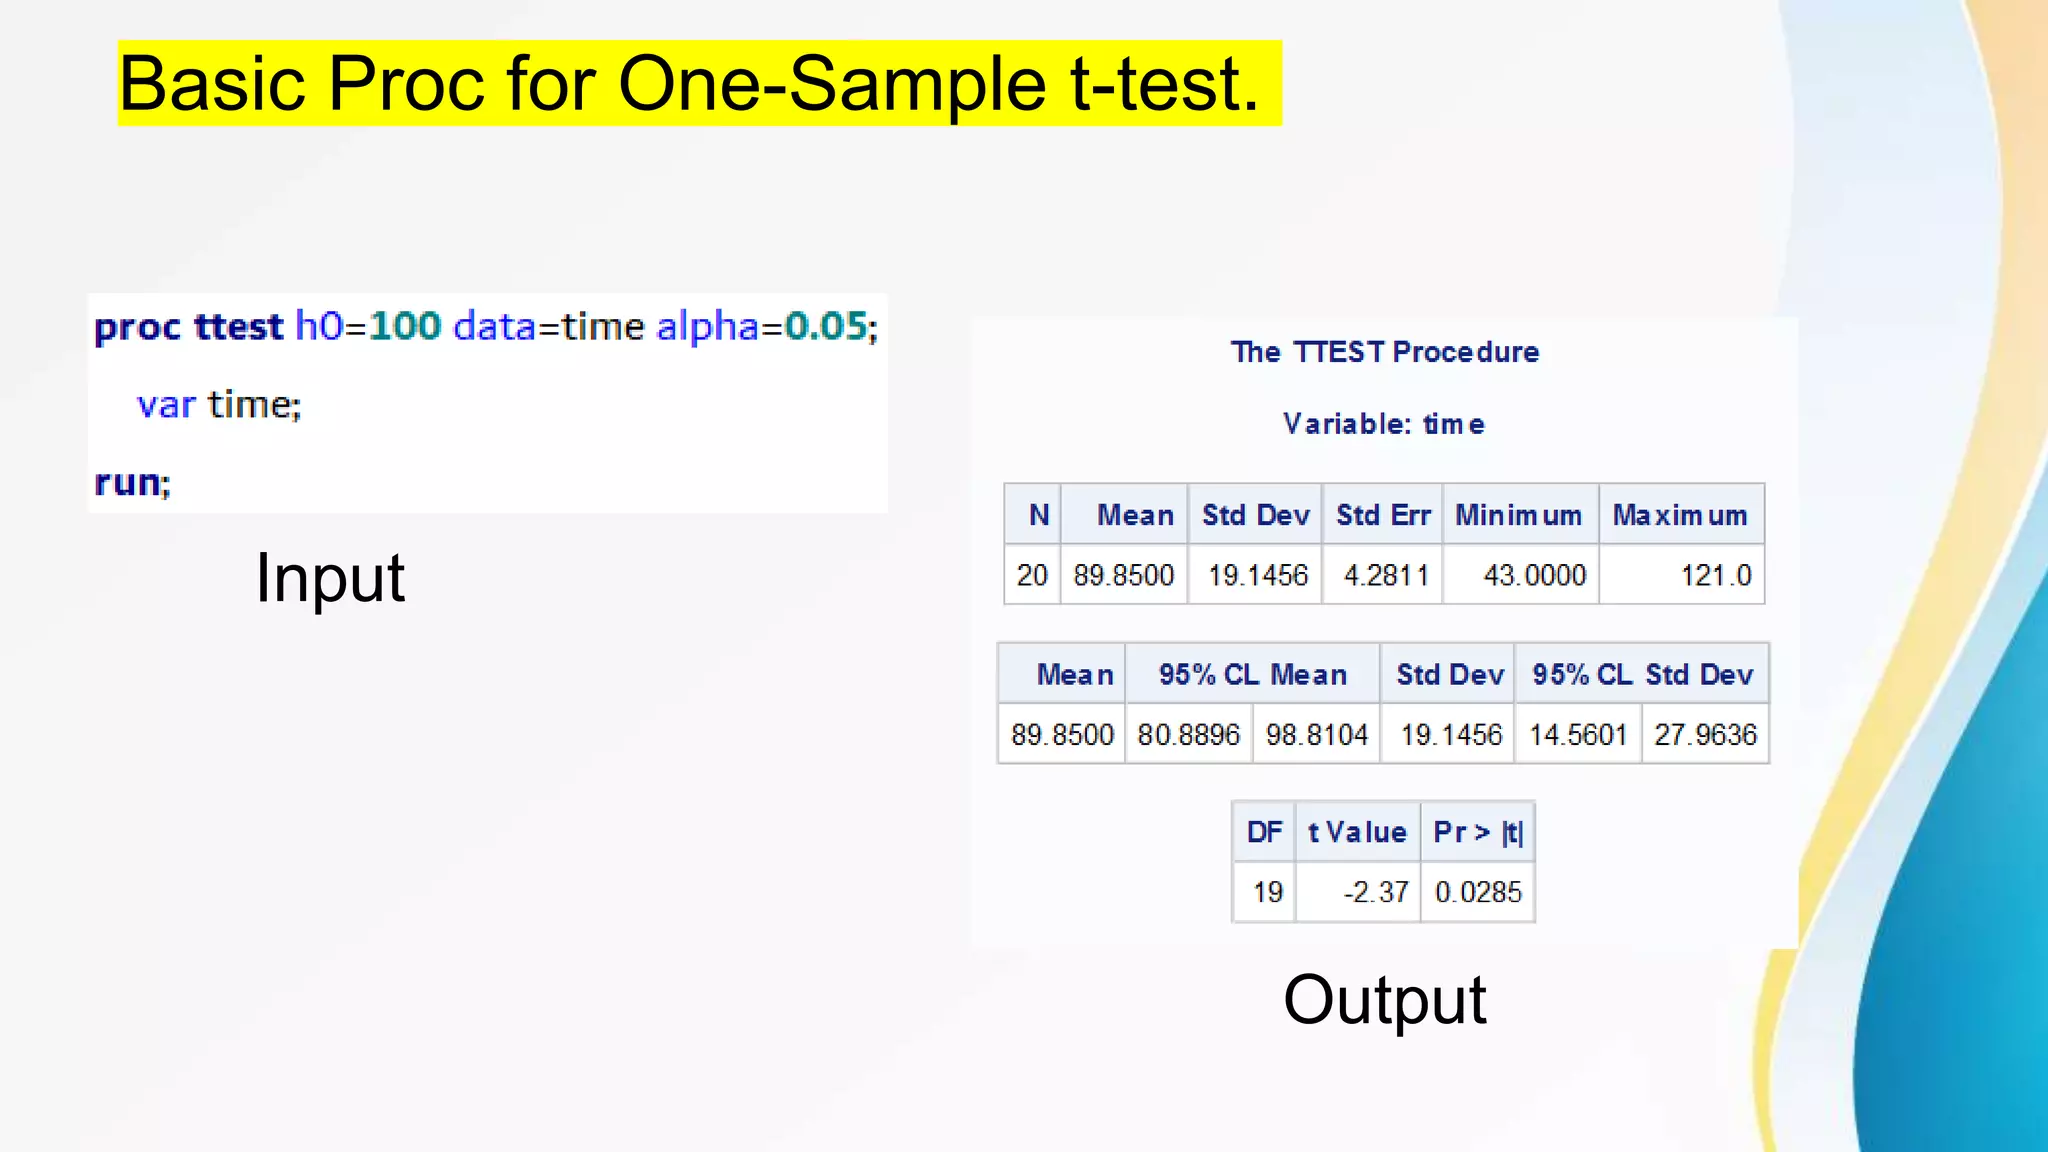
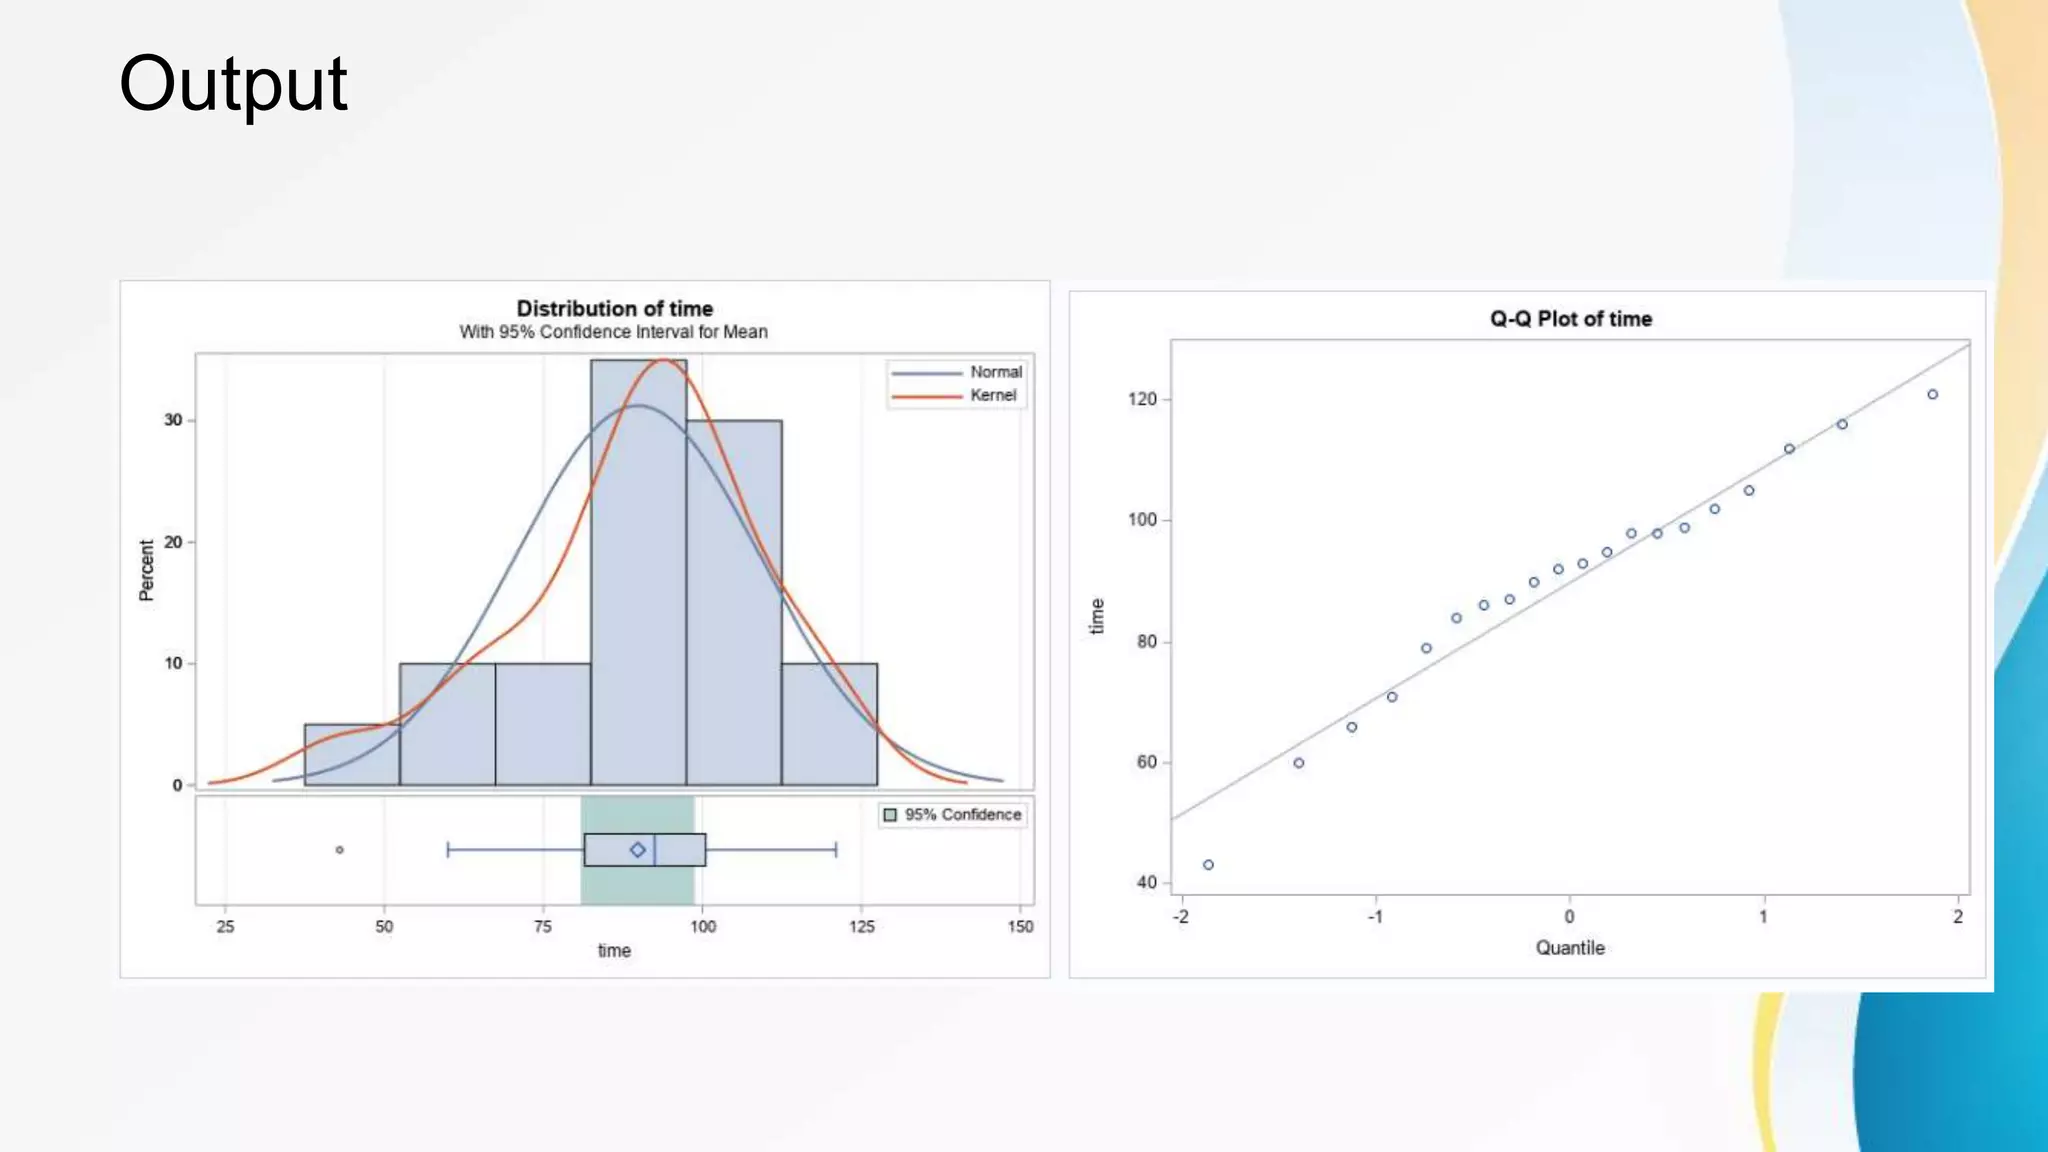
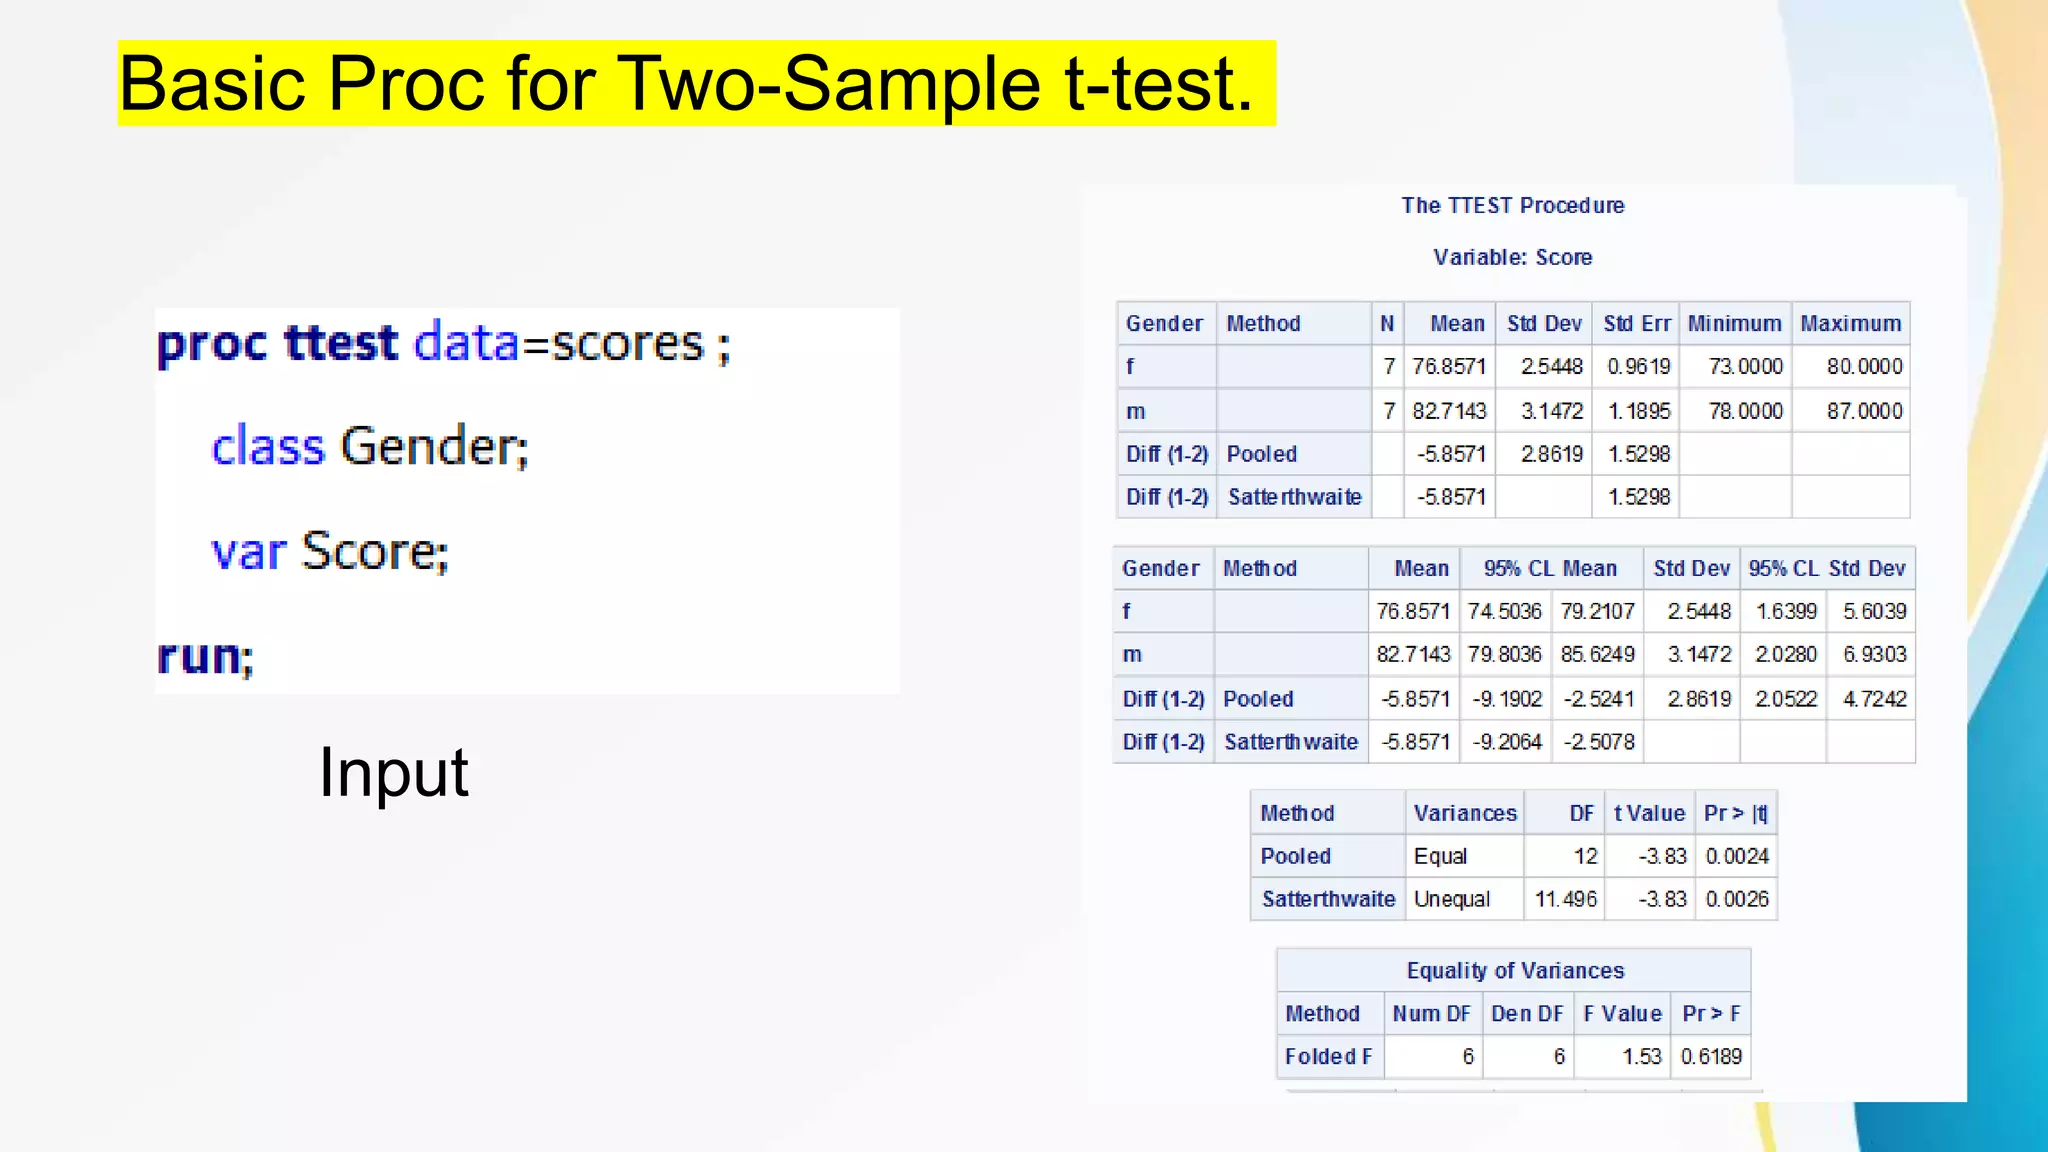
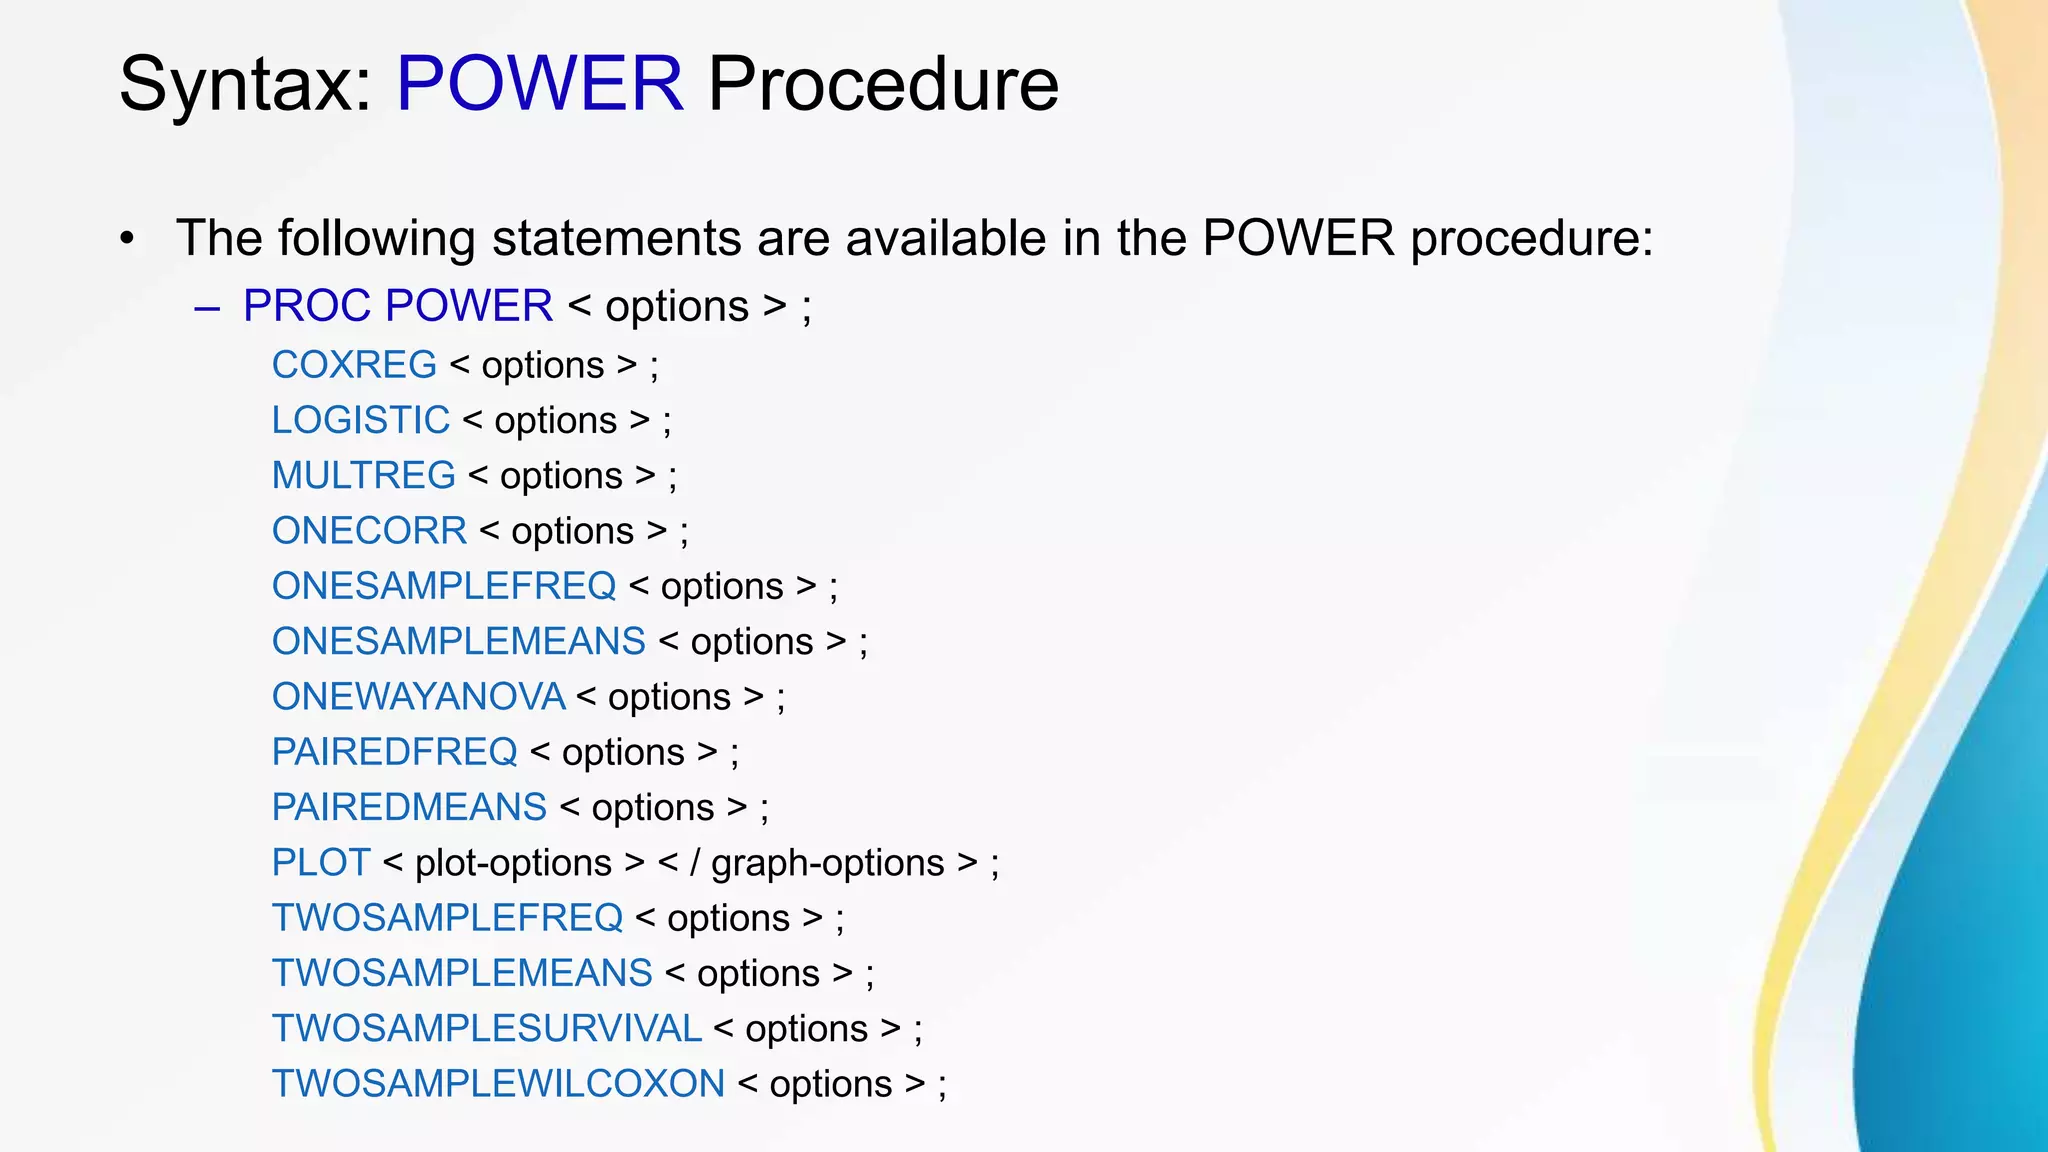
SAS TTEST Procedure
Ayush Mistry
What is T-Test.
• A t-test is a statistical test that is used to compare the
means of two groups.
• It is often used in hypothesis testing to determine whether
a process or treatment actually has an effect on the
population of interest, or whether two groups are different
from one another.
• T-test do Pairwise Comparison.
• There are Three types of T-test.
What is one-sample, two-sample, or paired t-test?
• If there is one group being compared against a standard value
(e.g. comparing the acidity of a liquid to a neutral pH of 7),
perform a one-sample t-test.
• If the groups come from two different populations (e.g. two
different species, or people from two separate cities), perform a
two-sample t-test (independent t-test).
• If the groups come from a single population (e.g. measuring
before and after an experimental treatment), perform a paired t-
test.
Use of Proc TTEST
• The TTEST procedure performs t tests and computes
confidence limits for one sample, paired observations, two
independent samples, and the AB/BA crossover design.
Two-sided, TOST (two one-sided test) equivalence, and
upper and lower one-sided hypotheses are supported for
means, mean differences, and mean ratios for either
normal or lognormal data.
TTEST Procedure Syntax
• PROC TTEST < options > ;
BY variables ;
CLASS variable ;
PAIRED variables ;
VAR variables < / options > ;
FREQ variable ;
Run;
• By Statement
You can specify a BY statement with PROC TTEST to obtain separate
analyses of observations in groups that are defined by the BY variables.
When a BY statement appears, the procedure expects the input data set to
be sorted in order of the BY variables. If you specify more than one BY
statement, only the last one specified is used.
• CLASS Statement
A CLASS statement giving the name of the classification (or grouping)
variable must accompany the PROC TTEST statement in the two-
independent-sample case.
It should be omitted for the one-sample, paired, and AB/BA crossover
designs. If it is used without the VAR statement, all numeric variables in the
input data set (except those that appear in the CLASS, BY, FREQ, or
WEIGHT statement) are included in the analysis.
• FREQ Statement
The variable in the FREQ statement identifies a variable that
contains the frequency of occurrence of each observation. PROC
TTEST treats each observation as if it appears n times, where n
is the value of the FREQ variable for the observation. If the value
is not an integer, only the integer portion is used. If the frequency
value is less than 1 or is missing, the observation is not used in
the analysis. When the FREQ statement is not specified, each
observation is assigned a frequency of 1. The FREQ statement
cannot be used if the DATA=data set contains statistics instead of
the original observations
• PAIRED Statement
The pair-lists in the PAIRED statement identifies the variables to be
compared in paired comparisons. You can use one or more pair-lists.
Variables or lists of variables are separated by an asterisk (*) or a colon (:).
The asterisk requests comparisons between each variable on the left with
each variable on the right.
The colon requests comparisons between the first variable on the left and
the first on the right, the second on the left and the second on the right, and
so forth. The number of variables on the left must equal the number on the
right when the colon is used. The differences are calculated by taking the
variable on the left minus the variable on the right for both the asterisk and
colon. A pair formed by a variable with itself is ignored. Use the PAIRED
statement only for paired comparisons. The CLASS and VAR statements
cannot be used with the PAIRED statement.
• PAIRED A*B; A-B
• PAIRED A*B C*D; A-B and C-D
• PAIRED (A B)*(C D); A-C, A-D, B-C, and B-D
• PAIRED (A B)*(C B); A-C, A-B, and B-C
• PAIRED (A1-A2)*(B1-B2); A1-B1, A1-B2, A2-B1, and A2-B2
• PAIRED (A1-A2):(B1-B2); A1-B1 and A2-B2
• The CLASS and VAR statements cannot be used with the PAIRED
statement.
• VAR Statement
The VAR statement names the variables to be used in the analyses. One-
sample comparisons are conducted when the VAR statement is used
without the CROSSOVER= option or CLASS statement. Two-independent
sample comparisons are conducted when the VAR statement is used with
a CLASS statement.
• WEIGHT Statement
The WEIGHT statement weights each observation in the input data set by
the value of the WEIGHT variable. The values of the WEIGHT variable
can be nonintegral, and they are not truncated. Observations with
negative, zero, or missing values for the WEIGHT variable are not used in
the analyses. Each observation is assigned a weight of 1 when the
WEIGHT statement is not used. The WEIGHT statement cannot be used
with an input data set of summary statistics
Basic Proc for One-Sample t-test.
Input
Output
Output
Basic Proc for Two-Sample t-test.
Input
Output
Basic Proc for Paired Samples t-test.
Output
Input
Output
Output
SAS POWER Procedure
Before Going to start Proc Power we should know what is
power.
• Power = Pr(1- β)
= Pr(reject H0 | H1 is true).
Use of Proc Power.
• It is used to find power/sample size.
• A variety of statistical analyses are covered:
– T tests, equivalence tests, and confidence intervals for means
– Tests, equivalence tests, and confidence intervals for binomial proportions
– Multiple regression
– Tests of correlation and partial correlation
– One-way analysis of variance
– Rank tests for comparing two survival curves
– Cox proportional hazards regression
– logistic regression with binary response
– Wilcoxon-Mann-Whitney (rank-sum) test
– Sample Size
Syntax: POWER Procedure
• The following statements are available in the POWER procedure:
– PROC POWER < options > ;
COXREG < options > ;
LOGISTIC < options > ;
MULTREG < options > ;
ONECORR < options > ;
ONESAMPLEFREQ < options > ;
ONESAMPLEMEANS < options > ;
ONEWAYANOVA < options > ;
PAIREDFREQ < options > ;
PAIREDMEANS < options > ;
PLOT < plot-options > < / graph-options > ;
TWOSAMPLEFREQ < options > ;
TWOSAMPLEMEANS < options > ;
TWOSAMPLESURVIVAL < options > ;
TWOSAMPLEWILCOXON < options > ;
One-Sample t Test
• The following statements demonstrate a power computation for the one-
sample t test. Default values for the DIST=, SIDES=, NULLMEAN=, and
ALPHA= options specify a two-sided test for zero mean with a normal
distribution and a significance level of 0.05.
One Sample Frequence Test
• COXREG Statement
The Cox regression analysis is a fundamental statistical method for
addressing etiological and prognostic hypotheses.
The COXREG statement performs power and sample size analyses for
the score test of a single scalar predictor in Cox proportional hazards
regression for survival data, possibly in the presence of one or more
covariates that might be correlated with the tested predictor.
• LOGISTIC Statement
The LOGISTIC statement performs
power and sample size analyses
for the likelihood ratio chi-square
test of a single predictor in binary
logistic regression, possibly in the
presence of one or more
covariates that might be correlated
with the tested predictor.

SAS Ttest Procedure.pptx

  • 1.
  • 2.
    What is T-Test. •A t-test is a statistical test that is used to compare the means of two groups. • It is often used in hypothesis testing to determine whether a process or treatment actually has an effect on the population of interest, or whether two groups are different from one another. • T-test do Pairwise Comparison. • There are Three types of T-test.
  • 3.
    What is one-sample,two-sample, or paired t-test? • If there is one group being compared against a standard value (e.g. comparing the acidity of a liquid to a neutral pH of 7), perform a one-sample t-test. • If the groups come from two different populations (e.g. two different species, or people from two separate cities), perform a two-sample t-test (independent t-test). • If the groups come from a single population (e.g. measuring before and after an experimental treatment), perform a paired t- test.
  • 4.
    Use of ProcTTEST • The TTEST procedure performs t tests and computes confidence limits for one sample, paired observations, two independent samples, and the AB/BA crossover design. Two-sided, TOST (two one-sided test) equivalence, and upper and lower one-sided hypotheses are supported for means, mean differences, and mean ratios for either normal or lognormal data.
  • 5.
    TTEST Procedure Syntax •PROC TTEST < options > ; BY variables ; CLASS variable ; PAIRED variables ; VAR variables < / options > ; FREQ variable ; Run;
  • 6.
    • By Statement Youcan specify a BY statement with PROC TTEST to obtain separate analyses of observations in groups that are defined by the BY variables. When a BY statement appears, the procedure expects the input data set to be sorted in order of the BY variables. If you specify more than one BY statement, only the last one specified is used. • CLASS Statement A CLASS statement giving the name of the classification (or grouping) variable must accompany the PROC TTEST statement in the two- independent-sample case. It should be omitted for the one-sample, paired, and AB/BA crossover designs. If it is used without the VAR statement, all numeric variables in the input data set (except those that appear in the CLASS, BY, FREQ, or WEIGHT statement) are included in the analysis.
  • 7.
    • FREQ Statement Thevariable in the FREQ statement identifies a variable that contains the frequency of occurrence of each observation. PROC TTEST treats each observation as if it appears n times, where n is the value of the FREQ variable for the observation. If the value is not an integer, only the integer portion is used. If the frequency value is less than 1 or is missing, the observation is not used in the analysis. When the FREQ statement is not specified, each observation is assigned a frequency of 1. The FREQ statement cannot be used if the DATA=data set contains statistics instead of the original observations
  • 8.
    • PAIRED Statement Thepair-lists in the PAIRED statement identifies the variables to be compared in paired comparisons. You can use one or more pair-lists. Variables or lists of variables are separated by an asterisk (*) or a colon (:). The asterisk requests comparisons between each variable on the left with each variable on the right. The colon requests comparisons between the first variable on the left and the first on the right, the second on the left and the second on the right, and so forth. The number of variables on the left must equal the number on the right when the colon is used. The differences are calculated by taking the variable on the left minus the variable on the right for both the asterisk and colon. A pair formed by a variable with itself is ignored. Use the PAIRED statement only for paired comparisons. The CLASS and VAR statements cannot be used with the PAIRED statement.
  • 9.
    • PAIRED A*B;A-B • PAIRED A*B C*D; A-B and C-D • PAIRED (A B)*(C D); A-C, A-D, B-C, and B-D • PAIRED (A B)*(C B); A-C, A-B, and B-C • PAIRED (A1-A2)*(B1-B2); A1-B1, A1-B2, A2-B1, and A2-B2 • PAIRED (A1-A2):(B1-B2); A1-B1 and A2-B2 • The CLASS and VAR statements cannot be used with the PAIRED statement.
  • 10.
    • VAR Statement TheVAR statement names the variables to be used in the analyses. One- sample comparisons are conducted when the VAR statement is used without the CROSSOVER= option or CLASS statement. Two-independent sample comparisons are conducted when the VAR statement is used with a CLASS statement. • WEIGHT Statement The WEIGHT statement weights each observation in the input data set by the value of the WEIGHT variable. The values of the WEIGHT variable can be nonintegral, and they are not truncated. Observations with negative, zero, or missing values for the WEIGHT variable are not used in the analyses. Each observation is assigned a weight of 1 when the WEIGHT statement is not used. The WEIGHT statement cannot be used with an input data set of summary statistics
  • 11.
    Basic Proc forOne-Sample t-test. Input Output
  • 12.
  • 13.
    Basic Proc forTwo-Sample t-test. Input
  • 14.
  • 15.
    Basic Proc forPaired Samples t-test. Output Input
  • 16.
  • 17.
  • 19.
  • 20.
    Before Going tostart Proc Power we should know what is power. • Power = Pr(1- β) = Pr(reject H0 | H1 is true).
  • 21.
    Use of ProcPower. • It is used to find power/sample size. • A variety of statistical analyses are covered: – T tests, equivalence tests, and confidence intervals for means – Tests, equivalence tests, and confidence intervals for binomial proportions – Multiple regression – Tests of correlation and partial correlation – One-way analysis of variance – Rank tests for comparing two survival curves – Cox proportional hazards regression – logistic regression with binary response – Wilcoxon-Mann-Whitney (rank-sum) test – Sample Size
  • 22.
    Syntax: POWER Procedure •The following statements are available in the POWER procedure: – PROC POWER < options > ; COXREG < options > ; LOGISTIC < options > ; MULTREG < options > ; ONECORR < options > ; ONESAMPLEFREQ < options > ; ONESAMPLEMEANS < options > ; ONEWAYANOVA < options > ; PAIREDFREQ < options > ; PAIREDMEANS < options > ; PLOT < plot-options > < / graph-options > ; TWOSAMPLEFREQ < options > ; TWOSAMPLEMEANS < options > ; TWOSAMPLESURVIVAL < options > ; TWOSAMPLEWILCOXON < options > ;
  • 23.
    One-Sample t Test •The following statements demonstrate a power computation for the one- sample t test. Default values for the DIST=, SIDES=, NULLMEAN=, and ALPHA= options specify a two-sided test for zero mean with a normal distribution and a significance level of 0.05.
  • 25.
  • 26.
    • COXREG Statement TheCox regression analysis is a fundamental statistical method for addressing etiological and prognostic hypotheses. The COXREG statement performs power and sample size analyses for the score test of a single scalar predictor in Cox proportional hazards regression for survival data, possibly in the presence of one or more covariates that might be correlated with the tested predictor.
  • 28.
    • LOGISTIC Statement TheLOGISTIC statement performs power and sample size analyses for the likelihood ratio chi-square test of a single predictor in binary logistic regression, possibly in the presence of one or more covariates that might be correlated with the tested predictor.