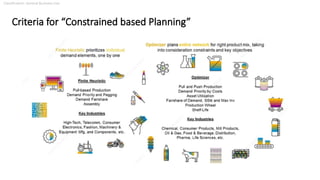
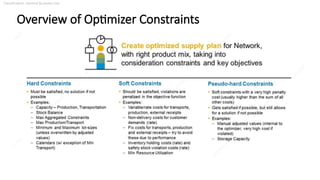
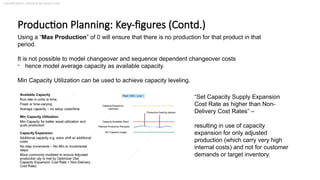
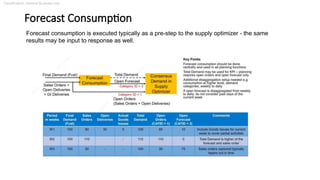
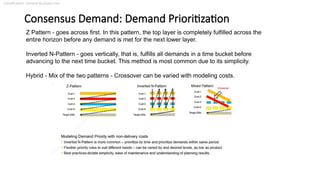
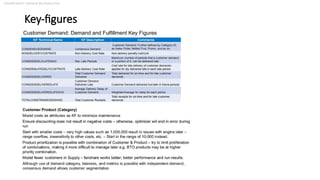
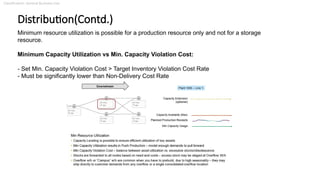
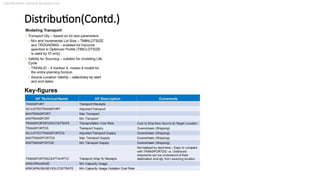
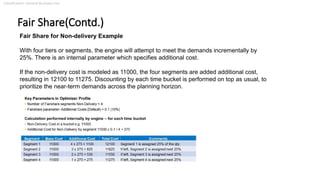
Classification: General Business Use
Optimizer
Classification: General Business Use
Criteria for “Constrained based Planning”
Classification: General Business Use
Time-Series VS Order-Based Planning
Classification: General Business Use
Role of Optimizer
Classification: General Business Use
Overview of Optimizer Constraints
Classification: General Business Use
SAP Recommendations
Delivery maximization is very rarely used by customers as it tends to assign very large costs
internally, making the solution potentially non-optimal
Start with smaller costs – very high values such as 1,000,000 result in issues with enginer later – range
overflow, insensitivity to other costs etc. – Start in the range of 10,000 instead.
Inventory costs are often modeling costs rather than true costs – make it easier to model.
For Push production, it is necessary to model Max. inventory – otherwise optimizer would plan in lopsided
manner for qty above and beyond Target Inventory
Approached for Max. Inventory. Set as x factor for Target Inventory; e.g 3 times Target Inv.
For fast moving product as higher than Target Inv. ; for other products we may set max Inv = Target Inv.
Classification: General Business Use
PRODUCTION
General Guidelines for Optimizer with its Key-figures ; Master Data
Classification: General Business Use
Production
Classification: General Business Use
Capacity constraints & Alternative Production lines
Priority is determined by production cost - this allows you to switch from the main production
line to an alternate production line by modeling one production source header for each line.
Classification: General Business Use
Production Planning: Key-figures
Classification: General Business Use
Production Planning: Key-figures
The following are the two types of planner adjustments:
Fixed: This is made possible by the “Adjusted Production Interactive” key figure.
Minimum: The planner wants the minimum quantity to be planned even if there is no
demand in that period. Additional quantity may be planned on top, if the demand exceeds
the minimum specified.
Within FROZEN HORIZON, “Adjusted Production” is copied from “Minimum Production” key-figure.
Outside FROZEN HORIZON, , “Adjusted Production” is taken from “Adjusted Production Interactive”
key-figure.
Note: Both types of adjustments are specific to the periods they are entered. System does NOT shift unmet
quantity to other time buckets.
Classification: General Business Use
Production Planning: Key-figures (Contd.)
Using a “Max Production” of 0 will ensure that there is no production for that product in that
period.
It is not possible to model changeover and sequence dependent changeover costs
- hence model average capacity as available capacity.
Min Capacity Utilization can be used to achieve capacity leveling.
“Set Capacity Supply Expansion
Cost Rate as higher than Non-
Delivery Cost Rates” –
resulting in use of capacity
expansion for only adjusted
production (which carry very high
internal costs) and not for customer
demands or target inventory.
Classification: General Business Use
Production Planning: Master Data
Min and Incremental Lot Size - enabled for horizons specified globally in the optimizer profile.
Production Lead Time - controls when capacity or components are consumed, if not on finish date
- in the production source header.
Classification: General Business Use
Demand
General Guidelines for Optimizer with its Key-figures ; Master Data
Classification: General Business Use
Forecast Consumption
Forecast consumption is executed typically as a pre-step to the supply optimizer - the same
results may be input to response as well.
Classification: General Business Use
Consensus Demand: Demand Prioritization
Z Pattern - goes across first. In this pattern, the top layer is completely fulfilled across the
entire horizon before any demand is met for the next lower layer.
Inverted N-Pattern - goes vertically, that is, fulfills all demands in a time bucket before
advancing to the next time bucket. This method is most common due to its simplicity.
Hybrid - Mix of the two patterns - Crossover can be varied with modeling costs.
Classification: General Business Use
Key-figures
Customer Demand: Demand and Fulfillment Key Figures
Classification: General Business Use
Key-figures (Contd.)
Independent Demand: Independent Demand and Fulfillment Key Figures
Classification: General Business Use
Inventory
General Guidelines for Optimizer with its Key-figures ; Master Data
Classification: General Business Use
Guidelines for Inventory Cost Modeling
Existing Inventory should always be used to meet customer demand rather than holding onto it as long
as possible in order to meet target inventory, and then getting rid of it in the very last time bucket.
Scenario# 01 Scenario# 02
Always first model non-delivery costs, then discounts and lateness, and only then set inventory target
violation cost rates
Classification: General Business Use
Key-figures & Master Data
Modeling Considerations for the Additional Lot Size Key Figure
Additional Lot Size is an output key figure from supply planning for visibility and reporting.
Fair share is performed for target inventory only and not for additional lot size.
Classification: General Business Use
Distribution
General Guidelines for Optimizer with its Key-figures ; Master Data
Classification: General Business Use
Distribution
Modeling Storage Resources
The storage capacity are bit different to Production resources.
Capacity cannot be aggregated across time buckets, we need to configure separate storage usage key
figures similar to Projected Stock.
Classification: General Business Use
Distribution(Contd.)
Minimum resource utilization is possible for a production resource only and not for a storage
resource.
Minimum Capacity Utilization vs Min. Capacity Violation Cost:
- Set Min. Capacity Violation Cost > Target Inventory Violation Cost Rate
- Must be significantly lower than Non-Delivery Cost Rate
Classification: General Business Use
Distribution(Contd.)
Key-figures
Classification: General Business Use
Fair share
General Guidelines for Optimizer with its Key-figures ; Master Data
Classification: General Business Use
Fair share
Fair share occurs across products, locations, customers, and time buckets in the network -
not one product at a time - resulting in the right product mix when common constraints exist,
such as shared production lines or BOM components
A maximum of 10 segments is allowed. It is recommended that you use 4-5 segments, if fair
share is desired.
Classification: General Business Use
Fair Share(Contd.)
Fair Share for Non-delivery Example
With four tiers or segments, the engine will attempt to meet the demands incrementally by
25%. There is an internal parameter which specifies additional cost.
If the non-delivery cost is modeled as 11000, the four segments are added additional cost,
resulting in 12100 to 11275. Discounting by each time bucket is performed on top as usual, to
prioritize the near-term demands across the planning horizon.
Classification: General Business Use
QUOTAs
Classification: General Business Use
Quota consideration by Optimizer
Use of ranges is better as exact quotas can make it difficult to find a solution.
Quota Coverage is activated for each time bucket with a value of 1.

SAP IBP Optimizer with all Master Data.pptx

  • 1.
  • 2.
    Classification: General BusinessUse Criteria for “Constrained based Planning”
  • 3.
    Classification: General BusinessUse Time-Series VS Order-Based Planning
  • 4.
    Classification: General BusinessUse Role of Optimizer
  • 5.
    Classification: General BusinessUse Overview of Optimizer Constraints
  • 6.
    Classification: General BusinessUse SAP Recommendations Delivery maximization is very rarely used by customers as it tends to assign very large costs internally, making the solution potentially non-optimal Start with smaller costs – very high values such as 1,000,000 result in issues with enginer later – range overflow, insensitivity to other costs etc. – Start in the range of 10,000 instead. Inventory costs are often modeling costs rather than true costs – make it easier to model. For Push production, it is necessary to model Max. inventory – otherwise optimizer would plan in lopsided manner for qty above and beyond Target Inventory Approached for Max. Inventory. Set as x factor for Target Inventory; e.g 3 times Target Inv. For fast moving product as higher than Target Inv. ; for other products we may set max Inv = Target Inv.
  • 7.
    Classification: General BusinessUse PRODUCTION General Guidelines for Optimizer with its Key-figures ; Master Data
  • 8.
  • 9.
    Classification: General BusinessUse Capacity constraints & Alternative Production lines Priority is determined by production cost - this allows you to switch from the main production line to an alternate production line by modeling one production source header for each line.
  • 10.
    Classification: General BusinessUse Production Planning: Key-figures
  • 11.
    Classification: General BusinessUse Production Planning: Key-figures The following are the two types of planner adjustments: Fixed: This is made possible by the “Adjusted Production Interactive” key figure. Minimum: The planner wants the minimum quantity to be planned even if there is no demand in that period. Additional quantity may be planned on top, if the demand exceeds the minimum specified. Within FROZEN HORIZON, “Adjusted Production” is copied from “Minimum Production” key-figure. Outside FROZEN HORIZON, , “Adjusted Production” is taken from “Adjusted Production Interactive” key-figure. Note: Both types of adjustments are specific to the periods they are entered. System does NOT shift unmet quantity to other time buckets.
  • 12.
    Classification: General BusinessUse Production Planning: Key-figures (Contd.) Using a “Max Production” of 0 will ensure that there is no production for that product in that period. It is not possible to model changeover and sequence dependent changeover costs - hence model average capacity as available capacity. Min Capacity Utilization can be used to achieve capacity leveling. “Set Capacity Supply Expansion Cost Rate as higher than Non- Delivery Cost Rates” – resulting in use of capacity expansion for only adjusted production (which carry very high internal costs) and not for customer demands or target inventory.
  • 13.
    Classification: General BusinessUse Production Planning: Master Data Min and Incremental Lot Size - enabled for horizons specified globally in the optimizer profile. Production Lead Time - controls when capacity or components are consumed, if not on finish date - in the production source header.
  • 14.
    Classification: General BusinessUse Demand General Guidelines for Optimizer with its Key-figures ; Master Data
  • 15.
    Classification: General BusinessUse Forecast Consumption Forecast consumption is executed typically as a pre-step to the supply optimizer - the same results may be input to response as well.
  • 16.
    Classification: General BusinessUse Consensus Demand: Demand Prioritization Z Pattern - goes across first. In this pattern, the top layer is completely fulfilled across the entire horizon before any demand is met for the next lower layer. Inverted N-Pattern - goes vertically, that is, fulfills all demands in a time bucket before advancing to the next time bucket. This method is most common due to its simplicity. Hybrid - Mix of the two patterns - Crossover can be varied with modeling costs.
  • 17.
    Classification: General BusinessUse Key-figures Customer Demand: Demand and Fulfillment Key Figures
  • 18.
    Classification: General BusinessUse Key-figures (Contd.) Independent Demand: Independent Demand and Fulfillment Key Figures
  • 19.
    Classification: General BusinessUse Inventory General Guidelines for Optimizer with its Key-figures ; Master Data
  • 20.
    Classification: General BusinessUse Guidelines for Inventory Cost Modeling Existing Inventory should always be used to meet customer demand rather than holding onto it as long as possible in order to meet target inventory, and then getting rid of it in the very last time bucket. Scenario# 01 Scenario# 02 Always first model non-delivery costs, then discounts and lateness, and only then set inventory target violation cost rates
  • 21.
    Classification: General BusinessUse Key-figures & Master Data Modeling Considerations for the Additional Lot Size Key Figure Additional Lot Size is an output key figure from supply planning for visibility and reporting. Fair share is performed for target inventory only and not for additional lot size.
  • 22.
    Classification: General BusinessUse Distribution General Guidelines for Optimizer with its Key-figures ; Master Data
  • 23.
    Classification: General BusinessUse Distribution Modeling Storage Resources The storage capacity are bit different to Production resources. Capacity cannot be aggregated across time buckets, we need to configure separate storage usage key figures similar to Projected Stock.
  • 24.
    Classification: General BusinessUse Distribution(Contd.) Minimum resource utilization is possible for a production resource only and not for a storage resource. Minimum Capacity Utilization vs Min. Capacity Violation Cost: - Set Min. Capacity Violation Cost > Target Inventory Violation Cost Rate - Must be significantly lower than Non-Delivery Cost Rate
  • 25.
    Classification: General BusinessUse Distribution(Contd.) Key-figures
  • 26.
    Classification: General BusinessUse Fair share General Guidelines for Optimizer with its Key-figures ; Master Data
  • 27.
    Classification: General BusinessUse Fair share Fair share occurs across products, locations, customers, and time buckets in the network - not one product at a time - resulting in the right product mix when common constraints exist, such as shared production lines or BOM components A maximum of 10 segments is allowed. It is recommended that you use 4-5 segments, if fair share is desired.
  • 28.
    Classification: General BusinessUse Fair Share(Contd.) Fair Share for Non-delivery Example With four tiers or segments, the engine will attempt to meet the demands incrementally by 25%. There is an internal parameter which specifies additional cost. If the non-delivery cost is modeled as 11000, the four segments are added additional cost, resulting in 12100 to 11275. Discounting by each time bucket is performed on top as usual, to prioritize the near-term demands across the planning horizon.
  • 29.
  • 30.
    Classification: General BusinessUse Quota consideration by Optimizer Use of ranges is better as exact quotas can make it difficult to find a solution. Quota Coverage is activated for each time bucket with a value of 1.