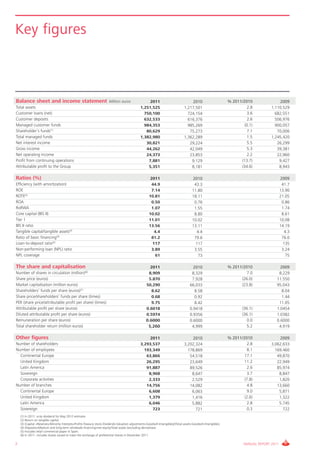
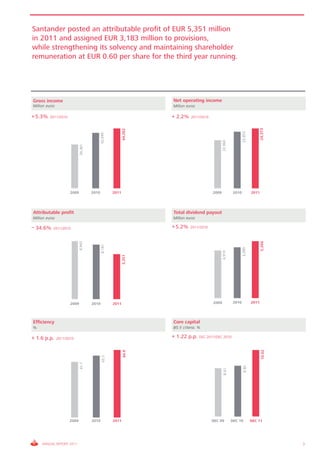
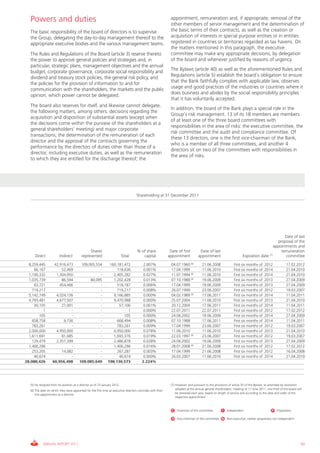
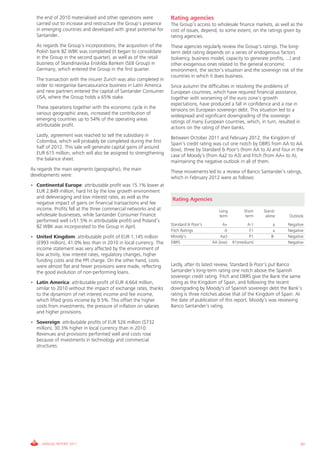
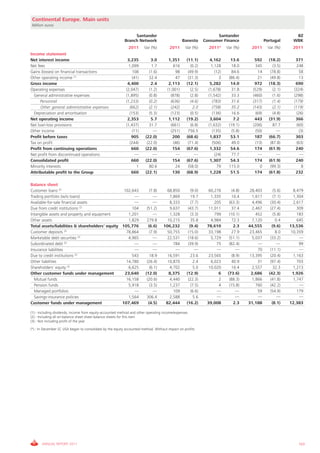
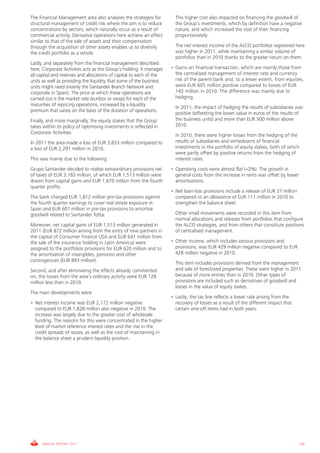
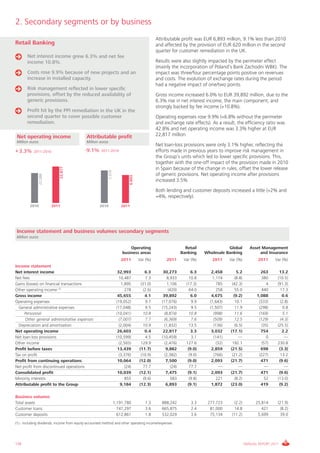
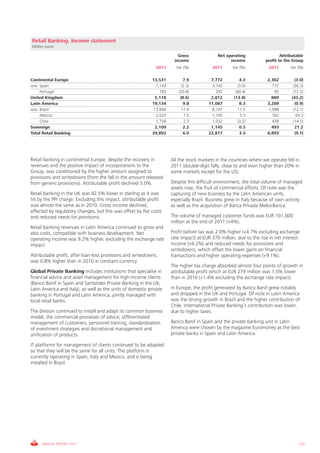
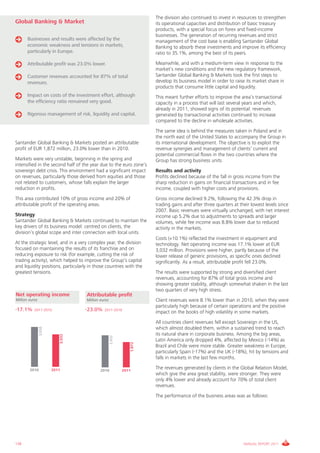
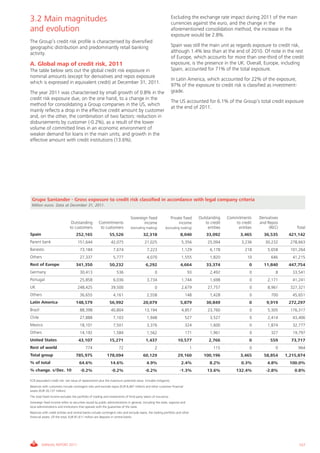
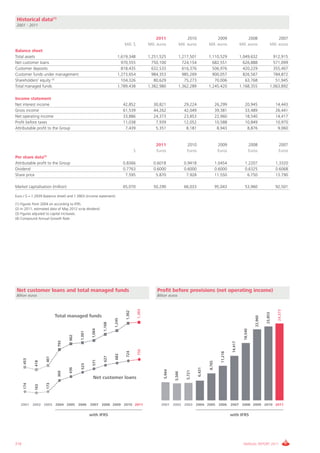
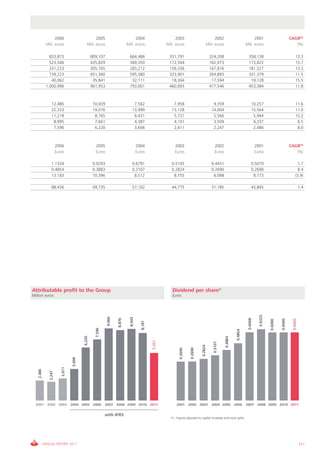
Annual report
2011
Thousand year old olive trees at Grupo Santander City, Boadilla del Monte, Madrid, Spain
2   Key figures                                         48    Report on corporate governance
 4   Letter from the Chairman                            51    Ownership structure
 8   Letter from the Chief Executive Officer             54    Banco Santander’s board of directors
12   Corporate governance                                70    Shareholders’ rights and
16   The share                                                 general shareholders’ meeting
                                                          72   Banco Santander’s senior management
18   Banco Santander’s business model                     74   Transparency and independence
19   Commercial focus                                     76   Unified Good Governance Code
22   Disciplined use of capital and financial strength
23   Prudence in risks                                    78   Financial and economic report
24   Geographic diversification                           80   Consolidated financial report
26   Model of subsidiaries                                99   Report by business areas
27   The Santander brand                                  10     1. Main segments or geographical areas
27   Efficiency                                          136     2. Secondary segments or businesses

28   Santander’s businesses in 2011                      144   Risk management report
28   Grupo Santander results                             146   Executive summary
30   Continental Europe                                  148   Corporate principles of risk management
34   United Kingdom                                      152   Corporate governance of the risks function
36   Latin America                                       154   Integral control of risk
40   United States-Sovereign                             156   Credit risk
41   Global businesses                                   166     Credit exposure in Spain
                                                         178   Market risk
44   Sustainability                                      188     Management of financing and liquidity risk
47   Human resources                                     193   Operational risk
                                                         196   Reputational risk
                                                         198   Adjustment to the new regulatory framework
                                                         200   Economic capital
                                                         203   Risk training activities

                                                         204   Appendices
                                                         206   Compliance programme
                                                         210   Historical data
                                                         212   General information
Key figures


Balance sheet and income statement                                      Million euros                 2011                             2010                       % 2011/2010               2009
Total assets                                                                                     1,251,525                         1,217,501                               2.8          1,110,529
Customer loans (net)                                                                               750,100                           724,154                               3.6            682,551
Customer deposits                                                                                  632,533                           616,376                               2.6            506,976
Managed customer funds                                                                             984,353                           985,269                              (0.1)           900,057
Shareholder’s funds(1)                                                                              80,629                            75,273                               7.1             70,006
Total managed funds                                                                              1,382,980                         1,362,289                               1.5          1,245,420
Net interest income                                                                                 30,821                            29,224                               5.5             26,299
Gross income                                                                                        44,262                            42,049                               5.3             39,381
Net operating income                                                                                24,373                            23.853                               2.2             22,960
Profit from continuing operations                                                                    7,881                             9,129                            (13.7)              9,427
Attributable profit to the Group                                                                     5,351                             8,181                            (34.6)              8,943

Ratios (%)                                                                                              2011                             2010                                                  2009
Efficiency (with amortization)                                                                           44.9                             43.3                                                  41.7
ROE                                                                                                      7.14                            11.80                                                 13.90
ROTE(2)                                                                                                10.81                             18.11                                                 21.05
ROA                                                                                                      0.50                             0.76                                                  0.86
RoRWA                                                                                                    1.07                             1.55                                                  1.74
Core capital (BIS II)                                                                                  10.02                              8.80                                                  8.61
Tier 1                                                                                                 11.01                             10.02                                                 10,08
BIS II ratio                                                                                           13.56                             13.11                                                 14.19
Tangible capital/tangible assets(3)                                                                       4.4                               4.4                                                   4.3
Ratio of basic financing(4)                                                                              81.2                             79.6                                                  76.0
Loan-to-deposit ratio(5)                                                                                 117                               117                                                   135
Non-performing loan (NPL) ratio                                                                          3.89                             3.55                                                  3.24
NPL coverage                                                                                               61                               73                                                     75

The share and capitalisation                                                                           2011                              2010                     % 2011/2010                2009
Number of shares in circulation (million)(6)                                                          8,909                             8,329                              7.0              8,229
Share price (euros)                                                                                   5.870                             7.928                           (26.0)             11.550
Market capitalisation (million euros)                                                                50,290                            66,033                           (23.8)             95,043
Shareholders’ funds per share (euros)(1)                                                                8.62                              8.58                                                8.04
Share price/shareholders’ funds per share (times)                                                       0.68                              0.92                                                1.44
PER (share price/attributable profit per share) (times)                                                 9.75                              8.42                                              11.05
Attributable profit per share (euros)                                                                0.6018                            0.9418                            (36.1)            1.0454
Diluted attributable profit per share (euros)                                                        0.5974                            0.9356                            (36.1)            1.0382
Remuneration per share (euros)                                                                       0.6000                            0.6000                              0.0             0.6000
Total shareholder return (million euros)                                                              5,260                             4,999                              5.2              4,919

Other figures                                                                                         2011                             2010                       % 2011/2010               2009
Number of shareholders                                                                           3,293,537                         3,202,324                               2.8          3,062,633
Number of employees                                                                                193,349                           178,869                               8.1            169,460
  Continental Europe                                                                                63,866                            54,518                              17.1             49,870
  United Kingdom                                                                                    26,295                            23,649                              11.2             22,949
  Latin America                                                                                     91,887                            89,526                               2.6             85,974
  Sovereign                                                                                          8,968                             8,647                               3.7              8,847
  Corporate activities                                                                               2,333                             2,529                              (7.8)             1,820
Number of branches                                                                                  14,756                            14,082                               4.8             13,660
  Continental Europe                                                                                 6,608                             6,063                               9.0              5,871
  United Kingdom                                                                                     1,379                             1,416                              (2.6)             1,322
  Latin America                                                                                      6,046                             5,882                               2.8              5.745
  Sovereign                                                                                            723                               721                               0.3                722
    (1) In 2011, scrip dividend for May 2012 estimate.
    (2) Return on tangible capital.
    (3) (Capital +Reserves+Minority Interests+Profits-Treasury stock-Dividends-Valuation adjustments-Goodwill-Intangibles)/(Total assets-Goodwill-Intangibles).
    (4) (Deposits+Medium and long-term wholesale financing+net equity/Total assets (excluding derivatives).
    (5) Includes retail commercial paper in Spain.
    (6) In 2011, includes shares issued to meet the exchange of preferential shares in December 2011.

2                                                                                                                                                                         ANNUAL REPORT 2011
Santander posted an attributable profit of EUR 5,351 million
in 2011 and assigned EUR 3,183 million to provisions,
while strengthening its solvency and maintaining shareholder
remuneration at EUR 0.60 per share for the third year running.


Gross income                                                           Net operating income
Million euros                                                          Million euros

+ 5.3%    2011/2010                                                    + 2.2%     2011/2010


                                                                                                                                      24,373
                                                              44,262


                                                                                                                      23,853
                                              42,049


                                                                                                     22,960
                              39,381


                       2009            2010            2011                                   2009             2010            2011


Attributable profit                                                    Total dividend payout
Million euros                                                          Million euros

– 34.6%     2011/2010                                                  + 5.2%     2011/2010


                                                                                                                                      5,260
                              8,943


                                              8,181


                                                                                                                      4,999
                                                                                                     4,919
                                                              5,351


                       2009            2010            2011                                   2009            2010             2011


Efficiency                                                             Core capital
%                                                                      BIS II criteria. %

+ 1.6 p.p.      2011/2010
                                                                       + 1.22 p.p. DEC 2011/DEC 2010
                                                                                                                                       10.02
                                                              44.9
                                               43.3
                              41.7


                                                                                                                       8.80
                                                                                                      8.61


                      2009             2010            2011                                   DEC 09          DEC 10           DEC 11


     ANNUAL REPORT 2011                                                                                                                        3
Letter from the Chairman
 Emilio Botín


                                     In a very difficult economic, financial and regulatory
                                     environment, Banco Santander maintained its policy of giving
                                     priority to strengthening its balance sheet as regards capital,
                                     liquidity and provisions and generated an attributable profit of
                                     EUR 5,351 million, 34.6% less than in 2010.
                                     This profit was generated after setting aside EUR 1,812 million
                                     of gross provisions, which were not required, to clean up our
                                     real estate assets. This increased coverage for repossessed
                                     property to 50% and got ahead of the extra provisioning
                                     requirements for the financial system approved by the
                                     government on February 3, 2012.
                                     This provisions, together with writing down part of the goodwill
                                     of Banco Santander Portugal, reduced net profits for the year by
                                     EUR 1,670 million.
                                     Net capital gains in 2011 from the strategic alliance with the
                                     insurer Zurich in Latin America and the entry of new partners
                                     into the capital of Santander Consumer Finance in the United
                                     States amounted to EUR 1,513 million and were used to bolster
                                     the balance sheet via other provisions.
                                     Net operating income (gross income less operating expenses)
                                     was EUR 24,373 million, underscoring the Group’s strength and
                                     capacity to generate results.
                                     We improved the capital base and liquidity and notably
                                     reinforced our balance sheet. With a core capital of 9.01%,
                                     according to the more demanding criteria of the European
                                     Banking Authority, Banco Santander complied with the EBA’s
 Emilio Botín                        new capital requirements six months ahead of the deadline.
                                     The requirements recently approved by the government and the
                                     Bank of Spain to raise coverage of bad property loans in Spain
“In the last five years, the total   will require EUR 2,300 million of provisions, over and above
                                     those made ahead of time against 2011’s earnings. These
 shareholder remuneration paid       provisions will be fully charged in 2012.
 by Banco Santander was
 EUR 24,000 million”


 4                                                                              ANNUAL REPORT 2011
Shareholder remuneration                                                1. Geographic diversification and recurring nature
The Group’s sound results will enable, as I said at the last            of revenues
shareholders’ meeting, the total remuneration per share to be           Banco Santander has achieved a geographic positioning in the
maintained at EUR 0.60 for the third year running. I would like         last few years centred on its 10 core markets, with an
to point out that in the last five years, thanks to recurring profits   appropriate balance between developed countries (which
and international diversification, Banco Santander’s shareholder        contribute 46% of the Group’s profits) and emerging markets
remuneration amounted to EUR 24,000 million.                            (54%).

The Santander Dividendo Elección (scrip dividend) offers our            The retail banking model, developed via our 15,000 branches,
shareholders the option to receive part of the dividend in cash         which provide services to 102 million customers, give us
or new shares. Since its launch three years ago, more than 80%          recurring growth in commercial revenues in most of the
of capital has chosen shares. The board agreed to propose to            countries where we operate.
the next shareholders’ meeting applying this programme for the
fourth dividend payment (May 2012).                                     In 2011, we sold Banco Santander Colombia for $ 1,225 million.
                                                                        Our market share in Colombia is far from the 10% we aspire to
In short, Banco Santander demonstrated its capacity to generate         have in the markets in which we are present in order to create
results to meet simultaneously the EBA’s capital requirements,          value for our shareholders. This operation generated EUR 615
substantially increase provisions for bad property loans and            million of net capital gains, which will be recorded in 2012 and
maintain the remuneration at EUR 0.60 per share.                        assigned to further clean up bad property loans, in accordance
                                                                        with the new rules.
Banco Santander’s response to
the challenges of the environment                                       2. Capital and liquidity management and model
                                                                        for subsidiaries
In my view, the Bank faced three big challenges in 2011 and
                                                                        Our overriding priority objective in 2011 was to strengthen the
they will continue to determine the international economic and
                                                                        balance sheet.
financial situation in the coming quarters:
                                                                        In October 2011, the European Banking Authority announced
• Weak economic activity, particularly in developed countries.
                                                                        the core capital requirements for the main European banks and
• Very unstable financial markets, especially European sovereign        set June 30 2012 as the deadline for meeting them. In
  debt markets.                                                         December, the EBA said Santander needed a further EUR 15,302
                                                                        million of capital to comply with these requirements.
• And very significant regulatory measures and changes,
  particularly higher liquidity and capital requirements for banks.     Banco Santander has yet again demonstrated its flexibility and
                                                                        capacity of execution and, in just two months, we reached the
Banco Santander has four management drivers, enabling it,               core capital of 9% required by the EBA.
from a position of strength, to comply with this new scenario
and continue to gain ground over its competitors:                       Our goal is to have a core capital of 10%, one percentage point
                                                                        above the EBA’s requirement and well above the demands of
                                                                        the new Basel III regulation and those applicable to systemically
                                                                        important financial institutions.
                                                                        We maintained a comfortable liquidity position by increasing our
                                                                        deposits base without having to remunerate above market rates.
                                                                        Meanwhile, the maturity profile of our debt, concentrated in the
                                                                        medium and long term, enables us not to have to go to the
                                                                        debt markets in Spain and Portugal. All of this, coupled with
                                                                        weak demand for loans in developed countries, produced an
                                                                        improvement in our liquidity situation. The loan-to-deposit ratio
                                                                        reached 117% at the end of 2011 (135% in 2009).


     ANNUAL REPORT 2011                                                                                                                   5
The Group’s international expansion model, via subsidiaries that     4. Model of operational and commercial efficiency
 are autonomous in capital and liquidity and in many cases listed,    Banco Santander is the most efficient international bank among
 gives us access to markets in an efficient and rapid way and it      its competitors, with a cost-to-income (efficiency) ratio of 45%
 facilitates the funding of aquisitions.                              compared to the average of 60% of our competitors.
 The financial autonomy of these units is very well viewed by the     The model of operational and commercial efficiency, with the
 Group’s regulator and by local regulators, as it acts as a fire-     same technology for the Group’s banks, generates cost
 break, limiting the risk of contagion from any problem between       synergies and economies of scale, allows for the exchange of
 the Group’s units.                                                   best business practices between countries and enables us to
                                                                      make significant investments in innovation, development and
 We were the first international bank to present its living will to   security for the benefit of our customers.
 the regulator thanks to the transparency of our model of
 autonomous subsidiaries.                                             These four management drivers are strengthened by the strong,
                                                                      solid and attractive Santander brand. Santander is today the
 3. Prudent risk management                                           world’s fourth most valuable financial brand according to Brand
 Banco Santander’s traditional policy of prudence in risks has        Finance.
 enabled the Group to maintain a non-performing loans (NPLs)
 ratio lower than the sector’s average in all countries where we                                     ***
 do business.                                                         Moreover, in the current socio-economic environment,
                                                                      Santander remains firmly committed to sustainability, focusing
 The evolution of NPLs in Spain was worse than expected for two
                                                                      on higher education, and also attaches importance to social
 reasons: on the one hand, the downturn in the economy was
                                                                      actions and respect for the environment. The Santander
 more severe than envisaged and, on the other, the fall in
                                                                      Universities programme continues to grow and already has 990
 lending meant the NPL ratio increased to a greater extent than
                                                                      agreements and has awarded 16,000 travel scholarships.
 the volume of non-performing loans.
                                                                      Furthermore, in 2011 Banco Santander launched in Spain an
 Real estate risk in Spain continued to fall and, at the end of       ambitious youth employment plan, with 5,000 grants for
 2011, represented 4% of the Group’s total lending, including         internships in small-and medium-sized firms.
 foreclosed properties.


“Banco Santander complied with the EBA’s
 new capital requirements six months ahead
 of the deadline”


 6                                                                                                              ANNUAL REPORT 2011
“Net operating income of EUR 24,373 million
 underscored the Group’s strength and capacity
 to generate results”


 Future prospects: Banco Santander’s                                      The performance of the Santander share in 2011 was not in
 unique positioning                                                       accordance with the Group’s level of recurring profits,
 Some of the factors that have affected the financial sector in           soundness and solvency or with the stability of earnings per
 recent years are likely to persist in 2012. It is therefore vital that   share.
 the European Union approves as soon as possible the decisions            Our share is the most liquid of Eurostoxx and ended 2011 with a
 needed to quickly restore confidence.                                    dividend yield of more than 10%. The share’s low price was
 In the medium- and long-term, it is likely that, led by European         mainly due to external factors, such as the penalisation of the
 countries, economic growth rates will gradually return to                whole banking sector and the pressure exerted on the sovereign
 normal, which will make the financial markets more stable and            debt of various euro zone countries, which have made it difficult
 reduce unemployment.                                                     to estimate adequately Banco Santander’s profit expectations,

 In this scenario, Banco Santander is in a unique position to             I am convinced we will reach all our goals and this will push up
 create value for its shareholders, continue to register strong           the share price significantly. You can rest assured that everyone
 growth in profits in emerging markets and profitably gain                who works for the Group, from the board to the more than
 market shares in the most mature markets.                                190,000 people at the service of our 102 million customers, will
                                                                          do all they can to make Banco Santander a safe and profitable
 Banco Santander has no significant acquisition or disposal plans         investment for its more than three million shareholders.
 for the medium term, but it will be on the look out to take
 advantage of opportunities to strengthen itself in its core              There were changes in the composition of the board during
 markets. In an environment of higher cost of capital, the strict         2011. In May, Mr Luis Ángel Rojo died and his place was taken
 criteria the Bank has always used for its acquisitions assume            by the appointment of Mr Vittorio Corbo. Later, Mr Antoine
 even greater importance: attain in the third year a return on the        Bernheim (representing Assicurazioni Generali) and Mr Francisco
 investment greater than the cost of capital and a positive               Luzón left the board. At the next shareholders' meeting, and if
 contribution to earnings per share.                                      the board's proposal is approved, Mr Antonio Basagoiti,
                                                                          Mr Antonio Escámez and Mr Luis Alberto Salazar-Simpson will
 All of this will enable us, as I said last September at the Bank’s       leave the board and Ms Esther Giménez-Salinas will become
 Investor Day in London, to boost Santander’s ROE to 12%-14%              a director. On behalf of the board and on my own behalf I
 in 2014 and ROTE (return on tangible equity) to 16%-18% from             would like to thank the outgoing directors for their work. I am
 the current 10.81%.                                                      sure the contribution to the board of the two new members will
                                                                          be very positive.
                                                                          Thank you for your support and confidence.


                                                                          Emilio Botín
                                                                          CHAIRMAN


       ANNUAL REPORT 2011                                                                                                                 7
Letter from the Chief Executive Officer
 Alfredo Sáenz


                                         Results and the Santander share
                                         Grupo Santander generated an attributable profit, excluding
                                         extraordinaries, of EUR 7,021 million, 14.2% less than in 2010.
                                         Including provisions and capital gains, profit was 34.6% lower
                                         at EUR 5,351 million.
                                         Earnings per share were EUR 0.60, 36.1% less than
                                         in 2010.
                                         Both our net profit as well as our share price, which dropped
                                         26% in 2011, are at cyclically low levels as they were affected
                                         by the worsening of the international environment due to the
                                         euro zone’s sovereign debt crisis.
                                         I would like to point out, nevertheless, the good performance
                                         of operating profit, which amounted to EUR 24,373 million:
                                         net interest income was up 5.5%; net fee income rose 7.6%
                                         and net operating income (before provisions) was 2.2% higher.
                                         Very few international banks have been able to generate growth
                                         in revenue and in net operating income. This reflects the good
                                         commercial performance of our businesses, and underlines our
                                         strong potential to generate future results.
                                         I would like to transmit a clear message: the results we
                                         presented in 2011 do not represent our Group’s potential pace
                                         of profit generation.
                                         Over the next two or three years we will recover levels of
                                         profitability and growth that reflect the potential of our
                                         businesses. A vital first step in this process is to absorb, in 2011
                                         and 2012, the regulatory and economic cycle impact. Once this
                                         has been done we can return to the profit levels the Group was
                                         used to before the crisis.
 Alfredo Sáenz
                                         Balance sheet soundness
                                         Banco Santander has given priority to balance sheet
                                         strengthening over short-term results. In 2011, we put the
“Banco Santander has given               emphasis on three corporate initiatives that enabled us to
 priority to balance sheet               bolster the balance sheet:
 strengthening over short-term           1. Capital. We achieved the core capital ratio requirement of the
                                            European Banking Authority six months ahead of the deadline.
 results, placing emphasis on
                                         1. The core capital ratio, with Basel II criteria, increased from
 capital, liquidity and provisions for      8.8% in 2010 to 10.0%.
 real estate assets in Spain“            2. Liquidity. During the last three years, we have carried out a
                                            significant strengthening of our liquidity position. Leveraging
                                            in Spain and Portugal and the improvement in the savings
                                            rate enabled us to gradually reduce the gap between loans
                                            and deposits, additional liquidity that will finance debt
                                            maturities in the coming years.


 8                                                                                    INFORME ANUAL 2011
3. Provisions for real estate assets in Spain. We increased          6. Lastly, we have a high level of profit generation before
   coverage of repossessed properties to 50% and in 2012                provisions. This gives us the capacity to absorb provisions
   we will complete the provisions required by Royal Decree-law         when the economic cycle is weak and to generate profits and
   2/2012.                                                              capital when the cycle improves.
We made a significant effort to complete the three measures in       Results and management priorities by units
the shortest time possible,while most of our competitors are still   During 2011, many of our units had to absorb negative impacts:
trying to absorb all these cyclical and regulatory effects.          a cyclically high level of provisions, in the case of Spain;
                                                                     regulatory effects, as in the UK; and, in other cases, a higher
It is very important for the financial sector to complete this       cost of wholesale liquidity and a worse than expected economic
process of balance sheet strengthening. For this to happen,          performance.
moreover, two external conditions are vital:
                                                                     However, we are actively managing these effects and are very
• First, financial stability: governments, regulators and central    aware that, in the coming years, an excellent execution will be
  banks have to ensure a macroeconomic environment of                even more vital.
  financial stability so that banks can capture liquidity normally
  and in reasonable conditions.                                      Banco Santander has the necessary drivers, both in mature and
• Second, regulatory clarity: banks have to have a clear idea of     emerging markets, to return to its normal profit levels.
  the capital and liquidity ratios required; how they are
                                                                     A. Mature markets
  calculated; what types of balance sheet are sustainable and
                                                                     The challenges facing banking units in mature markets are well
  other types of costs to be assumed. Only in this way can they
                                                                     known: low demand for loans; economies under pressure; low
  make medium- and long-term business plans and adequate
                                                                     interest rate environments and higher cost of liquidity.
  financing of the economy can be assured. At the moment
  many of the regulatory changes are clearly pro-cyclical and        We believe, however, that the dominant banks in these markets
  have a negative effect on economic growth.                         have a great opportunity to create value in the medium term:
Only when these two conditions are met will the financial sector     recover attractive profitability; gain market share and become
return to its role of financing the economy normally.                large generators of capital.

Strengths as a Group                                                 Spain and Portugal
We must concentrate all our efforts on taking advantage of our       In 2011, I told you that we were seeing a turning point in these
business opportunities and ensuring we return to a level of          units. However, during 2011 the sovereign debt crisis triggered
profitability and growth that befits our business mix and the        a downturn in the Spanish and Portuguese economies, and
quality of the organization.                                         further falls in interest rates, which delayed the process of
                                                                     returning to the average profitability of our businesses in these
In order to achieve this normalization of profits, we are starting   countries.
from a privileged position. We have strengths as a Group that set
us apart from our international competitors:                         Both the results of the Santander Branch Network and
                                                                     Banesto in Spain as well as those of Portugal, suffered a sharp
1. The diversification of our business portfolio is clearly better   setback. The aggregate profit of the three units dropped from
   than the rest of international banks.                             EUR 1,722 million in 2010 to EUR 964 million in 2011.
2. We have a major presence in growth markets. We generate           However, our medium-term view has not changed: the crisis is
   more than 50% of our profits in high growth emerging              offering the most solid banks opportunities to gain market share
   markets.                                                          and improve their competitive position. We have a unique
                                                                     situation to gain en edge in the Spanish and Portuguese markets,
3. We have very strong local positions, with market shares of
                                                                     and we are going to exploit it.
   more than 10%. Many of our competitors have banks
   without scale in many markets, and this prevents them             The management priorities for the next two years remain as
   attaining an acceptable level of profitability.                   follows: adapt prices to the new environment; maintain firm
4. Our business model is sustainable in the new regulatory           control on costs and gain profitable market share from
   and liquidity environment. Other banks are having to step up      competitors immersed in processes of integration and
   the pace of reducing the size of their wholesale balance sheet.   restructuring. Our objective in Spain and Portugal is to recover
                                                                     in the medium-term the level of profits we had in 2008.
5. Our solvency and credit quality are clearly better than those
   of our local competitors.


     INFORME ANUAL 2011                                                                                                                  9
Rest of Continental Europe/Santander Consumer                       b. Emerging markets
Santander Consumer posted an attributable profit of EUR 1,228       The growth opportunities in emerging markets are well known.
million, 51.5% more than in 2010, largely due to an improved        However, not all banks that operate in these markets will be
cost of the provisions made in the main markets where it            able to create value in the medium- and long-term: it is
operates. This result includes the contribution of Santander        necessary to have a good local critical mass; a strong culture
Consumer USA which, as of 2012, leaves the perimeter of             and commercial model and an adequate risk appetite, with a
Santander Consumer and will be included in the US.                  good view of the credit. Santander meets all these
                                                                    requirements.
Santander Consumer can continue over the coming years to
take advantage of its position of strength in its markets,          Brazil’s attributable profit declined 7.2% to EUR 2,610 million.
maintaining good management of prices and risk.                     Despite the good growth in net operating income (+10.6%),
                                                                    profits were under pressure from higher provisions and
Moreover, we have a good opportunity to develop retail              writedowns.
banking in Germany, on the basis of the business acquired from
SEB. As you know, we have been betting on growth in Germany         Once the integration of Santander and Banco Real is concluded,
for many years and today we generate close to EUR 500 million       the challenge is to narrow the profitability gap with our local
of profits there. Our consumer business operations in the rest of   competitors. This should give us a sustained 15% growth
Continental Europe are also delivering very good profitability.     potential in profits in the coming years.

United Kingdom                                                      In México, attributable profit was 40.9% higher at EUR 936
The profit from our business in the UK was 41.7% lower at EUR       million. The management priority for the next few years is to
1,145 million. It was hit by the provision for payment protection   consolidate the business improvement achieved in 2011 and
insurance remediation (PPI) and by regulatory impacts on the        continue to participate in the market’s growth opportunities.
cost of liquidity which exerted pressure on Santander UK’s          In my view, our potential in Mexico is very high and we expect
results.                                                            profit growth of more than 15% a year.

The objective in the UK is to take the necessary measures to        In Chile, attributable profit fell 9.0% to EUR 611 million due to
absorb the regulatory impact. This includes actively managing       the increase in provisions. We have a privileged position in this
prices, the structure of the balance sheet and the cost base.       market: in market share, customer base and quality of
Moreover, we continue to develop our business with companies,       management. We have to be able to adapt our price and costs
a segment where we still have a presence below that of our          structure in order to absorb the new regulatory framework.
natural share.
                                                                    In Argentina, attributable profit declined 2.7% to EUR 287
For this, we have the business acquired from Royal Bank of          million, but in local currency terms it was 8.0% higher.
Scotland.                                                           We expect the big investment effort in installed capacity
                                                                    (34 new branches in 2011) to enable us to boost the profit
United States                                                       contribution of this unit in the coming years.
Sovereign’s attributable profit increased 24.0% to EUR 526
million, largely due to the sharp fall in provisions.               In Poland, the attributable profit from nine months consolidation
                                                                    with the Group was EUR 232 million, and for the whole year
After dedicating three years to strengthening the balance sheet     EUR 288 million.
and managing costs, our main challenge in the US for the next
few years is to boost revenue generation and establish the          Bank Zachodni WBK, our commercial bank in Poland, has
technology and operational foundations needed to grow in the        a long way to go and is already well positioned to capture
country. The generation of fee income is clearly below that of      growth opportunities. Furthermore, we can add value in the
our regional competitors and we will have to work to gradually      cooperation between this local unit in Poland and the Group’s
narrow this divide. Our technology systems enable us to             global units.
increase the offer of transactional products and improve cross-     The good results in 2011 enable us to reaffirm the goal of a
selling to customers.                                               profit contribution to the Group of more than EUR 450 million
                                                                    in 2013.


10                                                                                                             ANNUAL REPORT 2011
“Our business units must pay particular attention
 to successfully carrying out the measures put into
 effect to improve their profitability”


The combination of cyclical normalisation and the measures             Conclusions
taken by our units will enable us to return to normal profits          I want to leave you with four clear messages:
in the coming years.
                                                                       1. The first is that we have been able to generate excellent
In September, we held our Investor Day in London at which we              operating results, and this is a good reflection of our
presented our strategy to analysts and investors. The message of          business. However, we are very aware that the net profit in
these sessions was clear, and I want to reiterate it in this letter:      2011 does not reflect at all the potential profitability of our
as a Group, our normalised profitability is clearly higher than the       businesses in the medium term.
current levels.
                                                                       2. The second is that we are taking the necessary steps to
Our goals are:                                                            normalise our profitability. We do not base our future by
 • A return on equity of between 12% and 14% within three                 trusting the economic recovery will make our profits grow.
   years.                                                                 On the contrary, we are very conscious that it is up to us to
                                                                          define and execute the strategies enabling us to attain our
• A return on tangible equity (excluding goodwill) of between
                                                                          goals.
  16% and 18%.
                                                                       3. The third message is that, in order to carry out this profit
We believe that these objectives represent our normalised                 normalisation, we have the best professionals in
profitability, i.e. a return in accordance with the potential of our      international commercial banking. We have a high quality
businesses, and which is not dragged down by the current                  team which is very motivated and has shown in the past its
cyclical moment. In order to attain these levels, we need three           capacity to assume ambitious goals and meet or even surpass
conditions:                                                               them.
First, it is vital to complete the threefold strengthening of          4. Fourth, the Santander share is currently at a level that does
the balance sheet: capital, liquidity and provisions for real             not reflect the structural profitability or our medium-term
estate assets. We will finish this process during 2012.                   growth potential. As our capacity to normalise our profits
                                                                          becomes clear, this will be reflected in the share price.
Second, we see some cyclical recovery, mainly in Europe,
which we expect to begin in 2013 and consolidate in 2014 and           I am very optimistic about the prospects for your investment
2015. This means lower needs for specific provisions, reduced          in the coming years.
liquidity tensions and a rise in interest rates.
Lastly, our business units must pay particular attention to
successfully carrying out the measures put into effect to
improve their profitability, adapt to the environment and take
advantage of the opportunities that arise. We believe this will
be the case as we are very aware that, in a complicated
environment, execution is the key and we are not going to fail.


                                                                       Alfredo Sáenz
                                                                       CHIEF EXECUTIVE OFFICER


     ANNUAL REPORT 2011                                                                                                                     11
Corporate governance


                                                              Grupo Santander City, Boadilla del Monte, Madrid, Spain

                                                              The board of directors
     Banco Santander’s corporate                              Banco Santander’s board of directors is the maximum decision-
     governance model                                         making body, except for matters reserved for the general
                                                              meeting of shareholders. It is responsible, among other things,
                                                              for the Group’s strategy. Its functioning and activities are
     Equality of shareholders’ rights.                        regulated by the Bank’s internal rules and principles of
                                                              transparency, efficiency and defence of shareholders’ interests
     • The principle of one share, one vote, one dividend.
                                                              guide it. The board oversees compliance with the best
     • No anti-takeover measures in the corporate By-laws.    international practices in corporate governance and closely
                                                              involves itself in the Group’s risks. In particular, the board, at the
     • Informed participation of shareholders in meetings.
                                                              proposal of senior management, is the body responsible for
                                                              establishing and monitoring the Bank’s risk appetite.
                                                              The board has a balanced composition between executive and
     Maximum transparency, particularly
                                                              non-executive directors, all members are recognised for their
     in remunerations.
                                                              professional capacity, integrity and independence.
                                                              There were changes to the board in 2011. Mr Luis Ángel Rojo
     A corporate governance model recognised by               Duque, governor of the Bank of Spain between 1992 and 2000,
     socially responsible investment indices.                 died on May 24. He joined the board in 2005. In July,
     • Santander has been in the FTSE4Good and DJSI indices   Mr Vittorio Corbo Lioi, chairman of the Central Bank of Chile
       since 2003 and 2000, respectively.                     between 2003 and 2007, joined the board as a non-executive
                                                              director and in October Assicurazioni Generali S.p.A., also a
                                                              non-executive director, left the board after reducing its stake
                                                              in the Bank.


12                                                                                                                  ANNUAL REPORT 2011
Transparency and remuneration policy
                                                                   Transparency for Banco Santander is vital for generating
                                                                   confidence and security among shareholders and investors,
                                                                   even more so at times of financial uncertainty and volatility
                                                                   such as today’s.
                                                                   In particular, the remuneration policy for directors and the
                                                                   Bank’s senior management has transparency as the fundamental
                                                                   principle driven by the board for many years. The other two
                                                                   pillars are:
                                                                   1. Involvement of the board, as, at the proposal of the
                                                                      appointments and remuneration committee, it approves the
                                                                      report on the remuneration policy for directors, as well as
                                                                      their remuneration and contracts and of those of the other
                                                                      senior members of management and the remunerations of
                                                                      the remaining managers of the identified staff.
                                                                   2. The board submits to the shareholders’ meeting on a
                                                                      consultative basis and as a separate item on the agenda the
                                                                      report on the remuneration policy for directors.
                                                                   2. Anticipation and adapting to regulatory changes, given the
                                                                      importance that Santander has always attached to rigorous
                                                                      management of risk and a remuneration policy consistent
On January 23, 2012, Mr Francisco Luzón López resigned as an          with it.
executive director and executive vice-president responsible for    2. Towers Watson, an independent expert, certificated that
the America division.                                                 Grupo Santander’s remuneration policy was in accordance
On the occasion of the next general shareholders’ meeting,            with the new regulatory framework.
and if the board’s proposal is accepted, Mr Antonio Basagoiti,
Mr Antonio Escámez and Mr Luis Alberto Salazar-Simpson will        The board’s remuneration in 2011
cease to hold office as directors and Ms Esther Giménez-Salinas,   In 2011, the board agreed to reduce all directors’ remuneration,
rector of the Ramon Llull University, will be appointed as         for all items, by 8%.
independent director to the board.
                                                                   The amount paid to its members for exercising their functions of
The board expressed its gratitude for the outstanding              supervision and collegiate decision-making has been reduced by
contribution made by the outgoing directors over the years they    6% over 2010. This amount has been unchanged since 2008.
had formed part of it, highlighting the important executive
responsibilities undertaken by several of them throughout their    As regards executive directors, the board decided to maintain the
professional careers in the Bank.                                  fixed remuneration for 2012 and reduce by an average of 16%
                                                                   the variable ones for 2011.
With these changes, the size of the board is reduced from 20
directors at the beginning of 2011 to 16.                          Full details of director compensation policy in 2011 may be found
                                                                   in the report by the appointments & remuneration committee
The board in 2011                                                  which forms part of Banco Santander’s corporate documentation.
• It held 14 meetings, two of which were dedicated to the
  Group’s global strategy.
• During 2011, the second vice-chairman and chief executive
  officer presented to the board eight management reports and
  the third vice-chairman, responsible for the risk division,
  presented reports on his area.


     ANNUAL REPORT 2011                                                                                                               13
Board of directors of Banco Santander
London, November 21, 2011


              General secretary       Director             Director               Director          Director                First vice-chairman
              and of the board        Mr Ángel Jado        Mr Luis Alberto        Mr Abel Matutes   Mr Antonio Basagoiti    Mr Fernando de Asúa Álvarez
              Mr Ignacio Benjumea     Becerro de Bengoa    Salazar-Simpson Bos    Juan              García-Tuñón
              Cabeza de Vaca


     Director                 Director                     Director                       Fourth vice-chairman             Chairman
     Mr Juan Rodríguez        Ms Ana Patricia Botín-Sanz   Mr Rodrigo Echenique           Mr Manuel Soto                   Mr Emilio Botín-Sanz de
     Inciarte                 de Sautuola y O’Shea         Gordillo                       Serrano                          Sautuola y García de los Ríos


14                                                                                                                    ANNUAL REPORT 2011
Executive committee
                                                                                                                       Risk committee
                                                                                                                       Audit and compliance committee
                                                                                                                       Appointments and remuneration committee
                                                                                                                       International committee
                                                                                                                       Technology, productivity and quality committee


Second vice-chairman and            Director                 Director                   Director                     Director
chief executive officer             Mr Antonio Escámez       Ms Isabel Tocino           Lord Terence Burns           Mr Vittorio Corbo Lioi
Mr Alfredo Sáenz Abad               Torres                   Biscarolasaga


                             Third vice-chairman                 Director                                    Director                         Director
                             Mr Matías Rodríguez Inciarte        Mr Guillermo de la Dehesa Romero            Mr Francisco Luzón López *       Mr Javier Botín-Sanz
                                                                                                                                              de Sautuola y O’Shea


        * Resigned his position on the board January 2012.


                ANNUAL REPORT 2011                                                                                                                                   15
The Santander share


General meeting of shareholders, June 17, 2011, Santander, Cantabria, Spain

                                                                              Shareholder remuneration
                                                                              Banco Santander assigned EUR 5,260 million to shareholder
       EUR 5,260 million assigned to                                          remuneration in 2011, 5.2% more than in 2010. The high
                                                                              degree of recurrence of profits and the soundness of
       shareholder remuneration.                                              Santander’s capital enabled the Bank to pay out more than EUR
                                                                              24,000 million in the last five years.
       Market capitalization of EUR 50,290                                    As part of this remuneration, Santander has the Dividendo
       million at the end of 2011.                                            Elección programme (scrip dividend), which enables
                                                                              shareholders to opt to receive an amount equivalent to certain
       The largest bank in the euro zone by                                   dividends in the form of cash or new Santander shares.
                                                                              The Bank offers flexible remuneration, enabling its shareholders
       market value.                                                          to benefit from tax advantages. Some 80% of the Bank’s capital
                                                                              chose to receive shares in 2011.
       EUR 0.60 remuneration per share in                                     Banco Santander paid against 2011 results:
       the last three years.                                                  • A first interim dividend of EUR 0.135 per share (August 2011);

       3,3 million shareholders.                                              • A scrip dividend of EUR 0.126 per share equivalent to the
                                                                                second interim dividend (November 2011);
                                                                              • A scrip dividend of EUR 0.119 per share equivalent to the
                                                                                third interim dividend (February 2012).
                                                                              The board also approved applying the Santander Dividendo
                                                                              Elección programme, with a remuneration of EUR 0.220 per
                                                                              share, at the date when the final dividend is normally paid
                                                                              (April/May 2012). This would bring the total remuneration
                                                                              per share to EUR 0.60 for the third year running.


16                                                                                                                      ANNUAL REPORT 2011
Investor Day, September 29 and 30, 2011, London, United Kingdom


      Comparative performance of the Santander share                      Distribution of the capital stock by type of shareholder
      and indices                                                         Number of shares and %
      Data from December 31 2010 to December 31 2011                      December 2011

        Santander                  Dow Jones Stoxx 50       Base: 100
        Dow Jones Stoxx Banks      Ibex 35
                                                                                                                     Shares                          (%)
120
                                                                          Board                                198,130,573                          2.22
110
                                                                          Institutional                      4,687,628,721                        52.62
100
                                                                          Retail                             4,023,283,909                        45.16
 90                                                                       Total                            8,909,043,203                        100.00
 80

 70

60

50
      31/12/10                                               31/12/11


      Performance of the Santander share                                  Shareholder base and capital
      The Santander share ended 2011 at EUR 5.87, 26% lower than          The number of Banco Santander shareholders continued to
      a year earlier. This performance does not reflect the path of       rise in 2011. It increased by 91,213 to 3.3 million.
      results, the soundness of the Bank’s balance sheet or its future
      prospects. The very volatile markets, as a result of the European   At the end of the year, 2.2% of the capital stock was in the
      sovereign debt crisis and doubts on the euro, penalized             hands of the board of directors, 45.2% with individual
      European stock market indices and, in particular, the financial     shareholders and rest with institutional investors. Of the total
      sector. This situation was also accentuated by doubts on the        capital stock, 87.85% is located in Europe, 11.85% in the
      recovery in global economic growth and by the new regulatory        Americas and 0.30% in the rest of the world.
      requirements for banks.
                                                                          Banco Santander carried out four capital increases in 2011 to
      Santander’s performance, however, was better than that of           tend to the Santander Dividendo Elección programmes (February
      the DJ Stoxx Banks (-32.5%), the main European banking index.       and November), the conversion of 3,458 bonds (October) and
      Santander remains in a privileged position as the largest bank in   the exchange of preferred shares for ordinary shares
      the euro zone by market value and the 13th on the world,            (December). A total of 579,921,105 new shares were issued.
      with a capitalization of EUR 50,290 million at the end of 2011.
                                                                          In 2011, Banco Santander continued to strengthen its
      Furthermore, the Santander share is the most liquid in
                                                                          information and attention channels for shareholders in Spain,
      Eurostoxx.
                                                                          the United Kingdom, the United States, Brazil, Argentina,
                                                                          Mexico, Portugal and Chile. These offices tended to 232,430
                                                                          consultations by telephone, 51,616 e-mails and 19,819
                                                                          shareholders attended 206 forums and events held in various
                                                                          countries.
                                                                          On September 29 and 30, 2011 the Investor Day was held in
                                                                          London, at which the chairman and the chief executive officer,
                                                                          together with Banco Santander’s senior management,
                                                                          presented the Bank’s strategy for the coming years to more than
                                                                          300 analysts and investors.


           ANNUAL REPORT 2011                                                                                                                         17
The Santander business model


                                                     Commercial focus

                                                                               Disciplined
                                     Efficiency                                use of
                                                                               capital and
                                                                               financial
                                                                               strength


                                    Santander
                                    brand                                      Prudence
                                                                               in risk

                                                  Geographic diversification
                                                  and model of subsidiaries


     Banco Santander’s business model gives substantial            Santander complied with the European Banking
     recurrence in results.                                        Authority’s core capital requirement of 9% six
                                                                   months ahead of schedule.
     Retail banking generates 87% of revenues.
     Santander has 102 million customers who are                   Santander did not need public funds at any time
     tended to via 14,756 branches, the largest network            during the crisis and is one of the world’s most
     of an international bank.                                     solid and solvent banks.
     Geographic diversification in 10 core countries               In an environment of tensions in financial markets,
     provides Santander with an appropriate balance                Santander’s liquidity position has remained
     between mature and emerging markets.                          comfortable.
     The Bank’s international expansion was achieved               Grupo Santander’s non-performing loans ratio is
     with subsidiaries autonomous in capital and                   below the sector’s average in the main countries
     liquidity, giving us advantages when financing and            where it operates.
     limiting the risk of contagion.
                                                                   Santander was recognized by Brand Finance as the
     The Group’s technology and its control of costs               fourth most valuable brand in the world.
     make Santander one of the world’s most efficient
     banks.


18                                                                                                  ANNUAL REPORT 2011
Banco Santander branch in Madrid, Spain

Commercial focus                                                                      Total Group customers
The customer is the focal point of Banco Santander’s activity.                        (Million)

Grupo Santander’s customer base has grown notably in the last                        Santander Branch Network       9.6
few years and more than doubled between 2003 and 2011
                                                                                     Banesto                        2.4
(from 41 million to 102 million). The geographic distribution of
customers was as follows: 40.8% in Latin America, 31.3% in                           Portugal                       2.0
continental Europe, 26.2% in the UK and 1.7% in the US.                              Bank Zachodni WBK              2.4
                                                                                     Santander Consumer Finance    15.5
The Bank’s retail business focus sets it apart from other global
competitors, underlined by the fact that 99.8% of the Group’s                        Rest                           0.1
customers are in the segments of commercial banking and                              Total continental Europe      32.0
consumer finance.                                                                    United Kingdom                26.7
Lasting relations and greater value-added with customers are                         Brazil                        25.3
generated and maintained in branches. Santander has 14,756                           Mexico                         9.3
branches, the largest network of an international bank. In 2011,
                                                                                     Chile                          3.5
Grupo Santander increased its distribution capacity with the
addition of 674 branches mainly as a result of the incorporation                     Argentina                      2.5
of new businesses in Poland and Germany and plans to open                            Uruguay                        0.2
new branches in high growth countries such as Brazil, Mexico                         Colombia                       0.3
and Argentina.
                                                                                     Puerto Rico                    0.5
In addition to this network, the Bank also has other channels,                       Peru                           0.1
available around-the-clock, such as online banking, mobile                           Rest                           0.1
telephone banking and telephone banking. In 2011, Santander
stepped up its investment in its call centres in the UK in order to                  Total Latin America           41.7
improve its customer service. It also launched applications that                     United States-Sovereign        1.7
enable it to operate via iPhone and other mobile telephone                           Total customers              102.1
means in some of the Group’s banks.


Customers                                  Branches
Million                                    Number
                                   102.1


                                                                            14,756
                                                                14,082
                     97.2


                                                    13,660
           92.0


    2009          2010      2011             2009            2010        2011


       ANNUAL REPORT 2011                                                                                         19
Santander branch in Germany

Quality of service and customer satisfaction                                    There was also a significant advance in 2011 in implementing the
Quality of service is a fundamental part of Banco Santander’s                   corporate model of complaints, which aims to unify the criteria
strategy.                                                                       applied in managing the customer attention services of the
                                                                                Group’s various units.
In 2011, customer satisfaction with the services provided by Banco
Santander through various channels (branches, telephone and                     This model revolves around three elements:
Internet) improved. Some 88.2% of customers said they were
                                                                                • Policies to improve customer attention, confidence and
satisfied, generating greater linkage, proximity and loyalty, as well
                                                                                  satisfaction.
as higher customer revenues.
                                                                                • Decision-taking structure based on agile and efficient
In order to improve the quality of service, the Group has a                       governance systems, with reports made to the first executive
corporate model called META 100, which has been extended to                       level.
more countries year after year. The main objectives of META 100
are to reflect the voice of customers and integrate it into the                 • Management of complaints in accordance with the prevailing
Bank’s businesses; establish a culture of quality (i.e. an organisation           regulations as well as the good banking practices that
that is closer to and focused on customers) and generate dynamics                 regulators require in each country.
of continuous improvement, centred on customer satisfaction.
Banco Santander’s professionals receive continuous training in
order to inform and advise customers transparently and rigorously                Customer satisfaction
and provide the best service. In the last quarters of 2011,                      % of individual customers satisfied
programmes to foster this culture were put into effect such as
El año del servicio in Chile, Nuestro estilo in Argentina and                   Santander Branch Network                                                     88.0
Impulsa tu lado Pro in Banco Santander Spain. The corporate                     Banesto                                                                      91.2
function of Brand Customer Experience was also created, which
                                                                                Portugal                                                                     92.9
oversees the consistency and coherence between the promise of
the brand and the customer’s experience.                                        United Kingdom                                                               89.1
                                                                                Argentina                                                                    91.8
Santander has an advanced model for managing incidents called
                                                                                Brazil                                                                       83.0
MIRÓ, which channels all the disagreements that the customer
transmits to the Bank via various channels.                                     Chile                                                                        90.4
                                                                                Uruguay                                                                      83.7
The objective of MIRÓ is to achieve a quick resolution of
complaints. It channels internally its treatment to specialised units           Mexico                                                                       95.6
and keeps the customer informed of the state of the incident.                   Puerto Rico                                                                  96.6
MIRÓ also identifies the main reasons why customers are not                     Total                                                                        88.2
satisfied and the causes of the incidents so that steps can be taken
to correct them.


 Customer satisfaction by channel
 % of individual customers satisfied

                                  Branches                         Telephone                                     Internet
                                                                                                                                 93.7
                                                                                                                       90.2
                                                                                   89.7
                                                 89.1


                                                                        88.9
                                       87.5


                                2010          2011               2010          2011                            2010           2011


20                                                                                                                                      ANNUAL REPORT 2011
Banco Santander branch in Mexico                                     Banco Santander branch in Brazil

Products and services                                                Corporate school of commercial banking
Banco Santander has a wide range of financial products and           In order to improve Grupo Santander’s commercial banking
services based on the risk profile of its customers and              skills, the corporate school of commercial banking was created
characterised, in all its markets, by anticipation and dynamism      in 2010.
when launching new value offers. Of note among the products
and services launched in 2011 were:                                  This project is supported and involves Banco Santander’s senior
                                                                     management: the governing board of the school is headed by
• In the UK, more than 100,000 123 Cashback credit cards,            Mr. Alfredo Sáenz, the chief executive officer, and comprises
  which return money to customers on the basis of the usage,         senior executives responsible for the main countries and
  were sold in the first two months after its launch.                divisions.
• In Spain, Santander gave those customers with difficulties as a
                                                                     The school’s mission is to gather the best commercial and
  result of the crisis the possibility of benefiting from a three-
                                                                     business practices which make up the Group’s commercial
  year moratorium on the capital repayments of the mortgages
                                                                     banking and promote their transmission in order to drive
  for their main home. Almost 6,000 customers took up the
                                                                     business development in the various units. The school also
  offer.
                                                                     enables new countries that integrate into the Group to quickly
• In Brazil, agreements were signed with major companies, such       and efficiently adapt to Banco Santander’s commercial banking
  as the petrol distributor Shell and the telecoms company Vivo      model.
  (Telefónica), to launch credit cards with added advantages for
  the Bank’s customers.                                              The school is structured into knowledge areas that respond to
                                                                     the various fields and/or segments of commercial banking. Each
• In the US, the SMEs area of Sovereign launched the Boost           area has someone in charge and consists of expert teams for
  Your Business programme, designed to attract new customers         each of the matters arising from the countries in which the
  and increase the already existing linkage. This programme          Group operates. The school capitalises on the best commercial
  offers SMEs very attractive interest rates, new financial          practices of countries, in terms of products, services, quality,
  products and advice shared by specialists.                         business intelligence, etc, and thereby becomes an extra
                                                                     competitive tool for the Group.
                                                                     The first phase of the school concentrated on individual
                                                                     customers. In 2011, it also began to work on company and SME
                                                                     banking, taking advantage of the experience acquired and
                                                                     incorporated the new countries to its sphere of action (the US,
                                                                     Poland and Germany).


Advertising campaigns in Brazil, the UK and Mexico


       ANNUAL REPORT 2011                                                                                                          21
Grupo Santander City, Boadilla del Monte, Madrid, Spain

Disciplined use of capital                                           Liquidity
and financial strength                                               Santander finances most of its loans with customer deposits,
                                                                     maintains comfortable access to wholesale funding and has
Capital                                                              many instruments and markets to obtain liquidity.
Strengthening the balance sheet is a priority objective for Banco
Santander, which has quickly and efficiently adapted to the new      In 2011, Banco Santander continued to strengthen its liquidity
capital requirements of international and European banking           with an increase of more than EUR 16,000 million in customer
authorities, such as Basel III, regarding globally systemic banks,   deposits and debt issues that exceeded the year’s maturities by
and the new requirements of the European Banking Authority           more than EUR 8,000 million. All these issues were carried out
(EBA).                                                               without the state’s guarantee.
Banco Santander carried out various measures regarding capital       Active management of the business portfolio
in the last months of 2011, allowing it to achieve a core capital    Santander made some selective sales in 2011 and obtained
ratio of 9% six months ahead of the EBA’s deadline of June 30,       EUR 1,513 million of capital gains:
2012.
                                                                     • The strategic alliance with the insurer Zurich to develop
According to the EBA, Banco Santander’s additional capital             business in Latin America which generated EUR 641 million
needs amounted to EUR 15,302 million. This amount has been             of capital gains.
reached as follows:
                                                                     • The entry of new partners into the capital of Santander
• EUR 6,829 million of Valores Santander, which have to be             Consumer USA. This operation valued the bank at $4,000
  converted into shares before October 2012.                           million and meant EUR 872 million of capital gains.
• EUR 1,943 million through the exchange of preferred shares         Santander also reached an agreement to sell the Group’s
  for ordinary new shares.                                           businesses in Colombia for $1,225 million (net gain of
• EUR 1,660 million through the application of the Santander         EUR 615 million to be recorded in 2012).
  Dividendo Elección programme (scrip dividend) at the time
  of the final dividend corresponding to fiscal year 2011.
• EUR 4,890 million through organic capital generation and
  the transfer of certain stakes, mainly in Chile and Brazil.
                                                                     Core capital                                  Loan-to-deposit ratio(*)
Regarding the latter, Santander reached in December 2011             BIS II. criteria. %                           %
an agreement (implemented during the first week of 2012) to
transfer 4.41% of Santander Brazil to a major international
                                                                                                                                 135
                                                                                                          10.02


financial institution which will deliver such shares to holders of
convertible bonds issued in October, 2010, by Banco Santander,
                                                                                                                                                           117
                                                                                                                                               117


when these mature, pursuant to the terms of said convertible
                                                                                            8.80


bonds.
                                                                                  8.61


Santander is one of the world’s most solid and well-capitalised
banks, and at no time has had to recourse to public funds,
as a result of which it is one of the international banks with the
best rating.                                                               2009          2010      2011                   2009          2010         2011

                                                                                                                  (*) Includes retail commercial paper in Spain.


22                                                                                                                                ANNUAL REPORT 2011
Grupo Santander’s new data-processing centre in Cantabria, Spain

Prudence in risk                                                     These additional needs will be entirely met in 2012 as follows:
Prudent risk management has been a hallmark of Banco
                                                                     • EUR 1,800 million already charged against the Group’s fourth
Santander since it was founded more than 150 years ago.
                                                                       quarter 2011 results, which lifted coverage of repossessed
Everyone is involved in risk management, from the daily
                                                                       properties to 50% from 31%.
transactions in branches, where business managers also have
risk objectives, to senior management and the board, whose risk      • EUR 2,000 million are a capital buffer required by the rules
committee comprises five directors and meets for some 300              and which are covered by capital already held by the Group.
hours a year.                                                        • The remaining EUR 2,300 million will be covered through
                                                                       capital gains which may be obtained during the year –
Of note among the corporate risk management principles is that         including EUR 900 million from the capital gain on the sale of
the risk function is independent of business. The head of the          Banco Santander Colombia – and through ordinary
Group’s Risk Division, Matías Rodríguez Inciarte, third vice-          contributions to provisions during 2012.
chairman and chairman of the risk committee, reports directly to
the executive committee and to the board.                            Santander’s exposure to the real estate promotion sector
                                                                     represented 14% of its total lending in Spain at the end of 2011
A low and predictable risk profile                                   and only 4% of the Group’s total loans, including repossessed
The board sets the Bank’s risk appetite at a medium-low level.       homes. Santander’s market share of this business is estimated
Some 86% of Grupo Santander’s risk comes from retail banking.        at 10%, well below that of the Group’s total business in Spain
Proximity to the customer enables us to act rigorously and with      (14%).
anticipation when admitting, monitoring and recovering loans.
Santander has units dedicated to recovering unpaid loans,            Moreover, Santander assigned EUR 1,513 million of capital gains
which, under a corporate model, are integrated as one more           obtained in 2011 to strengthening the balance sheet.
business areas in the Group’s various countries and divisions.
                                                                                                             ***
Santander’s risk profiles are highly diversified and their           Banco Santander’s risk management principles are treated in more detail on pages
                                                                     148 to 151 of this annual report.
concentration in customers, business groups, sectors, products
and countries is subject to limits.
The Group has the most advanced risk management models,
such as use of tools for calculating ratings and internal scoring,
economic capital, price-setting systems via return on risk-
adjusted capital (RoRAC), use of value at risk (VaR) in market
risk, and stress testing.
                                                                      Non-performing loan ratio                 Coverage ratio
Risk quality
                                                                      %                                         %
The Group’s non-performing loan ratio increased to 3.89% in
2011, but remains below the average on all the countries where
                                                                                                      3.89


                                                                                                                             75


                                                                                                                                         73


it operates. In Spain, the NPL ratio was 5.49%, also well below
                                                                                                                                                 61
                                                                                            3.55


the sector’s average.
                                                                                  3.24


After approval of Royal Decree Law 2/2012, which sets new
requirements for cleaning up bad property loans in Spain,
the Bank announced that the amount of provisions Grupo
Santander in Spain needs to meet these requirements is
EUR 6,100 million.                                                         2009          2010      2011               2009        2010        2011


       ANNUAL REPORT 2011                                                                                                                               23
Geographic diversification                Grupo Santander has a geographic diversification balanced
                                          between mature and emerging markets (46% and 54% of
                                          profits, respectively, in 2011).
                                          The Bank concentrates on 10 core markets: Spain, Germany,
                                          Poland, Portugal, the UK, Brazil, Mexico, Chile, Argentina and
                                          the US. The global areas also develop products that are
                                          distributed in the Group’s commercial networks and tend to
                                          global sphere clients.


                                           Contribution to the Group´s
                                           attributable profit
                                           %

                                      United States 12%


     Mexico 10%


                                                                             Brazil 28%


                           Chile 7%


                                              Argentina 3%


Rest of Latin America 3%


24                                                                                  ANNUAL REPORT 2011
Main countries.
                                 Other countries where Banco Santander has
                                 retail banking businesses: Peru, Puerto Rico,
                                 Uruguay, Colombia, Norway, Sweden,
                                 Finland, Denmark, Netherlands, Belgium,
                                 Austria, Switzerland and Italy.


United Kingdom 12%


                                                   Poland
                       Germany                        3%
                           5%


           Spain 13%


  Portugal 2%


                                              Rest of Europe 2%


  ANNUAL REPORT 2011                                                             25
Banco Santander branch in Sao Paulo, Brazil


Model of subsidiaries                                                 • They guarantee a high level of transparency and corporate
Grupo Santander’s international expansion was carried out via           governance and reinforce the brand in various countries.
subsidiaries that are independent and autonomous in capital
and liquidity:                                                        Banco Santander combines the financial flexibility of its
                                                                      subsidiaries with their operations as an integrated group that
• Capital: the local units have the capital required to develop       creates high synergies. The corporate systems and policies that
  their activity autonomously and meet regulatory requirements.       Banco Santander implements in all the Group’s institutions
• Liquidity: each subsidiary develops their financial plans,          enable the following:
  liquidity projections and calculates their finance needs,           • Synergies in costs and revenues, by developing with global
  without counting on funds or guarantees from the parent               strategies the Santander retail banking model and sharing the
  bank. The Group’s liquidity position is coordinated by the            best practices among countries and units.
  ALCO committees (assets and liabilities).
                                                                      • Strengthen the Santander culture, with particular importance
The model of subsidiaries autonomous in capital and liquidity,          attached to managing risks at the global level and controlling
with some of them listed, such as Santander Brazil, Santander           the business units.
Chile and Banesto, has strategic and regulatory advantages:
                                                                      • Greater efficiency in investment by sharing systems globally.
• The autonomy of the subsidiaries limits, during a crisis, the
  possibilities of contagion between the various Group units,         All of this enables the Group to obtain better results than each
  thereby reducing systemic risk.                                     local bank would have achieved on its own.

• The subsidiaries are submitted to a double level of supervision
  (local and global) and internal control.
• This model facilitates management of and resolving the crisis
  while generating incentives for good local management.
• The listed subsidiaries allow for access to capital efficiently
  and quickly, always choosing the best alternative for
  shareholders, and they are subject to the market’s discipline.
• The shares of the subsidiaries are an attractive bargaining chip
  for acquisitions in the local market and an alternative to
  investing the Group’s capital.
• They give visibility in the Group’s valuation to various business
  units.


Banco Santander branch in Madrid, Spain                               Banco Santander branch in London, United Kingdom


26
The Santander brand                                                 Efficiency
The Santander brand transmits the Bank’s corporate values           Santander’s IT and operations platform enables it to be very
to customers, shareholders, employees and society in general.       productive and know in detail and with an integral view
These values are: dynamism, strength, innovation, leadership,       customers’ financial needs. The Bank is also making a
commercial focus and quality service, professional ethics and       continuous effort to improve its processes, direct customer
sustainability.                                                     attention and its business support areas in order to provide the
                                                                    best service.
Santander has a significant presence in the brand rankings of
the main consultancy firms, such as Interbrand, Millward Brown      Santander continues to advance in implementing its corporate
and Brand Finance. In 2011, the brand continued to consolidate      technology platforms in all its business units, which is creating
itself in the Group’s key markets, boosting its renown in Brazil,   value through revenue synergies and cost savings. In 2011,
the UK and Germany. In the US and Poland, the transition            integration of Santander’s IT platforms and those of Real in
toward the Santander brand continued to make progress.              Brazil were consolidated. The branches acquired from the
Meanwhile, Santander continues to unify its identity in global      Swedish group SEB in Germany and from Bank Zachodni WBK
segments, such as Select for personal banking, in order to align    in Poland were integrated into the Group.
the positioning in these markets with the Group’s values.
                                                                    A new data-processing centre began to operate in 2011 in
Banco Santander has an international advertising strategy, which    Cantabria, Spain, which joins the Group’s network of such
helps to strengthen and consolidate the Bank’s international        centres that provide service from Madrid-Boadilla del Monte
positioning and supports business. In 2011, when banking was        (Spain), London (UK), Querétaro (Mexico) and Sao Paulo (Brazil).
particularly hard hit, the Bank’s corporate message was focused     The new centre boost the capacity for processing the Group’s
on solvency and the geographically diversified business model,      operations, guarantees business growth in the future and
without forgetting our positioning of proximity, confidence and     reduces to a minimum the operational risk with customers.
commitment to the customer.
                                                                    The Bank’s recurring growth in revenues, the culture of
Corporate sponsorships have proved to be a key platform for         controlling costs and the high degree of productivity of
increasing Santander’s renown, consolidate the Bank’s               branches makes Santander one of the world’s most efficient
international positioning and support business.                     banks, with a cost-to-income ratio of 44.9%.
• In 2011, Santander sponsored for the second year running
                                                                    The continuous improvements in efficiency are leading to
  the Formula 1 Ferrari team, an excellent business tool, as
                                                                    greater value-added for customers. The Bank, in some of its
  underlined by more than 370,000 Santander-Ferrari credit
                                                                    core markets, decided to eliminate commissions for its linked
  cards sold throughout the world. Santander continues to
                                                                    customers: in Spain, with the We want to be your Bank plan in
  sponsor the McLaren team, the main advertising tool in the
                                                                    the Santander Branch Network and in the UK wih the Santander
  UK.
                                                                    Zero Current Account.
• In Latin America, Santander continued to work to be the
  football bank, sponsoring the Santander Libertadores Cup, the
  2011 America’s Cup in Argentina, the South American Cup
  and the agreement in Brazil with the football player Neymar.
In 2012, and via the strategic committee of corporate marketing
and brand, chaired by the CEO, the Bank will continue to foster
brand unification in all countries, bolstering its global
positioning, maximizing corporate sponsorships and working to
create a good brand experience for all customers.


     ANNUAL REPORT 2011                                                                                                                 27
Santander’s businesses in 2011

Grupo Santander results                                   Grupo Santander conducted its business in 2011 against a
                                                          backdrop of slower growth in the global economy, continuous
                                                          tensions in the European sovereign debt markets and in the
Santander posted an attributable profit of                world’s main stock markets and increasing regulatory pressure.
EUR 5,351 million in 2011, 34.6% less than                Geographic diversification, with the growing importance of
in 2010, after setting aside EUR 3,183                    emerging countries, Banco Santander’s retail banking model
                                                          and the incorporation of new businesses pushed up gross
million for provisions.                                   income to EUR 44,262 million, a new record.
                                                          Operating expenses grew 9.3% as a result of the integration of
     Of note was the EUR 1,812 million gross provision
                                                          new businesses and investment in technology. However, the
     for real estate assets in Spain.
                                                          performance varied between countries such as Spain and
     The recurring profit was EUR 7,021 million           Portugal, where they fell; mature countries where the Bank is
     (-14.2%).                                            strengthening its commercial franchise (Germany, the UK and
     Profit before provisions was EUR 24,373 million,     the US), and emerging countries, where the Group continues to
                                                          invest in increasing commercial capacities. The cost-to-income
     one of the largest among international banks.
                                                          (efficiency) ratio was 44.9%, making Santander one of the
     Santander reached the core capital ratio of 9% set   world’s most efficient international banks.
     by the EBA six months ahead of the deadline.
                                                          Profit before provisions was EUR 24,373 million, underscoring
     The loan-to-deposit ratio was 117%,18 p.p. lower     Grupo Santander’s capacity to generate results. Banco
     than in 2009.                                        Santander’s attributable profit in 2011 was EUR 5,351 million.
     The Bank aims to increase its ROE to 12-14% in       It would have been EUR 7,021 million (-14,2%) but for the
     2014 and its ROTE to 16-18%.                         fourth quarter EUR 1,812 million gross provision for real estate
                                                          assets in Spain (which raised coverage of repossessed properties
                                                          from 31% to 50%), as well as amortisation of EUR 601 million
                                                          gross of goodwill of Santander Totta in Portugal. The Bank also
                                                          assigned EUR 1,513 million net of capital gains to other
                                                          provisions.


28                                                                                                  ANNUAL REPORT 2011
Santander branch in London, United Kingdom


Commercial activity and balance sheet strength                         Medium- and long-term objectives
From the business standpoint, the main strategy is still to        In September 2011, Grupo Santander held a meeting in London
capture and link more and better customers and offer them a        for more than 300 investors and analysts. Senior management
good service, and improve the structure of funding loans with      explained in detail at this Investor Day the Group’s strategy and
more stable deposits (+3% in 2011). The growth in lending          objectives for the medium- and long-term, as well as for the
(+3%) varied between mature countries, where demand by             various business units.
households and companies was weak, and emerging countries,
where the increase was notable.                                    Under a scenario for 2012 of continued weak growth in the
                                                                   global economy and assuming as of 2013 a normalization of the
This evolution of loans and deposits enabled the Group to          economic environment, Santander expects to lift its return on
improve its liquidity position. The loan-to-deposit ratio was      equity (ROE) from 7.1% (9.4% taking into account the recurring
117%, 18 p.p. lower than in 2009. Moreover, the Group              profit) to 12%-14% in 2014 and its return on tangible equity
maintained during 2011 its capacity of recourse to the markets     from 10.8% (14.2% bearing in mind the recurring profit) to
for funding, underlined by the fact that the year’s total issues   16%-18%, through:
exceeded maturities by EUR 8,000 million.
                                                                   • A gradual normalization of profits in mature markets,
Grupo Santander’s core capital ratio at the start of 2012 was        including lower needs for provisions.
9% (according to the EBA’s criteria). The 9% ratio, required by
                                                                   • Organic growth in emerging markets.
the European Banking Authority for Europe’s main banks, was
reached six months ahead of the June 30, 2012 deadline.            • Better optimization of costs and revenues.


     ANNUAL REPORT 2011                                                                                                                 29
Continental Europe


                                                           Spain-Santander Branch Network
                                                           In 2011, the Santander Branch Network contributed EUR
     Continental Europe’s attributable profit              660 million to the Group’s profits, 22.1% less than in 2010.
     was 15.1% lower at EUR 2,849 million.
                                                           The environment in which business was conducted in Spain
                                                           was characterized by weak GDP growth, higher unemployment,
     Santander has a large network of                      restructuring in the financial sector and tough competition for
     branches in Continental Europe (6,608),               deposits. In this scenario, the network’s priorities were to
     which tend to 32 million customers. It                actively manage customer spreads, strengthen the balance
                                                           sheet through capturing deposits, credit risk quality, austerity in
     carries out retail banking business in                costs and capturing, linking and retaining customers.
     Spain, Portugal, Germany and Poland,
     and consumer finance in 13 countries.                 Gross income grew 2.4%, consolidating the change seen at the
                                                           end of 2010. Operating expenses were 1.2% lower and the
     The Group also has wholesale banking,                 number of branches remained virtually the same. The efficiency
     asset management and insurance                        ratio improved to 46.5%.
     businesses.                                           The worsening of the economic environment continued to exert
                                                           upward pressure on the Group’s non-performing loan ratio in Spain
         The commercial strategy is centred on             (to 5.49%), although it was still below the sector’s average.
         capturing funds in an environment of weak         Exposure to the real estate sector continued to decline and at the
         demand for loans. Basic revenues (net interest    end of 2011 represented only 4% of the Group’s total lending,
         income, fee income and insurance) grew            including repossessed properties.
         8.4%.                                             Commercial and customer strategy
         In Spain, the change of trend in revenues was     The Santander Branch Network serves 9.6 million customers, of
         consolidated.                                     which almost 8.2 million are individuals, mainly salaried workers,
                                                           the young and pensioners, more than 260,000 are private and
         In Portugal, Santander Totta is the most
                                                           personal banking customers and 1.1 million are companies,
         solvent bank and has the country’s best rating.   SMEs, businesses and institutions.
         In Poland, Bank Zachodni WBK, with 526
         branches and 2.4 million customers, was
         incorporated to the Group.
         Santander Consumer Finance notched up
         record revenues and profits.
         Santander was named by the prestigious
         magazine The Banker the best bank in Western
         Europe, Spain and Portugal in 2011.
                                                           Attributable profit                Net operating income
                                                           Million euros                      Million euros

                                                           - 22.1%    2011/2010              + 5.7%     2011/2010
                                                                           847


                                                                                                                             2,353
                                                                                                              2,227
                                                                                    660


                                                                       2010      2011                  2010           2011


30                                                                                                      ANNUAL REPORT 2011
Santander branch in Madrid, Spain                                    Banesto branch in Madrid, Spain

Since 2006, Queremos ser tu Banco (We want to be your Bank)          Spain-Banesto
has been the strategic plan for capturing new customers and          Banesto contributed attributable profit of EUR 130 million
establishing stable and lasting relations with them. The 3.8         to the Group, 68.9% less than in 2010.
million customers in this plan benefit from not having to pay
service commissions, which makes them more satisfied and             This bank focuses on individual customers, SMEs and companies,
increases the linkage and, thus, more profitable for the Bank.       which, overall, provide 90% of its revenues.
Santander also has a commercial intelligence, backed by its          Despite the complex domestic environment in 2011, Banesto
vanguard technology and with an innovative multichannel              improved its competitive position in terms of profitability,
strategy in products and services.                                   efficiency and quality of risk and increased its customer base
In 2011, 227,000 loans were granted for a total of EUR 25,000        and linkage, as well as enhancing the quality of service in its
million. Yet again Santander was the sector’s leader in              branch network:
intermediating the ICO finance lines (market share of around         • 193,000 new customers were captured and 72,000
20%).                                                                  companies, SMEs, commerce and the self-employed. More
                                                                       than 50% of customers have their pay cheque paid into
Santander has been very active in capturing customer funds,
                                                                       their account.
reducing at the same time the cost of deposits by taking
advantage of its position as a solvent and solid bank. In the last   • The efficiency ratio was 47.4%.
two years, Santander has increased its market share of deposits
                                                                     • Real estate risk was reduced, and only represents 6.1%
by more than a percentage point.
                                                                       of total lending.
In order to support customers with temporary problems due to         • The non-performing loan ratio was 5.01%, one of
the economic crisis in Spain, the Santander Branch Network             the sector’s lowest.
offered, as of August 1, a three-year moratorium on repaying
the capital of mortgages for the main residence. At the end of          Medium- and long-term objectives
2011, close to 6,000 customers benefited from this offer for a
                                                                     Banesto will continue to strengthen its competitive position in
total of almost EUR 1,000 million.
                                                                     order to:
    Medium- and long-term objectives                                 • Achieve an efficiency ratio below 40% in 2013, with revenue
                                                                       growth supported by management of prices and strict control
• Sustained growth in revenues and improvement in the
                                                                       of costs.
  efficiency ratio to 39%-41%.
                                                                     • Improve the loan-to-deposit ratio.
• Boost deposits by 5%.
                                                                     • Maintain risk quality above the sector’s average.
• Consolidate the customer base and increase transactional
  linkage.
• Strengthen leadership in high-income segments and foster
  multichannel business.


       ANNUAL REPORT 2011                                                                                                              31
Continental Europe


Portugal                                                            Poland
Santander Totta contributed an attributable profit of EUR           Bank Zachodni WBK posted an attributable profit of EUR
174 million, 61.8% less than in 2010.                               232 million in the last three quarters of 2011.
The Bank’s gross income declined 18.3% due to the reduction in      Santander conducts its retail banking business in Poland through
net interest income, caused by the increase in funding costs        Bank Zachodni WBK, which has the country’s third largest
from greater competition in capturing deposits, and the drop in     distribution network (622 branches, including 96 agencies),
business. Operating expenses fell 2.1%. Santander Totta’s non-      2.4 million customers and more than EUR 20,000 million of
performing loan ratio (4.06%) was below the sector’s average.       loans and deposits. Grupo Santander also carries out consumer
Provisions rose 87.7%, due to prudent management in an              finance business through Santander Consumer Bank Poland.
unfavourable environment.
                                                                    Bank Zachodni WBK has been part of Grupo Santander since
Following Portugal’s financial rescue, the authorities asked        April 1, 2011, consolidating the results and business
Portuguese banks to implement various adjustment measures to        corresponding to the last three quarters of the year. In an
reduce their leverage, increase their capital and reduce recourse   environment of strong economic growth and banking business,
to the European Central Bank (ECB). Santander Totta is              at rates of close to 10%, its profits grew at an annual rate 22%,
progressing in this process:                                        thanks to robust revenues.
• The focus on capturing deposits (+8% to EUR 23,465 million),      Bank Zachodni WBK’s net lending to customers amounted to
  coupled with the fall in lending (-6% to EUR 28,403 million) is   EUR 8,479 million and deposits to EUR 10,359 million. Loans
  reducing the commercial gap.                                      and deposits rose 14% in the first nine months under Santander
                                                                    management, due to growth with companies as well as
• Santander Totta increased its core capital ratio to 11.2% and
                                                                    individuals. The efficiency ratio was 47.0% and the non-
  remained the most solvent bank in the country and with the
                                                                    performing loan ratio 4.89%.
  best rating.
• The level of exposure to the ECB was also reduced (to 3.8%        Bank Zachodni WBK’s business model fits perfectly into Grupo
  of assets at the end of 2011).                                    Santander’s commercial banking model: focus on retail customer
                                                                    and company, supplemented by a notable presence in asset
The magazines The Banker, Euromoney and Global Finance              management business and brokerage of securities and leasing.
chose Santander Totta as the best bank in Portugal.                 This bank offers a significant potential in results in the coming
                                                                    years, both through business as well as from the synergies from its
     Medium- and long-term objectives                               integration into the Group’s IT platform.
• Improve the revenue structure with greater recurrence.
                                                                         Medium- and long-term objectives
• Reach an efficiency ratio of below 50% in 2013.
                                                                    • Double-digit growth in gross income.
• Continue to reduce the commercial gap in line with the Bank
  of Portugal’s requirement (43% of this amount already             • Efficiency ratio of between 41% and 43%.
  attained).                                                        • Gain market share.
                                                                    • Consolidation as one of Poland’s three main banks in terms of
                                                                      profits, efficiency, solvency and customer service.


Santander Totta branch in Lisbon, Portugal                          Bank Zachodni WBK branch in Poland


32                                                                                                              INFORME REPORT 2011
                                                                                                                ANNUAL ANUAL
Santander Consumer Finance                                                                   Germany, the United States and other countries
Santander Consumer Finance generated a record                                                Santander has 303 branches in Germany, EUR 30,403 million of
attributable profit of EUR 1,228 million, 51.5% more than                                    loans, EUR 31,174 million of deposits and more than 7 million
in 2010.                                                                                     customers. Santander is the market leader in consumer finance
                                                                                             and the second in auto finance in Germany. Since January 2011,
Santander carries out its consumer finance business in 13                                    it has a retail banking unit. Its profit increased 10.0% in 2011,
European countries, notably Germany, and also in the US. The                                 with significant growth in loans and an improvement in credit risk.
business model is based on offering financial solutions through
more than 135,000 distributors (auto concessionaires and                                     Santander Consumer USA’s profit surged 99.2% in dollars to
shops). Once a relation is started with a customer, direct                                   EUR 484 million, spurred by the increase in managed credit
commercial actions are taken to link them and make them loyal.                               volumes, the rise in revenues from managing third party portfolios
With a business centred on auto finance, Santander Consumer                                  and a lower cost of credit. The entry of new partners into the
Finance has signed 37 agreements with nine car producers in                                  capital was announced in September, which valued the unit
the last three years. SCF also has other products such as                                    at $4,000 million.
personal loans, credit for buying consumer durables and credit
cards.                                                                                       The rest of countries also produced positive results, particularly:
                                                                                             • Nordic countries (+14.5% in profits in local currency).
Results and activity in 2011
In a globally unfavourable economic environment, gross lending                               • UK (+38.1% in sterling)
stood at EUR 62,959 million, 16% (*) more than in 2010, thanks                               • Spain, with a positive result in a very weak market.
to organic growth and the incorporation in Germany. Deposits                                 • Santander Consumer Bank Poland almost doubled its profits.
rose 28% to EUR 33,198 million (Germany accounted for 94%).
Gross income increased 14.0% (+13.6% net interest income and                                       Medium- and long-term objectives
+18.0% net fee income).
                                                                                             • Maintain high profitability.
Santander Consumer Finance has the best efficiency ratio                                     • Consolidate the Top 3 position in key markets.
(31.8%) and return on assets compared to its main competitors.                               • Strengthen leadership in the reference financial entity model
The non-performing loan ratio continued to decline to 3.77%.                                   for car producers.
(*) Isolating Santander Consumer USA which consolidated by the equity accounted method in    • Maintain leadership in efficiency and reinforce specialization
December 2011.
                                                                                               in payments and recoveries.


 Lending by countries                                                                        Lending by segments
 %                                                                                           %

                                                  Germany 48%                                                                       Cars – new 25%
                                                                                                           Credit
                                                                                                            cards
     Netherlands 2%                                                                                          2%
          Austria 2%                                                                                                                              Cars- second hand 22%
                                                                                             Stock Finance 5%
        Portugal 2%

                    UK 6%                                                                          Other 7%
                                                                        Spain 12%

                    Poland 5%                                                                Electrical household
                                                                                                  appliances 5%
                                                                                                                                             Direct businesses 17%
             Nordic countries 11%                         Italy 12%                                                 Mortgages 17%


                                                       Santander                                       B. Zachodni            Santander                            Total
 Continental Europe                               Branch Network                Banesto     Portugal          WBK       Consumer Finance         Rest
Customers (million)                                               9.6                 2.4        2.0          2.4                     15.5       0.1               32.0
Branches (number)                                              2,915               1,714         716          526                     647            90        6,608
Employees (number)                                           18,704                9,548      6,091         9,383                   15,610     4,530          63,866
Customer loans on the balance sheet(*)                     102,643               68,850      28,403         8,479                   60,276    46,429         315,081
Managed customer funds(*)                                  107,469               82,444      31,188        12,383                   39,008    61,571         334,064
                            ( )
Net operating income *                                         2,353               1,112         443          366                    3,604       857           8,735
Attributable profit(*)                                           660                 130         174          232                    1,228       424           2,849
Efficiency (%)                                                  46.5                 47.4      54.4          47.0                     31.8      54.6               43.1

(*) Million euros


         ANNUAL REPORT 2011                                                                                                                                           33
United Kingdom


                                                        Results
                                                        Santander UK carried out is activity in 2011 in an environment
     Santander UK’s attributable profit was             of low economic growth, interest rates at minimums and
     EUR 1,145 million.                                 substantial regulatory uncertainty.
                                                        Profit was EUR 1,145 million, after constituting a £538 million
     The Bank has 1,379 branches, which                 fund for possible payment protection insurance remediation
     tend to 27 million customers, and is the           (PPI). This measure was also taken by the other main UK banks,
     third largest bank in the UK by retail             although in the case of Santander UK the amount was relatively
                                                        less than that announced by its competitors.
     deposits and mortgages.
                                                        Gross income was EUR 5,678 million, pressured downward by
                                                        market circumstances such as the new regulations for liquidity
         The Bank has a comfortable position in         and the increased cost of funding, as well as low interest rates.
         liquidity and high levels of capitalization.
                                                        Net operating income after provisions was EUR 2,538 million,
         It granted one out of every six mortgages      8.4% less than in 2010 in local currency.
         in the UK and increased its market share in
         lending to SMEs by a full percentage point.    Loan-loss provisions were 36.3% lower than in 2010. The non-
         It is committed to quality of service: it      performing loan ratio (1.86%) evolved better than expected in
                                                        the current economic environment and all products for
         repatriated its call centres to the UK and
                                                        individuals, particularly mortgages and personal loans,
         created 1,100 jobs to improve customer
                                                        improved.
         attention.
         Santander UK was recognized by The Banker      Santander UK has a comfortable liquidity position and high
         magazine as the best bank in the UK for the    levels of capitalisation. The loan-to-deposit ratio was 130%
         third year running.                            at the end of 2011.

         Its goal is to become the most efficient and
         profitable bank in the UK in 2014.


                                                        United Kingdom

                                                        Customers (million)                                           26.7
                                                        Branches (number)                                            1,379
                                                        Employees (number)                                          26,295
                                                        Customer loans(*)                                          252,154
                                                        Managed customer funds(*)                                  288,826
                                                        Net operating income(*)                                      3,123
                                                        Attributable profit(*)                                       1,145
                                                        Efficiency (%)                                                45.0
                                                        ( ) Million euros
                                                         *


34                                                                                                 ANNUAL REPORT 2011
Santander branch in London, United Kingdom

Commercial activity                                                                                     Strategy
Despite the difficult environment, Santander UK continued to                                            Santander UK’s strategy is aimed at transforming the bank into a
support business with households and companies. The Bank                                                more diversified financial franchise, capable of providing all kinds
granted one out of every six mortgages in 2011, which                                                   of services and focused on the customer, via:
represented a market share in new lending higher than
                                                                                                        • Boosting customer linkage, moving from a model centred on
Santander UK’s total mortgage share (14%). The customer
                                                                                                          products to one focused on the customer.
spread improved, while these new loans had a very conservative
loan-to-value of only 65%.                                                                              • Strengthen business with companies. The integration of the
                                                                                                          318 branches acquired from Royal Bank of Scotland will raise
New loans to SMEs grew 25% to more than £2,000 million and                                                by five percentage points the market share of company
surpassed the targets set by the UK government. The market                                                business.
share in this segment rose by almost one percentage point to
4.3%. At the end of the year, Santander UK launched                                                     • Maintain high operational efficiency and improve the quality
Breakthrough, a new initiative for further promoting loans to                                             of service. Santander UK will invest £490 million in its IT
SMEs and which makes available to this type of customer a                                                 platform.
programme of full support, with training, tutorials, international
experience and practices.                                                                                   Medium- and long-term objectives
                                                                                                        Santander UK wants to be the most efficient and profitable
During 2011 836,000 current accounts were opened as a                                                   bank in the UK in 2014 with:
result of the focus on capturing and linking new and existing
customers. Within this strategy, more than 100,000 123                                                  • An efficiency ratio of below 44%.
Cashback credit cards, which return money to customers on                                               • Revenue growth of between 15% and 20% a year in
the basis of usage, were sold in the first two months after                                               company banking.
the launch.
                                                                                                        • The system’s lowest non-performing loan ratio.
In July 2011, Santander UK repatriated its call centres to the UK
from India. As a result, 1,100 jobs were created and the building
of a new corporate centre in Leicester was announced, all of it in
order to enhance customer service.


 Attributable profit                                                                                     Net operating income
 Million euros                                                                                           Million euros

- 41.7%(*)            2011/2010                                                                         - 16.4%(*)        2011/2010
                                                                                                                                                         3,735
                                                        1,965


                                                                     1,145


                                                                                                                                                                    3,123


                                                 2010           2011(1)                                                                         2010             2011

(1) Affected by the provision in the second quarter of 2011 for possible payment protection insurance   (*) Excluding the exchange-rate impact: -15.4%
    remediation (PPI).
( ) Excluding the exchange-rate impact: -41.0%
*


          ANNUAL REPORT 2011                                                                                                                                                   35
Latin America


                                                           Brazil
                                                           The attributable profit of EUR 2,610 million accounted for
     Latin America contributed 51% of the                  28% of the global total. Brazil is a strategic market for the
     Group’s profits and is one of Santander’s             Group.
     main growth commitments. The Group
                                                           Santander Brazil is the country’s third largest private sector
     has leadership positions in the most                  bank in terms of assets, with 3,775 branches and points of
     dynamic and solid economies such as                   attention, 18,419 ATMs and 25.3 million customers. In
     Brazil, Mexico, Chile and Argentina,                  2011, technology integration and brand unification was
                                                           completed with Banco Real.
     through 6,046 branches, which serve
     42 million customers.                                 The Brazilian economy, the world’s sixth largest, continued to
                                                           provide a favourable environment for the Group’s business. GDP
                                                           grew around 3% and growth of 3-4% is expected to be
         Latin America’s profit of EUR 4,664 million was   maintained in the next few years.
         0.1% higher than in 2010 in constant currency.
                                                           The country has big investment and infrastructure plans, partly
         The Group’s lending continued to grow             due to holding the 2014 World Football Cup and the 2016
         (+18%).                                           Olympic Games.
         Santander Brazil posted an attributable profit
                                                           In this scenario, the financial sector grew strongly (+18% in
         of EUR 2,610 million.
                                                           loans) and is expected to continue to do so on a sustained basis
         Santander Mexico increased its profit 45.6% in    in the coming years, thanks to the rise in the size of the middle
         pesos, spurred by strong lending and deposits.    class and in the country’s “bankarisation” levels.
         The magazine The Banker recognized
         Santander Chile as the bank of the year and
         the safest one in Latin America by Global
         Finance.
         Argentina’s attributable profit was 8.0% higher
         in local currency (+24.7% in gross income).


                                                           Santander branch in Brazil


36                                                                                                    ANNUAL REPORT 2011
Banco Santander branch in Brazil

Activity and results                                                                   Strategy
Santander Brazil’s attributable profit of EUR 2,610 million was                        Technology integration and brand unification with Banco Real
7.3% lower in local currency. Gross income rose 11.2% and                              was completed successfully in 2011 and now, with an optimum
operating expenses 12.3%, due to investments in the new IT                             commercial banking platform and a wider range of products
platform and the opening of 154 branches in 2011, coupled                              and services, Santander Brazil is best placed to carry out its
with inflationary pressure and wage agreements. Net operating                          business.
income increased 10.6%. Provisions were 21.4% higher due to
the moderate rise in the non-performing loan ratio (5.38%).                            The Bank’s structure in Brazil is difficult for its international
                                                                                       competitors to replicate as it has latest generation technology,
Lending grew 20%, spurred by the 23% rise to individual                                distribution networks with sufficient capacity to guarantee
customers and the 26% growth to SMEs and companies.                                    attention throughout the country and a good brand positioning.
Bank savings, including financial letters, increased 8% (+30%
                                                                                       Its strategy is based on the following pillars:
time deposits). Santander Brazil has a 10.5% market share in
loans (11.7% for unrestricted credit) and 7.9% in deposits.                            • Be the best bank in quality of service, backed by the strength
                                                                                         of its IT platform.
                                                                                       • Intensify relations with customers with the opening of 100 to
                                                                                         120 branches a year between 2011 and 2013.
                                                                                       • Strengthen businesses in the key segments such as SMEs,
                                                                                         acquiring business (point-of-sale terminals in shops), cards
                                                                                         (association agreements were signed with Shell and other
                                                                                         companies, and the offer to non-customers was stepped up),
                                                                                         real estate and consumer loans, particularly auto finance.
 Attributable profit                       Net operating income                        • Continue to construct and strengthen the Santander brand.
 Million euros                             Million euros
                                                                                       • Maintain strong growth combined with prudent risk
-7.2% (*)    2011/2010                     +10.6% (*) 2011/2010                          management.
                                                                           9,963
                 2,814


                                                                                           Medium- and long-term objectives
                                                            9,007
                                2,610


                                                                                       Santander Brazil aims to become the best universal bank in the
                                                                                       country, the most efficient in generating shareholder value and
                                                                                       the best in customer and employee satisfaction. In 2012-2013
                                                                                       Santander expects:
                                                                                       • 15% growth in profits.
           2010          2011                         2010          2011               • 15%-17% rise in lending.
(*) Excluding exchange-rate impact:-7.3%   (*)Excluding exchange-rate impact: +10.5%


       ANNUAL REPORT 2011                                                                                                                             37
Santander Select branch in Mexico                                  Santander branch in Chile


Mexico                                                             Chile
Santander Mexico’s attributable profit increased 45.6% in          Santander Chile posted an attributable profit of EUR 611
local currency to EUR 936 million and contributed 10% of           million, 9.3% less in pesos and 7% of the Group’s total.
total profits.
                                                                   With 499 branches and 3.5 million customers, Santander is
Santander is the third largest bank in the country with more       Chile’s main bank in terms of assets and profits. It has a market
than 9 million customers, 1,125 branches and a market share        share of 19.7% in loans and 17.3% in savings.
of 15.2% in banking business.
                                                                   Gross income rose 1.9% in local currency, with fee income up
Gross income rose 4.5% (+7.5% in net interest income), in line     2.4%. Operating expenses were 10.1% higher and loan-loss
with the recovery in commercial business. Operating expenses       provisions 17.3%.
rose 11.6% due to the increase in installed capacity, while
provisions declined 25.7% in line with the improvement in the      Lending increased 7% and bank savings 11% (+29% in time
Bank’s risk premium.                                               deposits).

Lending increased 31%, partly driven by acquiring the mortgage     Santander Chile’s strategy is aimed at boosting the profitability of
business of GE Capital Corporation (+22% on a like-for-like        various businesses, particularly through loans to and savings from
basis). Bank savings grew 8%.                                      individuals and SMEs, with the emphasis on deposits to reinforce
                                                                   the liquidity position. The improvement in the quality of service
Santander Mexico took advantage of the favourable economic         remains a priority for increasing linkage and transactions.
situation to strengthen customer linkage and deepen it in high
value segments (high income customers and SMEs), while             In December 2011, Grupo Santander sold 7.82% of Banco
remaining prudent in risks and efficient in management of costs.   Santander Chile as part of its plans to increase the Group’s core
                                                                   capital ratio. The $950 million operation was one of the largest
The magazine Global Finance recognized Santander Mexico as         so far in the local market. Santander now owns 67% of the
the safest bank.                                                   bank.
                                                                   The magazine The Banker recognized Santander Chile as the
   Medium- and long-term objectives
                                                                   bank of the year in Chile.
• Continue to implement the strategic plan to become a
  universal bank (commercial and investment).
                                                                       Medium-and long-term objectives
• Maintain double-digit profit growth.                             Santander Chile wants to push its commercial banking business,
• Achieve strong growth in business with SMEs, companies,          particularly for medium-high income customers and SMEs,
  real estate loans, consumer credit and insurance.                control costs and maintain a conservative risk policy for 2011-
                                                                   2013:
• Double-digit growth in net operating income with good
  efficiency ratios.                                               • Achieve double-digit growth in gross income.
                                                                   • Improve the efficiency ratio to 35%-37%.


38                                                                                                              ANNUAL REPORT 2011
Santander Río branch in Argentina                                        Santander branch in Puerto Rico


Argentina                                                                Other countries
The Bank generated an attributable profit of EUR 287                     Uruguay
million, 8% more in local currency.                                      Santander Uruguay is the main private sector bank by profits,
                                                                         business and branches, with market shares of 18.6% in loans
Santander Río is the country’s largest private sector bank in
                                                                         and 16.0% in savings and 78 branches. Its strategy in 2011
terms of assets and profits, with a market share of 8.9% in loans
                                                                         centred on driving retail business through new products and
and 10.1% in bank savings. It has 358 branches which tend to
                                                                         channels and increasing business with companies. Profit was
2.5 million individual customers and more than 125,000 SME
                                                                         69.9% less in local currency at EUR 20 million.
and company clients.
                                                                         Puerto Rico
In an environment of high growth, mainly fuelled by internal
                                                                         Santander is one of the main banks in Puerto Rico. It has 121
consumption and high employment, gross income increased
                                                                         branches and market shares of 10.2% in loans, 11.8% in
24.7%, largely due to fee income (+32.6%).
                                                                         deposits and 21.6% in mutual funds. In the context of
The strategy is aimed at capturing and linking the largest               recession, its attributable profit was EUR 34 million, 5.6% lower
number of customers through a multichannel commercial                    in dollars. The Bank was recognized for the fifth year running as
network. Santander Río increased its network by 10% in 2011.             the best in Puerto Rico by Global Finance and for the sixth
This expansion largely took place in the interior of the country         straight year by The Banker.
and within what the Bank considers its strategic corridor: high-
income regions, with strong growth prospects and strong trade            Peru
links with Brazil.                                                       Attributable profit was EUR 11 million, up from EUR 7 million in
                                                                         2010. Business centres on companies and the Group’s global
The magazines The Banker, Euromoney and Global Finance                   clients.
named Santander Río as the best bank in Argentina.
                                                                         Colombia
                                                                         At the end of 2011, Santander reached agreement to sell its
    Medium- and long-term objectives
                                                                         units and businesses in Colombia to the Chilean group
• Improve efficiency through investments in technology and               CorpBanca for $1,225 million. The transaction will become
  management of costs.                                                   effective in 2012. This business did not reach a sufficient critical
• Maintain high levels of profitability through leadership in            mass for the full development of Santander’s retail banking in
  transactional banking, and credit and savings growth.                  the country. Colombia contributed EUR 58 million of attributable
                                                                         profit.


 Latin America                        Brazil   Mexico      Chile      Argentina    Uruguay      Colombia Puerto Rico   Peru   Rest     Total

Customers (million)                    25.3        9.3          3.5        2.5          0.2          0.3      0.5       0.1     0.1     41.7
Branches (number)                     3,775     1,125           499       358            78           80     121         1       9     6,046
Employees (number)                   54,265    13,162     12,089        6,777        1,206        1,515    1,764        48    1,061   91,887
Customer loans*                      78,408    18,185     25,709        4,787        1,452        2,213    4,335       538    4,240 139,867
Managed customer funds*             135,859    32,214     31,908        6,639        2,742        4,253    9,886       483    9,264 233,248
Net operating income*                 9,963     1,387      1,264          472            40           91     169        14     132    13,533
Attributable profit*                  2,610       936           611       287            20           58      34        11      98     4,664
Efficiency (%)                         37.5      41.8       39.2         49.0         76.5         56.2     50.9       34.8    64.5     39.7

(*) Million euros


        ANNUAL REPORT 2011                                                                                                                 39
United States-Sovereign


                                                                     Sovereign’s profit was 30.3% higher in dollars than in 2010.
                                                                     These results were supported by solid revenues (+9.2%) thanks
      Sovereign’s profit amounted to EUR 526                         to optimum management of volumes and prices. The 9.5%
      million in 2011.                                               growth in costs reflects the investment in technology and the
                                                                     strengthening of commercial structures. The efficiency ratio
                                                                     was 44.6%.
              Sovereign has 723 branches, 2,303 ATMs and
              8,968 employees serving 1.7 million                    Sovereign’s risk quality continued to improve. Its non-
              customers. Its headquarters are in Boston and          performing loan ratio dropped to 2.85% and coverage rose
              its business concentrated in the northeast of          to 96%.
              the US.
                                                                     Lending grew 6%. This growth was funded by a 12% rise in
              In order to respond to the requirements of US          deposits, which ensured the diversification and stability of the
              supervisors, a structure was created that              bank’s financing sources.
              groups together the various units in the
              country under the name of Santander US.                    Medium- and long-term objectives
              Sovereign received approval from the US                After completing the first phase of the restructuring (2009-
              federal regulator to become a national bank,           2011), Sovereign focused on relaunching itself as a commercial
              enabling it to tend to new customer segments           universal bank. Three main objectives were set for the next two
              and strengthen its competitive position.               years:
                                                                     • Implement the Group’s IT platform.
                                                                     • Launch a range of products and services that satisfy the needs
                                                                       of the various customer profiles (cards, investment products,
                                                                       treasury management services, insurance and trade finance).
                                                                     • Positioning in the segment of medium and large companies,
                                                                       a business where Santander’s capacities and global reach can
                                                                       be best exploited.
                                                                                                    ***
                                                                     Attributable profit generated by all Grupo Santander’s units in
                                                                     the US (Sovereign Bank, Santander Consumer USA, Santander
                                                                     Private Banking USA, Puerto Rico and the New York branch)
                                                                     was EUR 1,059 million.


 United States-Sovereign

Customers (million)                                            1.7
Branches (number)                                             723
Employees (number)                                        8,968
Customer loans(*)                                        40,194
Managed customer funds(*)                                40,812
                         ( )
Net operating income *                                    1,212
Attributable profit(*)                                        526
Efficiency (%)                                                44.6
( )
* Million euros

                                                                     Sovereign branch in the United States.


40                                                                                                               ANNUAL REPORT 2011
Global businesses


Global Wholesale Banking                                               Large operations in 2011
Santander Global Banking & Markets posted a profit of
                                                                       • Santander participated as co-manager in the listing of the
EUR 1,872 million (-23.0%). It is the global business unit
                                                                         Swiss company Glencore, the world’s largest raw materials
responsible for satisfying customers’ needs which, because
                                                                         company. It was the biggest listing ever in Europe.
of their size, complexity and sophistication, require tailored
wholesale services or products of higher value-added.                  • Schneider Electric acquired from Abengoa 40% of Telvent.
The unit operates in 22 countries and has local and global               Santander was the advisor for the operation and of the
teams (2,722 professionals) with wide knowledge of                       subsequent takeover bid for the rest of the capital.
financial markets, and who cover all financing, lending and
                                                                       • SabMiller, the world’s second largest beer group by sales
coverage needs.
                                                                         volume, acquired the Australian beer company Foster’s.
Santander Global Banking & Markets’ profit was lower in 2011             Santander was the book runner in the loan for a total of
because of the higher cost of funding, due to tensions in                $12,500 million.
European sovereign debt markets and the reduced activity in the        • Santander advised Iberdrola (Spain), Sempra Energy (US),
business areas of markets, as a result of their instability.             Empresas Públicas de Medellín (Colombia) and Pampa Energía
                                                                         (Argentina) on buying seven electricity distribution companies
Revenues generated by client business accounted for 87% of
                                                                         in Brazil, Chile, Peru, Panama, Guatemala and Argentina from
total revenues and within them those generated within the
                                                                         AEI Energy (US).
global relationship model, which includes 759 large
international corporations, 186 global sphere banks and 199
                                                                            Medium- and long-term objectives
financial sponsors, performed well.
                                                                       • Increase the market share in products with low capital and
Strategy in 2011                                                         liquidity consumption.
Santander Global Banking & Markets maintained the main pillars         • Create units in Sovereign and Bank Zachodni WBK.
of its business model centred on the client, reducing risk and
freeing up capital and liquidity.
In 2011, it continued to invest in resources and additional
capacities to develop projects, aimed at strengthening
operational capacities and distributing basic treasury products,
with a particular focus on forex and fixed-income business.
This effort had its first results in businesses such as fixed-income
distribution to companies in Europe. The generation of recurring
revenues and strict management of costs are enabling
Santander Global Banking & Markets to absorb these
investments and have an efficiency ratio of 35.1%, still the
reference among our competitors.


Global Wholesale Banking                                               Attributable profit
Million euros                                                          Million euros
Customer loans                                                81,000   -23.0%    2011-2010
                                                                                                     2,432


Customer deposits                                             75,134
Net operating income                                           3,032
                                                                                                                1,872


Attributable profit                                            1,872
Efficiency (%)                                                  35.1


                                                                                                 2010        2011


      ANNUAL REPORT 2011                                                                                                              41
Asset Management                                                      Global Private Banking
Santander Asset Management integrates the Group’s asset               This business includes the entities dedicated to financial
management business, offering a wide range of savings                 advice and wealth management for the Group’s high-
and investment products which cover customers’ different              income customers.
needs and which are distributed globally by all the
                                                                      It carries out business through:
commercial networks.
                                                                      • Banif in Spain.
Its activity is organized around three business areas:
                                                                      • Santander Private Banking in Latin America, the UK and Italy.
• Santander Asset Management for mutual and pension funds,
  companies and discretional portfolios.                              There are also domestic private banking units in Portugal and
                                                                      Latin America, which are managed on a shared basis with local
• Santander Real Estate, specialized in managing real estate
                                                                      commercial banks.
  investment products.
• Santander Private Equity for venture capital.                       Despite the negative impact of the markets, managed assets
                                                                      have increased since 2010, backed by the creation of new
In 2011, Santander Asset Management advanced in developing            business and the increase in the customer base. The volume of
its global business model for identifying synergies between           assets under management stood at EUR 101,411 million, 4%
countries and thereby increasing the value added for customers.       more than in 2010, and attributable profit was EUR 279 million.
It strengthened its global investment management capacities
and created dedicated teams, took advantage of product                Global Private Banking continued to further adapt and
synergies through the range of Luxembourg funds and                   implement a corporate business model and a common IT
reinforced the relationship models with the distribution and          platform in the countries where it operates.
customer networks.
                                                                      All of this enhances the quality of customer service, enables
The global management capacities and local knowledge of               Santander to align portfolios with objectives and the value offer
countries enables customer service to be improved and assume          of all the units and obtain synergies.
medium and long-term objectives, such as entering new
countries and accessing institutional business.                       Santander aims to become the reference private bank in the
                                                                      main markets where it operates, with a sustained increase in
Over the next few years, Santander will focus on further              managed assets.
developing a global investment proposal and operational
platforms and common risks; have a selective presence in
institutional markets; develop products based on customer
segmentation; create a global team of selection of third party
products and develop a new relationship model with
commercial networks.


Asset Management                                                      Global Private Banking
Million euros                                                         Million euros
Assets under management                                   112,256     Assets under management                                   101,411
Gross income                                                   289    Gross income                                                    816
Attributable profit                                              53   Attributable profit                                             279
Efficiency (%)                                                 56.4   Efficiency (%)                                                  50.9


42                                                                                                               ANNUAL REPORT 2011
Insurance                                                               Means of Payment
Santander Insurance develops products for protection and                Santander Cards covers all businesses related to means of
household savings, which are distributed through the                    payment and offers customers credit and debit cards. It also
Group’s branches and alternative channels such as the                   provides services for capturing and processing payments in
telephone and Internet. It has 15 million customers.                    shops. The unit currently manages 92 million cards and
                                                                        operates in 16 countries.
Insurance generated total revenues for the Group (gross income
plus fee income received by the commercial networks) of EUR             The unit is geographically diverse and is integrated into each
3,083 million, 14.7% more than in 2010.                                 country’s commercial banking strategy. Its global strategy enables
                                                                        best practices to be incorporated and business innovation and
Activity in 2011 concentrated on:                                       creativity in accordance with the local features of markets. An
• Strengthening the range of products through selective                 example of this is the Santander Ferrari card, which is issued in
  agreements with insurance leaders.                                    Spain, Portugal, Germany, Mexico and Brazil and has more than
                                                                        370,000 customers.
• Driving the Group’s strategy in financial savings management,
  through competitive savings insurance.                                The most noteworthy strategies of Santander Cards in 2011 were:
• Develop Santander own model for distribution of auto
                                                                        • In Brazil, customer linkage and alliances with partners such as
  insurance in Spain and Latin America.
                                                                          Shell and Vivo, and positioning in acquiring business.
• Install the corporate model of insurance in Poland.
                                                                        • In the rest of Latin America, continued leadership in and
Banco Santander and the insurer Zurich agreed to form a                   development of cards business. In Mexico, alliances with large
strategic alliance to develop bancassurance business in Brazil,           companies to offer the Fiesta Rewards card, and segmented
Chile, Mexico, Argentina and Uruguay. The aim is to increase              products such as the Black Unlimited card. In Chile, business
significantly the revenues from distribution of insurance                 with retails was deepened and programmes with Lan and
products in these countries. This operation produced capital              Movistar were renegotiated.
gains of EUR 641 million.                                               • In the UK, the Santander 123 Cashback card was launched,
                                                                          which returns to customers part of their spending.
Looking ahead, the Santander Insurance model will progress
from selling products to providing integral protection for              • In Spain and Portugal, continued growth thanks to the
customers, supported by segmentation based on the customer                development of means of payment campaigns.
and not on the products.                                                • In the US, the debit card with the global Santander design
                                                                          was incorporated and positioning with innovative promotion
                                                                          campaigns.
                                                                        • In Poland, the unit’s business model was installed.
                                                                        Santander Cards expects to obtain strong growth in net revenues
                                                                        after provisions with a differentiated strategy in its main markets.


Insurance                                                                Means of payment1
Million euros

Contribution to the Group: pre-tax profit+fee income         2,882      Total number of credit cards (million)                                                         29

Gross income                                                      799   Total number of debit cards (million)                                                          63

Attributable profit                                               366   Lending (million euros)                                                                     14,989
                                                                        Gross income (million euros)                                                                 4,115
                                                                        1. Perimeter of retail banks excluding Banesto, Santander Consumer Finance and Open Bank.


      ANNUAL REPORT 2011                                                                                                                                                43
Sustainability


                                                                                 Santander Universities global division
                                                                                 Investment in higher education is the centrepiece of the Bank’s
 Sustainability, for Banco Santander, means                                      corporate social responsibility strategy, as it is convinced that
 contributing through its activity to                                            this is the best way to contribute to the economic and social
 economic and social progress in the                                             development of the countries in which it operates.
 communities where it operates and taking                                        The global division, with a team of 2,187 professionals in
 into account the impact of its business on                                      17 countries, coordinates and manages Banco Santander’s
 the environment and fostering stable                                            commitment to higher education. Its long-term alliance with
                                                                                 universities forged over the last 15 years is unique in the world.
 relations with its stakeholders.                                                Banco Santander’s contribution to co-operation projects with
                                                                                 universities amounted to more than EUR 110 million in 2011.
         Banco Santander’s sustainability strategy revolves
         around three main elements:                                             Santander co-operates with universities in launching projects to
         – Support for higher education.                                         improve education, internationalisation, geographic mobility,
                                                                                 innovation and the transfer of knowledge to society. The Bank
         – Protecting the environment
                                                                                 has agreements with universities in Spain, Germany, Portugal,
         – Supporting local communities.                                         the UK, Brazil, Mexico, Chile, Argentina, Colombia, Peru,
         Santander has stable and lasting relations with                         Singapore, Puerto Rico, Uruguay, Poland, the United States,
         its shareholders and investors, customers,                              China and Russia.
         employees, suppliers and society on general.
                                                                                 Banco Santander’s co-operation with universities revolves
         In 2011, Santander invested more than EUR 160                           around the following four pillars:
         million in corporate social responsibility projects:
         70% in universities, 18% in the community and                           • Integral cooperation agreements, which put into effect in
         the environment and 12% in art and culture.                               2011 4,455 academic, financial and technological projects
                                                                                   with universities.
         During 2011, the sustainability committee,
         headed by the CEO, promoted, among others,                              • Support for international co-operation programmes between
         strategic corporate volunteering projects,                                universities, such as national and international travel
         financial education, microcredit’s and energy                             programmes for students and teachers.
         efficiency.                                                             • Fostering co-operation with international academic networks,
         The Santander share forms part of the DJSI and                            such as the Latin American University Network for the
                                                                                   Incubation of Companies (Red Emprendia).
         FTSE4Good sustainable investment indices.
                                                                                 • Supporting global projects, such as Universia, the largest
                                                                                   online network of university co-operation in the Spanish-
                                                                                   and Portuguese-speaking world, and the Miguel de Cervantes
                                                                                   Virtual Library, the portal with the largest digitalisation of
                                                                                   Hispanic culture.
     International initiatives in which
     Banco Santander joined or participated in

 UN Global Compact
 UNEP Finance Initiative
 Equator principles
 State council of the Spanish government for social responsibility in business
 Carbon disclosure project
 Forge Group
 Brazilian Institute of Governance                                               The Bank’s main corporate social responsibility activities
 Roundtable on Responsible Soy Association                                       are set out in the Sustainability Report, which can be
 Wolfsberg Group                                                                 consulted at www.santander.com
 Banking & Environment Initiative
 Principles for Responsible Investment (PRI)


44                                                                                                                           ANNUAL REPORT 2011
Emilio Botín with Shirley M Tilghman, president of Princeton University   Delivery of international scholarships at the University of Salamanca, Spain

Santander Universities in 2011
The main developments in 2011 were:
• New scholarship programmes were launched to facilitate                          990 co-operation agreements with
  graduates finding their first job, foster the international                     universities in 17 countries on four
  mobility of young doctoral students and researchers and
  strengthen the exchange of students between Asia and Latin                      continents.
  America.
• Launch of the Santander Latin America scholarship                               5.4 million intelligent university cards in
  programmes, presented at the Second Meeting of University                       250 universities.
  Rectors in Guadalajara, Mexico, in June 2010.
• Development of a youth employment plan in Spain, through                        21,000 scholarships and aid for
  5,000 grants for internships in SMEs.
                                                                                  study granted in 2011.
• The international programme for the incubation of companies
  was launched, as well as the entrepreneurial indicators and
  scholarships of the Red Emprendia.
                                                                                  1,232 universities grouped in
• The Santander Universities programme in Germany and
                                                                                  Universia.
  Poland was started, and consolidated in the UK and the US.
• Reinforcing the social recognition of Santander’s commitment
                                                                                  330,000 first jobs via Universia.
  to universities and launch of the ONE THOUSAND programme
  in Argentina, Brazil, Chile, Mexico, the UK, the US, Portugal,
  Puerto Rico and Uruguay.
• The I3C project to disseminate science in Spanish and launch
  of the financial education and culture programme.
In 2012, Santander Universities will strengthen dissemination of
its commitment to universities to all society. It will put into effect
new Santander scholarship programmes for students studying
for a bachelor’s degree and scholarships for young researchers.
Moreover, it will launch new scholarship programmes to foster
international travel by young postgraduate students and
researchers and boost the exchange of students between Asia
and Latin America, in accordance with the commitment made at
the second meeting of Universia rectors.


 Growth in co-operation agreements with universities                       Growth in co-operation projects
 Number                                                                    Number
                                                       990


                                                                                                                                     4,455
                                             938


                                                                                                                          4,149
                                    833


                                                                                                               3,340


                               2009       2010     2011                                                  2009          2010       2011


       ANNUAL REPORT 2011                                                                                                                                45
Corporate volunteering in Chile                                     Olive trees at Grupo Santander City

Social actions                                                      The environment
Banco Santander developed programmes that support local             Banco Santander’s management of the environment is a central
communities through initiatives in various countries. In order to   part of the Group’s sustainability plan. The Bank fosters the
put them into effect, Santander operates in co-operation with       protection, conservation and recovery of the environment and,
NGOs and other non-profit making organisations with whom it         particularly, the fight against climate change.
has a close and fluid dialogue.
                                                                    The Bank’s actions in this sphere revolve around the following
The main lines of action are:                                       lines of work:
• Children’s education. Banco Santander supports projects           • Measurement, control and monitoring of items consumed
  and initiatives that promote children’s education in those          and emissions from the Bank’s installations worldwide
  countries where the Group operates. The objective, in line          through its environmental footprint. Of note is the launch of
  with the UN’s Millennium Development Goals, is to contribute        the 2011-2013 energy efficient plan with global objectives to
  to universal education. Volunteers throughout the Group             reduce electricity consumption and C02 emissions.
  participated in various initiatives launched by the human
  resources division to support the UNICEF project “Todos los       • Analysis of the social and environmental risk in loans with a
  niños a la escuela” in the state of Oaxaca, Mexico. Also of         particular focus on project finance operations in accordance
  note was the Projecto Escola in Brazil, which helps to improve      with the Equator principles.
  the quality of education in state schools and the Bécalos
  programme in Mexico, which supports students and teachers         • The development of financial solutions to protect the
  in state schools with scholarships.                                 environment and which contribute to the global objective of
                                                                      fighting climate change, and with a leadership position in
• Financial inclusion. Another key element of Grupo                   renewable energy matters at the international level.
  Santander’s social investment is its support for the socio-
  labour integration of people at the risk of social exclusion,     • Fostering other types of environmental initiatives such as
  through initiatives that promote financial inclusion and            projects to restore degraded natural spaces via the Banco
  entrepreneurship. Of note in this sphere is Santander Brazil’s      Santander Foundation, or various local initiatives in each
  microcredit programme, a model that strives for maximum             country such as cleaning up beaches, recycling programmes,
  customer proximity. Also noteworthy were the various                etc.
  financial education programmes.
                                                                    The Climate Change Office was created in 2011 as a reference
• Culture. Banco Santander is intensely involved in protecting,     and knowledge centre for the Group.
  conserving and disseminating art and culture. In Spain, the
  Banco Santander Foundation manages the Santander                  Banco Santander received in 2011 significant recognitions such
  Collection and organizes and promotes art exhibitions in          as the “Greenest bank in the world” from Bloomberg Markets
  various institutions and museums. The foundation is also very     and “the best global green brands” from Interbrand. These
  involved in music, research, debate and the publishing world.     recognitions also reflect the improvement in the score in the
  Santander Cultural Brazil concentrates on integrating and         environmental category of the Dow Jones Sustainability Index.
  disseminating the diversity of languages and artistic and
  cultural content.


46                                                                                                            ANNUAL REPORT 2011
Human Resources


Banco Santander has 193,349 employees, more than half of             Shared knowledge
whom work in the Americas, one-third in Continental                  Total investment in training in 2011 amounted to EUR 112.7
Europe and 14% in the UK. Of the total employees, 54%                million and each of the 193,000 employees received on average
are women and 49% have university degrees. The average               37.5 hours of training.
age of employees is 37 and the average number of years
spent working for Santander is 11 for men and 8.5 for                Santander Learning, an IT platform that every year is extended
women.                                                               to more countries with new functions, backs all the Group’s
                                                                     training activities. The year 2011 was also the one when the
Santander continued to consolidate a people management               School of Internal Trainers was consolidated, at which
policy focused on talent, knowledge and commitment as the            executives get involved in the transfer of knowledge and
key pillars for supporting business.                                 corporate values. In 2011, 2,460 internal and external trainers
                                                                     participated and put in more than 2,294,000 hours.
Global management of talent and leadership
Santander’s talent and leadership model is one that befits a         Santander was a pioneer in the creation of Business Knowledge
global group, with a wide geographic diversification and             Schools which share knowledge and exchange best practices.
different needs for attracting and retaining professionals in each   An auditing school joined in 2011 the ones already established
country.                                                             for risks (2005) and retail banking (2010).
The Bank has processes and tools to detect and develop internal      Commitment of professionals
talent, and to identify the best people for each post. Of note are   The Bank promotes the “Santander is you” programme, which
those for high potential professionals, such as STEP, or the         aims to keep on making Santander one of the best companies
development of female talent, such as the Alcanza plan. There        to work for. This programme has initiatives such as the
are also mobility programmes such as Mundo Santander and             “Santander is you” week, during which activities are organized
specific plans for certain businesses such as Future Executives      in all the countries where the Group operates so that
(FUDIS) for the Americas Division, Apolo, for retail banking         professionals participate as teams and strengthen the pride in
Spain, and those begun in 2011 for the global wholesale              belonging; or the “Santander is you” race which has become an
banking and technology and operations divisions.                     example of how to live the corporate values through sports.
As for external talent, Santander continued to invest in             In the social commitment sphere, Santander launched its
consolidating a strong employer brand which, together with the       committed volunteers programme. The aim is to create a
strategic alliances with more than 1,000 universities and            framework for employees to develop solidarity activities. This
business schools worldwide, enables us to attract the best           initiative was first launched in Spain and has UNICEF as a
candidates.                                                          strategic partner in order to support the schooling of children
                                                                     and teenagers in Latin America.


     ANNUAL REPORT 2011                                                                                                                47
Corporate governance report
Corporate governance report                        Equality of shareholders’ rights.
                                                   • The principle of one share, one vote, one dividend.
                                                   • No anti-takeover measures in the corporate By-laws.
“Banco Santander's corporate                       • Informed participation of shareholders in meetings.
 governance contributes decisively                 Maximum transparency, particularly in remuneration.
 to the success of its model”
 Emilio Botín, chairman                            A corporate governance model recognised by the socially
 General shareholders’ meeting, 17 June 2011       responsible investment indices.
                                                   Santander has been in the FTSE4Good and DJSI indices since
                                                   2003 and 2000, respectively.


                                               51 Ownership structure
                                               54 Banco Santander’s board of directors
                                               70 Rights of shareholders and general
                                                  shareholders’ meeting
                                               72 Banco Santander’s senior management
                                               74 Transparency and independence
                                               76 Unified Good Governance Code
Main activities of the board
     on matters reserved thereto


      Board’s activities
      C During 2011, the board held 14 meetings. Two of them were devoted to the Group’s strategy.
      C As regards dividends, in 2011 the board maintained the same compensation per share as in
        financial years 2010 and 200 , i.e., 0.60 euro.

      Control and risk management
      C During 2011, the chief executive officer submitted to the board eight management reports,
        and the third vice chairman and head of the risk division submitted eight risk reports.
      C Each of the heads of internal and external audit reported to the board through their
        participation in meetings of the audit and compliance committee and of the full board.

      Changes in the size and composition of the board
      C Following the death of Mr Luis Ingel Ro2o in May 2011, the resulting vacancy was covered by
        the appointment of Mr Vittorio Corbo. Subsequently, Mr Antoine Bernheim who represented
        AssicuraBioni Generali and Mr Francisco LuBHn resigned their seats on the board. On the
        occasion of the next general shareholders’ meeting, and if the board’s proposal is accepted,
        Mr Antonio Basagoiti, Mr Antonio EscDmeB and Mr Luis Alberto SalaBar Simpson will cease to
        hold office as directors and Ms Esther GimFneB Salinas will be appointed to the board.
      Director remuneration policy
      C In 2011, the board submitted the report regarding the director remuneration policy to the
        shareholders at the general shareholders’ meeting held on 17 une, as a separate item on the
        agenda and as a consultative matter 5 of the votes were in favour of the report.
      C In addition, following the enactment of the Sustainable Economy Act e de ono a
         osteni e and the amendment of the Securities Market Act e de er ado de a ores , the
        shareholders at the aforementioned meeting approved an amendment of the Bylaws in order to
        expressly provide for the obligation to submit the report regarding director remuneration policy
        to a vote of the shareholders as a consultative matter and as a separate item on the agenda.

      Director remuneration
      C The overall director remuneration with respect to 2011 is     lower than that corresponding
        to 2010

      Bylaw-mandated payments
      C In 2011, the board resolved to reduce the annual allocation to which the board members are
        entitled for the performance of supervisory and collective decision making duties by 6 vis E vis
        the amounts paid the prior year, which amounts had remained unchanged since 200 .

      Remuneration of executive directors
      C As regards executive directors, the board decided not to vary the fixed remuneration payable
        in 2012 and reduce by an average of 16 in the variable remuneration paid in 2011.

      Financial information periodically published by the Bank
      C The board approved the quarterly financial information, the annual accounts, and the
        management report for 2010, in addition to other documents such as the annual report,
        the sustainability report, the prudently significant information Pillar , the annual corporate
        governance report, and the reports of the audit and compliance committee and the
        appointments and remuneration committee.

50                                                                                                         ANNUAL REPORT 2011
1. Ownership structure


Number of shares and                                                                           Shareholders’ agreements and
significant interests                                                                          other significant agreements
Number of shares                                                                               Section A.6 of the annual corporate governance report, which
During financial year 2011, the Bank carried out four capital                                  forms part of the management report, contains a description of
increases that became effective on 1 February, 7 October, 2                                    the shareholders’ agreement (pacto parasocial) executed in
November and 30 December, and pursuant to which there were                                     February 2006 by Mr Emilio Botín-Sanz de Sautuola y García de
issued 111,152,906, 1,223,457, 125,742,571 and 341,802,171                                     los Ríos, Ms Ana Patricia Botín-Sanz de Sautuola y O’Shea,
new shares, representing 1.248%, 0.014%, 1.411% and                                            Mr Emilio Botín-Sanz de Sautuola y O’Shea, Mr Francisco Javier
3.837%, respectively, of the Bank’s share capital at year-end                                  Botín-Sanz de Sautuola y O’Shea, Simancas, S.A., Puente San
2011. The first and the third increases were carried out within                                Miguel, S.A., Puentepumar, S.L., Latimer Inversiones, S.L. and
the framework of the Santander Election Dividend (Santander                                    Cronje, S.L. Unipersonal providing for the syndication of the
Dividendo Elección) programme; the second one, in order to                                     shares of the Bank held by them or in respect of which they
accommodate the conversion of 3,458 mandatorily convertible                                    have voting rights. Such agreement was also reported to the
bonds (Valores Santander), and the last one, in connection with                                National Securities Market Commission (Comisión Nacional del
the repurchase offer directed to the holders of Series X preferred                             Mercado de Valores) (CNMV) as a significant event and is
interests issued by Santander Finance Capital, who, concurrently                               described in the public records thereof.
with the acceptance thereof, made an irrevocable request for
subscription of new shares of the Bank in the amount received
under the repurchase.
The Bank’s share capital at 31 December 2011 was represented
by 8,909,043,203 shares, at such date the market capitalisation,
on Spain’s Electronic Trading System (continuous market) of the
Spanish stock exchanges, was 50,290 million euros.
All shares carry the same economic, voting and related rights.

Significant interests
No shareholder held significant interests (of more than 3% of
the share capital(*) or interests that would permit a significant
influence on the Bank) at 31 December 2011.
The interests held by State Street Bank & Trust (8.34%), Chase
Nominees Limited (7.97%), EC Nominees Ltd. (6.46%), and The
Bank of New York Mellon (5.55%), which were the only ones in
excess of 3%, were held by them on behalf of their customers.
The Bank is not aware of any of them holding individual stakes
of 3% or more of its share capital.
Bearing in mind the current number of board members (18), the
percentage of capital needed to exercise the right to appoint a
director in accordance with article 243 of the Spanish
Companies Act (Ley de Sociedades de Capital) is 5.56%.


(*) Limit set by Royal Decree 1362/2007, of 19 October, for purposes of the annual corporate
    governance report.


         ANNUAL REPORT 2011                                                                                                                                 51
Treasury shares                                                                                         Authorisation
                                                                                                        The current authorisation for transactions in treasury shares
                                                                                                        arises from resolution no. 5 adopted by the shareholders acting
Key data                                                                                                at the general shareholders’ meeting held on 11 June 2010,
At 31 December 2011, the Bank held 42,192,066 treasury
                                                                                                        item II) of which reads as follows:
shares, representing 0.474% of its share capital; at 31
December 2010, it held 22,291,422 treasury shares,                                                      “To grant express authorisation for the Bank and the
representing 0.268% of the Bank’s share capital at such date.                                           subsidiaries belonging to the Group to acquire shares
                                                                                                        representing the share capital of the Bank for valuable
The following table sets out the monthly average percentages of
                                                                                                        consideration in any manner permitted by Law, within the
treasury stock in 2011 and 2010.
                                                                                                        limits of the Law and subject to all legal requirements, up to
                                                                                                        a maximum number of shares –including the shares they
                                                                                                        already hold– equal to 10 per cent of the share capital
 Monthly average percentages of treasury stock(1)                                                       existing at any given time or such greater maximum
                                        (2)
 % of the Bank’s share capital
                                                                                                        percentage as is established by the Law while this
                                                                             2011              2010     authorisation is in effect. Such shares shall be fully paid-in at
                                                                                                        a minimum price per share equal to the par value thereof and
January                                                                  0.289%            0.200%       a maximum price of up to 3 per cent over the last listing
February                                                                 0.126%            0.516%       price for transactions in which the Bank does not act on its
March                                                                    0.324%            0.302%       own behalf on the Continuous Market of the Spanish stock
                                                                                                        exchanges (including the block market) prior to the acquisition
April                                                                    0.701%            0.305%
                                                                                                        in question. This authorisation may only be exercised within
May                                                                      0.630%            0.603%       five years of the date of the general shareholders’ meeting.
June                                                                     0.404%            0.470%       The authorisation includes the acquisition of shares, if any,
July
                                                                                                        that must be delivered directly to the employees and
                                                                         0.271%            0.342%
                                                                                                        managers of the Company, or that must be delivered as a
August                                                                   0.253%            0.253%       result of the exercise of the options held by them.”
September                                                                0.382%            0.285%
                                                                                                        Treasury stock policy
October                                                                  0.621%            0.360%
                                                                                                        At its meeting of 11 June 2010, the board of directors adopted
November                                                                 0.643%            0.544%       the current resolution on treasury share policy, which was
December                                                                 0.446%            0.525%       published on the Group’s website (www.santander.com) and
                                                                                                        which governs aspects such as the purposes thereof, persons
(1) Further information in this regard can be found in section A.8 of the annual corporate governance
    report, which forms part of the management report, and in the capital and treasury stock section    authorised to carry out treasury share transactions, general
    of this latter report.                                                                              guidelines, prices, time limits and reporting obligations.
(2) Monthly average of daily positions of treasury stock.

                                                                                                        The aforementioned policy excludes the use of treasury shares
                                                                                                        as a defensive mechanism.
The transactions in treasury stock carried out by companies
belonging to the consolidated Group in the interest thereof
during financial year 2011 entailed the acquisition of
939,773,957 shares, equal to a nominal amount of 469.9
million euros (actual amount of 6.932.5 million euros), and the
sale of 925,256,161 shares in the nominal amount of 462.6
million euros (actual amount of 6,855.9 million euros).
The average purchase price of shares of the Bank in financial
year 2011 was 7.38 euros per share, and the average sales price
of shares of the Bank in such financial year was 7.41 euros per
share. The effect on equity (net of taxes) generated by
transactions carried out during the financial year with shares
issued by the Bank was equal to 31 million euros worth of loss,
which was recorded in the Group’s equity section under
Shareholders’ equity-Reserves.


52                                                                                                                                                ANNUAL REPORT 2011
Resolutions in effect regarding the                                 2. Delegation to the board of directors of the power to issue
                                                                       debentures, bonds and other fixed-income securities or debt
possible issuance of new shares or of                                  instruments of a similar nature in any of the forms allowed by
                                                                       Law and convertible into and/or exchangeable for shares of
bonds convertible into shares                                          the Bank. Such delegation also includes warrants or similar
                                                                       securities that may directly or indirectly carry the right to
The additional authorised capital amounts to 2,038,901,430.5           subscribe for or acquire shares of the Bank, whether
euros, pursuant to the authorisation of the shareholders acting        newly-issued or already outstanding, payable by physical
at the annual general meeting held on 19 June 2009; of such            delivery or through the set-off of differences.
amount, 170,901,085.5 euros have been used in the repurchase
offer announced by the Bank on 2 December 2011, directed to           The issuance or issuances come to the total maximum
the holders of Series X preferred interests issued by Santander       amount of 8 billion euros or the equivalent thereof in another
Finance Capital, who, concurrently with the acceptance thereof,       currency, and the period available to the directors of the
made an irrevocable request for subscription of new shares of         Bank within which to implement this resolution expires on
the Bank in the amount received under the repurchase. The             17 June 2016.
period available to the directors of the Entity to carry out and
make capital increases up to such limit expires on 19 June 2012.    3. Delegation to the board of directors, pursuant to the
The resolution adopted by the shareholders at the                      provisions of article 297.1.a) of the Companies Act, of the
aforementioned annual general meeting gives the board the              broadest powers such that, within one year of the date on
power to exclude pre-emptive rights in whole or in part,               which the aforementioned shareholders’ meeting is held,
pursuant to the provisions of article 159.2 of the Companies Act       it may set the date and the terms and conditions, as to all
(Ley de Sociedades Anónimas) (now, article 506 of the new              matters not provided for by the shareholders themselves,
Companies Act (Ley de Sociedades de Capital)).                         of a capital increase in the amount of 500 million euros.
                                                                       If the board does not exercise the powers delegated thereto
In addition, the shareholders acting at the annual general             within the period established by the shareholders for
meeting held on 17 June 2011 approved the following                    implementation of this resolution, such powers shall be
resolutions in connection with the content of this section:            rescinded.

1. Two share capital increases, each for a maximum number
   of shares having a market value of one thousand one
   hundred million euros, within the shareholder compensation
   scheme (Santander Dividendo Elección) whereby the Bank
   offers the shareholders the possibility of receiving shares
   under a scrip issue for an amount equal to the dividends, in
   one or two of the quarters in which they are customarily paid.
  For such purposes, the Bank’s executive committee, at its
  meetings of 2 November 2011 and 31 January 2012,
  implemented the aforementioned capital increases with a
  charge to voluntary reserves from undistributed profits.
  The number of shares having a nominal value of 0.5 euro
  each which were issued in each case under the two capital
  increases by means of a scrip issue was 125,742,571 and
  167,810,197, accounting for 1.411% of the Bank’s share
  capital at 31 December 2011 and 1.849% of the current
  share capital of the Bank, respectively.


      ANNUAL REPORT 2011                                                                                                           53
2. Banco Santander’s board of directors*


  Mr Emilio Botín-Sanz de Sautuola                                                                        Mr Alfredo Sáenz Abad
  y García de los Ríos
Chairman                                                                                                 Second vice-chairman and chief executive officer
Executive director                                                                                       Executive director

Born in Santander (Spain) in 1934. Joined the board in 1960.                                             Born in Getxo (Spain) in 1942. Joined the board in 1994.
Graduate in Economics and Law.                                                                           Graduate in Economics and Law.

Committees of the board of which he is a member                                                          Other significant positions: former chief executive officer and
Executive (chairman)                                                                                     first vice-chairman of Banco Bilbao Vizcaya, S.A. and chairman
International (chairman)                                                                                 of Banco Español de Crédito, S.A. (Banesto).
Technology, productivity and quality (chairman)
                                                                                                         Committees of the board of which he is a member
                                                                                                         Executive
                                                                                                         International
                                                                                                         Technology, productivity and quality


  Mr Fernando de Asúa Álvarez                                                                             Mr Matías Rodríguez Inciarte

First vice-chairman                                                                                      Third vice-chairman
Non-executive (independent) director                                                                     Executive director

Born in Madrid (Spain) in 1932. Joined the board in 1999.                                                Born in Oviedo (Spain) in 1948. Joined the board in 1988.
Graduate in Economics, Information Technology, Business                                                  Graduate in Economics and Government Economist.
Administration and Mathematics.
                                                                                                         Other significant positions: former minister of the Presidency of
Other significant positions: former chairman of IBM Spain, of                                            the Spanish Government (1981-1982). He is the chairman of the
which he is currently honorary chairman. He is a non-executive                                           Príncipe de Asturias Foundation, non-executive chairman of
vice-chairman of Técnicas Reunidas, S.A.                                                                 Banco Santander Totta and a non-executive director of Banesto,
                                                                                                         of Sanitas, S.A. de Seguros and of Financiera Ponferrada, S.A.,
Committees of the board of which he is a member                                                          SICAV.
Executive
Risk (vice-chairman)                                                                                     Committees of the board of which he is a member
Audit and compliance                                                                                     Executive
Appointments and remuneration (chairman)                                                                 Risk (chairman)
Technology, productivity and quality


* Unless otherwise specified, the main activity of the members of the board is that carried out at the
  Bank in their capacity as directors, whether executive or non-executive.


54                                                                                                                                                 ANNUAL REPORT 2011
Mr Manuel Soto Serrano                                            Mr Guillermo de la Dehesa Romero

Fourth vice-chairman                                              Non-executive (independent) director
Non-executive (independent) director
                                                                  Born in Madrid (Spain) in 1941. Joined the board in 2002.
Born in Madrid (Spain) in 1940. Joined the board in 1999.         Government Economist and head of office of Banco de España
Graduate in Economics and Business.                               (on leave of absence).
Other significant positions: non-executive director of Cartera    Main activity: international advisor to Goldman Sachs
Industrial REA, S.A. He was formerly non-executive vice-          International.
chairman of Indra Sistemas, S.A., chairman of Arthur Andersen’s
Global Board and a manager for Europe, Middle East, India and     Other significant positions: former state secretary of Economy,
Africa (EMEIA) for the same firm.                                 general secretary of Trade and chief executive officer of Banco
                                                                  Pastor, S.A. He is currently non-executive vice-chairman of
Committees of the board of which he is a member                   Amadeus IT Holding, S.A., a non-executive director of Campofrío
Audit and compliance (chairman)                                   Food Group, S.A., chairman of the Centre for Economic Policy
Appointments and remuneration                                     Research (CEPR) in London, a member of the Group of Thirty in
Technology, productivity and quality                              Washington, chairman of the board of trustees of IE Business
                                                                  School and non-executive chairman of Aviva Grupo Corporativo,
                                                                  S.L. and of Aviva Vida y Pensiones, S.A. de Seguros y Reaseguros.

                                                                  Committees of the board of which he is a member
                                                                  Executive
                                                                  Appointments and remuneration
                                                                  International


 Mr Antonio Basagoiti García-Tuñón                                 Mr Rodrigo Echenique Gordillo

Non-executive director                                            Non-executive (independent) director

Born in Madrid (Spain) in 1942. Joined the board in 1999.         Born in Madrid (Spain) in 1946. Joined the board in 1988.
Graduate in Law.                                                  Graduate in Law and Government Attorney.
Main activity: non-executive chairman of Banesto.                 Other significant positions: former chief executive officer of
                                                                  Banco Santander, S.A. (1988-1994).
Other significant positions: former chairman of Unión Fenosa
and proprietary non-executive vice-chairman of Faes Farma, S.A.   Committees of the board of which he is a member
He is a non-executive chairman of Pescanova, S.A.                 Executive
                                                                  Audit and compliance
Committees of the board of which he is a member                   Appointments and remuneration
Executive                                                         International
Risk
Technology, productivity and quality


 Ms Ana Patricia Botín-Sanz de Sautuola                            Mr Antonio Escámez Torres
 y O’Shea
Executive director                                                Non-executive (independent) director

Born in Santander (Spain) in 1960. Joined the board in 1989.      Born in Alicante (Spain) in 1951. Joined the board in 1999.
Graduate in Economics.                                            Graduate in Law.
Main activity: chief executive officer of Santander UK plc.       Other significant positions: chairman of Fundación Banco
                                                                  Santander, non-executive chairman of Santander Consumer
She joined the Bank after a period at JP Morgan (1981-1988).      Finance, S.A., of Open Bank, S.A. and of Arena Media
She has been executive vice president of Banco Santander, S.A.    Communications España, S.A., and non-executive vice-chairman
since 1992, and was executive chairwoman of Banesto from          of Attijariwafa Bank.
2002 to 2010.
                                                                  Committees of the board of which he is a member
Other significant positions: she is a non-executive director of   Executive
Alliance & Leicester plc. and a member of the international       Risk
advisory board of the New York Stock Exchange and of the          International
board of Georgetown University.                                   Technology, productivity and quality
Committees of the board of which he is a member
Executive
International
Technology, productivity and quality


      ANNUAL REPORT 2011                                                                                                           55
Mr Javier Botín-Sanz de Sautuola y O’Shea                           Mr Ángel Jado Becerro de Bengoa

Non-executive (proprietary) director                                Non-executive (independent) director

Born in Santander (Spain) in 1973. Joined the board in 2004.        Born in Santander (Spain) in 1945. Appointed as director at the
Graduate in Law.                                                    Bank’s general shareholders’ meeting held on 11 June 2010.
                                                                    Graduate in Law.
Main activity: chairman and chief executive officer of JB Capital
Markets, Sociedad de Valores, S.A.                                  Other significant positions: director of Banco Santander from
                                                                    1972 to 1999. He has been a director of Banco Banif, S.A. since
                                                                    2001.


 Lord Burns (Terence)                                                Mr Abel Matutes Juan

Non-executive director                                              Non-executive (independent) director

Born in Durham (United Kingdom) in 1944. Joined the board in        Born in Ibiza (Spain) in 1941. Joined the board in 2002.
2004. Graduate in Economics.                                        Graduate in Law and Economics.
Main activity: non-executive chairman of Santander UK plc and       Main activity: chairman of Grupo de Empresas Matutes.
of Alliance & Leicester plc.
                                                                    Other significant positions: former Spanish Foreign Minister and
Other significant positions: he is non-executive chairman of        European Union Commissioner for Loans and Investment,
Channel Four Television Corporation and a non-executive             Financial Engineering and Policy for Small and Medium-Sized
member of the Office for Budget Responsibility. He has been         Enterprises (1989), North-South Relations, Mediterranean Policy
permanent secretary of the UK Treasury, chairman of the Financial   and Relations with Latin America and Asia (1989), Transport and
Services and Markets Bill Joint Committee of the British            Energy, and the Euroatom Supply Agency (1993).
Parliament, non-executive chairman of Marks and Spencer Group
plc and of Glas Cymru Ltd (Welsh Water), and non-executive          Committees of the board of which he is a member
director of British Land plc, of Legal & General Group plc and of   Audit and compliance
Pearson Group plc.                                                  International


 Mr Vittorio Corbo Lioi                                              Mr Juan Rodríguez Inciarte

Non-executive director                                              Executive director

Born in 1943 in Iquique (Chile). Joined the board in July 2011      Born in Oviedo (Spain) in 1952. Member of the board since
following his interim appointment by the board of the directors     2008. Graduate in Economics. Joined the Group in 1985 as
of the Bank at the proposal of the appointments and                 director and executive vice president of Banco Santander de
remuneration committee. Doctor of Economics.                        Negocios. In 1989, he was appointed executive vice president of
                                                                    Banco Santander, S.A. From 1991 to 1999 he was a director of
Other significant positions: From 2003 to 2007, he served as        Banco Santander, S.A.
chairman of the Central Bank of Chile. He is currently a senior
associate researcher at the Centro de Estudios Públicos in Chile,   Other significant positions: he is vice-chairman of Santander UK
full professor at Universidad Católica de Chile, professor at       plc and a director of Alliance & Leicester plc and of Santander
Universidad de Chile, director of Banco Santander Chile,            Consumer Finance, S.A.
chairman of the board of directors of ING-Seguros de Vida
Chile, director of ENDESA-Chile, a member of the advisory           Committees of the board of which he is a member
council for the World Bank Chief Economist, a member of the         Risk
consulting group on monetary and exchange policy of the
money and capital markets department of the International
Monetary Fund, a member of the board for resolutions on
parliamentary assignments of the Chilean Congress, and a
member of the international advisory board of the Center for
Social and Economic Research (CASE) in Warsaw, Poland.


56                                                                                                             ANNUAL REPORT 2011
Mr Luis Alberto Salazar-Simpson Bos                                Mr Ignacio Benjumea Cabeza de Vaca

Non-executive (independent) director                               General secretary and secretary of the board

Born in Madrid (Spain) in 1940. Joined the board in 1999.          Born in Madrid (Spain) in 1952. Joined the Group in 1987 as
Graduate in Law and holder of a Degree in Treasury and Tax         general secretary and secretary of the board of Banco Santander
Law.                                                               de Negocios. He was appointed general secretary and secretary
                                                                   of the board of Banco Santander, S.A. in 1994. Graduate in Law,
Main activity: chairman of France Telecom España, S.A.             ICADE-E3, and Government Attorney.
Committees of the board of which he is a member                    Other significant positions: he is executive vice president of
Audit and compliance                                               Banco Santander, S.A., a non-executive director of Sociedad
Technology, productivity and quality                               Rectora de la Bolsa de Valores de Madrid, S.A., Bolsas y
                                                                   Mercados Españoles, Sociedad Holding de Mercados y Sistemas
                                                                   Financieros, S.A. and La Unión Resinera Española, S.A.

                                                                   Secretary of committees of the board
                                                                   Executive
                                                                   Risk
                                                                   Audit and compliance
 Ms Isabel Tocino Biscarolasaga                                    Appointments and remuneration
                                                                   International
                                                                   Technology, productivity and quality
Non-executive (independent) director

Born in Santander (Spain) in 1949. Joined the board in 2007.
Doctor of Laws. She has undertaken graduate studies in
business administration at IESE and the Harvard Business School.
Main activity: full professor at Universidad Complutense de
Madrid.
Other significant positions: former Spanish Minister for the
Environment, former chairwoman of the European Affairs
Committee and of the Foreign Affairs Committee of the Spanish
Congress and former chairwoman for Spain and Portugal and
former vice-chairwoman for Europe of Siebel Systems. She is
currently an elected member of the Spanish State Council and a
member of the Royal Academy of Doctors.

Committees of the board of which he is a member
Appointments and remuneration


      ANNUAL REPORT 2011                                                                                                        57
Re-election and ratification of                                                                              Likewise, the ratification of the appointment and re-election of
                                                                                                             Mr Vittorio Corbo Lioi, as external, non-propietary and
directors at the 2012 annual general                                                                         non-independent director, will be submitted to the general
                                                                                                             shareholders’ meeting for approval, as well as the re-election of
shareholders’ meeting                                                                                        the directors Mr Juan Rodríguez Inciarte, Mr Emilio Botín-Sanz
                                                                                                             de Sautuola y García de los Ríos, Mr Matías Rodríguez Inciarte ,
Pursuant to article 55 of the Bylaws* and article 22 of the Rules                                            and Mr Manuel Soto Serrano. The first three as executive
and Regulations of the Board*, directors are appointed to three-                                             directors and Mr Soto as independent external director, the
year terms (the maximum term being six years under Spanish                                                   professional profiles and activity descriptions appear on
law), such that one-third of the board is renewed each year.                                                 the preceding pages.
At the 2012 ordinary general shareholders’ meeting, planned for                                              The re-elections and the ratification will be submitted separately
29 and 30 March at first and second call, respectively, the                                                  to a vote of the shareholders at the general shareholders’
appointment of Ms Esther Giménez-Salinas i Colomer (as an                                                    meeting (article 21.2 of the Rules and Regulations for the
independent director) will be proposed.                                                                      General Shareholders’ Meeting). In view of the fact that this
                                                                                                             election practice has been followed since the 2005 annual
                                                                                                             general shareholders’ meeting, the election of all of the current
                                                                                                             directors has been submitted to a separate vote at a general
                                                                                                             shareholders’ meeting, except for the case of Mr Vittorio Corbo
                                                                                                             Lioi, whose ratification will be proposed at the 2012 annual
                                                                                                             general shareholders’ meeting, as set forth above.


* The Bylaws and the Rules and Regulations of the Board of Banco Santander are published on the
  Group’s website, www.santander.com.


 Composition and structure of the board of directors


                                                              Board of directors                                                                                                                         Committees


                                                                                                                                                                                                                                                                                        6. Technology, productivity and
                                                                                                                                                                                                                                                           5. International committee
                                                                                                                                                                                                                                  remuneration committee
                                                                                                                                                                                                                               3. Audit and compliance
                                                                                                                                                                                1. Executive committee


                                                                                                                                                                                                                                                                                           quality committee
                                                                                                                                                                                                                               4. Appointments and
                                                                                                                                                                                                          2. Risk committee
                                                                                                                                                                Non-executive


                                                                                                                                                                                                                                  committee
                                                                                                                                                    Executive


Chairman                                                                  Mr Emilio Botín-Sanz de Sautuola y García de los Ríos (1)                                                 C                                                                            C                                  C
First vice-chairman                                                       Mr Fernando de Asúa Álvarez                                                               I                                        V                                   C
Second vice-chairman and chief executive officer                          Mr Alfredo Sáenz Abad
Third vice-chairman                                                       Mr Matías Rodríguez Inciarte (2)                                                                                                   C
Fourth vice-chairman                                                      Mr Manuel Soto Serrano                                                                    I                                                              C
Members                                                                   Mr Antonio Basagoiti García-Tuñón (3)                                                   N
                                                                          Ms Ana Patricia Botín-Sanz de Sautuola y O’Shea (1)
                                                                          Mr Javier Botín-Sanz de Sautuola y O’Shea (1) (4)                                       P
                                                                          Lord Burns (Terence)                                                                    N
                                                                          Mr Vittorio Corbo Lioi                                                                  N
                                                                          Mr Guillermo de la Dehesa Romero                                                          I
                                                                          Mr Rodrigo Echenique Gordillo                                                             I
                                                                          Mr Antonio Escámez Torres (3)                                                             I
                                                                          Mr Ángel Jado Becerro de Bengoa                                                           I
                                                                          Mr Francisco Luzón López (5)
                                                                          Mr Abel Matutes Juan                                                                      I
                                                                          Mr Juan Rodríguez Inciarte
                                                                          Mr Luis Alberto Salazar-Simpson Bos (3)                                                   I
                                                                          Ms Isabel Tocino Biscarolasaga                                                            I
                                                                          Total

General secretary and secretary of the board                              Mr Ignacio Benjumea Cabeza de Vaca


(1) Mr Emilio Botín-Sanz de Sautuola y García de los Ríos has the right to vote, at the general              (2) Mr Matías Rodríguez Inciarte has the right to vote 80,095 shares owned by two of his children.
    shareholders’ meeting, 91,866,035 shares owned by Fundación Marcelino Botín (1.03% of the                (3) Upon resolution by the board of directors, at the proposal of the appoinmets and remuneration
    share capital), 8,096,742 shares owned by Mr Jaime Botín-Sanz de Sautuola y García de los Ríos,              committee, the re-election of these three directors will be not submitted to the general shareholders
    9,042,777 shares owned by Mr Emilio Botín-Sanz de Sautuola y O’Shea, 9,118,885 shares owned                  meeting for appoval.
    by Ms Ana Patricia Botín-Sanz de Sautuola y O’Shea and 9,470,988 shares owned by Mr Javier
    Botín-Sanz de Sautuola y O’Shea. Accordingly, this table includes the direct and indirect interests of   (4) Mr Javier Botín-Sanz de Sautuola y O’Shea is a proprietary non-executive director because on the
    each of the two last named, who are directors of the Bank, but in the column showing the total               board of directors he represents 2.007% of the share capital, representing the aggregate interests
    percentage of share capital that such interests represent they are computed together with those              owned by Fundación Marcelino Botín, Mr Emilio Botín-Sanz de Sautuola y García de los Ríos,
    owned or also represented by Mr Emilio Botín-Sanz de Sautuola y García de los Ríos.                          Ms Ana Patricia Botín-Sanz de Sautuola y O’Shea, Mr Emilio Botín-Sanz de Sautuola y O’Shea,
                                                                                                                 Mr Jaime Botín-Sanz de Sautuola y García de los Ríos, Ms Paloma O’Shea Artiñano and his own
                                                                                                                 interest.


58                                                                                                                                                                                                                            ANNUAL REPORT 2011
Powers and duties                                                                                           appointment, remuneration and, if appropriate, removal of the
                                                                                                              other members of senior management and the determination of
  The basic responsibility of the board of directors is to supervise                                          the basic terms of their contracts, as well as the creation or
  the Group, delegating the day-to-day management thereof to the                                              acquisition of interests in special purpose entities or in entities
  appropriate executive bodies and the various management teams.                                              registered in countries or territories regarded as tax havens. On
                                                                                                              the matters mentioned in this paragraph, the executive
  The Rules and Regulations of the Board (article 3) reserve thereto                                          committee may make any appropriate decisions, by delegation
  the power to approve general policies and strategies and, in                                                of the board and whenever justified by reasons of urgency.
  particular, strategic plans, management objectives and the annual
  budget, corporate governance, corporate social responsibility and                                           The Bylaws (article 40) as well as the aforementioned Rules and
  dividend and treasury stock policies, the general risk policy, and                                          Regulations (article 5) establish the board’s obligation to ensure
  the policies for the provision of information to and for                                                    that the Bank faithfully complies with applicable law, observes
  communication with the shareholders, the markets and the public                                             usage and good practices of the industries or countries where it
  opinion, which power cannot be delegated.                                                                   does business and abides by the social responsibility principles
                                                                                                              that it has voluntarily accepted.
  The board also reserves for itself, and likewise cannot delegate,
                                                                                                              In addition, the board of the Bank plays a special role in the
  the following matters, among others: decisions regarding the
                                                                                                              Group’s risk management. 13 of its 18 members are members
  acquisition and disposition of substantial assets (except when
                                                                                                              of at least one of the three board committees with
  the decisions come within the purview of the shareholders at a
                                                                                                              responsibilities in the area of risks: the executive committee, the
  general shareholders’ meeting) and major corporate
                                                                                                              risk committee and the audit and compliance committee. Of
  transactions; the determination of the remuneration of each
                                                                                                              these 13 directors, one is the first vice-chairman of the Bank,
  director and the approval of the contracts governing the
                                                                                                              who is a member of all three committees, and another 4
  performance by the directors of duties other than those of a
                                                                                                              directors sit on two of the committees with responsibilities in
  director, including executive duties, as well as the remuneration
                                                                                                              the area of risks.
  to which they are entitled for the discharge thereof; the


                                                                                     Shareholding at 31 December 2011


                                                                                                                                                                                               Date of last
                                                                                                                                                                                           proposal of the
                                                                                                                                                                                         appointments and
                                               Shares                                % of share               Date of first        Date of last                                              remuneration
                                                                                                                                                                                     (7)
     Direct             Indirect          represented                      Total        capital              appointment          appointment                        Expiration date            committee
  8,259,445         42,916,473           109,005,554           160,181,472                2.007%               04.07.1960 (6)        21.06.2008               First six months of    2012             17.02.2012
     66,167             52,469                     -               118,636                0.001%               17.04.1999            11.06.2010               First six months of    2014             21.04.2010
  1,100,332          1,304,950                     -             2,405,282                0.027%               11.07.1994 (6)        11.06.2010               First six months of    2014             21.04.2010
  1,035,739             86,594                80,095             1,202,428                0.013%               07.10.1988 (6)        19.06.2009               First six months of    2013             27.04.2009
     63,721            454,466                     -               518,187                0.006%               17.04.1999            19.06.2009               First six months of    2013             27.04.2009
    719,217                  -                     -               719,217                0.008%               26.07.1999            23.06.2007               First six months of    2012             19.03.2007
  5,142,749          4,024,136                     -             9,166,885                0.000%               04.02.1989 (6)        17.06.2011               First six months of    2014             11.04.2011
  4,793,481          4,677,507                     -             9,470,988                0.000%               25.07.2004            11.06.2010               First six months of    2013             21.04.2010
     30,105             27,001                     -                57,106                0.001%               20.12.2004            17.06.2011               First six months of    2014             11.04.2011
          1                  -                     -                     1                0.000%               22.07.2011            22.07.2011               First six months of    2012             17.02.2012
        105                  -                     -                   105                0.000%               24.06.2002            19.06.2009               First six months of    2014             27.04.2009
    658,758              9,736                     -               668,494                0.008%               07.10.1988            17.06.2011               First six months of    2014             11.04.2011
    783,261                  -                     -               783,261                0.009%               17.04.1999            23.06.2007               First six months of    2012             19.03.2007
  2,000,000          4,950,000                     -             6,950,000                0.078%               11.06.2010            11.06.2010               First six months of    2013             21.04.2010
  1,611,691             81,685                     -             1,693,376                0.019%               22.03.1997 (6)        23.06.2007               First six months of    2012             19.03.2007
    129,479          2,357,399                     -             2,486,878                0.028%               24.06.2002            19.06.2009               First six months of    2013             27.04.2009
  1,400,296                  -                     -             1,400,296                0.016%               28.01.2008 (6)        21.06.2008               First six months of    2012             17.02.2012
    253,205             14,082                     -               267,287                0.003%               17.04.1999            21.06.2008               First six months of    2012             16.04.2008
     40,674                  -                     -                40,674                0.000%               26.03.2007            11.06.2010               First six months of    2014             21.04.2010
28,088,426         60,956,498           109,085,649           198,130,573                2.224%


  (5) He resigned from his position as a director as of 23 January 2012.                                      (7) However, and pursuant to the provisions of article 55 of the Bylaws, as amended by resolution
  (6) The date on which they were appointed for the first time as executive directors coincides with their        adopted at the annual general shareholders’ meeting of 17 June 2011, one-third of the board will
      first appointment as a director.                                                                            be renewed each year, based on length of service and according to the date and order of the
                                                                                                                  respective appointment.


                                                                                                               C Chairman of the committee           I   Independent                       P Proprietary

                                                                                                               V Vice-chairman of the committee N Non-executive, neither proprietary nor independent


           ANNUAL REPORT 2011                                                                                                                                                                                    59
Commitment of the board and main areas of experience of its members


 Board’s interest in the Bank’s capital                                                        Main areas of professional experience
 Data at year-end 2011                                                                         of the board members


           NUMBER OF SHARES OF THE BOARD
           198,130,573 equal to 2.224%                                                                     Audit and
           of share capital                                                                                consulting 1

                                                                                                            Tourism 1                                  Banking 12
           STOCK EXCHANGE VALUE
           1,163 million euros
                                                                                                            University 2
           STOCK LISTING PRICE
                                                                                                           Technology and
           5.87 euros                                                                                      telecommunications 2


Corporate governance in risk management


Average attendance rate at meetings of the committees of the board %                                                       • Mr Matías Rodríguez Inciarte, third
                                                                                                                             vice-chairman of Banco Santander
                                                                                                                             and chairman of the risk
     Executive committee                                                                                                     committee, reports directly to the
     Risk committee                                                                                                          executive committee and to the
     Audit and compliance committee                                                                                          board, which guarantees the
                                                                                                                             independence of the risk function.
                                                                                                              95.4


                                                                                                                           • The risk committee held 99
                                                              92.7
                                92.5


                                                                                                                             meetings in 2011, each of which
                                              92.0


                                                                       92.2
 90.5


                                       90.9


                                                                                                                             lasted approximately 3 hours.
                                                      89.5
                        90.3


                                                                               90.7

                                                                                      89.1


                                                                                             89.2

                                                                                                    87.5
         87.1


                                                                                                                           • The executive committee held
                86.2


                                                                                                                             59 meetings in 2011 and devoted
                                                                                                                             a significant amount of time to
                                                                                                                             discussions on risks.

        2007                   2008                  2009                     2010                  2011


Participation in the executive committee, the risk                                            Number of meetings of the executive committee, the risk
committee and the audit and compliance committee                                              committee and the audit and compliance committee

4 directors
participate in 2 of                                                                          Committees                           2007   2008     2009    2010       2011
the 3 committees
                                                                                             Executive                              55     59       56      55         59
                                                                                             Risk                                   98    102       99      99         99
                                                                                             Audit and compliance                   13     11       11      11         12
                                                                                             Total meetings                       166     172      166     165        170
                                                             8 out of the 18 directors
                                                             participate in 1 of the 3
                                                             committees
     1 director is
     a member of
     all 3 committees


60                                                                                                                                              ANNUAL REPORT 2011
Size and composition of the board                                      Independent non-executive directors
                                                                       Independent non-executive directors account for 50% of the
In 2006, the shareholders acting at a general shareholders’            Board.
meeting approved a bylaw amendment whereby the maximum
                                                                       The Rules and Regulations of the Board (article 6.2.c)) include
number of directors was reduced from 30 to 22, with the
                                                                       the definition of independent director established in the Unified
minimum remaining at 14.
                                                                       Code. In the light thereof, taking into account the circumstances
The board presently comprises 18 members, following the                of each case, and upon a prior report of the appointments and
resignation due to pre-retirement on 23 January of Mr Francisco        remuneration committee, the board considers the following to
Luzón López as a director, executive vice president of Banco           be independent non-executive directors: Mr Fernando de Asúa
Santander and head of the America division.                            Álvarez, Mr Manuel Soto Serrano, Mr Guillermo de la Dehesa
                                                                       Romero, Mr Rodrigo Echenique Gordillo, Mr Antonio Escámez
Pursuant to article 6.3 of the Rules and Regulations of the Board,     Torres, Mr Ángel Jado Becerro de Bengoa, Mr Abel Matutes
the appointments and remuneration committee, at its meeting of         Juan, Mr Luis Alberto Salazar-Simpson Bos and Ms Isabel Tocino
17 february 2012, verified the status of each director. Its proposal   Biscarolasaga.
was submitted to the board, which approved it at its meeting of
20 february 2012 and established the composition of the board          At 31 December 2011, the average length of service of
upon the terms set forth below.                                        independent non-executive directors in the position of board
                                                                       member was 11.1 years.
Of the 18 directors currently sitting on the board of directors,
5 are executive and 13 are non-executive. Of the 13                    Other non-executive directors
non-executive directors, 9 are independent, one is proprietary and     Lord Burns is a non-executive, non-proprietary director. Since he
three are, in the opinion of the board, neither proprietary nor        currently receives remuneration in his capacity as non-executive
independent.                                                           chairman of the Group’s subsidiaries, Santander UK plc and
                                                                       Alliance & Leicester plc, in the opinion of the board of directors
Executive directors                                                    and upon a prior report of the appointments and remuneration
Pursuant to the Rules and Regulations of the Board (article            committee, he cannot be classified as an independent director.
6.2.a)), the following are executive directors: Mr Emilio Botín-
Sanz de Sautuola y García de los Ríos, Mr Alfredo Sáenz Abad,          The same applies to Mr Antonio Basagoiti García-Tuñón, who, in
Mr Matías Rodríguez Inciarte, Ms Ana Patricia Botín-Sanz de            his capacity as non-executive chairman of Banesto, receives
Sautuola y O’Shea and Mr Juan Rodríguez Inciarte.                      remuneration in addition to his remuneration as a director of
                                                                       Banco Santander.
Non-executive proprietary directors
Since 2002, the standard used by the appointments and                  Mr Vittorio Corbo Lioi is also a non-executive, non-proprietary
remuneration committee and the board of directors as a                 director. As he provides remunerated professional services to the
necessary but not sufficient condition to designate or consider a      Group other than the collective management and supervision
director as a non-executive proprietary director (as expressly set     services inherent in his position as director —he receives
forth in article 6.2.b) of the Rules and Regulations of the Board      remuneration as a director of Banco Santander Chile and as an
of Directors) is that he/she hold at least 1% of the share capital     advisor of the aforementioned entity—, Mr Corbo, in the
of the Bank. This percentage was set by the Bank exercising its        opinion of the board of directors and upon a prior report of the
powers of self-regulation.                                             appointments and remuneration committee, cannot be classified
                                                                       as independent.
Taking into account the circumstances of the case, and upon the
prior report of the appointments and remuneration committee,           Changes in the size and composition
the board believes that Mr Javier Botín-Sanz de Sautuola y             of the board
O’Shea is a non-executive proprietary director.                        On the occasion of the next general shareholders’ meeting, and
                                                                       if the board’s proposal is accepted, Mr Antonio Basagoiti, Mr
                                                                       Antonio Escámez and Mr Luis Alberto Salazar-Simpson will cease
                                                                       to hold office as directors and Ms Esther Giménez-Salinas i
                                                                       Colomer will be appointed to the Board.
                                                                       With these changes, the size of the board would be reduced
                                                                       from 20 directors at the beginning of 2011 to 16, of which 5
                                                                       would be executive and 11, external (1 proprietary, 8
                                                                       independent and 2 external, neither proprietary nor
                                                                       independent).


      ANNUAL REPORT 2011                                                                                                               61
Executive chairman and chief                                          Succession plans for the chairman
executive officer                                                     and the chief executive officer
The Bank has chosen to have an executive chairman because it          Succession planning for the main directors is a clear element of
believes that it is the position that best suits its circumstances.   the good governance of the Bank, tending to assure an orderly
                                                                      leadership transition at all times. Along these lines, article 24 of
The chairman of the board is the highest-ranking officer of the       the Rules and Regulations of the Board provides that:
Bank (article 48.1 of the Bylaws and article 8.1 of the Rules and
Regulations of the Board) and accordingly, all the powers that        “In the cases of withdrawal, announcement of renunciation or
may be delegated under the Law, the Bylaws and the Rules and          resignation, legal incapacitation or death of the members of
Regulations of the Board have been delegated to him. He is            the board of directors or its committees or withdrawal,
responsible for directing the Bank’s management team, always          announcement of renunciation or resignation of the chairman
in accordance with the decisions and standards set by the             of the board of directors or of the chief executive officer or
shareholders acting at a general shareholders’ meeting and by         officers, as well as from other positions on such bodies, at
the board within their respective purview.                            the request of the chairman of the board of directors or, in
                                                                      his absence, at the request of the highest-ranking vice-
The chief executive officer, acting by delegation from and            chairman, the appointments and remuneration committee will
reporting to the board of directors and the chairman, as the          be convened in order for such committee to examine and
highest-ranking officer of the Bank, is charged with the conduct      organise the process of succession or replacement in an
of the business and the highest executive duties.                     orderly manner and to present the corresponding proposal to
                                                                      the board of directors. Such proposal shall be communicated
There is a clear separation of duties between the executive
                                                                      to the executive committee and subsequently submitted to
chairman, the chief executive officer, the board and the
                                                                      the board of directors on the following meeting scheduled to
committees thereof, as well as various checks and balances that
                                                                      be held by the board’s annual calendar of meetings or on
assure proper equilibrium in the corporate governance structure
                                                                      another extraordinary meeting which, if deemed necessary, is
of the Bank, including the following:
                                                                      called.”
• The board and its committees exercise supervisory and control
                                                                      Article 44.2 of the Bylaws sets out interim replacement rules for
  duties over the actions of both the chairman and the chief
                                                                      the temporary performance (in cases of absence, inability to act
  executive officer.
                                                                      or indisposition) of the duties of the chairman of the board in
• The first vice-chairman, who is an independent non-executive        the absence of the vice-chairmen.
  director, is the chairman of the appointments and
  remuneration committee and acts as coordinator of non-              The board determines the numerical sequence for such purpose
  executive directors.                                                every year based on the directors’ seniority. In this regard, at its
                                                                      meeting of 17 June 2011, the board unanimously resolved to
• The powers delegated to the chief executive officer are the         assign the following order of priority for the temporary
  same as those delegated to the chairman, which powers do            performance of the duties of chairman in the absence of the
  not include, in either case, those reserved by the board for        vice-chairmen of the board:
  itself.
                                                                       1) Mr Rodrigo Echenique Gordillo
                                                                       2) Ms Ana Patricia Botín-Sanz de Sautuola y O’Shea
                                                                       3) Mr Antonio Escámez Torres
                                                                       4) Mr Luis Alberto Salazar-Simpson Bos
                                                                       5) Mr Antonio Basagoiti García-Tuñón
                                                                       6) Mr Guillermo de la Dehesa Romero
                                                                       7) Mr Abel Matutes Juan
                                                                       8) Mr Francisco Javier Botín-Sanz de Sautuola y O’Shea
                                                                       9) Lord Burns
                                                                      10) Ms Isabel Tocino Biscarolasaga
                                                                      11) Mr Juan Rodríguez Inciarte
                                                                      12) Mr Ángel Jado Becerro de Bengoa


62                                                                                                                 ANNUAL REPORT 2011
Secretary of the board                                                Conduct of meetings
The Bylaws (article 45.2) include among the duties of the             In 2011, the board was kept continuously and fully informed of
secretary those of caring for the formal and substantive legality     the running of the various business areas of the Group through
of the activities of the board, safeguarding observance of the        the 8 management reports and the 8 risks reports presented by
good governance recommendations assumed by the Bank, and              the chief executive officer and the third vice-chairman in charge
ensuring that governance procedures and rules are observed            of the risk division, respectively, at the 14 meetings held during
and regularly reviewed.                                               the financial year. Furthermore, in addition to reviewing the
                                                                      various units and businesses of the Group, the board analysed
The secretary of the board is the general secretary, who also acts    the liquidity situation, the self-evaluation of capital and the
as secretary of all of the committees of the board.                   Investor Day held in September, among other matters.
Article 17.4.d) of the Rules and Regulations of the Board             During the year, the board of directors also addressed other
provides that the appointments and remuneration committee             matters that come within its area of supervision, as the internal
must report on proposals for the appointment or withdrawal of         control model and off-shore centres.
the secretary of the board prior to submission thereof to the
board.                                                                Finally, the board was informed of the conclusions of the
                                                                      external and internal audits.
                                                                      The chart below shows a breakdown of the approximate time
Proceedings of the board                                              dedicated to each duty at the meetings held by the board in
                                                                      financial year 2011.
There were 14 meetings during financial year 2011.
The board holds its meetings in accordance with an annual             Approximate time devoted to each duty
calendar. The Rules and Regulations of the Board provide that
the board shall hold not less than nine annual ordinary
meetings. The board shall also meet whenever the chairman so
                                                                                     Internal and             Business
decides, acting on his own initiative or at the request of not less           external audits 5%              management 35%
than three directors (article 46.1 of the Bylaws).
                                                                        Review of financial
                                                                          information 5%
When directors cannot attend a meeting personally, they may
give a proxy to any other director, in writing and specifically for          Corporate
                                                                        governance 5%
each meeting, to represent them for all purposes at such
meeting.                                                                      Capital and
                                                                           liquidity 10%
Any member of the board may request the inclusion of any
other item not included in the draft agenda that the chairman
proposes to the board (article 46.2 of the Bylaws).
                                                                                    General policies            Risk management
Meetings of the board shall be validly held when more than                       and strategies15%              25%
one-half of its members are present in person or by proxy.
Except in instances in which a greater majority is specifically
required pursuant to legal provisions, the Bylaws or the Rules
and Regulations of the Board, resolutions are adopted by              Strategy meetings
absolute majority of the directors attending in person or by
proxy. In the event of a tie, the chairman has a tie-breaking         In addition to the ordinary meetings, the board held specific
vote.                                                                 meetings to discuss Santander’s strategy. In 2011, the directors
                                                                      held two meetings: the first one, on 18 January, and the second
                                                                      one, on 17 and 18 December.
                                                                      Among the matters discussed were:
                                                                      • The macroeconomic environment and the financial sector,
                                                                        with a focus on the Spanish and European cases and
                                                                        Santander´s positioning and challenges facing Santander
                                                                        vis-à-vis the leading European financial institutions.
                                                                      • Objectives of the Investor Day.
                                                                      • Adjustment to the new liquidity and capital environment.
                                                                      • Management of the Group’s business portfolio.


      ANNUAL REPORT 2011                                                                                                              63
Training of directors and                                          Self-evaluation by the board
information programme                                              The self-evaluation process (carried out, as in previous years,
                                                                   with the support of the firm Spencer Stuart on the basis of a
As a result of the self-evaluation of the board carried out in     questionnaire and personal interviews with directors) also
2005, an on-going director training programme was put in place.    included a special section for the individual evaluation of the
Eight meetings were held in 2011 with the attendance of an         chairman, the chief executive officer and the rest of the
average of thirteen directors, who devoted approximately one       directors. This is in line with the recommendations of the Unified
hour and a half to each session. Various issues were reviewed in   Code and is included in the Rules and Regulations of the Board.
depth at such meetings in connection with trends in human          Once again this year, the self-evaluation of the board focused
resources management, the Commercial Banking school and            on the organisation, operation and content of the meetings of
Grupo Santander’s technology .                                     the latter and its committees, comparing them with those of
The Rules and Regulations (article 21.7) provide that the board    other international banks, and open questions on issues relating
shall make available to new directors an information programme     to the future (strategy, internal and external factors).
providing quick and adequate understanding of the Bank and its     As strong features of the Group's corporate governance,
Group, including its governance rules. This programme was thus     directors highlighted the following: the knowledge of banking
made available to the newest directors.                            business and experience of the directors, the balance between
                                                                   executive and external directors, dedication of members of the
                                                                   board and involvement in risk control.
                                                                   Furthermore, the committee structure enables the board to be
                                                                   more closely involved with the Group's day-to-day operation
                                                                   and activities emphasising the dedication and involvement of
                                                                   directors.
                                                                   In the opinion of the directors, these strengths have made the
                                                                   Group a reference point in the present crisis, thanks to the
                                                                   board's involvement in controlling its credit risk and other risks,
                                                                   including reputational and operational risk.
                                                                   The renewal and internationalisation of the board continues,
                                                                   with the addition of a new director from Latin America.
                                                                   Likewise, with respect to the organisation, working and content
                                                                   of the board meetings, the following aspects were highlighted:
                                                                   the high level of strategic debate with the organisation of a
                                                                   monographic strategy meeting; the knowledge; the training
                                                                   programme and their high level of commitment.


                                                                   Appointment, re-election and
                                                                   ratification of directors
                                                                   The proposals for appointment, re-election and ratification of
                                                                   directors, regardless of the status thereof, that the board of
                                                                   directors submits to the shareholders for consideration at a
                                                                   general shareholders’ meeting, as well as the appointment
                                                                   decisions made by the board itself in the exercise of its powers
                                                                   to make interim appointments as permitted by law, must, in
                                                                   turn, be preceded by the corresponding proposal of the
                                                                   appointments and remuneration committee.
                                                                   Although the proposals of such committee are not binding, the
                                                                   Rules and Regulations of the Board provide that if the board
                                                                   does not follow them, it must give reasons for its decision.
                                                                   Currently, all directors have been appointed or re-elected at the
                                                                   proposal of the appointments and remuneration committee.


64                                                                                                              ANNUAL REPORT 2011
Remuneration                                                         Report on the director remuneration policy
                                                                     As provided in the Bylaws (article 59.1), the board of directors
Remuneration system                                                  annually approves a report on the director remuneration policy,
Article 58 of the Bylaws provides that the directors shall have      which sets forth the standards and grounds that determine the
the right to receive, in consideration for the performance of        remuneration for the last and current financial year, making such
their duties as board members and as a share in the profits for      report available to the shareholders on occasion of the call to
each financial year, remuneration equal to 1% of the Bank’s net      the annual general shareholders’ meeting.
profits for the respective financial year, although a director may   In 2011, such report was submitted to the shareholders at the
agree to reduce such percentage. In exercise of its powers, the      general shareholders’ meeting held on 17 June, as a separate
board set the amount for financial year 2011 at 0.275% of the        item on the agenda and as a consultative matter; 95.110% of
Bank’s profits for the year. This percentage was calculated by       the votes were in favour of the report.
including in the numerator not only the annual allocation, but
also the attendance fees accrued by the directors during the         In addition, following the enactment of the Sustainable Economy
financial year, as provided in such article 58.                      Act (Ley de Economía Sostenible) and the inclusion of a new
                                                                     article 61 ter in the Securities Market Act (Ley del Mercado de
The remuneration of directors is approved by the board at the        Valores), the shareholders at the aforementioned meeting
proposal of the appointments and remuneration committee,             approved an amendment of the Bylaws in order to expressly
except for such remuneration as consists of the delivery of          provide for the obligation to submit the report regarding director
shares or options thereon, or that is paid under other               remuneration policy to a vote of the shareholders as a
remuneration systems established by reference to the value of        consultative matter and as a separate item on the agenda,
the shares of the Bank, the approval of which, under the law         a practice that the Bank already followed since 2010.
and the Bylaws, is within the purview of the shareholders acting
at a general shareholders’ meeting, at the proposal of the board     Transparency
made after a report of the appointments and remuneration             Pursuant to the Bylaws (article 59.2), the annual report includes
committee.                                                           itemised information on the remuneration received by each
                                                                     director, with a statement of the amounts for each item of
The Group’s policy provides that only executive directors can be
                                                                     remuneration. The report also sets forth, on an individual basis
beneficiaries of remuneration systems consisting of the delivery
                                                                     for each item, the remuneration for the executive duties
of shares or rights thereon.
                                                                     entrusted to the executive directors of the Bank.
Remuneration of the board in 2011                                    All such information is contained in note 5 to the Group’s legal
In 2011, the board agreed to reduce all directors’ remuneration,     report.
for all items, by 8%.
The amount paid to its members for exercising their functions of
supervision and collegiate decision-making has been reduced by
6% over 2010. This amount has been unchanged since 2008.
As regards executive directors, the board decided to maintain
the fixed remunerations for 2012 and reduce by an average of
16% the variable ones for 2011.
Full details of director compensation policy in 2011 may be
found in the report by the appointments & remuneration
committee which forms part of Banco Santander’s corporate
documentation.

Anticipation and adjustment to the regulatory
framework
For several years now, the board of directors, at the proposal of
the appointments and remuneration committee, has promoted
measures based on the need to have a remuneration system in
place that encourages a rigorous management of risks.
This initiative is implemented together with on-going monitoring
of the recommendations issued by the principal national and
international bodies with authority in this field.


      ANNUAL REPORT 2011                                                                                                             65
Duties of directors, related-party                                    Committees of the board
transactions and conflicts of interest                                General
                                                                      The board has set up, as decision-making committees, an
Duties                                                                executive committee, to which it has delegated general
The duties of the directors are governed by the Rules and             decision-making powers, and a risk committee, to which it has
Regulations of the Board, which conform both to the provisions        delegated powers specifically relating to risks.
of current Spanish law and to the recommendations of the
Unified Good Governance Code (Código Unificado de Buen                The board also has the following committees with supervisory,
Gobierno).                                                            reporting, advisory and proposal-making powers: the audit and
                                                                      compliance committee, the appointments and remuneration
The Rules and Regulations expressly provide for the duties of         committee, the international committee, and the technology,
diligent management, loyalty, secrecy and inactivity in the event     productivity and quality committee.
of knowledge of confidential information.
                                                                      Executive committee
The duty of diligent management includes the directors’ duty to
                                                                      The executive committee is a basic instrument for the corporate
inform themselves adequately of the running of the Bank and to
                                                                      governance of the Bank and its group. Its duties and
dedicate to their duties the time and effort needed to carry them
                                                                      composition are established in the Bylaws (article 51) and in the
out effectively. The directors must inform the appointments and
                                                                      Rules and Regulations of the Board (article 14).
remuneration committee of their other professional obligations,
and the maximum number of boards of directors on which they           There are currently 9 directors sitting on the committee,
may sit is governed by the provisions of Act 31/1968, of 27 July.     of whom 4 are executive and 5 are non-executive directors.
                                                                      Of the latter, 4 are independent and 1 is neither proprietary
Related-party transactions                                            nor independent.
To the best of the Bank’s knowledge, no member of the board of
directors, no person represented by a director and no company of      The executive committee proposes to the board those decisions
which such persons, or persons acting in concert with them or         that are within its exclusive purview. It also reports to the board
through nominees therein, are directors, members of senior            on the matters dealt with and the resolutions adopted by
management or significant shareholders, has made any unusual          making the minutes of its meetings available to the directors
or significant transaction with the Bank during financial year 2011   (article 14.7 of the Rules and Regulations of the Board), among
and through the date of publication of this report.                   other ways of reporting.

Control mechanisms                                                    Risk committee
As provided in the Rules and Regulations of the Board (article        It is governed by the Bylaws (article 52) and the Rules and
30), directors must inform the board of any conflict of interest,     Regulations of the Board (article 15), which define the
whether direct or indirect, that they may have with the interests     composition and duties of this committee, including within its
of the Bank. If the conflict relates to a transaction, the director   powers and duties the responsibilities set forth in the Unified
may not carry it out without the approval of the board, following     Code regarding risk control and management.
a report of the appointments and remuneration committee.
                                                                      The committee is currently made up of five directors, of whom
The director involved must refrain from participating in the          two are executive and three are non-executive. Of these three
discussion and voting on the transaction to which the conflict        non-executive directors, two are independent and one is neither
refers.                                                               proprietary nor independent. Its chairman is a vice-chairman
                                                                      with executive duties pursuant to the Rules and Regulations of
In the case of directors, the body in charge of resolving any         the Board (article 15.1).
disputes is the board of directors itself.
                                                                      Pages 144 to 203 of this annual report contain broad
Specific situations of conflict                                       information regarding the risk committee and the Group’s risk
In financial year 2011 there were 75 cases in which directors,        policies, the responsibility for which (article 3 of the Rules and
including those who are members of senior management,                 Regulations of the Board) is part of the board’s general duty of
abstained from participating and voting in the discussions of the     supervision.
board of directors or of the committees thereof.
                                                                      Audit and compliance committee
The breakdown of the 75 cases is as follows: on 49 occasions, the     As provided in the Bylaws (article 53) and the Rules and
matter under consideration was the approval of terms of               Regulations of the Board (article 16), the audit and compliance
remuneration and other terms of the contracts with the directors;     committee must be made up of non-executive directors, the
on 11 occasions, proposals were discussed regarding the               majority of whom must be independent. Its chairman shall be
financing of companies or entities related to various directors or    an independent director. It is currently composed of
to those abstaining, and projects were discussed regarding the        independent non-executive directors only.
provision to such companies of other financial services and
regarding sales of interests therein; on 7 occasions, the situation   Its duties, listed in the above-mentioned provisions, conform to
of conflict was due to proposals for appointment or re-election of    the recommendations of the Unified Code for audit committees
the directors; on 5 occasions, the situation arose from the annual    and the internal audit function.
verification of the status of the directors made by the
appointments and remuneration committee at its meeting of 16          The audit and compliance committee has prepared a report
March 2011 pursuant to article 6.3 of the Rules and Regulations       regarding its activities in 2011, which is provided to the
of the Board; on 2 occasions, the conflict was related to the non-    shareholders as a part of the annual documents.
existence of the circumstances set forth in article 23.2 of such
Rules and Regulations; and on one occasion, the matter at hand
was the approval of a corporate social responsibility activity in
favour of a foundation chaired by a director.


66                                                                                                                ANNUAL REPORT 2011
Appointments and remuneration committee                                                           International committee
The Bylaws (article 54) and the Rules and Regulations of the                                      The international committee (article 13 of the Rules and
Board (article 17) provide that this committee is also to be made                                 Regulations of the Board) has the duty to monitor the
up exclusively of non-executive directors and that its chairman                                   development of the Group’s strategy and of the activities,
shall be an independent director, as is in fact the case. All its                                 markets and countries in which the Group desires to have a
current members are independent non-executive directors.                                          presence through direct investments or the conduct of specific
                                                                                                  transactions. It is kept informed of the initiatives and commercial
During financial year 2011, none of the members of the                                            strategies of the various units within the Group and of the new
appointments and remuneration committee was an executive                                          projects arising for it. It is also responsible for reviewing the
director, member of senior management or employee of the                                          performance of financial investments and of the business, as
Bank, and no executive director or member of the senior                                           well as the international economic situation, in order to make, if
management of the Bank sat on the board (or on the                                                appropriate, proposals calculated to correct country-risk limits,
remuneration committee) of companies that employed                                                the structure and profitability thereof and their allocation by
members of the appointments and remuneration committee.                                           business and/or unit.
The Rules and Regulations of the Board establish the duties of                                    It is made up of seven directors, of which three are executive
this committee, including responsibilities in addition to those                                   and four are independent non-executive.
recommended by the Unified Code for appointments and
remuneration committees.
Since 2004, the appointments and remuneration committee has
published an activities report which, since 2006, also includes
the report on director remuneration policy.

Technology, productivity and quality committee
The technology, productivity and quality committee (article 13 of
the Rules and Regulations of the Board) has the duty to review
and report on plans and activities regarding information systems
and programming of applications, investments in computer
equipment, design of operating processes in order to increase
productivity, and programmes for the improvement of service
quality and measuring procedures, as well as those relating to
means and costs.
It is made up of eight directors, three of whom are executive
and five are non-executive; of the five non-executive directors,
four are independent and one is neither proprietary nor
independent.


 Main committees of the board


                                                                                                                                          Audit and   Appointments and
                                                                                                  Executive               Risk          compliance        remuneration
                                                                                                 committee           committee           committee           committee

Nº of members(*)                                                                                        10(**)               5                   5                  5
Executive                                                                                                5(**)               2                    -                  -
Non executive                                                                                            5                   3                   5                  5
Nº of meetings                                                                                          59                  99                  12                 11
Hours(***)                                                                                             295                 297                  60                 33
   (*) Data at year-end 2011.
 (**) At the date of publication of this report, 9 members of which 4 are executive directors.
(***) Estimated hours of average dedication per director.


         ANNUAL REPORT 2011                                                                                                                                        67
International advisory board                                       Composition of the international advisory board by
                                                                   nationality
Since 1997, the board of directors has an international advisory
board, made up of members of various nationalities and from                                  Spain 2
various areas of activity, all of whom come from outside the
Bank and none of whom serve as directors; such international
advisory board cooperates with the board of directors in the                                                         France 2
design, development and, if applicable, implementation of the
overall business strategy by contributing ideas and suggesting           Portugal 1
business opportunities.
During 2011, the international advisory board held 2 meetings,
during which the following issues were discussed, among                        USA 1
others: the euro crisis and the mechanisms for stabilisation of
and support for this currency; the situation in Portugal; the                                                   Mexico 2
Group’s results in 2010 and its performance in 2011; the                      United Kingdom 1
acquisition of Bank Zachodni WBK; the oil market situation; the
Investor Day and the political and economic situation in the US.
It is currently composed of the following 9 members,
representing 6 nationalities:                                      Main areas of professional experience of the international
                                                                   advisory board members
Chairman
Mr Antonino Fernández, former chairman of Grupo Modelo in                                    Financial services 2
Mexico

                                                                                                                     Government 2
Members
Mr Bernard de Combret, chairman of Total Trading Geneve
Mr Carlos Fernández González, chairman and executive vice
president of Grupo Modelo in Mexico
Mr Santiago Foncillas, former chairman of Grupo Dragados                International
                                                                        (Europe) 3
Mr Richard N. Gardner, former US ambassador to Spain                                                        International (Latam) 2
Mr Francisco Pinto Balsemâo, former prime minister of Portugal
Sir George Mathewson, former chairman of the Royal Bank of
Scotland
Mr Antoine Bernheim, honorary chairman of Assicurazioni
Generali S.p.A.
Mr Fernando Masaveu, chairman of Grupo Masaveu


Secretary
Mr Ignacio Benjumea Cabeza de Vaca


68                                                                                                              ANNUAL REPORT 2011
Attendance at meetings of the board                                                                      Attendance rate at meetings of the board
                                                                                                         %
of directors and its committees in
2011


                                                                                                                                               97.1


                                                                                                                                                                                              91.5
                                                                                                                                                                               90.1
                                                                                                                                                             91.9
                                                                                                                                 90.2
Pursuant to the Rules and Regulations of the Board (article
20.1), absences from meetings must be limited to unavoidable
cases. The average attendance rate at board of directors’
meetings in financial year 2011 was 91.5%.


                                                                                                                          2007          2008          2009              2010           2011

                                                                                                        The attendance rate at meetings of the board
                                                                                                        has exceeded 90% in each of the last five years.


 Attendance at meetings of the board of directors and its committees in 2011
 %

                                                                                                                                        Committees

                                                                                         Decision-making                                                       Reporting


                                                                                                                                                 Appointments              Technology,
                                                                                                                             Audit and                   and               productivity
                                                                         Board       Executive                 Risk         compliance           remuneration               and quality International

Average attendance                                                    91.54%           89.15%             87.47%                95.38%                  96.23%                        93.75%         87.50%


Individual attendance:
Mr Emilio Botín-Sanz de Sautuola y García de los Ríos                    13/14           52/59                     –                     –                          –                    2/2            1/1
Mr Fernando de Asúa Álvarez                                              13/14           55/59               91/99                  12/12                  11/11                         2/2              –
Mr Alfredo Sáenz Abad                                                    13/14           54/59                     –                     –                          –                    2/2            1/1
Mr Matías Rodríguez Inciarte                                             14/14           59/59               99/99                       –                          –                      –              –
Mr Manuel Soto Serrano                                                   13/14                 –                   –                12/12                  11/11                         2/2              –
Assicurazioni Generali S.p.A. (1)                                           7/9                –                   –                     –                          –                      –              –
Mr Antonio Basagoiti García-Tuñón                                        14/14           57/59               94/99                       –                          –                    2/2              –
Ms Ana Patricia Botín-Sanz de Sautuola y O’Shea                          12/14           37/59                     –                     –                          –                    1/2            0/1
Mr Javier Botín-Sanz de Sautuola y O’Shea                                13/14                 –                   –                     –                          –                      –              –
Lord Burns (Terence)                                                     10/14                 –                   –                     –                          –                      –              –
                             (2)
Mr Vittorio Corbo Lioi                                                      4/5                –                   –                     –                          –                      –              –
Mr Guillermo de la Dehesa Romero                                         14/14           54/59                     –                     –                 11/11                           –            1/1
Mr Rodrigo Echenique Gordillo                                            14/14           51/59                     –                12/12                  11/11                           –            1/1
Mr Antonio Escámez Torres                                                14/14           59/59               91/99                       –                          –                    2/2            1/1
Mr Ángel Jado Becerro de Bengoa                                          14/14                 –                   –                     –                          –                      –              –
Mr Francisco Luzón López                                                 13/14           48/59                     –                     –                          –                      –            1/1
Mr Abel Matutes Juan                                                     13/14                 –                   –                12/12                           –                      –            1/1
Mr Juan Rodríguez Inciarte                                               12/14                 –             58/99                       –                          –                      –              –
                                   (3)
Mr Luis Ángel Rojo Duque                                                    3/6                –                   –                    3/5                      3/5                       –              –
Mr Luis Alberto Salazar-Simpson Bos                                      13/14                 –                   –                11/12                           –                    2/2              –
                                         (4)
Ms Isabel Tocino Biscarolasaga                                           13/14                 –                   –                     –                       4/4                       –              –

Note: the denominator refers to the number of meetings held during the year during which a director served as such or as a member of the respective committee.
(1) Withdraws from the board on 24 October 2011.
(2) Member of the board since 22 July 2011.
(3) Vacates office upon death on 24 May 2011.
(4) Member of the appointments and remuneration committee since 21 July 2011.


         ANNUAL REPORT 2011                                                                                                                                                                              69
3. Shareholder rights and the
general shareholders’ meeting


One share, one vote, one dividend. Encouragement of informed
No defensive mechanisms            participation of shareholders at
contemplated in the Bylaws         shareholders’ meetings
The Bank has eliminated all defensive mechanisms in the Bylaws,                    The Bank continues to implement measures designed to
fully conforming to the one share, one vote, one dividend                          encourage the informed participation of shareholders at
principle.                                                                         shareholders’ meetings. Thus, at the annual general meeting
                                                                                   held in 2011, the shareholders had access to the electronic
The Bylaws of Banco Santander provide for only one class of                        shareholders’ forum, in compliance with the provisions of the
shares (ordinary shares), granting all holders thereof the same                    Companies Act (Ley de Sociedades de Capital).
rights.
                                                                                   Such forum, which the Bank made available on the corporate
There are no non-voting or multiple-voting shares, or preferences                  website (www.santander.com), enables the shareholders to post
in the distribution of dividends, or limitations on the number of                  proposed supplements to the agenda announced in the call to
votes that may be cast by a single shareholder, or quorum                          meeting, requests for adherence to such proposals, initiatives
requirements or qualified majorities other than those established                  aimed at reaching the percentage required to exercise a minority
by law.                                                                            right contemplated by Law, as well as voluntary proxy offers or
                                                                                   solicitations.
Any person is eligible for the position of director, subject only to
the limitations established by law.                                                Furthermore, the annual accounts and the corporate
                                                                                   management of the Bank and its consolidated group, all for
                                                                                   financial year 2010, were for the first time put to a vote under
                                                                                   separate items on the agenda at the 2011 annual general
Quorum at the annual general                                                       shareholders’ meeting.
shareholders’ meeting held in 2011
The informed participation of shareholders at general
shareholders’ meetings is an objective expressly acknowledged by
the board (article 31.3 of the Rules and Regulations of the
Board).
The quorum at the 2011 annual general shareholders’ meeting
was 53.710%, above 50% for the fifth consecutive year.


Quorum at annual general shareholders’ meetings
% of capital present in person and by proxy
                                  56.6


                                                              55.9
                                                54.6
                    54.4


                                                                            53.7


             2007          2008          2009          2010          2011


70                                                                                                                            ANNUAL REPORT 2011
Information provided to the                                               General shareholders’ meeting held
shareholders and communication                                            in 2011
with them                                                                 Information on the call to meeting,
On occasion of the 2011 annual general shareholders’ meeting,             the establishment of a quorum, attendance,
the chairman once again sent a letter to all shareholders inviting        proxy-granting and voting
them to suggest the matters they would like to see dealt with,            Annual general shareholders’ meeting of 17 June 2011
without prejudice to their rights to receive information and              Notice of the call to meeting was published on 9 May, 38 days
make proposals.                                                           prior to the date of the meeting. A total of 274,517
1,017 letters and e-mails were received, all of which were duly           shareholders attended, in person or by proxy, with
answered.                                                                 4,533,243,123 shares. The quorum was thus 53.710% of the
                                                                          share capital of the Bank.
During 2011, the Bank held 598 meetings with investors and
maintained an on-going relationship with analysts and rating              The average percentage of affirmative votes upon which the
agencies, which entailed personal contact with more than 1,350            proposals submitted by the board were approved was 94.027%.
investors/analysts. In September it was held in London the                The following data are stated as percentages of the Bank’s share
Group’s Investor Day. During two days the top management                  capital:
analysed with the investment community the outlook, trends
and strategic and financial vision for Santander and its most
important business units. More than 300 people attended the                Meeting of 17 June 2011
event.
For the fourth consecutive year, the department of relations              Physically present                                                                    0.408% (1)
with investors and analysts was chosen by investors (buy side) as         By proxy                                                                            34.784% (2)
the best IR Team in the financial industry in Europe, and this year
                                                                          Remote votes                                                                        18.517% (3)
it was also so chosen by analysts (sell side), according to the
survey conducted by the specialised magazine Institutional                Total                                                                               53.710%
Investor. The department also continued to inform the main                (1) Of such percentage (0.408%), 0.002% is the percentage of share capital that attended by remote
investors and analysts of the Group’s policies in the area of                 means through the Internet.
                                                                          (2) The percentage of share capital that granted proxies through the Internet was 0.024%.
corporate social responsibility.
                                                                          (3) Of such percentage (18.517%), 18.512% is the percentage of votes cast by postal mail, and the
                                                                              rest is the percentage of electronic votes.
Santander has continued to strengthen the channels for
shareholder information and service through the seven
shareholder’s offices it has in significant markets in which it is        Resolutions adopted at the general shareholders’
present (Spain, United Kingdom, United States of America,                 meeting held in 2011
Brazil, Mexico, Portugal and Chile).
                                                                          The full text of the resolutions adopted at the 2011 annual
                                                                          general shareholders’ meeting is available on the websites of
Channels for shareholder information and service                          both the Group (www.santander.com) and the CNMV
                                                                          (www.cnmv.es).

Telephone service lines              232,430                 questions
Shareholder’s mailbox                 51,616         e-mails answered
                                     234,065             subscriptions
Forums                                19,819               participants
                                         206                      held
Letters                              677,060          letters answered


Finally, in compliance with recommendations of the National
Securities Market Commission (CNMV) on meetings with
analysts and investors, both notices of meetings and the
documentation to be used thereat are being published
sufficiently in advance.


          ANNUAL REPORT 2011                                                                                                                                              71
4. Banco Santander’s senior management


Composition
The Bank is managed at the highest level through the executive
vice presidents, under the control of the chairman and the chief
executive officer. Accordingly, the chairman, the chief executive
officer and the following executive vice presidents make up the
Bank’s senior management, regardless of their positions, if any,
on the board of directors:


 Banco Santander´s senior management


America                                                                                                                Mr Jesús Mª Zabalza Lotina
Internal Audit                                                                                                              Mr Juan Guitard Marín
Retail Banking Spain                                                                                                   Mr Enrique García Candelas
Global Wholesale Banking                                                                                                Mr Adolfo Lagos Espinosa
                                                                                                                     Mr Jorge Maortua Ruiz-López
Global Private Banking, Asset and Insurance Management                                                                    Mr Javier Marín Romano
Banesto                                                                                                                   Mr José García Cantera(*)
Brazil                                                                                                                  Mr Marcial Portela Álvarez
Communication, Corporate Marketing and Research                                                         Mr Juan Manuel Cendoya Méndez de Vigo
United States                                                                                                            Mr Jorge Morán Sánchez
                                                                                                                     Mr Juan Andrés Yanes Luciani
Strategy and Asia                                                                                                       Mr Juan Rodríguez Inciarte
Consumer Finance                                                                                      Ms Magda Salarich Fernández de Valderrama
Financial and Investor Relations                                                                                   Mr José Antonio Álvarez Álvarez
Financial Accounting and Control                                                                                     Mr José Manuel Tejón Borrajo
Human Resources                                                                                                       Mr José Luis Gómez Alciturri
Risk                                                                                                                  Mr Matías Rodríguez Inciarte
                                                                                                                      Mr Javier Peralta de las Heras
                                                                                                                      Mr José María Espí Martínez
Santander Totta                                                                                                      D. Antonio Vieira Monteiro (**)
Santander UK                                                                                       Ms Ana Patricia Botín-Sanz de Sautuola y O’Shea
                                                                                                                           Mr José María Nus Badía
General Secretariat                                                                                          Mr Ignacio Benjumea Cabeza de Vaca
                                                                                                                          Mr César Ortega Gómez
Technology and Operations                                                                                      Mr José María Fuster van Bendegem
(*) Chief executive officer of Banesto (not an executive vice president of Banco Santander).
(**) Santander’s counntry head in Portugal (not an executive vice president of Banco Santander).


In addition, Mr Ramón Tellaeche Bosch, a deputy executive vice
president of the Bank, is the head of the Payment Means
division, and Mr José Antonio Villasante Cerro, also a deputy
executive vice president of the Bank, is the head of the
Santander Universidades global division.


72                                                                                                                                                     ANNUAL REPORT 2011
Remuneration
Information on the remuneration of executive vice presidents is
provided in note 5 to the Group’s legal report.


Related-party transactions and
conflicts of interest
Related-party transactions
To the knowledge of the Bank, no member of senior
management who is not a director, no person represented by a
member of senior management who is not a director, and no
company in which such persons or persons with whom they act
in concert or who act through nominees therein are directors,
members of senior management or significant shareholders, has
made any unusual or significant transaction with the Bank
during financial year 2011 and through the date of publication
of this report.

Conflicts of interest
The control mechanisms and the bodies in charge of resolving
this type of situation are described in the Code of Conduct in
Securities Markets, which is available on the Group’s website
(www.santander.com).


      ANNUAL REPORT 2011                                          73
5. Transparency and independence


Financial information and other                                    Relationship with the auditor
significant information                                            Independence of the auditor
                                                                   The shareholders acting at the general shareholders’ meeting of
Financial information                                              17 June 2011 approved the re-election of Deloitte, S.L. as
Pursuant to the provisions of its Rules and Regulations (article   auditor for one year, with the affirmative vote of 97.775% of
34.2), the board has taken the necessary actions to ensure that    the capital present in person or by proxy.
the quarterly and semi-annual financial information and the
other information made available to the markets is prepared        The Bank has mechanisms in place to preserve the
following the same principles, standards and professional          independence of the auditor; worth noting is the obligation of
practices as are used to prepare the annual accounts. To such      the board to refrain from hiring audit firms in which the fees
end, the aforementioned information is reviewed by the audit       intended to be paid to them for any and all services are more
and compliance committee prior to the release thereof.             than two per cent of the total income thereof during the last
                                                                   financial year.
As regards the annual accounts, they are reported on by the
audit and compliance committee and certified by the head of        In addition, the Rules and Regulations of the Board establish
financial accounting prior to the preparation thereof by the       limits upon hiring the audit firm for the provision of services
board.                                                             other than audit services that could jeopardise the
                                                                   independence thereof and impose on the board the duty to
Other significant information                                      make public the overall fees paid by the Bank to the auditor for
Pursuant to the provisions of the Code of Conduct in Securities    services other than audit services. The information for financial
Markets, the compliance area is responsible for communicating      year 2011 is contained in note 48 to the Group’s legal report.
to the CNMV the significant information generated in the
Group.                                                             The Rules and Regulations determine the mechanisms to be
                                                                   used to prepare the accounts such that there is no room for
Such communication shall be simultaneous to the release of         qualifications in the auditor’s report. Nevertheless, the Bylaws as
significant information to the market or the media, as soon as     well as the Rules and Regulations also provide that, whenever
the decision in question is made or the resolution in question     the board believes that its opinion must prevail, it shall provide
has been signed or carried out. Significant information shall be   an explanation, through the chairman of the audit and
disseminated in a true, clear, complete and equitable fashion      compliance committee, of the content and scope of the
and on a timely basis and, whenever practicable, such              discrepancy and shall endeavour to ensure that the auditor issue
information shall be quantified.                                   a report in this regard. The annual accounts of the Bank and of
                                                                   the consolidated Group for financial year 2011 are submitted
In financial year 2011, the Bank published 124 material fact       without qualifications.
notices, which are available on the websites of the Group and
the CNMV.                                                          At its meeting of 13 febrero 2012, the audit and compliance
                                                                   committee received from the auditor a written confirmation of
                                                                   its independence in respect of the Bank and the entities directly
                                                                   or indirectly related thereto, as well as information regarding
                                                                   additional services of any kind provided to such entities by the
                                                                   auditors or by entities related thereto, pursuant to the provisions
                                                                   of Legislative Royal Decree 1/2011, of 1 July, approving the
                                                                   Consolidated Audit Act.
                                                                   At its meeting of 13 febrero 2012, such committee issued a
                                                                   report setting forth a favourable opinion regarding the
                                                                   independence of the auditors and passing, among other
                                                                   matters, upon the provision of the additional services mentioned
                                                                   in the preceding paragraph.
                                                                   The aforementioned report, issued prior to the audit report, has
                                                                   the content provided by the Securities Market Act (Ley del
                                                                   Mercado de Valores).


74                                                                                                             ANNUAL REPORT 2011
Intra-group transactions                                            Website
There were no intra-group transactions in financial year 2011       Since 2004, the Group’s website (www.santander.com) has
that were not eliminated in the consolidation process and that      disclosed in the Information for Shareholders and Investors
are not part of the ordinary course of business of the Bank or of   section of the main menu all information required by the
the companies of its Group as regards the purpose and               Companies Act (Ley de Sociedades de Capital) and under Order
conditions thereof.                                                 ECO/3722/2003, thus carrying out the resolution adopted by
                                                                    the board at its meeting of 23 January 2004.
                                                                    The website contents are presented with specific sections for
                                                                    institutional investors and shareholders and the information is
                                                                    accessible in Spanish, English and Portuguese.
                                                                    The information available on such website includes:
                                                                    • The Bylaws.
                                                                    • The Rules and Regulations for the General Shareholders’
                                                                      Meeting.
                                                                    • The Rules and Regulations of the Board.
                                                                    • The professional profiles of and other information regarding
                                                                      the directors, in line with recommendation 28 of the Unified
                                                                      Code.
                                                                    • The annual report.
                                                                    • The annual corporate governance report.
                                                                    • The Code of Conduct in Securities Markets.
                                                                    • The General Code of Conduct.
                                                                    • The sustainability report.
                                                                    • The reports of the audit and compliance committee and the
                                                                      appointments and remuneration committee.
                                                                    • The Santander-Banesto relationship framework established by
                                                                      application of recommendation 2 of the Unified Code.
                                                                    The announcement of the call to the 2012 annual general
                                                                    shareholders’ meeting will be viewable as from the date of
                                                                    publication thereof, together with the information relating
                                                                    thereto, including proposed resolutions and mechanisms for
                                                                    the exercise of the rights to receive information, to grant proxies
                                                                    and to vote, as well as an explanation of the mechanisms
                                                                    for the exercise of such rights by means of data transmission
                                                                    and the rules applicable to the electronic shareholders’ forum
                                                                    that the Bank will make available on its website
                                                                    (www.santander.com).


      ANNUAL REPORT 2011                                                                                                              75
6. Unified Good Governance Code


In 2007, Banco Santander carried out a process of adjustment
to the Unified Good Governance Code, approved by the
                                                                    Number of members of the board
National Securities Market Commision (CNMV) on 22 May 2006,         of directors
based on the principle of self-regulation, which was completed
in 2008 with the approval of new Bylaws and, in 2009, with          Although the current number of directors (18) exceeds the
new Rules and Regulations of the Board of Directors.                maximum number of 15 proposed by recommendation 9, the
                                                                    board believes that its size is commensurate with the scale,
Banco Santander follows practically all of the recommendations      complexity and geographical diversification of the Group. In the
of the Unified Code, and does not follow (i.e., does not adopt in   opinion of the board, the manner in which it operates, sitting
full) a small number of them (3 out of 58). Such                    both as a full body and through committees —with delegated
recommendations from which the Bank departs are described in        supervisory, advisory, reporting and proposal-making powers—,
the following sections, together with the rationale for the         guarantees its effectiveness and the participation of its
board’s position.                                                   members.

                                                                    However, should the board’s proposal regarding the appointment,
                                                                    re-election and ratification of directors is approved by
                                                                    shareholders at the general meeting in March 2012, the number
                                                                    of board members would be reduced to 16, from the 20
                                                                    existing at the beginning of 2011.


76                                                                                                            ANNUAL REPORT 2011
Independent directors                                               The board has also not deemed it appropriate to adopt
                                                                    recommendation 29 to the effect that the term of office of
In the opinion of the board, no different treatment should be       independent directors be limited to a maximum of 12 years, as
established for independent directors vis-à-vis other directors.    this would lead to having to dispense with the services of
                                                                    directors whose continuation on the board serves the corporate
Accordingly, it believes that it would not be in keeping with the   interest because of their qualifications, contribution and
aforementioned principles to adopt recommendation 31 to the         experience, without such continuation affecting their
effect that the board of directors should not propose the           independence.
withdrawal of any independent director prior to the expiration
of the term fixed by the bylaws for which he was appointed,
except for just cause, determined by the board following a
report of the appointments and remuneration committee, with
just cause being deemed to exist whenever such director fails to
perform the duties inherent in his position or if he becomes
subject to any of the circumstances that deprive him of
independence. In this case, the decision of the board not to
adopt recommendation 31 is also based on the fact that there
may be reasons of corporate interest which, in the opinion of
the board itself, may lead to a proposal for withdrawal from the
board for reasons other than those contemplated in the
recommendation.


      ANNUAL REPORT 2011                                                                                                        77
Economic and financial review


78
80   Consolidated financial report

 99   Information by segments
100      1. Principal segments or geographic areas
136      2. Secondary segments or by business


                                                     79
Economic and financial
review


General background                                                       Mexico showed considerable resistance to the international
The global economy continued to slowdown, due to worsening               financial turbulence and weakening of the global economy.
of European sovereign debt crisis and a fall in confidence, with         Based on figures for the first nine months (+4.5% year-on-year
new episodes of uncertainty as of the summer which, sparked              growth in the third quarter), GDP growth for the whole year
tougher funding conditions. This scenario was partly offset by a         was around the potential rate of 4%. This was due to industrial
general softening of monetary policy: injections of liquidity in the     output, investment and the recovery in lending to the private
case of the European Central Bank, a prolongation of low interest        sector, particularly consumer credit, which is expected to
rates in the US and cuts in official interest rates in Latin America.    remain solid in coming quarters despite the external
                                                                         uncertainties.
The US economy grew 1.7%, after growth of 2.8% annualised
in the fourth quarter, which helped to offset part of the drop in        The good activity growth, moderate inflation (3.4% average in
growth in the first half of 2011. This growth, basically due to          2011), which remained within the Bank of Mexico’s target
investment in equipment and the external sector, gradually gave          range (2%-4%), and an external position favoured by higher oil
way to greater participation of consumption and investment in            prices enabled the central bank to hold its key interest rate at
non-residential construction, which will remain in coming                4.5%, keeping its leeway. The peso depreciated during the year,
quarters and put the growth rate at around its potential.                after ending the year at MXN 13.95/$1, the result of
                                                                         international financial tensions in the second half of the year.
The impact of oil prices and greater use of installed capacity
raised inflation to more than 3% in the middle of the year.              The Chilean economy grew 6.3%, partly due to the weakness in
However, the underlying rate remained under control at around            the beginning of 2010 following the earthquake. Growth was
1.5%, enabling the Federal Reserve to maintain a very                    on a downward trend, more so in the second half of the year
accommodating monetary policy in favour of growth and re-                because of international tensions, which is expected to continue
establish the interbank market.                                          because of a weaker external environment and flagging private
                                                                         consumption.
Latin America kept up good growth rates for the year as a
whole, although lower than in 2010. In the second half the               Inflation remained under control (3.3% average), enabling the
impact of the downturn in the global economy and the drop in             central bank to stop raising interest rates in the second half of
raw material prices began to be felt. In order to counter the            the year (+200 b.p. between January and June to 5.25%). The
impact on growth, some central banks began to soften their               spurt in inflation in the last part of the year (4.4% in December)
monetary policies, which is still going on. This strategy is likely to   is considered temporary, which would allow the central bank to
be replicated by other central banks during 2012.                        maintain leeway for softening monetary policy and fostering
                                                                         growth, as reflected in January when it cut the rate by 25 b.p.
Brazil’s growth eased to 3.0% from 4.2% year-on-year in the              to 5%. The peso, like other main currencies in the region,
first quarter and subsequent deceleration, which reached a low           depreciated, ending the year at CLP 519/$1.
in the third quarter. The downturn led the central bank to begin
to gradually cut the Selic rate from 12.50% in September to              The euro zone grew 1.6% in 2011. After a robust start, activity
10.50% in January 2012, a trend that will continue in the                slowed due to risks appearing that threatened the recovery
coming months.                                                           (greater than envisaged impact of the rise in raw material prices
                                                                         and Japan’s earthquake), coupled with, in the second half of the
A softer monetary policy and buoyant domestic demand, backed             year, management of the sovereign debt crisis that did not
by a solid labour market (jobless rate at its lowest, less than 5%),     convince the markets. Fourth quarter GDP shrank 0.3%, a fall
will continue to fuel growth. Inflation remained high (6.5% in           expected to carry on into early 2012.
December) and in some months above the central bank's target
(4.5+2%). As regards the currency, the evolution of interest rates in    Inflation remained above the ECB’s target throughout the year
the second half of the year and the measures to control an               (2.7% vs. 2%) and in December began a downward path (from
excessive appreciation of the real produced a depreciation for the       3.0% to 2.8%) that could see inflation moving towards the
year as a whole. The real ended 2011 at BRL 1.87/$1 (BRL 1.66/$1         target.
in 2010).


80                                                                                                                   ANNUAL REPORT 2011
In this context of sharp slowdown and uncertainty, the ECB            Summary of 2011 for Grupo Santander
undid in the fourth quarter the two rises in its rates carried out    Grupo Santander registered attributable profit of EUR 5,351
in the first half of the year (from 1.0% to 1.5%) and ended           million in 2011, a decline of 34.6% from 2010. Profit would
2011 with a repo rate of 1%. Furthermore, it re-established           have been EUR 7,021 million, a decline of 14.2%, if the bank
unconventional liquidity facilities and in December made a new        had not made pre-tax provisions in the fourth quarter against
auction (3 years without a volume limit) which will be repeated       property exposure in Spain of EUR 1,812 million and a pre-tax
in February 2012. The intensified tensions in the euro zone and       amortisation of EUR 601 million from goodwill related to
the slower growth caused the euro to gradually weaken against         Santander Totta. The bank also applied net capital gains of EUR
the dollar and end the year at EUR 1/$1.29 (EUR 1/$1.34 in            1,513 million realised in 2011 to other provisions.
2010).
                                                                      In an environment that was once again complex in many
There are significant divergences and prospects in the euro           markets where it operates, Santander continued to prove the
zone. The worst countries are the so called peripheral ones,          robustness of its business model, which is adapted to the
which face a greater loss of confidence and high funding costs        various markets and environments. Differentiated management
combined with the shrinkage effect of fiscal adjustment policies.     enables Santander to generate high recurring profits, while
Germany, on the other hand, is in a better situation, with GDP        improving, at the same time, the Group’s positioning for the
growth of 3.0% in 2011 and an unemployment rate of 6.8%,              coming years.
the lowest rate since 1991. However, like the euro zone, fourth
quarter growth shrunk 0.2% which could be corrected in the            The pillars of Santander’s model are the focus on the customer
short term.                                                           and on commercial business, geographic diversification, the
                                                                      continuous striving to improve efficiency, prudence in risk and
The Spanish economy expanded 0.7% in 2011, fuelled by                 discipline in capital and liquidity. All of this enhanced by the
exports, which offset the weak domestic demand. Growth                Santander brand, which is recognised as one of the world’s
slowed and GDP contracted 0.3% in the fourth quarter, due to          leading financial brands.
anaemic consumption. The continuation of these trends,
combined with the impact of the large deficit reduction process,      The key points in 2011 were:
point to a return to recession, according to all forecasts. In this
context, inflation, which remained high (3.2% average), largely       1) Solid generation of recurring profits. In the last few
due to higher energy prices, fell significantly in the last part of      years Grupo Santander has been able to keep on increasing
the year (2.4% in December).                                             its revenues which, as well as setting us apart from the
                                                                         sector, enabled net operating income (pre-provision profit) to
The UK showed similar growth levels and profiles: +0.9% for the          continue to grow and reach EUR 24,373 million in 2011.
whole of 2011 and shrinkage in the fourth quarter (0.8%
annualised). This reflected the worsening international financial       This figure makes Santander one of the best banks in the
and trade situation, and weak domestic demand, which is                 world in these terms. It also shows an excellent evolution
expected to continue in coming quarters, although partly offset         during the four years of the crisis, as profits before provisions
by a more stable labour market.                                         amounted to EUR 90,000 million.

Inflation was high throughout the year (4.5% average) but on a          This capacity to generate such results makes the income
downward path (4.2% in December as against 5.2% in                      statement very solid and gives it a substantial cushion for
September) which will continue in 2012. The Bank of England,            absorbing provisions in the most demanding environments.
which held its base rate at 0.5%, increased its programme to            The 2011 income statement continues to reflect the
buy bonds by £75,000 million in October, which was added to             diversification and management focuses adapted to each
the £200,000 million already acquired. Sterling appreciated             market:
against a euro weakened by the sovereign debt crisis to £1/EUR
1.20 (£1/EUR 1.16 in 2010).                                             – By areas, growth in net operating income in emerging
                                                                          markets (Latin America and, in local criteria, Poland). There
                                                                          was also an increase in the units of developed countries
                                                                          where the macroeconomic environment is still weak but
                                                                          the units are benefiting from the business moment (US
                                                                          and consumer business, ahead in the cycle). All of this is in
                                                                          stark contrast to the sharp fall in profits in markets such as
                                                                          Spain and Portugal, hard hit by intense deleveraging, as
                                                                          well as the lower level in the UK which was very affected
                                                                          by the cost of regulatory impacts.
                                                                        – By lines, of note was the growth in revenues (+5.3%). Net
                                                                          interest income and net fees increased at a good pace in a
                                                                          scenario of lower activity in developed markets, very low
                                                                          interest rates and upward pressure of funding costs. On
                                                                          the other hand, the negative impact of gains on financial
                                                                          transactions of the operating areas, especially in Global
                                                                          Banking and Markets.


     ANNUAL REPORT 2011                                                                                                                81
– Total operating costs increased 9.3%, reflecting a                 management model, together with the capacity to assign
       differentiated management on the basis of markets and              profits to provisions, make the evolution of the credit quality
       businesses. Most of the rise was due to capture growth in          ratios compare very well with those of other banks in the
       emerging markets. The efficiency ratio was 44.9%, the              main countries where we operate.
       best among comparable banks.
                                                                          This led to the Group’s NPL ratio stabilising in the last two
2) Effort in provisions to strengthen the balance sheet.                  quarters. It ended 2011 at 3.89% and coverage was 61%.
   As well as the recurring profits, Grupo Santander decided to
   realise provisions net of taxes of EUR 3,183 million, of which      4) Strengthening the capital position. Grupo Santander
   EUR 1,513 million were drawn from capital gains and EUR                once again displayed its financial strength and flexibility by
   1,670 million from the fourth quarter profits.                         anticipating compliance with the European Banking
                                                                          Authority’s capital requirement, which has to be reached by
     The bank charged EUR 1,812 million pre-tax provisions against        June 2012. The Group was able to carry out various
     the fourth quarter earnings to cover real estate exposure in         measures to raise its core capital ratio from 7.53% to 9.01%,
     Spain and EUR 601 million in pre-tax provisions to amortise          in accordance with the EBA’s criteria.
     goodwill related to the businesses in Santander Totta.
                                                                          At the same time, the increase in the last quarter meant that
     Moreover, net capital gains of EUR 1,513 million generated in        the core capital ratio, in accordance with the BIS II
     2011 were also assigned to provisions, including charges             international standard, rose by 122 b.p. to 10.02% from
     against investment portfolios of EUR 620 million, and                8.80% in December 2010. For the fifth year running, the
     amortisation of intangibles and contributions to pensions and        Group improved its solvency.
     other contingencies of EUR 893 million.
                                                                       5) Solid funding structure and liquidity ratios. After a year
     The aforementioned provisions made for real estate risk              of tensions in the markets, particularly in the second half,
     pushed up coverage of foreclosed properties in Spain to              Santander managed to maintain a solid liquidity position,
     50%, while coverage of doubtful and substandard loans with           thanks to its considerable capacity in the retail market via its
     a real estate purpose was also improved (33% and 16%                 branches, and its broad and diversified access to wholesale
     respectively).                                                       markets via its model of subsidiaries. Another factor at play in
                                                                          the current context is deleveraging in some markets.
     These increases in coverage anticipated part of the new
     requirements outlined in the Royal Decree 2/2012 which               The loan-to-deposit ratio ended 2011 at 117% compared to
     came into force on February 3, to increase provisions for real       150% at the beginning of the crisis in 2008.
     estate assets in the Spanish financial system.
                                                                          Moreover, the Group maintained in 2011 a very conservative
     In the case of Grupo Santander, such requirements amount             policy in medium- and long-term wholesale issues. The
     to EUR 6,100 million, and will be entirely met in 2012, as           volume issued was higher than the maturities during the
     follows:                                                             year.
     • EUR 1,800 million already charged against 2011 results.         6) High shareholder return. The total shareholder
                                                                          remuneration was EUR 0.60 per share, including the scrip
     • EUR 2,000 million are a capital buffer required by the rules       dividend, thereby maintaining the remuneration for the last
       and already covered by the capital surplus held by the             two years.
       Group.
                                                                       7) Better positioning of the Group. In the last few years,
     • The remaining EUR 2,300 million will be covered through            Santander has continued to combine organic growth
       capital gains which may be obtained during the year                initiatives in key countries with active management of the
       (including EUR 900 million from the capital gain obtained          business portfolio, enabling it to end the year in a more
       from the sale of Banco Santander Colombia) and through             diversified position and with greater future growth potential.
       ordinary contributions to provisions during 2012.
                                                                          During 2011, some of the pending agreements announced at
3) High level of credit quality. Grupo Santander’s risk


Exchange rates: 1 euro / currency parity

                                                                                              2011                                  2010
                                                                        Year-end            Average           Year-end            Average

$                                                                         1.2939            1.3903              1.3362             1.3228
Pound sterling                                                            0.8353            0.8675              0.8608             0.8570
Brazilian real                                                            2.4159            2.3244              2.2177             2.3262
New Mexican peso                                                         18.0512           17.2523             16.5475            16.6997
Chilean peso                                                            671.3400          672.0923            625.2748           673.9214
Argentine peso                                                            5.5686            5.7445              5.3074             5.1737
Colombian peso                                                        2,509.5191        2,568.6527          2,565.5040         2,507.2221
Uruguayan peso                                                           25.8133           26.7630             26.5904            26.4588
Polish zloty                                                              4.4580            4.1105              3.9750             3.9931


82                                                                                                                 ANNUAL REPORT 2011
the end of 2010 materialised and other operations were           Rating agencies
  carried out to increase and restructure the Group’s presence     The Group’s access to wholesale finance markets, as well as the
  in emerging countries and developed with great potential for     cost of issues, depend, to some extent, on the ratings given by
  Santander.                                                       rating agencies.
  As regards the Group’s incorporations, the acquisition of the    These agencies regularly review the Group’s ratings. The long-
  Polish bank BZ WBK was completed (it began to consolidate        term debt rating depends on a series of endogenous factors
  in the Group in the second quarter), as well as of the retail    (solvency, business model, capacity to generate profits, ...) and
  business of Skandinaviska Enskilda Banken (SEB Group) in         other exogenous ones related to the general economic
  Germany, which entered the Group in the first quarter.           environment, the sector’s situation and the sovereign risk of the
                                                                   countries in which it does business.
  The transaction with the insurer Zurich was also completed in
  order to reorganise bancassurance business in Latin America      Since autumn the difficulties in resolving the problems of
  and new partners entered the capital of Santander Consumer       European countries, which have required financial assistance,
  USA, where the Group holds a 65% stake.                          together with worsening of the euro zone’s growth
                                                                   expectations, have produced a fall in confidence and a rise in
  These operations together with the economic cycle in the         tensions on European sovereign debt. This situation led to a
  various geographic areas, increased the contribution of          widespread and significant downgrading of the sovereign
  emerging countries up to 54% of the operating areas              ratings of many European countries, which, in turn, resulted in
  attributable profit.                                             actions on the rating of their banks.
  Lastly, agreement was reached to sell the subsidiary in          Between October 2011 and February 2012, the Kingdom of
  Colombia, which will probably be completed during the first      Spain’s credit rating was cut one notch by DBRS from AA to AA
  half of 2012. This sale will generate capital gains of around    (low), three by Standard & Poor’s (from AA to A) and four in the
  EUR 615 million, which will also be assigned to strengthening    case of Moody’s (from Aa2 to A3) and Fitch (from AA+ to A),
  the balance sheet.                                               maintaining the negative outlook in all of them.
As regards the main segments (geographic), the main                These movements led to a review of Banco Santander’s ratings,
developments were:                                                 which in February 2012 were as follows:
• Continental Europe: attributable profit was 15.1% lower at
  EUR 2,849 million, hard hit by the low growth environment
  and deleveraging and low interest rates, as well as the          Rating Agencies
  negative impact of gains on financial transactions and fee
  income. Profits fell at the three commercial networks and at                            Long         Short    Stand-
  wholesale businesses, while Santander Consumer Finance                                  term          term     alone       Outlook
  performed well (+51.5% in attributable profit) and Poland’s
                                                                   Standard & Poor’s         A+          A-1         a      Negative
  BZ WBK was incorporated to the Group in April.
                                                                   Fitch Ratings              A           F1         a      Negative
• United Kingdom: attributable profit of EUR 1,145 million         Moody’s                  Aa3           P1        B-      Negative
  (£993 million), 41.0% less than in 2010 in local currency. The   DBRS                AA (low)   R1(medium)                Negative
  income statement was very affected by the environment of
  low activity, low interest rates, regulatory changes, higher
  funding costs and the PPI charge. On the other hand, costs
  were almost flat and fewer provisions were made, reflecting      Lastly, after its latest review, Standard & Poor’s put Banco
  the good evolution of non-performing loans.                      Santander’s long-term rating one notch above the Spanish
                                                                   sovereign credit rating. Fitch and DBRS give the Bank the same
• Latin America: attributable profit of EUR 4,664 million,         rating as the Kingdom of Spain, and following the recent
  similar to 2010 without the impact of exchange rates, thanks     downgrading by Moody's of Spanish sovereign debt the Bank’s
  to the dynamism of net interest income and fee income,           rating is three notches above that of the Kingdom of Spain. At
  which lifted gross income by 9.5%. This offset the higher        the date of publication of this report, Moody’s was reviewing
  costs from investments, the pressure of inflation on salaries    Banco Santander’s rating.
  and higher provisions.
• Sovereign: attributable profits of EUR 526 million ($732
  million), 30.3% higher in local currency than in 2010.
  Revenues and provisions performed well and costs rose
  because of investments in technology and commercial
  structures.


     ANNUAL REPORT 2011                                                                                                              83
Grupo Santander generated an attributable profit of EUR 5,351
Grupo Santander. Results                                                                   million, 34.6% less than the EUR 8,181 million posted in 2010.
                                                                                           Earnings per share (EPS) were EUR 0.6018 (-36.1%).
      Solid profit generation: the Group generated over
      EUR 24,000 million in net operating income for the                                   The following factors need to be taken into account in order to
      first time ever (pre-provision profit), improving for the                            interpret the results appropriately.
      ninth year running.
                                                                                           • In the second half of the year, the economic environment
      Big effort to strengthen the balance sheet:                                            deteriorated considerably, which is leading to lower global
      extraordinary provisions of EUR 3,183 million net of                                   growth.
      tax, of which EUR 1,513 were capital gains and EUR
      1,670 million fourth quarter profits.                                                • In the fourth quarter the bank made provisions for EUR 3,183
                                                                                             million net of tax, of which EUR 1,513 million came from
      Recurring profit amounted to EUR 7,021 million,
                                                                                             capital gains and EUR 1,670 million from fourth quarter
      14.2% less than in 2010:
                                                                                             profits (EUR 1,812 million gross) to be assigned to real estate
      • Gross income rose 5.3% reaching historic highs,                                      provisions in Spain, and EUR 601 million for the amortisation
        withstanding the cycle in mature markets and                                         of Santander Totta's goodwill.
        recovering in emerging ones.
                                                                                           • In addition, the profit reflects a one-off charge in the second
      • Differentiated management of costs by unit.                                          quarter of EUR 620 million (£538 million) net of tax from a
      • Loan-loss provisions increased 3.0% due to the                                       provision made in the second quarter related to Payment
        lower release of generic ones, as specific provisions                                Protection Insurance (PPI) remediation in the UK.
        were 9.8% lower.


 Income statement
 Million euros

                                                                                                                                Variation
                                                                                            2011                2010             amount            %              2009

Net interest income                                                                       30,821             29,224                1,597          5.5        26,299
Dividends                                                                                     394                362                   32         8.9            436
Income from equity-accounted method                                                             57                 17                  40      235.1               (1)
Net fees                                                                                   10,471              9,734                 737          7.6          9,080
Gains (losses) on financial transactions                                                    2,500              2,606                (106)        (4.1)         3,423
Other operating income/expenses                                                                 18               106                  (88)     (82.8)            144
Gross income                                                                              44,262             42,049                2,213          5.3        39,381
Operating expenses                                                                       (19,889)           (18,196)              (1,694)         9.3       (16,421)
  General administrative expenses                                                        (17,781)           (16,256)              (1,525)         9.4       (14,825)
      Personnel                                                                          (10,326)             (9,330)               (996)       10.7          (8,450)
      Other general administrative expenses                                                (7,455)            (6,926)               (528)         7.6         (6,374)
  Depreciation and amortisation                                                            (2,109)            (1,940)               (169)         8.7         (1,596)
Net operating income                                                                      24,373             23,853                  519          2.2        22,960
Net loan-loss provisions                                                                 (10,562)           (10,258)                (304)          3.0        (9,484)
Impairment losses on other assets                                                            (173)              (471)                 298      (63.4)           (402)
Other income                                                                               (2,822)            (1,072)             (1,749)      163.1          (1,311)
Profit before taxes (w/o capital gains)                                                   10,817             12,052              (1,235)      (10.2)         11,764
Tax on profit                                                                              (2,936)            (2,923)                 (12)         0.4        (2,336)
Profit from continuing operations (w/o capital gains)                                       7,881              9,129             (1,248)      (13.7)           9,427
Net profit from discontinued operations                                                        (24)               (27)                   3       (9.3)             31
Consolidated profit (w/o capital gains)                                                     7,857              9,102             (1,245)      (13.7)           9,458
Minority interests                                                                             836                921                 (85)       (9.2)            516
Attributable profit to the Group (w/o capital gains)                                        7,021              8,181             (1,160)      (14.2)           8,943
Net extraordinary capital gains and provisions (1)                                         (1,670)                  —             (1,670)           —              —
Attributable profit to the Group                                                            5,351              8,181             (2,830)      (34.6)           8,943

EPS (euros)                                                                              0.6018              0.9418            (0.3400)       (36.1)        1.0454
Diluted EPS (euros)                                                                      0.5974              0.9356            (0.3382)       (36.1)        1.0382

Pro memoria:
  Average total assets                                                                1,228,382           1,190,361               38,021          3.2     1,099,018
  Average shareholders' equity                                                           74,901              69,334                5,567          8.0        64,335
(1) In 2009 extraordinary capital gains and extraordinary provisions for the same amount are included, and thus the net amount is zero.


84                                                                                                                                           ANNUAL REPORT 2011
• The impact of the exchange rates of various currencies against         • Net interest income rose 5.5% to EUR 30,821 million. This
  the euro was not very significant at around one percentage               was due to the net impact of several factors.
  point negative in comparing revenues and costs with 2011. In
  the UK and Latin America, the impact was one percentage                   – There was a positive effect from the moderate increase in
  point negative and in Sovereign five percentage points                      volumes and the improvement in the spreads on loans for
  negative.                                                                   the whole Group (from 3.64% to 3.89%).

• Lastly, there is a positive impact of around three or four points         – Spreads on deposits which compared negatively in the first
  in revenues and costs from the change in perimeter. This                    half of the year, are already at the same levels (0.28% in
  impact is the net effect of the entry into consolidation of Bank            2010 and 0.29% in 2011).
  Zachodni WBK, AIG in Poland and SEB in Germany (Santander
                                                                            – Negative impact from the higher cost of wholesale funding
  Retail) and lower revenues from insurance business, as the
                                                                              and the greater regulatory requirements for liquidity in
  operation with Zurich Financial Services was closed in the
                                                                              some countries, mainly the UK.
  fourth quarter.
                                                                         • Net fee income increased 7.6%, with a favourable
The performance of the income statement and comparisons
                                                                           performance of those from insurance and services. The latter
with 2010 was as follows:
                                                                           showed rises in almost all lines: cards, demand deposits, etc.
Basic revenues (net interest income, fee income and insurance              On the other hand, income from securities and custody was
results) amounted to EUR 41,685 million, 6.0% more than in                 lower and virtually unchanged from mutual and pension
2010 (+4.8% excluding the perimeter and exchange rate                      funds.
effects).


Quarterly
Million euros

                                                                                                2010                                              2011
                                                             Q1           Q2           Q3          Q4          Q1           Q2           Q3          Q4

Net interest income                                       7,122       7,378        7,396        7,329       7,514        7,638        7,700       7,969
Dividends                                                     47        144            60         111           40         193            60        101
Income from equity-accounted method                            3            5            5           4            5            5           6          40
Net fees                                                  2,326       2,483        2,481        2,445       2,595        2,729        2,694       2,454
Gains (losses) on financial transactions                    724         567          599          715         657          722          639         482
Other operating income/expenses                               38          38           22            9          41           (2)          18         (38)
Gross income                                            10,260      10,614       10,563       10,613      10,852       11,285       11,117      11,008
Operating expenses                                       (4,263)     (4,548)      (4,687)      (4,698)     (4,824)      (4,908)      (4,994)     (5,164)
  General administrative expenses                        (3,812)     (4,070)      (4,206)      (4,168)     (4,314)      (4,380)      (4,456)     (4,631)
     Personnel                                           (2,182)     (2,317)      (2,408)      (2,421)     (2,521)      (2,550)      (2,611)     (2,644)
      Other general administrative expenses              (1,629)     (1,753)      (1,798)      (1,746)     (1,792)      (1,830)      (1,845)     (1,987)
  Depreciation and amortisation                            (451)       (478)        (481)        (531)       (510)        (528)        (538)       (534)
Net operating income                                      5,997       6,066        5,876        5,915       6,029        6,377        6,123       5,843
Net loan-loss provisions                                 (2,436)     (2,483)      (2,935)      (2,404)     (2,188)      (2,684)      (2,906)     (2,785)
Impairment losses on other assets                            (57)        (63)         (41)       (310)         (48)         (52)         (84)          11
Other income                                               (331)       (362)        (364)          (16)      (550)      (1,379)        (361)       (531)
Profit before taxes (w/o capital gains)                   3,173       3,158        2,535        3,186       3,243        2,262        2,773       2,538
Tax on profit                                              (734)       (680)        (634)        (874)       (888)        (636)        (778)       (634)
Profit from continuing operations (w/o capital gains)     2,439       2,477        1,901        2,311       2,355        1,627        1,995       1,904
Net profit from discontinued operations                      (12)          (1)          (4)        (10)          (6)          (0)        (15)          (3)
Consolidated profit (w/o capital gains)                   2,427       2,476        1,897        2,301       2,349        1,626        1,980       1,901
Minority interests                                           212         246          262          201         241          234          177         184
Attributable profit to the Group (w/o capital gains)      2,215       2,230        1,635        2,101       2,108        1,393        1,803       1,717
Net extraordinary capital gains and provisions                 —           —            —            —           —            —            —     (1,670)
Attributable profit to the Group                          2,215       2,230        1,635        2,101       2,108        1,393        1,803           47

EPS (euros)                                             0.2553      0.2574       0.1884       0.2408      0.2382       0.1569       0.2030      0.0037
Diluted EPS (euros)                                     0.2537      0.2558       0.1854       0.2406      0.2364       0.1558       0.2007      0.0045


     ANNUAL REPORT 2011                                                                                                                                 85
Net interest income                                                    As regards the rest of revenues, dividends collected amounted
Million euros                                                          to EUR 394 million (EUR 362 million in 2010), while income
                                                                       accounted for by the equity method was EUR 57 million, up
+ 5.5%    2011-2010                                                    from EUR 17 million in 2010. This increase benefited from the
                                                                       recording in the fourth quarter of insurance business in Latin
                                                                       America.


                                                         30,821
                                             29,224
                                                                       Total gross income was EUR 44,262 million (EUR 42,049
                             26,299                                    million in 2010), 5.3% more than in 2010 (+4.0% excluding the
                                                                       perimeter and exchange rate effects).
                                                                       Operating expenses rose 9.3% and 6.8% excluding the
                                                                       perimeter and exchange rate effects. The year-on-year
                                                                       performance varied throughout the Group, depending on the
                                                                       environment and strategy followed in each unit.
                      2009            2010            2011
                                                                       In Europe, both the large retail units (Santander Branch Network,
                                                                       Banesto and Portugal) as well as the UK recorded falls in expenses
                                                                       in real terms. Of note were the reductions of 2.5% at Banesto,
Net fees                                                               2.1% in Portugal and 1.2% in the Santander Branch Network.
Million euros
                                                                       The global units (GBM and Asset Management and Insurance)
+ 7.6%    2011-2010                                                    registered higher growth in expenses (+4.1%) because of
                                                                       investments in equipment and technology with the double
                                                                       purpose of strengthening the positions attained in key markets
                                                         10,471


                                                                       and businesses in previous years, and developing new initiatives.
                                             9,734


                                                                       Moreover, there is also an increase in expenses resulting from
                             9,080


                                                                       the incorporation of new entities, mainly Bank Zachodni WBK in
                                                                       Poland and SEB in Germany.
                                                                       In Latin America, costs also rose due to the drive in new
                                                                       commercial projects, the increase in installed capacity, the
                                                                       restructuring of points of attention, particularly in Brazil, and the
                      2009            2010            2011             revision of collective bargaining agreements in an environment
                                                                       of higher inflation. Sovereign also registered single digit growth
                                                                       in costs.
                                                                       Net operating income (pre-provision profit) was EUR 24,373
• Results from insurance activity were 3.9% higher at EUR              million, 2.2% more than the EUR 23,853 million registered in
  393 million (EUR 378 million in 2010) and were affected by           2010.
  the completion of the operation with Zurich Financial Services,
  which meant reduced revenues in the fourth quarter.                  Net operating income was particularly noteworthy as it set a
                                                                       new record. It rose for the ninth year running and exceeded EUR
Gains on financial transactions dropped 4.1%, due to the               24,000 million for the first time, placing Santander among the
net impact of two factors. On the one hand, the reduced                best banks in the world for its profit generation capacity.
revenues from the operating areas, mostly GBM (Global Banking
and Markets), which were weak in the last three quarters of            The efficiency ratio was 44.9% with amortisations and 40.2%
2011, very affected by the environment, compared to strong             without amortisations (43.3% and 38.7%, respectively, in 2010).
results in 2010, mainly in the first half of the year. On the other
hand, Corporate Activities registered profits in hedging of
exchange rates in 2011 as against losses in 2010.
Gains on financial transactions as a proportion of total revenues
dropped from 6.2% in 2010 to 5.6% in 2011.


Net fees
Million euros

                                                                                                   Variation
                                                                       2011            2010         amount                %              2009

Fees from services                                                     6,171          5,632             538              9.6         5,267
Mutual & pension funds                                                 1,236          1,267              (31)           (2.4)        1,178
Securities and custody                                                   668            784            (117)          (14.9)           774
Insurance                                                              2,397          2,051             346            16.9          1,861
Net fee income                                                        10,471          9,734             737              7.6         9,080


86                                                                                                                  ANNUAL REPORT 2011
This performance showed the Group’s capacity to continue to          Gross income and expenses
generate revenues in a difficult context and comfortably absorb      Billion euros
the provisions made for loan losses, which at EUR 10,562
million were 3.0% more than in 2010. This increase was due to                Gross income
the reduced release of generic provisions, as based on just                  Expenses
specific ones there was a decline of 9.8%.


                                                                                                                                              44.3
Similar comments can be made for Spain, where total provisions


                                                                                                                  42.1
rose 13.6% and specific ones dropped 32.0%. There were


                                                                                       39.4
significant reductions in provisions in the UK, Sovereign and
Santander Consumer Finance (even with the incorporation of


                                                                                                                                                     19.9
new units). Provisions in Latin America excluding Brazil also


                                                                                                                            18.2
dropped. However, they rose strongly in Portugal, reflecting the


                                                                                               16.4
economic difficulties, and in Brazil because of the greater
growth in lending of around 20% and an increase in the
sector’s NPLs in previous quarters.
                                                                                     2009                      2010                       2011
Net operating income after provisions was EUR 13,811
million, 1.6% more than in 2010 (+1.1% excluding the
perimeter and exchange-rate impacts).                                Net operating income
                                                                     Billion euros
There were notable rises in these results in Santander
Consumer Finance (+46.8%), Sovereign (+33.6%) and almost            + 2.2%      2011-2010
all Latin American units such as Brazil (+2.9%), Mexico
(+12.4%), Argentina (+8.2%), Puerto Rico (+42.4%) and
Colombia (+43.1%). On the other hand there were declines in


                                                                                                                                      24.4
                                                                                                                         23.9
the UK (-8.4%), after absorbing the significant effects of the


                                                                                                        23.0
regulatory changes, as commented on in greater detail in the
relevant section. There were larger falls in Spain (-30.4%) and
Portugal (-56.2%).
Asset impairment losses and other results were EUR 2,995
million negative compared to EUR 1,543 million, also negative,
in 2010, largely due to the charge made in the second quarter
for EUR 842 million gross for payment protection insurance (PPI)                                 2009           2010               2011
remediation in the UK.
Profit before tax was 10.2% lower at EUR 10,817 million
                                                                    After deducting the tax charge profit from continued
(excluding the perimeter and exchange rate effects: -10.6% ).
                                                                    operations was EUR 7,881 million (-13.7%). Recurring
The tax charge of EUR 2,936 million was almost the same as in
                                                                    attributable profit, after incorporating discontinued operations
2010, mainly due to a higher rate in Brazil, Sovereign and
                                                                    and minority interests, was EUR 7,021 million (-14.2%).
Corporate Activities.


Operating expenses
Million euros

                                                                                                               Variation
                                                                    2011                      2010              amount                         %              2009

Personnel expenses                                                  10,326              9,330                      996                       10.7            8,450
General expenses                                                     7,455              6,926                      528                        7.6            6,374
  Information technology                                               875                798                       77                        9.7              786
  Communications                                                       659                670                      (12)                      (1.7)             632
  Advertising                                                          695                634                       62                        9.7              594
  Buildings and premises                                             1,667              1,553                      114                        7.4            1,405
  Printed and office material                                          178                178                        (0)                     (0.2)             209
  Taxes (other than profit tax)                                        401                376                       25                        6.5              313
  Other expenses                                                     2,980              2,718                      263                        9.7            2,436
Personnel and general expenses                                     17,781              16,256                    1,525                        9.4           14,825
Depreciation and amortisation                                        2,109              1,940                      169                        8.7            1,596
Total operating expenses                                           19,889              18,196                    1,694                        9.3           16,421


     ANNUAL REPORT 2011                                                                                                                                         87
Net loan-loss provisions
Million euros

                                                                                                                                         Variation
                                                                                                             2011             2010        amount             %               2009

Non performing loans                                                                                       12,368            11,457          911             7.9            10,516
Country-risk                                                                                                    (7)               2            (9)            —               (117)
Recovery of written-off assets                                                                             (1,800)           (1,201)        (598)           49.8              (915)
Total                                                                                                     10,562            10,258           304             3.0             9,484


                                                                                                             Moreover, and as it was already commented on, the bank made
Profit before tax
Million euros
                                                                                                             provisions for EUR 3,183 million net of tax, of which EUR 1,513
                                                                                                             million came from capital gains and EUR 1,670 million from
-10.2%          2011-2010                                                                                    fourth quarter profits. After these impacts, attributable profit
                                                                                                             was EUR 5,351 million.
                                                                                                             Earnings per share were EUR 0.6018, 36.1% less than in
                                                                                                             2010 and slightly affected by the capital increases in 2011 to
                                                           12,052
                                     11,764


                                                                                                             convert Valores Santander (convertible bonds) and tend to the
                                                                       10,817


                                                                                                             remuneration in shares for those shareholders that chose this
                                                                                                             option, as no adjustment was made retroactively to the number
                                                                                                             of shares of previous periods.
                                                                                                             The Group's ROE was 7.14% and ROTE (measured as
                                                                                                             attributable profit / shareholders equity less goodwill) was
                              2009                  2010            2011                                     10.81% (9.37% and 14.18%, respectively, on the basis of
                                                                                                             recurring attributable profit).


Attributable profit to the Group
Million euros

-34.6%          2011-2010
                                     8,943


                                                           8,181


                                                                       5,351


                              2009                  2010            2011


Extraordinary capital gains and provisions
(net of tax) Million euros

                                                                       -3,183
                                      Impact on                                                                        Funds established
                                 attributable profit:
                                                                                                                          before tax
                                   -1,670 million
                                                                       -1,670     Not required                     Spain real estate   1,812
                                       1,513                                                                       Portugal goodwill     601
            Sale of Insurance
              Holding Latam                   641                                 Amortisation of intangibles,
                                                                           -893
                                                                                  pensions and other
                      SCF USA
                                              872                          -620   Portfolio writedowns
                   transaction

                                 capital gains*                      provisions

     (*) Not including capital gains from agreement to sell the bank in Colombia, which are to be registered in 2012


88                                                                                                                                                      ANNUAL REPORT 2011
Balance sheet
Million euros

                                                                                         Variation
                                                                  2011          2010      amount           %          2009
Assets
Cash on hand and deposits at central banks                      96,524        77,785      18,739        24.1        34,889
Trading portfolio                                              172,637       156,762      15,875        10.1       135,054
  Debt securities                                               52,704        57,871       (5,168)       (8.9)      49,921
   Customer loans                                                8,056           755        7,301      966.7        10,076
   Equities                                                      4,744         8,850       (4,107)     (46.4)        9,248
   Trading derivatives                                         102,498        73,069      29,429        40.3        59,856
   Deposits from credit institutions                             4,636        16,216     (11,581)      (71.4)        5,953
Other financial assets at fair value                            19,563        39,480     (19,917)      (50.4)       37,814
   Customer loans                                               11,748         7,777        3,971       51.1         8,329
   Other (deposits at credit institutions, debt securities
      and equities)                                               7,815        31,703    (23,888)      (75.4)        29,485
Available-for-sale financial assets                              86,612        86,235          378        0.4        86,621
   Debt securities                                               81,589        79,689       1,900         2.4        79,289
   Equities                                                       5,024         6,546      (1,522)     (23.3)         7,331
Loans                                                           779,525       768,858      10,667         1.4       736,746
   Deposits at credit institutions                               42,389        44,808      (2,419)       (5.4)       57,641
   Customer loans                                               730,296       715,621      14,675         2.1       664,146
   Debt securities                                                6,840         8,429      (1,589)     (18.9)        14,959
Investments                                                       4,154           273       3,881          —            164
Intangible assets and property and equipment                     16,840        14,584       2,257        15.5        11,774
Goodwill                                                         25,089        24,622          466        1.9        22,865
Other                                                            50,580        48,901        1,679        3.4        44,602
Total assets                                                 1,251,525     1,217,501      34,024          2.8    1,110,529

Liabilities and shareholders' equity
Trading portfolio                                               146,949       136,772      10,177         7.4       115,516
   Customer deposits                                             16,574         7,849       8,725      111.2          4,658
   Marketable debt securities                                        77           365        (288)     (78.8)           586
   Trading derivatives                                          103,083        75,279      27,804       36.9         58,713
   Other                                                         27,214        53,279    (26,064)      (48.9)        51,559
Other financial liabilities at fair value                        44,908        51,020      (6,111)     (12.0)        42,371
   Customer deposits                                             26,982        27,142         (160)      (0.6)       14,636
   Marketable debt securities                                     8,185         4,278       3,907       91.3          4,887
   Due to central banks and credit institutions                   9,741        19,600      (9,859)     (50.3)        22,848
Financial liabilities at amortized cost                         935,669       898,969      36,700         4.1       823,403
  Due to central banks and credit institutions                  116,368        79,537      36,832        46.3        73,126
   Customer deposits                                            588,977       581,385       7,593         1.3       487,681
   Marketable debt securities                                   189,110       188,229          880        0.5       206,490
   Subordinated debt                                             22,992        30,475      (7,482)     (24.6)        36,805
   Other financial liabilities                                   18,221        19,343      (1,122)       (5.8)       19,300
Insurance liabilities                                               517        10,449      (9,932)     (95.1)        16,916
Provisions                                                       15,571        15,660           (89)     (0.6)       17,533
Other liability accounts                                         25,052        23,717        1,335         5.6       20,919
Total liabilities                                            1,168,666     1,136,586      32,080          2.8    1,036,659
Shareholders' equity                                             80,895        77,334        3,562         4.6       71,832
   Capital stock                                                  4,455         4,165           290        7.0        4,114
   Reserves                                                      72,660        66,258        6,402         9.7       61,071
   Attributable profit to the Group                               5,351         8,181      (2,830)     (34.6)         8,943
   Less: dividends                                               (1,570)       (1,270)        (300)      23.6        (2,297)
Equity adjustments by valuation                                  (4,482)       (2,315)     (2,166)       93.6        (3,165)
Minority interests                                                6,445         5,896           549        9.3        5,204
Total equity                                                    82,859        80,914        1,944         2.4       73,871
Total liabilities and equity                                 1,251,525     1,217,501      34,024          2.8    1,110,529


      ANNUAL REPORT 2011                                                                                                  89
Total managed funds at the end of 2011 amounted to EUR
Grupo Santander. Balance sheet                                    1,382,980 million, of which 90%, EUR 1,251,525 million, were
                                                                  on-balance sheet and the rest off-balance sheet mutual and
      Activity continued to reflect the market context:           pension funds and managed portfolios.

      • Lower demand for loans in Europe, especially in           Two factors need to be taken into account in the year-on-year
        Spain and Portugal, and double-digit growth in            comparisons:
        Latin America.
                                                                  • A slightly positive perimeter impact from the net effect of the
      • In funds, preference for deposits and conservative          following changes in the Group’s composition:
        policy in issues.
                                                                     – Positive impact from the consolidation of Banco Zachodni
      • Loan-to-deposit ratio of 117% (150% at the start               WBK in Poland, the incorporation to the Group in 2011 of
        of the crisis).                                                SEB’s retail banking business in Germany (Santander Retail)
      Core capital ratio (BIS II) of 10.02%, after rising for          into Santander Consumer Finance and the acquisition of GE
      the fifth year running.                                          Capital Corporation's mortgage portfolio in Mexico and of
                                                                       Creditel in Uruguay.
      The European Banking Authority’s target has                    – Negative impact from Santander Consumer USA, which in
      already been reached: core capital ratio of 9.01%.               December stopped consolidating by global integration and
                                                                       moved to consolidation by the equity accounted method,
      Shareholders’ equity per share increased again to                and Latinoamerica’s bancassurance business.
      EUR 8.62.
                                                                  • The second effect came from the appreciation/depreciation of
                                                                    various currencies against the euro (end of period rates). Both
                                                                    the dollar and sterling appreciated by 3%, while the main
Distribution of total assets by geographic segment                  Latin American currencies depreciated: Brazilian real and
December 2011                                                       Mexican peso (8%); Chilean peso (7%) and the Argentine
                                                                    peso (5%). The net impact of both is virtually zero.

              Sovereign 5%    Other 5%                            The joint impact of the two effects on changes in customer
Other Latin America 3%                                            balances was minimal (less than one percentage point positive),
         Chile 3%                           Spain 27%
                                                                  both on lending as well as managed customer funds.
     Mexico 3%                                                    Lending
                                                                  The Group’s customer loans amounted to EUR 769,036 million,
     Brazil 13%                                                   3.4% higher than in 2010. Eliminating the exchange rate and
                                                                  perimeter effects it was 3.0% higher.
                                                Portugal 4%
                                               Germany 3%         The geographic distribution (principal segments) was also very
                                             Retail Poland 1%     different by markets.
                                           Other
                                           Europe 5%
      United Kingdom 28%


Customer loans
Million euros

                                                                                             Variation
                                                                   2011          2010         amount               %              2009

Public sector                                                     12,147        12,137               10           0.1         9,803
Other residents                                                  202,411       217,497        (15,086)           (6.9)      222,355
  Commercial bills                                                 9,679        11,146          (1,466)        (13.2)        11,134
  Secured loans                                                  117,946       127,472          (9,526)          (7.5)      125,397
  Other loans                                                     74,785        78,879          (4,094)          (5.2)       85,824
Non-resident sector                                              554,478       514,217          40,262            7.8       468,267
  Secured loans                                                  342,676       311,048          31,627          10.2        286,381
  Other loans                                                    211,802       203,168           8,634            4.2       181,886
Gross customer loans                                            769,036       743,851          25,185             3.4      700,424
Loan-loss allowances                                              18,936        19,697             (761)         (3.9)       17,873
Net customer loans                                              750,100       724,154          25,946             3.6      682,551
Pro memoria: Doubtful loans                                       31,287        27,908            3,379          12.1        24,027
    Public sector                                                    102            42               60        142.0             18
    Other residents                                               14,745        12,106            2,639          21.8         9,898
    Non-resident sector                                           16,439        15,759              680            4.3       14,111


90                                                                                                           ANNUAL REPORT 2011
In Continental Europe, Spain and Portugal’s lending fell by           Gross customer loans
4.6% and 5.6%, respectively, due to deleveraging. Santander           Billion euros
Consumer Finance’s lending dropped 4.8%, due to the impact
of the consolidation by the equity accounted method of               + 3.4%*       2011-2010
Santander Consumer USA in December 2011 (+16.1% before               * Excluding exchange rate impact: +3.8%
this impact). The incorporation of Bank Zachodni WBK increased


                                                                                                                                769
the Group’s net lending by EUR 8,479 million.


                                                                                                                      744
Gross customer loans in Spain amounted to EUR 225,288


                                                                                                       700
million, with the following structure:
• Loans to the public sector amounted to EUR 12,147 million,
  (+0.1%).
• Lending to individuals amounted to EUR 84,816 million, of
  which EUR 58,535 million were mortgages for homes. These                                      2009           2010         2011
  are the healthiest part and with the least risk of further
  deterioration of the portfolio in Spain because of the different
  features of this product compared to similar ones in other
  countries. For example, the principle is amortised as of the        Gross customer loans
  first day, the borrowers' responsibility extends to all their       % o/ operating areas. December 2011
  assets and almost all loans are for residences in ownership,
  with a very low expected loss.                                                                         Sovereign 5%
                                                                         Other Latin America 2%
  In the specific case of Grupo Santander, the portfolio is mostly                   Chile 3%
                                                                                Mexico 3%
  composed of mortgages that are for the first residence, with
  large concentration of loans in the lowest tranches of loan-to-                                                                     Spain 29%
                                                                             Brazil 11%
  value (88% with an LTV lower than 80%) and the NPL ratio is
  very low (2.7%).
• Loans to SMEs and companies without real estate purpose,
  the most relevant part of the lending portfolio, amounted to                                                                         Portugal 4%
  EUR 104,883 million and accounted for 47% of the total. Of
                                                                                                                                  Germany 4%
  note was the stability shown during the year (-0.4%) within                                                                  Retail Poland 1%
  an environment of widespread reduction of lending in the                United Kingdom 34%                                Other
  whole system.                                                                                                             Europe 4%

• Loans for real estate purposes (with the greatest risk) stood at
  EUR 23,442 million, after falling in every quarter of 2011. The
  total reduction for the year was EUR 3,892 million (-14.2%).
                                                                      Loan portfolio in Spain
                                                                      Billion euros
  The Group maintained in the year the strategy of previous
  years to reduce exposure to this segment of greater risk. The
                                                                                                                  245


  total reduction in the last three years amounts to EUR 14,246            Total                                               236


                                                                                                                                             225
  million (-37.8%).                                                        Public Sector                          10
                                                                                                                               12
In Portugal, the fall in lending (5.6%) came from all segments:            Household mortgages                    64
                                                                                                                                             12

-11.8% to SMEs, -13.9% to companies and -3.1% to                                                                               61
                                                                                                                                             59
individuals. In addition, balances in construction and real                Other loans to individuals             31
                                                                                                                               30
estate, which represent only 3.6% of lending in the country,                                                                                 26
declined 12.1% in 2011.
                                                                           Companies without real
Santander Consumer Finance’s lending, after the operation at               estate purpose
                                                                                                                 108           105
                                                                                                                                            105
Santander Consumer USA, dropped 4.8%. Excluding this
impact, growth was 16.1% due to organic growth plus SEB’s
integration in Germany. New lending rose 11.1%.                            Real estate purpose                    31           27            23
                                                                                                                 2009        2010          2011


     ANNUAL REPORT 2011                                                                                                                              91
Credit risk management*
 Million euros

                                                                                                    Variation
                                                                       2011             2010         amount                             %        2009

Non-performing loans                                                  32,036           28,522            3,514                 12.3         24,554
NPL ratio (%)                                                           3.89             3.55         0.34 p.                                 3.24
Loan-loss allowances                                                  19,661           20,748          (1,087)                 (5.2)        18,497
  Specific                                                            15,474           14,901              572                  3.8         11,770
  Generic                                                              4,187            5,846          (1,659)               (28.4)          6,727
NPL coverage (%)                                                          61               73           (11 p.)                                 75
Credit cost (%) **                                                      1.41             1.56        (0.15 p.)                                1.57

Ordinary non-performing and doubtful loans ***                        18,318           18,061             257                      1.4      17,641
NPL ratio (%) ***                                                       2.26             2.28        (0.02 p.)                                2.35
NPL coverage (%) ***                                                     107              115            (8 p.)                                105

* Excluding country-risk
** Net specific allowance / computable assets
*** Excluding mortgage guarantees
Note: NPL ratio: Non-performing loans / computable assets


In the United Kingdom, the balance of customer loans was              Bad and doubtful loans amounted to EUR 32,036 million,
4.6% higher. In local criteria, the stock of residential mortgages,   12.3% more than in 2010.
in a still depressed market, were very stable, while loans to SMEs
increased 25.4%, gaining further market share. Personal loans,        The Group’s NPL ratio was 3.89% at the end of 2011 (+34 b.p.),
reflecting the policy in the last few years of reducing them,         but it only rose by 11 b.p. in the second half of the year (+3 b.p.
declined 12.7%.                                                       in the fourth quarter).

Lending in Latin America increased 17.9% excluding the                In order to cover these loans, total loan-loss provisions
exchange rate impact, due to organic growth and the                   amounted to EUR 19,661 million, of which 21% (EUR 4,187
incorporation of GE Capital Corporation's mortgage portfolio in       million) were generic provisions.
Mexico and of Creditel in Uruguay. Loans in local currency rose
                                                                      Since the end of 2008, total loan-loss provisions have increased
20.3% in Brazil, 7.3% in Chile and 30.9% in Mexico (+22.4%
                                                                      by EUR 6,800 million (+53%), reflecting the efforts made in the
excluding the perimeter impact).
                                                                      last three years. The Group’s NPL coverage is 61%, negatively
Sovereign’s loans rose 6.0% in dollars, due to the 4.5%               affected by some 3 percentage points because of the operation
increase in the most attractive mortgage segments (residential        at Santander Consumer USA.
and multifamily), and the acquisition of a consumer credit
                                                                      The NPL ratios by units and countries are set out below:
portfolio from GE. Both effects comfortably offset the exit from
higher risk segments and from those not considered strategic          • The NPL ratio in Spain is 5.49%, well below the sector’s
for the Group.                                                          average, and coverage 45% (4.24% and 58%, respectively, in
                                                                        2010).
Continental Europe accounted for 42% of the Group’s total
lending (29% Spain), the UK 34%, Latin America 19% (11%
Brazil) and Sovereign 5%. These percentages in 2010 were 45%
for Continental Europe (32% Spain), 32% the UK, 18% Latin              Loan-loss allowances
America (10% Brazil) and 5% (Sovereign).                               Million euros

Risks                                                                 -5.2%    2011-2010
                                                                                                                   20,748


The still weak scenario in some markets continued to push up
                                                                                                                               19,661
                                                                                                   18,497


non-performing loans, linked both to the rise in bad and
doubtful loans (the numerator) as well as the slower growth in
lending (denominator), which in some cases were declines.                                                         5,846      4,187
                                                                                       Generic    6,727
Despite this, the active management of risk is reflected in a
slower pace of growth in the Group’s NPLs in the last few                                                                    15,474
                                                                                                                  14,901
quarters.                                                                              Specific   11,770

The Group's annual risk premium was 1.67% at December
2011, well below the maximum of 2.47% reached in the third                                        2009            2010       2011
quarter of 2009.


92                                                                                                                          ANNUAL REPORT 2011
Around 90% of the portfolio (including mortgages and
                                                                     Non-performing loans
  companies) has an NPL ratio of 3.3%. The ratio for mortgages       Million euros
  to buy homes is 2.7% and 3.5% for the rest of the portfolio
  (public sector, individual customers and companies without                                                2011               2010                    2009
  real estate purposes). In both cases, NPLs increased
  moderately.                                                        Balance at beginning of period         28,522            24,554                  14,191
                                                                       Net additions                        15,381            13,478                  18,234
  The rise in the total ratio was thus due to loans with a real        Increase in scope of consolidation      925               257                   1,033
  estate purpose (ratio of 28.6%). This ratio reflects, on the one     Exchange differences                   (362)            1,147                     890
  hand, the greater NPLs in this segment and, on the other, the        Write-offs                         (12,430)          (10,913)                  (9,795)
  Group’s anticipative policy to sharply reduce balances in this     Balance at period-end                 32,036            28,522                  24,554
  segment.
  Doubtful loans with a real estate purpose amounted to EUR
  6,772 million. Their coverage rose by 4.p.p. to 33%.
  Another EUR 3,916 million was recorded as substandard, all         NPL ratio
  of which is up-to-date with payments. These balances are           %
  16% covered (+ 4 p.p.).
  The gross balance of foreclosed properties at the end of 2011
  was EUR 8,552 million, and after the provisions made in the
  fourth quarter of the year coverage rose to 50% from 31% in
  2010.                                                                                                                                         3.89
                                                                                                                            3.86
                                                                                                          3.78
  These coverage levels signify that Santander has already                  3.55
                                                                                           3.61
  anticipated a significant part of the new requirements
  outlined in the Royal Decree 2/2012, which came into force
  on February 3, 2012 and will be entirely met during the year,
  through the existing capital buffer, ordinary contributions to
  provisions and applying the capital gains which may be
                                                                          Dec’10         Mar’11          Jun’11          Sep’11                Dec’11
  obtained during the year (including EUR 900 million from the
  capital gain obtained from the sale of Banco Santander
  Colombia).
• Portugal’s NPL ratio rose 116 b.p. to 4.06%, using the
  Group’s criteria, while coverage was 55%, 5 p.p. less than in      NPL ratio in Spain
  2010. In local criteria, Santander Totta has a lower NPL ratio     %
  than its competitors.
• Santander Consumer Finance reduced its NPL ratio for the                                                            28.6 Real estate purpose
  sixth quarter running to 3.77%, with coverage of 113%. The                                      17.0
  evolution during the year was determined by the
  consolidation in December of Santander Consumer USA by
                                                                         11.1
  the equity accounted method as, without this effect, coverage
  was 9 p.p. higher.
• In the UK the NPL ratio was 1.86%, slightly higher than in                                      4.2                 5.5    Total portfolio Spain
  2010 (+10 b.p.), while coverage was 38% (46% in 2010).
                                                                          3.4                      3.1                3.5    Other portfolio
  Because of its importance in the Group’s overall lending, the           2.5                                         2.7    Household mortgages
                                                                                                   2.2
  NPL ratio of mortgages was 1.46% (1.41% in 2010), while                 2.4
  the average loan-to-value was 53%.
                                                                             2009                 2010            2011
  Another indicator of this portfolio’s good performance is the
  small volume of foreclosed homes (EUR 160 million, or only
  0.07% of total mortgage lending portfolio). Efficient
  management of these cases and a dynamic market for this
  kind of housing enable sales to be made in a short period,
  contributing to the good results.


     ANNUAL REPORT 2011                                                                                                                                    93
• Brazil’s NPL ratio was 5.38% (+47 b.p.). This increase was due         Customer funds under management
  to the small rise in the sector and to higher growth in lending        Total managed funds amounted to EUR 984,353 million,
  to individuals, basically consumer credit and cards. Santander         almost the same as in 2010 (-0.1%). After deducting the
  Brazil’s performance was better than that of the country’s             perimeter and forex effects, which had a marginal impact, the
  other private sector banks, the most comparable collective.            reduction was 0.8%.
  Coverage was 95%.
                                                                         Customer deposits rose 2.6% and 4.5% including retail
• The NPL ratio of Latin America ex-Brazil was 2.89% and                 commercial paper in Spain and Brazil’s letras financeiras.
  coverage an excellent 102%. Its comparison is affected by the          Mutual and pension funds declined 9.8%, affected by the
  incorporation in the second quarter of GE Capital                      greater focus on capturing on-balance sheet funds.
  Corporation's mortgage portfolio in Mexico. Excluding it, the
  ratio improved in every quarter of 2011 (-25 b.p. for the              Deposits in Continental Europe were very similar to 2010 at
  whole year), while coverage was 104% (-6 p.p.).                        EUR 49,400 million (-0.1%) and 25.0% higher than at the end
                                                                         of 2009. This reflected the strong campaign in 2010, a large
• Sovereign’s NPL ratio, after declining in the last eight quarters,     part of which was retained in 2011. To this is added the
  was 2.85%, much better than the 4.61% in 2010 (-176 b.p.).             favourable impact of the entities incorporated to the Group.
  Coverage was 96% (+21 p.p.).
                                                                         • In Spain, the strategy followed in the renewal of funds
Lastly, specific loan-loss provisions for the whole Group, after           captured in the 2010 campaign was to give priority to
deducting write-offs recovered, amounted to EUR 11,137                     improved costs over volumes. As a result, deposits fell 7.2%.
million (1.41% of average credit risk in the last 12 months),              However, if one compares the balances at the start of the
down from EUR 12,342 million in 2010 (1.56%).                              campaign with those at the end of 2011, growth was more
                                                                           than EUR 18,800 million (+12.1%). To this is added, the retail
Net provisions represented 1.4% of loans, well below the 3.3%              commercial paper sold during the year, which made the
represented by net operating income/lending.                               changes -4.0% for 2011 and +16.0% for the last two years.
                                                                           This policy of emphasis on balance sheet funds was reflected
Further information on the evolution of credit risk, particularly
                                                                           in a fall in mutual funds.
real estate risk in Spain, control and monitoring systems and
internal risk models to calculate provisions is included in the
section on Risk Management in this annual report.


Customer funds under management
Million euros

                                                                                                    Variation
                                                                          2011          2010         amount              %              2009

Public sector                                                             6,528        9,655          (3,127)        (32.4)        13,293
Other residents                                                         165,095      161,096           3,999             2.5      126,189
  Demand deposits                                                        68,389       67,077           1,312             2.0       61,000
  Time deposits                                                          61,185       81,145        (19,960)         (24.6)        49,177
  REPOs                                                                  35,520       12,873          22,647         175.9         16,012
Non-resident sector                                                     460,911      445,625          15,286             3.4      367,495
  Demand deposits                                                       220,299      210,490           9,808             4.7      195,823
  Time deposits                                                         197,249      197,590             (341)          (0.2)     148,485
  REPOs                                                                  33,275       30,623            2,652            8.7       18,403
  Public Sector                                                          10,089        6,922            3,167           45.7        4,784
Customer deposits                                                      632,533      616,376          16,158              2.6     506,976
Debt securities                                                         197,372      192,872            4,499            2.3      211,963
Subordinated debt                                                        22,992       30,475          (7,482)         (24.6)       36,805
On-balance-sheet customer funds                                        852,898      839,723          13,175              1.6     755,744
Mutual funds                                                            102,611      113,510        (10,898)            (9.6)     105,216
Pension funds                                                             9,645       10,965          (1,320)         (12.0)       11,310
Managed portfolios                                                       19,199       20,314          (1,115)           (5.5)      18,364
Savings-insurance policies                                                   —           758             (758)      (100.0)         9,422
Other customer funds under management                                  131,456      145,547        (14,091)            (9.7)     144,313
Customer funds under management                                        984,353      985,269             (916)          (0.1)     900,057


94                                                                                                                 ANNUAL REPORT 2011
• Santander Consumer Finance’s deposits increased 27.9% due              Customer funds under management
  to organic growth and the entry of Santander Retail in                 Billion euros
  Germany which, with its welcome campaign, increased its
  balances by EUR 2,500 million.                                        -0.1%*       2011-2010
                                                                        * Excluding exchange rate impact: +0.5%
• Portugal increased its customer deposits by 8.0% and
  significantly improved its liquidity position for the second year


                                                                                                                     985


                                                                                                                               984
  running and surpassed its commercial gap reduction target for


                                                                                                    900
  the year.                                                                      Other                               146      131               -9.7%
                                                                                                   144                        220
                                                                                                                     223                        -1.3%
                                                                                 Other
• The incorporation of Bank Zachodni WBK contributed EUR                         on-balance        249
  12,383 million of customer funds to the Group, of which EUR                    sheet sheet
  10,359 million were deposits.
                                                                                                                              633               +2.6%
In the UK, customer deposits increased 2.2% in sterling and                      Deposits          507
                                                                                                                     616
mutual funds rose 6.3% in 2011.
In Latin America (excluding the balances in the New York
branch, which are more volatile), deposits without repos
                                                                                                  2009              2010      2011
increased 9.1% excluding the exchange rate impact. Good
evolution of the three main countries: Brazil (+16.4%, including
the letras financeiras), Mexico (+10.4%) and Chile (+18.5%),
with increases in both time and demand deposits except for
Brazil in demand deposits. Mutual funds dropped 2.3% in Brazil,          Customer funds under management
10.4% in Chile and rose 2.8% in Mexico. The overall reduction            % o/ operating areas. December 2011
for the whole region was 1.7%.
                                                                                                            Sovereign 5%
Lastly, Sovereign’s deposits increased 11.6% in dollars.                   Other Latin America 3%
                                                                                       Chile 4%
Continental Europe accounted at the end of 2011 for 37% of                       Mexico 4%
                                                                                                                                       Spain 28%
managed customer funds (28% Spain), the UK 32%, Latin
America 26% (Brazil 15%) and Sovereign 5%. These
percentages in 2010 were 39% for Continental Europe (30%                      Brazil 15%
Spain), 31% for the UK, 26% for Latin America (15% Brazil) and
4% for Sovereign.                                                                                                                         Portugal 3%
                                                                                                                                        Germany 4%
As well as capturing large volumes of funds in the last two years,
                                                                                                                                      Retail Poland 1%
the Group, for strategic reasons, maintained an active policy of                                                                     Other Europe 1%
issuing securities in the international fixed income markets.                    United Kingdom 32%
The Group issued in 2011 EUR 40,390 million of medium- and
long-term issues, as follows: EUR 26,464 million of senior debt;
EUR 13,664 million of covered and territorial bonds and EUR
262 million of subordinated debt.


Mutual funds
Million euros

                                                                                                                  Variation
                                                                         2011                  2010                amount                 %              2009

Spain                                                                   27,425              34,310                  (6,885)           (20.1)            40,616
Portugal                                                                 1,866               3,209                  (1,343)           (41.8)             3,982
Poland                                                                   1,747                                       1,747
United Kingdom                                                          15,744             14,369                    1,375               9.6          10,937
Latin America                                                           55,829             61,621                   (5,792)             (9.4)         49,681
Total                                                                 102,611            113,510                  (10,898)             (9.6)        105,216


     ANNUAL REPORT 2011                                                                                                                                     95
Pension funds
 Million euros

                                                                                                 Variation
                                                                     2011            2010         amount                %              2009

Spain                                                                8,884         9,650             (765)            (7.9)        9,912
   Individuals                                                       7,670         8,161             (491)            (6.0)        8,429
   Collective plans                                                    249           262               (13)           (5.0)          266
   Group employee plans                                                965         1,227             (262)          (21.4)         1,217
Portugal                                                               760         1,315             (555)          (42.2)         1,398
Total                                                                9,645        10,965          (1,320)          (12.0)         11,310


This issuing activity underscores the Group’s capacity to access     More information on the management of financing in the
the different institutional markets via its more than ten units      markets, the framework for managing liquidity and the
with issuing capacity, including the parent bank, Banco              structural position of the Group’s liquidity can be found in the
Santander, and its main subsidiaries in the countries where it       Risk Management section of this annual report (“Management
operates: Banesto, Santander Totta, Santander                        of funding and liquidity risk”).
UK/Chile/Brazil/Mexico, Sovereign and the units of Santander
Consumer Finance. These issues were made at higher prices            Other items of the balance sheet
than in 2010 because of the greater tensions and volatility in       Total goodwill was EUR 25,089 million, EUR 466 million more
markets.                                                             than in 2010, due to the net impact between the increase from
                                                                     the incorporations of BZ WBK, Santander Retail in Germany, GE
As regards securitisations, the Group’s subsidiaries placed in the   Capital Corporation's mortgage portfolio in Mexico and Creditel
market in 2011 a total of EUR 24,831 million, mainly in the UK.      in Uruguay and the reductions resulting from the amortisation
                                                                     of EUR 601 million of goodwill in Santander Totta, the
Maturities of medium and long-term debt amounted to EUR              Santander Consumer USA consolidation by the equity
32,497 million, of which EUR 18,006 million was senior debt,         accounted method and exchange rates.
EUR 7,439 million covered bonds, EUR 5,109 million
subordinated debt and EUR 1,943 million preferred shares.            Trading derivatives rose strongly, both in assets and liabilities
                                                                     (+EUR 29,429 million and +EUR 27,804 million, respectively),
This capturing of stable funds, via deposits, retail commercial      due to the evolution of the market value, mainly interest rate
paper and issues, combined with the trend of moderate growth         swaps. The balance at the end of 2011 was EUR 102,498
in lending, kept the loan-to-deposit ratio at 117% (the same as      million in assets and EUR 103,083 million in liabilities.
in 2010), and put the ratio of deposits plus medium and long-
term funding to the Group’s loans at 113%, underscoring the          Equity stakes increased from EUR 273 million to EUR 4,154
appropriate structure of funding the Group’s lending.                million, largely due to consolidation by the equity accounted
                                                                     method at Santander Consumer USA and the insurance
                                                                     operation in Latin America.
 Loans / deposits*. Total Group                                      Balances with central banks have increased for both deposits
 %                                                                   and assets, after the liquidity injections by central banks in the
                                                                     countries where we operate, mainly the euro zone. The
* Including retail commercial paper                                  European Central Bank adopted extraordinary measures on
                                                                     monetary policies, including the expansion of collateral and
                                                                     liquidity auctions at three years.
                                      135


                                                                     The Group continued to go to these auctions and deposit in the
                                                   117


                                                            117


                                                                     ECB most of the funds captured, significantly increasing the
                                                                     liquidity buffer and improving its structure by replacing short-
                                                                     term maturities by longer term funding. The only Group entity
                                                                     that has a net structural borrowing position from the ECB is
                                                                     Santander Totta (close to EUR 4 billion).
                                                                     The balance of financial assets available for sale rose 0.4% from
                             2009           2010         2011
                                                                     EUR 86,235 in 2010 to EUR 86,612 million in 2011.


96                                                                                                                ANNUAL REPORT 2011
Total equity and capital with the nature of financial liabilities
 Million euros

                                                                                                              Variation
                                                                       2011                  2010              amount                        %                 2009

Capital stock                                                          4,455                4,165                 290                       7.0             4,114
Additional paid-in surplus                                            31,223               29,457               1,765                       6.0            29,305
Reserves                                                              41,688               36,993               4,695                      12.7            31,796
Treasury stock                                                          (251)                (192)                 (58)                    30.3                (30)
Shareholders' equity (before profit and dividends)                   77,115               70,423                6,692                       9.5           65,186
Attributable profit                                                    5,351                8,181              (2,830)                    (34.6)            8,943
Interim dividend distributed                                          (1,429)              (1,270)               (159)                     12.5            (1,285)
Interim dividend not distributed (1)                                    (408)              (2,060)              1,652                     (80.2)           (2,837)
Shareholders' equity (after retained profit)                         80,629               75,273                5,356                       7.1           70,006
Valuation adjustments                                                 (4,482)              (2,315)             (2,166)                     93.6            (3,165)
Minority interests                                                     6,445                5,896                 549                       9.3             5,204
Total equity (after retained profit)                                 82,592               78,854                3,738                       4.7           72,045
Preferred shares and securities in subordinated debt                   5,896                7,352              (1,456)                    (19.8)            7,745
Total equity and capital with the nature
 of financial liabilities                                            88,488               86,207                2,282                        2.6          79,791

(1) In 2011, estimated data of May 2012 scrip dividend.


Shareholders’ equity and solvency ratios                               Capital ratios (BIS II)
Total shareholders’ equity, after retained profits, increased EUR      %
5,356 million (+7.1%) to EUR 80,629 million, due to reserves.
Shareholders’ equity per share at the end of 2011 stood at EUR                    14.19
8.62 (+EUR 0.04). This was the fifth year of increase.


                                                                                                                           13.56
                                                                                                      13.11
A total of 579,921,105 shares were issued in 2011, as follows:
                                                                                                                                     11.01      BIS II Ratio
• In February, 111,152,906 shares were issued for the scrip                               110.08              10.02
  dividend that month when 86.7% of capital opted to receive                                                                         10.02      Tier I
  the amount equivalent to the third interim dividend charged                              8.61               8.80
  to 2010’s earnings in shares.                                                                                                                 Core capital

• In October, 1,223,457 shares were issued to meet the
  exchange of 3,458 Valores Santander.
                                                                                2009                 2010                 2011
• In November, 125,742,571 shares for that month’s scrip
  dividend were issued when 73.0% of capital opted to receive
  the amount equivalent to the second interim dividend
  charged to 2011’s earnings in shares.
                                                                       Computable capital and BIS II ratio
• In December, 341,802,171 shares were issued to tend to the           Million euros
  repurchase of 77,743,969 preferred shares.
                                                                                                                                   2011            2010        2009
Shareholders’ equity and capital with the nature of financial
liabilities amounted to EUR 88,488 million at the end of 2011         Core capital                                              56,694         53,205      48,366
(+EUR 2,282 million), after incorporating minority interests,         Basic capital                                             62,294         60,617      56,615
preferred shares and valuation adjustments. Of note in the fall in    Supplementary capital                                     15,568         20,670      24,309
valuation adjustments (EUR 2,166 million) was the negative            Deductions                                                (1,090)        (2,011)     (1,221)
impact on the value of stakes in foreign subsidiaries of exchange     Computable capital                                       76,772         79,276      79,704
rates (partly covered by hedging).                                    Risk-weighted assets                                     565,958        604,885     561,684

In addition, it includes the negative impact of exchange rates on     BIS II ratio                                                  13.56      13.11           14.19
goodwill, neutral for the purposes of the capital ratios, as it         Tier I (before deductions)                                  11.01      10.02           10.08
occurred in the same way in their recording in assets.                  Core capital                                                10.02       8.80            8.61

                                                                      Shareholders' equity surplus (BIS II)                        31,495     30,885      34,769


       ANNUAL REPORT 2011                                                                                                                                         97
Grupo Santander’s equity eligible for applying the BIS II criteria                       The EBA's estimated additional capital needs for Grupo
amounted to EUR 76,772 million, EUR 31,495 million above the                             Santander amounted to EUR 15,302 million. This amount has
minimum requirement (+70%).                                                              been obtained as follows:
The core capital ratio was 10.02% (+60 b.p. in the fourth                                • EUR 6,829 million through Valores Santander, which have to
quarter) and 122 b.p. higher during the year after absorbing the                           compulsorily be converted into shares before the end of
impact of the incorporation of BZ WBK and the charge in the                                October 2012.
UK for PPI, registered in the second quarter. This was the fifth
consecutive annual improvement in the Group’s solvency.                                  • EUR 1,943 million through the exchange of preferred shares
                                                                                           for ordinary new shares.
The core capital is of very high quality, very solid and adjusted to
the business model, the balance sheet structure and the Group’s                          • EUR 1,660 million through the application of the Santander
risk profile.                                                                              Dividendo Elección programme (scrip dividend) at the time of
                                                                                           the final dividend corresponding to fiscal year 2011.
The Tier 1 ratio was 11.01% and the BIS ratio 13.56%.
                                                                                         • EUR 4,890 million through organic capital generation,
This improvement in the ratios benefited from the strengthening                            provisions and the transfer of minority stakes, mainly in Chile
of capital, in accordance with the new requirements of the                                 and Brazil.
European Banking Authority (EBA). They form part of a series of
measures adopted by the European Council in the second half                              Regarding the latter, Santander reached in December 2011 an
of 2011, which aim to restore stability and confidence to the                            agreement (closed during the first week of 2012) to transfer
European markets. These capital requirements are expected to                             4.41% of Santander Brazil to a major international financial
be exceptional and temporary.                                                            institution, which will deliver such shares to holders of
                                                                                         convertible bonds issued in October 2010 by Banco Santander,
The selected banks must have by June 30, 2012 a core capital                             when these mature, pursuant to the terms of said convertible
Tier 1 ratio of at least 9%, in accordance with the EBA’s rules.                         bonds.
Each bank was required to present by January 20, 2012 their
capitalisation plan to reach the requirement at June 30, 2012.                           This means that Santander met the EBA’s core capital
                                                                                         requirement of 9% six months in advance, underscoring the
In this regard, Grupo Santander has carried out a series of                              Group’s financial strength and high degree of flexibility.
measures in the latter part of 2011 regarding capital, allowing it
to achieve a core capital ratio of 9% ahead of the deadline set
by the EBA.


 Core capital evolution
 EBA criteria
                                                                                                                        +0.28%


                                                                                                                                      9.01%
* Including Valores Santander (compulsorily convertible bonds)
                                                                                                           +0.20%


** Including 7.82% stake of Santander Chile
                                                                                             +0.25%
                                                                                +0.29%
                                                                    +0.34%
                                                +0.12%
                            7.53%


                    September 2011            Q4                 Exchange    4th scrip      Brazil     Disposals**   Provisions   Current with
                        adjusted           generation            preferred   dividend      (4.41%)                   and other    EBA criteria
                     to EBA criteria                              shares                                                               (*)
                           (*)


98                                                                                                                                  ANNUAL REPORT 2011
Description of the segments

Grupo Santander maintained in 2011 the general criteria used in                • United Kingdom. This includes retail and wholesale banking, asset
2010, with the following exceptions:                                             management and insurance conducted by the various units and
                                                                                 branches of the Group in the country.
• The system for calculating the internal transfer rate (ITR) was
  changed. Until now Grupo Santander’s management model applied                • Latin America. This embraces all the Group’s financial activities
  an ITR to each operation on the basis of its maturity and regardless           conducted via its subsidiary banks and subsidiaries. It also includes
  of whether it was an operation for assets or liabilities. After three          the specialised units of Santander Private Banking, as an
  years of financial and liquidity crisis, the real cost of the liquidity of     independent and globally managed unit, and New York’s business.
  institutions has been shown to differ from the reference yield curve           Because of their specific importance, the financial statements of
  significantly and constantly.                                                  Brazil, Mexico and Chile are also provided.

  As a result, the Group decided to revise the system for measuring            In addition, Sovereign’s figures are recorded on their own.
  the spread by changing the ITR applied by the corporate centre to
  the units. The new ITR consists of the depo/swap curve (the same             Secondary level (or business). This segments the activity of the
  as the previous system) plus the “liquidity spread” relative to the          operating units by the type of business. The reported segments are:
  period of “duration” of each operation. In other words, it reflects
  the average cost of Santander’s financing corresponding to the               • Retail Banking. This covers all customer banking businesses (except
  “duration” of each operation.                                                  those of Corporate Banking, managed through the Global
                                                                                 Customer Relationship Model). Because of their relative importance
  This change makes the model more in line with the requirements                 details are provided by the main geographic areas (Continental
  of regulators, ensures a better pricing of operations and enables              Europe, United Kingdom and Latin America) and Sovereign, as well
  the market to better assess the profitability of businesses.                   as by the main countries. The results of the hedging positions in
                                                                                 each country are also included, conducted within the sphere of
• Change of perimeter in the UK. For the past few years, the Group               each one’s Assets and Liabilities Committee.
  has been developing a cards platform for the UK, which once
  operational was integrated into the juridical structure of this unit         • Global Wholesale Banking (GBM). This business reflects the
  (with counterparty in the rest of Europe).                                     revenues from global corporate banking, investment banking and
                                                                                 markets worldwide including all treasuries managed globally, both
• The annual adjustment was made to the Global Customer Relation                 trading and distribution to customers (always after the appropriate
  Model and resulted in a net increase of 94 new clients. This does              distribution with Retail Banking customers), as well as equities
  not mean any changes in the principal (geographic) segments, but               business.
  it does affect the figures for Retail Banking and Global Wholesale
  Banking.                                                                     • Asset Management and Insurance. This includes the contribution
                                                                                 of the various units to the Group in the design and management
None of these changes was significant for the Group and do not alter             of mutual and pension funds and insurance. The Group uses, and
its figures. The figures for 2010 were restated and include the changes          remunerates through agreements, the retail networks that place
in the affected areas.                                                           these products. This means that the result recorded in this business
                                                                                 is net (i.e. deducting the distribution cost from gross income).
The financial statements of each business segment are drawn up by
aggregating the Group’s basic operating units. The information relates         As well as these operating units, which cover everything by
to both the accounting data of the companies in each area as well as           geographic area and by businesses, the Group continues to maintain
that provided by the management information systems. In all cases,             the area of Corporate Activities. This area incorporates the centralised
the same general principles as those used in the Group are applied.            activities relating to equity stakes in industrial and financial companies,
                                                                               financial management of the structural exchange rate position and
In accordance with the IFRS, the business areas are structured into            of the parent bank’s structural interest rate risk, as well as
two levels:                                                                    management of liquidity and of shareholders’ equity through issues
                                                                               and securitisations.
Principal level (or geographic). The activity of the Group’s operating
units is segmented by geographic areas. This coincides with the                As the Group’s holding entity, this area manages all capital and
Group’s first level of management and reflects our positioning in the          reserves and allocations of capital and liquidity. It also incorporates
world’s three main currency areas (euro, dollar and sterling). The             amortisation of goodwill but not the costs related to the Group’s
segments reported on are:                                                      central services except for corporate and institutional expenses related
                                                                               to the Group’s functioning.
• Continental Europe. This covers all retail banking business
  (including Banif, the specialised private bank), wholesale banking
  and asset management and insurance conducted in Europe with
  the exception of the United Kingdom. Given the importance of
  some of these units, the financial information of the Santander                 The figures of the various units of the Group listed below have
  Branch Network, Banesto, Santander Consumer Finance and                         been prepared in accordance with these criteria and therefore
  Portugal are set out and from the second quarter Bank Zachodni                  do not match those published by each institution individually.
  WBK after its incorporation to the Group.


      ANNUAL REPORT 2011                                                                                                                               99
1. Principal segments or geographic

 Income statement
 Million euros

                                                                                Net operating income                             Attributable profit to the Group
                                                                       2011         2010      Amount               %           2011          2010     Amount               %

Continental Europe                                                     8,735       8,875         (141)        (1.6)           2,849        3,355         (506)       (15.1)
o/w: Santander Branch Network                                          2,353       2,227           126          5.7             660          847          (187)       (22.1)
     Banesto                                                           1,112       1,376          (264)      (19.2)             130          419          (289)       (68.9)
     Santander Consumer Finance                                        3,604       3,361           243          7.2           1,228          811            418        51.5
     Portugal                                                            443         650          (207)      (31.9)             174          456          (282)       (61.8)
     Retail Poland (BZ WBK)                                              366                       366                          232                         232
United Kingdom                                                         3,123       3,735         (612)       (16.4)           1,145        1,965         (820)       (41.7)
Latin America                                                        13,533      12,705            828           6.5          4,664        4,728           (64)       (1.4)
o/w: Brazil                                                            9,963       9,007            956        10.6           2,610        2,814          (204)        (7.2)
     Mexico                                                            1,387       1,434            (47)        (3.3)           936          664            272        40.9
     Chile                                                             1,264       1,296            (32)        (2.5)           611          671            (61)       (9.0)
Sovereign                                                              1,212       1,169             43          3.7            526          424           102         24.0
Operating areas                                                      26,603      26,485            118           0.4          9,184      10,472       (1,289)        (12.3)
Corporate Activities*                                                 (2,230)     (2,632)           401       (15.2)         (2,163)      (2,291)           128        (5.6)
Total Group*                                                         24,373      23,853            519           2.2          7,021        8,181      (1,160)        (14.2)
Net extraordinary capital gains and provisions                                                                               (1,670)           —       (1,670)           —
Total Group                                                          24,373      23,853            519            2.2         5,351        8,181      (2,830)        (34.6)
(*).- Excluding net extraordinary capital gains and provisions


 Ratios
 %

                                                                       Efficiency ratio(1)                 ROE                    NPL ratio*             NPL coverage*
                                                                       2011         2010         2011            2010          2011          2010        2011         2010

Continental Europe                                                      43.1        40.0         9.34        12.45              5.20        4.34            55          71
o/w: Santander Branch Network *                                         46.5        48.2         9.63        11.85              8.47        5.52            40          52
     Banesto                                                            47.4        42.8         2.78         9.43              5.01        4.11            53          54
     Santander Consumer Finance                                         31.8        27.5        12.34        10.31              3.77        4.95           113         128
     Portugal                                                           54.4        45.4         7.00        20.34              4.06        2.90            55          60
     Retail Poland (BZ WBK)                                             47.0                    17.93                           4.89                        65
United Kingdom                                                          45.0        40.6         9.15        21.25              1.86        1.76            38          46
Latin America                                                           39.7        38.6        21.78        22.30              4.32        4.11            97         104
o/w: Brazil                                                             37.5        37.1        23.26        22.93              5.38        4.91            95         101
     Mexico                                                             41.8        39.1        21.16        19.00              1.82        1.84           176         215
     Chile                                                              39.2        36.2        25.43        30.01              3.85        3.74            73          89
Sovereign                                                               44.6        44.5        12.96        14.87              2.85        4.61            96          75
Operating areas                                                         41.7        39.6        13.41        17.38              3.87        3.53            63          75
Total Group                                                             44.9        43.3         7.14        11.80              3.89        3.55            61          73
(1) With amortisations
* Santander Branch Network is the retail banking unit of Banco Santander S.A. The NPL ratio of Banco Santander S.A. at the end of December 2011 stood at 5.99% (4.24% in
December 2010) and NPL coverage was 39% (54% in December 2010)

 Operating means
 Million euros

                                                                                                                                   Employees                 Branches
                                                                                                                               2011          2010        2011         2010

Continental Europe                                                                                                          63,866 54,518              6,608         6,063
o/w: Santander Branch Network                                                                                                18,704  18,893            2,915         2,931
     Banesto                                                                                                                  9,548   9,742            1,714         1,762
     Santander Consumer Finance                                                                                              15,610  13,852              647           519
     Portugal                                                                                                                 6,091   6,214              716           759
     Retail Poland (BZ WBK)                                                                                                   9,383                      526
United Kingdom                                                                                                              26,295 23,649              1,379        1,416
Latin America                                                                                                               91,887 89,526              6,046        5,882
o/w: Brazil                                                                                                                  54,265  53,900            3,775        3,702
     Mexico                                                                                                                  13,162  12,500            1,125        1,100
     Chile                                                                                                                   12,089  11,595              499          504
Sovereign                                                                                                                     8,968   8,647              723          721
Operating areas                                                                                                            191,016 176,340            14,756       14,082
Corporate Activities                                                                                                          2,333   2,529
Total Group                                                                                                                193,349 178,869            14,756       14,082


100                                                                                                                                             ANNUAL REPORT 2011
Continental Europe
Million euros

                                                                                                                                              Variation
                                                                                                              2011          2010               amount                      %
Income statement
Net interest income                                                                                         10,666         9,872                    794                   8.0
Net fees                                                                                                      4,050        3,679                    371                  10.1
Gains (losses) on financial transactions                                                                        233          846                   (612)               (72.4)
Other operating income (1)                                                                                      397          396                       1                  0.3
Gross income                                                                                                15,347       14,793                     554                   3.7
Operating expenses                                                                                           (6,612)      (5,917)                  (695)                 11.7
  General administrative expenses                                                                            (5,998)      (5,301)                  (697)                 13.1
     Personnel                                                                                               (3,725)      (3,343)                  (382)                 11.4
      Other general administrative expenses                                                                  (2,273)      (1,958)                  (315)                 16.1
  Depreciation and amortisation                                                                                (614)        (616)                      2                 (0.3)
Net operating income                                                                                          8,735        8,875                  (141)                 (1.6)
Net loan-loss provisions                                                                                     (4,192)      (4,019)                  (173)                  4.3
Other income                                                                                                   (503)        (172)                  (331)               193.0
Profit before taxes                                                                                           4,039        4,684                  (645)               (13.8)
Tax on profit                                                                                                (1,049)      (1,220)                    170               (14.0)
Profit from continuing operations                                                                             2,990        3,465                  (475)               (13.7)
Net profit from discontinued operations                                                                          (24)         (14)                   (11)                77.7
Consolidated profit                                                                                           2,966        3,451                  (486)               (14.1)
Minority interests                                                                                               117           96                     21                 21.7
Attributable profit to the Group                                                                              2,849        3,355                  (506)               (15.1)

Balance sheet
Customer loans (2)                                                                                          315,081      323,660                (8,579)                  (2.7)
Trading portfolio (w/o loans)                                                                                78,802       57,690                21,112                   36.6
Available-for-sale financial assets                                                                          24,640       23,843                    797                   3.3
Due from credit institutions (2)                                                                             51,638       66,925              (15,287)                 (22.8)
Intangible assets and property and equipment                                                                  5,045        4,965                     80                   1.6
Other assets                                                                                                 28,586       22,160                 6,427                   29.0
Total assets/liabilities & shareholders' equity                                                            503,793      499,243                  4,549                    0.9
Customer deposits (2)                                                                                       247,582      247,715                   (133)                 (0.1)
Marketable debt securities (2)                                                                               39,708       48,413                (8,705)                (18.0)
Subordinated debt (2)                                                                                           965        1,740                   (774)               (44.5)
Insurance liabilities                                                                                           517          933                   (416)               (44.6)
Due to credit institutions (2)                                                                               88,143       77,059                11,084                   14.4
Other liabilities                                                                                            96,088       95,963                    126                    0.1
Shareholders' equity (3)                                                                                     30,789       27,420                  3,369                  12.3
Other customer funds under management                                                                       45,809       53,968                (8,159)                (15.1)
  Mutual funds                                                                                               31,038       37,519                (6,481)                (17.3)
  Pension funds                                                                                               9,645       10,965                (1,320)                (12.0)
  Managed portfolios                                                                                          5,126        5,484                   (358)                 (6.5)
  Savings-insurance policies                                                                                     —            —                       —                     —
Customer funds under management                                                                            334,064      351,836              (17,772)                   (5.1)

(1).- Including dividends, income from equity-accounted method and other operating income/expenses
(2).- Including all on-balance sheet sheet balance sheets for this item
(3).- Not including profit of the year


   Loans                                                          Deposits*                                                    Loans / deposits*
   % annual variation                                             % annual variation                                           %

                                                                 (*) Including retail commercial paper                        (*) Including retail commercial paper
                                                                                   +31.1


                                                                                                                                     163
                  +0.5


                                                                                                                                                       131
                                                                                                                                                                        124
                                -2.7


                                                                                                    +2.4


           2010          2011                                               2010             2011                                2009                 2010             2011


       ANNUAL REPORT 2011                                                                                                                                                 101
Activity
Continental Europe                                                 Lending dropped 3% due to lower demand in Spain and
                                                                   Portugal, and the consolidation by the equity accounted
      Basic revenues increased 8.4% due to the                     method of Santander Consumer USA, which was partly offset by
      improvement in net interest income and fee income            the incorporation of Bank Zachodni WBK.
      in the commercial units and consolidation of Bank
      Zachodni WBK.                                                Deposits remained virtually unchanged because of the
                                                                   incorporation of new institutions and Portugal’s evolution,
      Controlled expenses: flat on a like-for-like basis           offsetting the lower balances in Spain, which were affected by
      (+0.6%).                                                     the strategy in renewing maturities of deposits captured in the
                                                                   2010 campaign. The increase including the commercial paper
      Attributable profit hit by lower gains on financial
                                                                   placed by the retail networks in Spain was 2% The rise since
      transactions and reduced release of generic                  December 2009, before the launch of the campaign, was EUR
      provisions.                                                  49,400 million (+25%).
      Growth strategy: preference for liquidity against a
                                                                   Growth in mutual funds and pension funds was affected by the
      background of low demand for loans.
                                                                   strategy of greater preference for deposits
      Best bank in Western Europe prize from The Banker.
                                                                   Results
                                                                   Basic revenues grew 8.4%, driven by Santander Consumer
                                                                   Finance (partially favoured by the SEB incorporation in
                                                                   Germany), the entry of BZ WBK and the recovery in net interest
                                                                   income at the Santander Branch Network and Banesto.
Continental Europe includes all activities carried out in this
geographic area: retail banking, global wholesale banking, asset   Net interest income rose 8.0% and fee income 10.1%.
management and insurance.                                          Deducting the perimeter impact, net interest income and fee
                                                                   income increased 1.1%.
Attributable profit was EUR 2,849 million, 15.1% lower than in
2010.                                                              Operating expenses increased 11.7%, due to the perimeter
                                                                   effect as on a like-for-like basis they were flat (+ 0.6%). The
The results reflect the perimeter effect of incorporating Bank
                                                                   Santander Branch Network, Banesto and Portugal reduced their
Zachodni WBK and SEB’s branches in Germany. Overall, the
                                                                   costs.
positive impact was around 6 percentage points in the profit.
                                                                   Provisions for loan losses were 4.3% higher (+1.8% deducting
Strategy
                                                                   the perimeter impact). This was due to various factors:
In a still weak environment and with low interest rates, the
Group maintained the same strategic lines, aimed at:               • On the one hand, it reflected the effort being made in risk
                                                                     management, which led to lower specific provisions.
• defending spreads on loans (those on new ones continued to
  improve) and on deposits, which reflect a lower cost thanks to   • On the other, the ending of the regulating effect from the
  the strategy of renewing the balances captured in the 2010         release of generic provisions in the commercial units in Spain.
  campaign, where priority was given to costs over volumes;          Releases amounted to EUR 379 million, down from EUR 1,949
                                                                     million in 2010.
• control of expenses
                                                                   Attributable profit, after the rest of results and provisions,
• and risk management very centred on recoveries.
                                                                   particularly for real estate, and taxes was EUR 2,849 million.
Preference was given in volumes to liquidity and deposits in a
context of low demand for loans.


Net operating income               Attributable profit               NPL ratio                         NPL coverage
Million euros                      Million euros                     %                                 %

-1.6%   2011-2010                  -15.1%    2011-2010
                8,875


                                                                                            5.20
                           8,735


                                                3,355


                                                                                  4.34


                                                                                                                    71


                                                                                                                            55
                                                           2,849


        2010            2011             2010           2011               2010          2011                2010        2011


102                                                                                                           ANNUAL REPORT 2011
Continental Europe. Main units
Million euros

                                                                Santander                                          Santander                                    BZ
                                                           Branch Network                       Banesto      Consumer Finance                   Portugal       WBK
                                                             2011      Var (%)         2011      Var (%)       2011*      Var (%)     2011       Var (%)      2011
Income statement
Net interest income                                          3,235          3.0       1,351       (11.1)        4,162       13.6        592       (18.2)        371
Net fees                                                     1,099          1.7         616          (0.2)      1,128       18.0        345          (3.5)      248
Gains (losses) on financial transactions                       108        (1.6)           98       (49.9)          (12)     84.6          14       (78.8)         58
Other operating income (1)                                      (41)      32.4            47       (31.3)             3    (86.4)         21       (49.8)         13
Gross income                                                 4,400          2.4       2,113       (12.1)        5,282       14.0        972       (18.3)        690
Operating expenses                                          (2,047)       (1.2)      (1,001)         (2.5)     (1,678)      31.8       (529)         (2.1)     (324)
  General administrative expenses                           (1,895)       (0.8)        (878)         (2.8)     (1,542)      33.3       (460)         (1.6)     (298)
      Personnel                                             (1,233)        (0.2)       (636)         (4.6)       (783)      31.6       (317)         (1.4)     (179)
      Other general administrative expenses                   (662)        (2.1)       (242)          2.0        (758)      35.2       (143)         (2.1)     (119)
  Depreciation and amortisation                               (153)        (5.3)       (123)         (0.5)       (136)      16.6         (69)        (4.8)       (26)
Net operating income                                         2,353          5.7       1,112       (19.2)        3,604         7.2       443       (31.9)        366
Net loan-loss provisions                                    (1,437)       31.7         (661)         (6.8)     (1,632)     (19.1)      (206)         87.7        (60)
Other income                                                    (11)         —         (251)       756.5         (135)       (5.8)       (50)          —           (3)
Profit before taxes                                            905      (22.0)          200       (68.6)        1,837       53.1        187       (66.7)        303
Tax on profit                                                 (244)      (22.0)          (46)      (71.4)        (506)       49.0        (13)      (87.8)        (63)
Profit from continuing operations                              660      (22.0)          154       (67.6)        1,332       54.6        174       (61.9)        240
Net profit from discontinued operations                           —          —             —           —           (24)      77.7          —           —           —
Consolidated profit                                            660      (22.0)          154       (67.6)        1,307       54.3        174       (61.9)        240
Minority interests                                                 1      80.6            24       (58.0)            79    115.0            0      (99.3)           8
Attributable profit to the Group                               660      (22.1)          130       (68.9)        1,228       51.5        174       (61.8)        232

Balance sheet
Customer loans (2)                               102,643                   (7.8)     68,850          (9.0)     60,276        (4.8)    28,403         (5.6)     8,479
Trading portfolio (w/o loans)                         —                      —        7,869          19.7       1,335       16.4       1,617         (7.1)     1,304
Available-for-sale financial assets                   —                      —        8,333          (7.7)        205      (63.3)      4,496       (30.4)      2,617
Due from credit institutions (2)                     104                 (51.2)       9,637        (43.7)      11,011       37.4       2,467       (27.4)        309
Intangible assets and property and equipment       1,201                     —        1,328          (3.3)        799      (10.1)        452         (5.8)       183
Other assets                                       1,829                 279.8       10,215          35.8       4,984       72.3       7,120          0.4        645
Total assets/liabilities & shareholders' equity 105,776                   (6.6)    106,232          (9.4)     78,610          2.3    44,555         (9.6)    13,536
Customer deposits (2)                             78,864                   (7.9)     50,755        (15.0)      33,198       27.9      23,465          8.0     10,359
Marketable debt securities (2)                     4,965                     —       22,531        (18.6)       5,729      (51.1)      5,037       (33.2)         —
Subordinated debt (2)                                 —                      —          784        (39.9)          75      (82.4)         —            —          99
Insurance liabilities                                 —                      —           —              —          —           —          70       (11.1)         —
Due to credit institutions (2)                       543                   18.9      16,591          23.6      23,565        (8.9)    13,395       (20.4)      1,163
Other liabilities                                 14,780                 (26.4)      10,870            2.4      6,023        40.9         31       (97.4)        703
Shareholders' equity (3)                           6,625                   (6.1)      4,702            5.0     10,020        16.4      2,557         32.3      1,213
Other customer funds under management            23,640                 (12.0)        8,375       (12.9)            6     (73.6)       2,686      (42.3)       1,926
  Mutual funds                                    16,158                 (20.6)       4,440        (22.3)           2      (88.3)      1,866       (41.8)      1,747
  Pension funds                                    5,918                   (3.5)      1,237          (7.5)          4      (15.8)        760       (42.2)         —
  Managed portfolios                                  —                      —          109          (6.6)         —           —          59       (54.9)        179
  Savings-insurance policies                       1,564                 306.4        2,588            5.6         —           —          —            —          —
Customer funds under management                 107,469                   (4.5)     82,444        (16.2)      39,008          2.3    31,188         (8.1)    12,383

(1).- Including dividends, income from equity-accounted method and other operating income/expenses
(2).- Including all on-balance sheet sheet balance sheets for this item
(3).- Not including profit of the year

(*).- In December SC USA began to consolidate by the equity accounted method. Without impact on profits


       ANNUAL REPORT 2011                                                                                                                                         103
The bank was particularly active with SMEs. Of note was the
Santander Branch Network                                                                              agreement with Google to support the digitisation of SMEs and
                                                                                                      businesses. We worked on different lines:
         Improved underlying results:
                                                                                                      – EUR 100 gift for first time publicity in the leading search
         • Positive growth in gross income (+2.4%).                                                     engine. Some 215,000 SMEs and self-employed people, who
                                                                                                        began to work with Santander or who increased their linkage,
         • Operating expenses declined 1.2% by the second                                               were rewarded.
           straight year.
                                                                                                      – Incorporation to Conecta tu Negocio (creation of a web page
         • Specific provisions declined 29.3%.                                                          and domain free for a year). In just nine months, 18,000 SMEs
                                                                                                        and self-employed created their web pages with this
         The lower attributable profit was due to fewer                                                 programme and the bank enabled them to have a 24-hour
         releases of generic provisions.                                                                window throughout the world via Internet.
         Activity reflected the scant demand for loans and a                                          Also important in the sphere of companies were activities
         strategy in funding which combines cost reduction                                            related to international business, in particular the Plan Exporta
         and volume retention.                                                                        which aims to capture and link new customers whose
                                                                                                      commercial and industrial activity is related to exports. In 2011,
         Best bank in Spain according to The Banker and                                               6,689 customers were captured.
         Euromoney.
                                                                                                      There were also new multi channel projects, notably a new
                                                                                                      application for iPad and participation along with the Ministry of
                                                                                                      Industry, Tourism and Commerce in an initiative to foster the
                                                                                                      use of electronic DNIs.
The Santander Network posted an attributable profit of EUR 660                                        Lastly, many customers continued to be captured under the We
million, 22.1% less than in 2010. This was mainly due to the                                          want to be your Bank plan. Close to 500,000 customers were
smaller release of generic provisions, as net operating income                                        captured during 2011, a similar number to 2010 after
rose 5.7%, after gradually improving during the year due to the                                       discounting the impact of the campaign to capture deposits.
better quarterly trend in gross income than in 2010 and control
of costs.                                                                                             Activity
                                                                                                      There were two different periods for deposits. In the first half,
These results were obtained in a still difficult environment, with                                    Santander managed the maturity of the deposits captured in the
insufficient signs of an economic recovery, strong competition                                        2010 campaign when priority was given to reducing the cost,
for liquidity and low demand for loans.                                                               reflecting a decline of 0.56 p.p. in that of time deposits.
Strategy                                                                                              This policy was combined with a high retention level of more
The Santander Branch Network maintained its strategic                                                 than 60%. A key factor here were the funds captured by various
priorities: management of prices, control of costs and                                                products with different periods of renewal: the Depósito
strengthening the balance sheet, with particular emphasis on                                          Avanzado (time), the Cuenta Inversión (demand), structured
capturing funds and control and early management of NPLs. We                                          products (medium term) and Seguros de Rentas (for a more
also continued to take advantage of opportunities to keep on                                          specialised segment of customers).
capturing funds and boost customer linkage.
                                                                                                      The second half of the year was characterised by the capturing
Santander remained very active in selling products and services,                                      of retail savings via commercial paper, as an alternative to
tailored to customers’ needs and differentiated by segments.                                          traditional deposits. EUR 5,000 million was captured in the last
                                                                                                      three months.


Activity                                               Loans / deposits*                              Return / cost                       Net interest inc. / ATAs
Annual variation in billion euros                      %                                              %                                   %

(*) Including retail commercial paper                  (*) Including retail commercial paper
                                                                                                                                3.65
         Loans                      Deposits*
                                                                                                                                                                 2.95


                                                            159                                                     3.26
                            +13.2


                                                                                                           2.92            Loans return
                                                                                                                                                       2.70


                                                                             130
                                                                                               122
                                                -1.8


                                                                                                                       Deposits cost
  -3.9


                   -8.7


                                                                                                           1.43                  1.36
                                                                                                                    1.15
      2010 2011                 2010 2011                  2009             2010               2011       Q4’10    Q2’11       Q4’11            2010          2011


104                                                                                                                                               ANNUAL REPORT 2011
All in all, total funds on the balance sheet declined by EUR         Gains on financial transactions, in an unfavourable market,
1,800 million (-2%), but were EUR 11,400 million (+16%) more         remained virtually stable.
than at the end of 2009 (i.e. before the start of the campaign).
As a result, there was a gain of more than 100 b.p. in market        Operating expenses continued the downward trend begun in
share.                                                               2010 (-1.2% in 2011), which is particularly significant as
                                                                     inflation was around 3% and the branch network’s commercial
Lending in a weak market declined 8%. In this context, 227,000       capacity remained virtually unchanged. There were no
loans were granted for a total of EUR 25,000 million.                significant closures of branches unlike the general trend in the
                                                                     sector.
We continued to be the leader in facilities credit lines, among
which are the ICO lines. Some 50,000 loans were granted for a        The efficiency ratio improved 1.7 p.p. to 46.5% (43% excluding
total of EUR 3,640 million, with a market share of around 20%,       amortisations) and net operating income rose 5.7% to EUR
6 p.p. more than the following competitor.                           2,353 million.
As regards liquidity, there was a sharp fall of EUR 24,000 million   Credit risk and NPL management continued to be given
since the end of 2009 in the commercial gap (EUR 3,000 in            maximum priority. The NPL ratio was 8.47% in the retail
2011). This improved the loan-to-deposit ratio from 159% in          network (excluding wholesale activities) and 5.99% at the
December 2009 to 122% at the end of 2011.                            parent bank. The latter ratio is more comparable with the rest of
                                                                     institutions, which are banks, and was well below the average
Results                                                              of them. NPL coverage ratios were 40% for the network and
The main pillars of the income statement were the recovery in        39% for the parent bank.
gross income, control of costs and reduced needs for specific
provisions. They did not feed through to profits, however,           In August, the bank launched the campaign Moratoria
because of the lower release of generic provisions.                  hipotecaria, which aims to help those customers going through
                                                                     temporary difficulties as a result of the economic crisis in Spain.
Gross income was EUR 4,400 million, 2.4% more and reversing          Almost 6,000 customers for EUR 1,000 million have benefited
the trend of the last two years of lower revenues.                   from this campaign.
Growth was mainly due to net interest income (+3.0%) as the          Net loan-loss provisions made in 2011 were EUR 1,437 million,
strategy to improve spreads, particularly on deposits, enabled       31.7% more than in 2010 due to the net impact from the
the customer spread (the yield on lending less the cost of funds)    regulatory effect of generic provisions (EUR 298 million
to increase by almost one p.p. (from 1.49% in the fourth             released, all in the first half of the year, compared to EUR 1,364
quarter of 2010 to 2.29% a year later).                              million in 2010) and specific provisions that were EUR 720
                                                                     million less (-29.3%) than in 2010.
Net fee income rose 1.7% and was higher in each quarter of
2011 than in the same periods of 2010. The fall in income from       Net operating income after provisions was EUR 916 million,
mutual and pension funds were offset by the rise in that from        19.4% less than in 2010 while attributable profit was EUR 660
selling and buying securities, means of payment and, mainly,         million.
insurance. In the latter, both from protection (accidents,
household and life), the most traditional insurance products, as
well as new ones (cars and legal security).
Of note in protection insurance was Open Market (not linked to
finance operations), with 170,000 policies (+38%). In car
insurance, the Súper Buscador Santander gained more than
12,000 policies in just three months. The branches received
more than 60,000 price requests.


Net operating income               Attributable profit               Banco Santander                     Banco Santander
Million euros                      Million euros                     NPL ratio %                         NPL coverage %
+ 5.7%     2011-2010               -22.1%    2011-2010
                                                                                             5,99


                                                                                                                      54
                           2,353


                                                                                   4,24


                                                                                                                               39
                2,227


                                                   847


                                                            660


        2010            2011               2010          2011               2010          2011                 2010        2011


      ANNUAL REPORT 2011                                                                                                             105
In business activity, the priorities were to capture and link
Banesto                                                                                             corporate and individual customers and become their
                                                                                                    reference bank.
         The balance sheet, the capital and liquidity were
         strengthened.                                                                              Quality of service has become the driver behind improving and
                                                                                                    consolidating the value offer for customers. The main
         Management of spreads, the balance sheet and                                               indicators of quality put Banesto among the reference banks in
         greater customer linkage limited the impact on                                             Spain.
         revenues from reduced business and higher funding
         costs.                                                                                     In 2011, for the fourth year running, Banesto was chosen by
                                                                                                    the magazine Euromoney as the best bank in Spain, and it was
         Very disciplined costs, which continued to decline.                                        recently included by Global Finance among the world’s 50
                                                                                                    most solvent banks.
         Provisions increased because of lower release of
         generic provisions. Specific provisions fell sharply.                                      Activity
                                                                                                    The bank’s liquidity situation and its large number of
         Good relative evolution of risk quality, better than                                       customers facilitated profitable and efficient management of
         our competitors.                                                                           funds.

         Euromoney prize for the best bank in Spain, and                                            Total customer funds amounted to EUR 82,444 million, of
         among the world’s 50 most solvent banks,                                                   which EUR 51,220 million (-14%) were on-balance sheet
         according to Global Finance.                                                               including the commercial paper issued in the fourth quarter.
                                                                                                    This reduction was due to the bank’s policy of renewing part
                                                                                                    of the deposits captured in the special campaign launched in
                                                                                                    the second quarter of 2010. Excluding this operation, the
                                                                                                    decline was 2%.
Banesto generated an attributable profit to the Group of EUR                                        Lending continued to decline because of the weak demand
130 million, 68.9% lower than in 2010, after assigning more                                         and the environment of greater credit and liquidity risks. The
than EUR 900 million to strengthening provisions.                                                   volume stood at EUR 68,850 million at the end of 2011, 9%
Strategy                                                                                            less than a year ago.
The year 2011 was a complicated one for banks, because as                                           The weak environment and the fall in lending pushed up the
well as the still weak economic growth there were strong                                            NPL ratio to 5.01%. The increase in non-performing loans was
tensions and high volatility in the markets in the second part of                                   EUR 402 million, which compares well with the average of
the year. The sector’s non-performing loans continued to rise                                       around EUR 1,000 million in 2010 and 2009. Moreover, the
and interest rates were unstable. Liquidity tensions in the                                         ratio compares very favourably with the sector’s average.
financial system triggered a rise in wholesale funding costs.
                                                                                                    NPL coverage was 53%.
In this context, Banesto prioritised its objectives and focused
on improving the quality of assets, strengthening the financial                                     Liquidity management, one of the year’s priorities, improved
position and optimising liquidity. It also continued to improve                                     the commercial gap and enabled wholesale funding to be
its competitive position, thanks to exploiting its technology                                       reduced by almost EUR 5,600 million. This, in turn, enabled
and innovation capacities. This produced further gains in                                           the EUR 2,200 million of debt issues during the year to give
efficiency, either by improving procedures and already existing                                     priority to cost optimisation over volume.
products or by launching new initiatives, such as expanding
the range of foreign trade services.


Activity                                             Loans / deposits*                               Return / cost                                Net interest inc. / ATAs*
Annual variation in billion euros                    %                                               %                                            %

(*) W/o REPOs. Including retail commercial paper     (*) Including retail commercial paper          (*) Retail Banking                            (*) Retail Banking
                                                                                                                                         3.61
         Loans                    Deposits*
                                                                                                                          3.21
                                                                                                                                                                                 2.44
                           +7.1


                                                          136                                             2.92                     Loans return
                                                                                             134
                                                                                                                                                                       2.22


                                                                            127
  +0.2


                                                                                                                                 Deposits cost

                                                                                                          1.94
                                                                                                                          1.66           1.70
                                              -6.2
                   -6.8


      2010 2011               2010 2011                  2009              2010              2011        Q4’10           Q2’11          Q4’11                2010             2011


106                                                                                                                                                             ANNUAL REPORT 2011
The level of available liquid assets means that Banesto can        The tensions in markets in the second half of the year
comfortably meet the wholesale funding maturities of EUR           impacted gains on financial transactions, due, on the one
4,700 million in 2012, even in a scenario of not issuing any       hand, to losses on assets valuation and, on the other, reduced
debt.                                                              customer activity in these products. Gains were 49.9% less at
                                                                   EUR 98 million.
Results
The three pillars of the income statement were defending           Gross income was EUR 2,113 million, 12.1% less than in 2010.
revenues, controlling costs and rigorous risk management.
                                                                   The non-renounceable goal of controlling efficiency is the key
Net interest income was EUR 1,351 million, 11.1% less than in      to the present situation. Thanks to this, operating expenses of
2010. The reduction was due to the impact of lower activity        EUR 1,001 million were 2.5% less than in 2010. The efficiency
on business and the rise in finance costs which, however, was      ratio was 47.4% at the end of 2011.
limited by management of prices and of the balance sheet.
                                                                   Net operating income declined 19.2% to EUR 1,112 million.
The credit spread of the front book increased from around 3%
at the beginning of 2010 to close to 5% in the fourth quarter      Net loan-loss provisions were EUR 661 million, 6.8% lower
of 2011. Although this increase is already reflected in the        than the EUR 709 million in 2010. This evolution is the net
stock, it still has not fully fed through. In customer deposits,   between lower specific provisions (-38.8%) and lower use of
the cost has been falling from the highs in the second half of     generic provisions (EUR 445 million less than in 2010).
2010.
                                                                   Furthermore, Banesto made additional provisions of EUR 251
Management and linkage of customers produced a rise in             million to strengthen its financial position, basically for
transactions and use of value-added services, which resulted in    foreclosed properties and loans, and for early retirements
a 2.6% rise in revenues from services. Net fee income from         made in the first half.
mutual and pension funds was 16.4% lower, due to the drop
                                                                   Profit before tax was EUR 200 million. Attributable profit after
in the average commission and customer preference for other
                                                                   taxes and minority interests was EUR 130 million (-68.9%).
types of savings. Total net fee income was EUR 616 million,
almost the same as in 2010.


Net operating income               Attributable profit             NPL ratio                         NPL coverage
Million euros                      Million euros                   %                                 %

-19.2%     2011-2010               -68.9%    2011-2010
                                                                                           5.01


                                                                                                                   54


                                                                                                                           53
                1,376


                                                                                 4.11
                                                   419
                           1,112


                                                            130


        2010            2011               2010          2011             2010          2011                2010        2011


      ANNUAL REPORT 2011                                                                                                         107
Car financing market
Santander Consumer Finance                                           Market share new business - new and used car

      Successful business model during the crisis (2008-                                        0%             10%             20%               30%
      2011); attributable profit increased 76% and the
      return on assets was double that of the average of                      Norway
      our competitors.                                                        Finland
                                                                              Spain
      Profit surged 51.5%, fuelled by gross income                                                                                              Leading
      (+14.0%), efficiency ratio of 31.8% and a 19.1%                         Denmark
                                                                                                                                          positions and
      drop in loan-loss provisions.                                           Poland
                                                                                                                                         critical mass in
      Solid contribution from all core countries, which                       Portugal
                                                                                                                                           10 core car
      registered double-digit growth in profits.                              Germany
                                                                                                                                                financing
      Sharp improvement in credit quality (lower NPL ratio                    UK
                                                                                                                                                markets
      at 3.77% and high coverage at 113%).                                    Sweden
                                                                              Italy
      Better liquidity position via deposit capturing and
      greater diversification of wholesale funding sources.
                                                                    Source: Local Consumer Finance Associations or internal estimates based on the
                                                                            publics statistics


Santander Consumer Finance’s attributable profit was EUR            In Europe, the focus was on organic growth and cross-selling,
1,228 million, 51.5% more than in 2010.                             backed by brand agreements (37 with 9 manufacturers), which
                                                                    increased the recurrence of profits and boosted new car
Strategy                                                            business, particularly in Germany and the UK.
The results in 2011 joined the unit’s differentiating performance
in the two prior years, the most demanding of the international     Increased penetration of the second hand car sector and in new
financial and economic crisis. SCF performed better than            car sales in central European and Nordic countries. The first
comparable business units.                                          steps were also taken in Germany by Santander Retail (former
                                                                    SEB) focusing in mortgages and in capturing customer funds.
Since the end of 2008, the area has almost doubled its quarterly
generation of attributable profit, while also offering a rising     In the US, high growth in new loans and the capacity to extract
return on assets consistently higher than that of the large         value from a greater presence in the market doubled profits.
European competitors. After the strong growth in 2011, the
return is double that of those.                                     This attractive performance made it possible for new partners to
                                                                    enter SC USA, formalised in the fourth quarter, and inject
The SCF business model is based on portfolio diversification,       $1,150 million of capital. This operation strengthes business and
leadership in core markets, efficiency, control of risks and        increases its future growth capacity.
recoveries and a single pan-European platform.


Diversified by products                                             Net operating income                                 Attributable profit
%                                                                   Million euros                                        Million euros

                                                                    + 7.2%       2011-2010                              + 51.5%         2011-2010
                                Car stock
                                finance 5%
                 Durables 5%
                                                                                                     3,604


                                                                                                                                                        1,228


                                             Auto-new
                                                                                      3,361


                                             25%
      Mortgages 17%
                                                                                                                                          811


      Credit cards and
             other 9%
                                             Auto-used 22%                    2010            2011                                 2010              2011
                   Direct 17%


108                                                                                                                                  ANNUAL REPORT 2011
Activity                                                                                    Results
Gross lending amounted to EUR 62,959 million, 7% less than in                               Gross income increased 14.0%, backed by the most basic
2010 because of the consolidation of SC USA by the equity                                   revenues: net interest income (+13.6%), due to the rise in the
accounted method in December. Excluding this impact, gross                                  average portfolio and better spreads; fee income (+18.0%),
lending was 16% higher, due to organic growth and the                                       basically due to servicing in the US, and greater penetration in
integration of businesses in Germany.                                                       key European countries (Germany, Poland and Norway).
New lending amounted to EUR 27,396 million (+11%), spurred                                  Higher expenses (+31.8%) due to the new incorporations. The
by auto finance for used cars (+13%) and direct lending (+16%),                             new units brought the efficiency ratio to 31.8%, with clear
particularly in Germany. Weaker activity in durable goods (-1%).                            opportunities for improvement once they are integrated.
New cars increased 5.0%, well above the whole of the
European market (-1%).                                                                      Sharp fall in loan-loss provisions (-19.1%), causing net operating
                                                                                            income after provisions to increase 46.8%. The lower provisions
This growth, plus that in 2010, was achieved with strict                                    reflect the improvement in the quality of the portfolio, even
management of spreads and risk (admission policies), which                                  after absorbing the incorporations.
improved net interest margins and the risk performance (risk
premiums at a minimum).                                                                     The NPL ratio dropped from 4.95% in 2010 to 3.77% and
                                                                                            coverage remained high at 113%, as both ratios were well
In local currency terms, lending rose in Germany (+15%), the                                supported by recoveries (+38%). The exit of SC USA because of
Nordic countries (+8%), the US (+51%), Spain (+11%) and                                     its integration by the equity accounted method hardly affected
Poland (+28% backed by the integration of AIG in 2010). On                                  the NPL ratio, but it has a greater impact on coverage, given its
the other hand, declines in Italy (-12%) and the UK (-4%),                                  high coverage ratio, above 200%. On a like-for-like basis, the
although in line with these markets.                                                        coverage ratio stood at 113%, up from 104% in 2010.
Customer deposits increased 28% to EUR 33,198 million, fuelled                              These trends in revenues, costs and provisions produced the
by SC Germany and the entry of Santander Retail. The latter unit                            51.5% jump in attributable profit, with positive contributions
took advantage of its “welcome” campaigns to grow in                                        from all the core units.
balances and customers (+EUR 2,500 million).
                                                                                            Santander Consumer USA doubled its profits (+99.2% in
The wholesale market increased the diversification of its funding                           dollars), due to its basic drivers: larger average volumes, higher
sources with new issuance units. Of note was Norway where                                   revenues from servicing and the lower cost of credit. Germany’s
SCF made its first securitisation of car loans in the country. In                           profits grew 10.0%, driven by growth in lending and the risk
Europe, the area placed EUR 5,000 million in securitisations and                            improvement.
structured financing in the markets at competitive costs, clearly
reflecting the attractiveness of our portfolios for investors in key                        The performance was very positive in the rest of the units,
European markets.                                                                           particularly the Nordic countries (attributable profit: +14.5% in
                                                                                            local currency), the UK (+38.1% in sterling) and in Spain, which
All of this enhanced SCF’s liquidity position (customer deposits                            returned to profit thanks to lower provisions.
and medium- and long-term funding cover 66% of loans, 7 p.p.
more than in 2010) and continued to reduce recourse to the                                  Lastly, the unit in Poland more than doubled its profit because
parent bank (already below 10% of loans).                                                   of the incorporation of AIG.


 Gross customer loans                                                                       NPL ratio                          NPL coverage
 Billion euros                                                                              %                                  %
                                                                              Variation
                                                                            Dec’11/Dec’10

             Germany                                                   30         +39%
                                                                                                          4.95


                   Italy                    8                                      -4%
                                                                                                                                             128
                                                                                                                    3.77


                                                                                                                                                      113


                  Spain                 7                                         -11%
   Nordic countries                     7       Total portfolio:                  +10%
    Other Eurozone                  4            63 billion euros                 +1%
                     UK             4           +16%* o/Dec’10                    +9%
                 Poland         3                                                 -10%
Nota: In December SC USA began to consolidate by the equity accounted method                       2010          2011                 2010         2011
(*) Before impact from consolidated by the equity accounted method from SC USA.
    Considering impact: -7%


        ANNUAL REPORT 2011                                                                                                                                   109
In this difficult environment, the government continued to take
Portugal                                                           measures to meet the budget deficit target of 5.9% of GDP in
                                                                   2011. Pensions funds were transferred from the banking sector
      Activity affected by the adjustment plan and the             to social security to cover part of the extraordinary overshoot in
      restructuring measures of Portuguese banks agreed            spending. The IMF, in its second assessment of the adjustment
      with international institutions.                             programme, said “notable progress was made (…) and the
      Priority given to strengthening the balance sheet:           specific measures included in the budgets should enable the
                                                                   2012 fiscal challenges to be attained.”
      • Solvency and credit quality ratios were better than
        those of competitors.                                      Meanwhile, under the Special Inspection Programme of the
      • The deleveraging goal set for the year was met             troika assessments of risk and solvency for the eight largest
        after reducing lending by 6% and increasing                Portuguese banking groups at June 2011 were made in their
        deposits 8%.                                               workstreams one and two. The analysis of credit figures
      • Good result in the inspection programme                    revealed a provisions deficit of EUR 838 million (0.3% of total
        conducted by the Troika.                                   lending), with a part already covered. Santander Totta’s
                                                                   provisions were considered adequate, and so it has no deficit,
      • The highest rating among banks in Portugal
                                                                   and the assessment of its solvency levels led to an increase of 10
        (equal to the sovereign).
                                                                   basic points in its Tier 1 ratio.
      In results:
      • Profits plunged 61.8%, due to the 18.3% fall in            Strategy
         gross income and the 87.7% rise in provisions.            Following the country's request for aid at the beginning of
      • Costs (-2.1%) fell for the second year running.            2011, the financial sector had to refocus its strategy in order
                                                                   to meet the targets on capital, deleveraging and liquidity
      Best Bank in Portugal prize from The Banker and
                                                                   necessary to comply with the Financial Plan agreed with
      Euromoney
                                                                   European Authorities.
                                                                   Santander Totta has adopted measures that enable it to
                                                                   advance in the plan's financial targets, while strengthening the
                                                                   relationship with its customers by offering products adequate
                                                                   to the customers' savings needs (Depósito Vencedor, Seguros
Santander Totta’s attributable profit was EUR 174 million,         Financieros, Cuentas Poupança) which would offer them
61.8% less than in 2010. This was due to the 18.3% reduction       liquidity and profitability at various maturities.
in gross income, as a result of deleveraging and higher funding
cost, and the rise of 87.7% in provisions.                         This strategy, coupled with increased transactions with
                                                                   customers, enabled the bank to significantly increase its
Environment                                                        deposit base.
Economic conditions worsened, particularly in the fourth
quarter, which intensified the recession, especially domestic      Selective growth in lending, while tending to the corporations
demand. The unemployment rate rose to around 13%,                  financial needs mainly through products such as
disposable income dropped because of higher taxes and              factoring/confirming and international factoring, reaching
conditions in the financial markets deteriorated with higher       market shares of 19% and 23% respectively. Moreover, the
spreads on Portuguese loans.                                       support of SMEs via the program with government's guarantee
                                                                   (PME Investe), gave Santander Totta an 18% participation in
                                                                   these operations.


Total assets                      Activity                         Reduction commercial GAP             Loans / deposits
Billion euros                     % variation 2011 / 2010          Billion euros                        %

-9.6%     2011-2010
                                                            +8.0


                                                                                                            216
                                                                                                 3.4
                49


                         45


                                                                                                                         139
                                                                                    2.0


                                                                                                                                    121
                                               -5.6


         2010         2011                Loans       Deposits               2011         Achieved in       2009        2010       2011
                                                                             Plan          the year


110                                                                                                                ANNUAL REPORT 2011
In addition, Santander Totta started an innovative project in     Net fee income dropped 3.5% to EUR 345 million, reflecting
the country to support exporting companies (Solução               the net difference between the drop in lending, mutual funds
Exportacão), through the offer of products suitable for this      and financial insurance and the better performance of fee
segment and advice by specialists of the bank. For this purpose   income from GBM.
Santander Totta can count on the support of the Group's
international network, incorporating the companies to the         The rest of income amounted to EUR 35 million, less than in
International Desk model, providing them with a rapid route       2010 because of reduced gains on financial transactions and
of contacts abroad as well as integrated solutions. This          lower results from insurance activity. Income from the equity
operation directly supports not only the sector's companies,      accounted method increased 37.7%.
but also the country's growth.
                                                                  Gross income declined 18.3% to EUR 972 million.
Additionally, Santander Totta has three main finanial strategic
                                                                  Operating expenses declined in all lines (personnel, other
lines:
                                                                  administrative costs and amortisations) for the second straight
– Large deleveraging, reflected in the improvement in the         year and were 2.1% lower.
  commercial gap and in the loan-to-deposit ratio, which
                                                                  Loan-loss provisions were 87.7% higher at EUR 206 million.
  improved from 216% at the end of 2009 to 139% in 2010
                                                                  This increase reflects a prudent policy of adapting to the
  and 121% in 2011.
                                                                  difficulties of the economic cycle, which are strongly increasing
– Strengthening of the balance sheet, with a big rise in          NPLs. At the end of 2011 the NPL ratio stood at 4.06% and
  provisions.                                                     coverage at 55%.

– Strict control of costs (-2.1% in nominal terms).               In this environment Santander Totta's credit quality indicators
                                                                  continue to be clearly above the sector's average.
Activity
Deposits kept its dynamic evolution and amounted to EUR           Profit before tax was EUR 187 million, 66.7% lower than in
23,465 million, 8% more than in 2010. Lending, on the other       2010. Attributable profit after taxes and minority interests was
hand, reflected the deterioration of economic conditions and      EUR 174 million.
dropped 6% to EUR 28,403 million in all segments (SMEs: -12%,
                                                                  In short, in a extremely complex year in the country to carry
companies: -14% and individuals -3%).
                                                                  out banking business, Santander Totta was the only large bank
The evolution of deposits and lending, the result of              to produce profits, it has the most solid balance sheet of the
deleveraging, improved the structure of the balance sheet and     Portuguese banking sector. Its NPL ratio is well below that of
reduced the commercial gap by EUR 3,436 million (initially        competitors, it has higher coverage ratios and a better capital
goal of EUR 2,000 million for the whole year).                    ratio.

Mutual funds declined 42%, and reflected the greater aversion
to risk and the greater focus on on-balance sheet products.
Results
Santander Totta’s results compared to 2010 were as follows.
Gross income was determined by the performance of net
interest income, which was 18.2% lower than in 2010 at EUR
592 million. This evolution was due to lower lending and the
higher cost of wholesale and retail funding due to the tougher
competition in capturing deposits. These effects could not be
offset by an improvement in credit spreads.


Net operating income              Attributable profit             NPL ratio                         NPL coverage
Million euros                     Million euros                   %                                 %

-31.9%     2011-2010             -61.8%     2011-2010
                                                                                          4.06
                650


                                                                                                                  60


                                                                                                                          55
                         443


                                                  456


                                                                                2.90
                                                           174


        2010          2011                2010          2011             2010          2011                2010        2011


      ANNUAL REPORT 2011                                                                                                        111
Banking business grew at rates of close to 10%.
Retail Poland (BZ WBK)
                                                                      Poland needs to complete its infrastructure and it has a low level
      Consolidated as of April 1, 2011.                               of “bankarisation” (loans only represent around 50% of GDP).

      Attributable profit of EUR 232 million in the three             All of this raises good expectations for banking business.
      quarters. On a local pro forma basis, profit was
                                                                      Strategy
      21.6% higher for the whole year.                                On April 1, Banco Santander completed the acquisition of 96%
      Both lending and deposits increased 14% since the               of BZ WBK after the takeover launched in the first quarter for
                                                                      100% and the 50% of BZ WBK Asset Management still in the
      bank’s incorporation to the Group.
                                                                      hands of AIB. The BZ WBK Group is now integrated into Grupo
      Solid funding structure: loan-to-deposits ratio of              Santander, consolidating its results and business as of the
      82%.                                                            second quarter.

      High growth potential due to the favourable                     BZ WBK has the third largest branch network in Poland (622
                                                                      including 96 agencies), 9,382 employees, 2.4 million retail
      macroeconomic environment, solid presence in the
                                                                      customers and close to EUR 20,000 million of loans and
      market, management capacity and generation of
                                                                      customer funds (mostly deposits).
      synergies.
                                                                      Its business model is commercial banking, focusing on retail
                                                                      and company clients (SMEs and corporations), complemented
                                                                      by a notable presence in asset management, brokerage of
                                                                      securities and leasing. All of this fits well with Santander’s retail
BZ WBK, in the nine months of its consolidation, posted an
                                                                      business model and provides a significant growth potential in
attributable profit of EUR 232 million. For comparison
                                                                      results in the next few years, both via business as well as from
purposes, the profit for the whole year in local criteria was EUR
                                                                      synergies.
288 million (+21.6%).
                                                                      As part of the bank’s integration into Grupo Santander, in the
Environment
                                                                      first nine months under Santander management, and in
BZ WBK enables Grupo Santander to develop its activity in
                                                                      cooperation with the local management team, the first steps
Poland, a country with considerable potential: 38.5 million
                                                                      were taken to ensure the improvements in operational and
citizens and an economy whose size is more than 40% of that
                                                                      commercial efficiency announced to the market. Of note
of the other new EU members.
                                                                      were:
Its economy is stable (it is the only EU country not to have
                                                                      • Measures to control costs in technology and operations were
suffered a recession in the last decade), growing (4% forecast
                                                                        made, as well as the global integrator of Group purchases,
for 2011) and supported by domestic demand (acceleration of
                                                                        with short-term goals.
consumption and pick up in investment). Inflation rose during
the first 10 months of the year to 4.3% and made the country’s        • The financial and risk areas adjusted their structures,
central bank raise its interest rates to 4.5% (+100 b.p. since the      processes and information systems in order to ensure control
end of 2010). The zloty remained stable against the euro until          and homogeneity. Of note was the progress made in
August when uncertainty in the markets weakened the currency            implementing the corporate risk model.
(PLN 4.46 at the end of 2011).


Loans (Local criteria)             Deposits (Local criteria)          Net operating income                        Attributable profit
Constant million euros             Constant million euros             (Local criteria) Million euros              (Local criteria) Million euros
+ 14.5%     2011-2010             + 13.8%     2011-2010               + 4.3%*        2011-2010                    + 18.1%*         2011-2010
                                                                      (*) Excluding exchange rate impact: +7.4%   (*) Excluding exchange rate impact: +21.6%
                                                             10,505


                                                                                                      465


                                                                                                                                                   288
                          8,845


                                                                                       445
                                                9,227
             7,726


                                                                                                                                    244


       Mar’11        Dic’11              Mar’11         Dic’11                  2010            2011                         2010           2011


112                                                                                                                            ANNUAL REPORT 2011
• The launch of global business units which garner local                Other Continental Europe
  knowledge and the Group’s experience. Tangible progress
  was made in Global Banking and Markets on the basis of the        Attributable profit was EUR 424 million, 48.5% less than in
  clients of the Global Relationship Model in the country.          2010. The performance of the various businesses (GBM, asset
                                                                    management, insurance and Banif) varied.
• Analysis and identification of the best practices in commercial
  banking, based on the long experience of both banks.              Global Wholesale Banking, which provided 69% of gross
                                                                    income and 90% of profits, posted a 51.7% fall in attributable
Activity                                                            profit (EUR 382 million), hit by market weakness and tensions
BZ WBK registered as of September EUR 8,479 million of net          in the last few quarters, as well as by the Group’s strategy to
loans and EUR 10,359 million of deposits (1.1% and 1.6% of          give priority to reducing risk and releasing capital and liquidity.
the Group’s total lending and deposits, respectively).
                                                                    Gross income was 24.5% lower, due to gains on financial
In the first nine months under Santander management, loans          transactions, as in 2010 they amounted to EUR 452 million
and deposits increased 14%, with a double-digit rise in the         (loss of EUR 57 million in 2011, affected by the negative
balances of companies and high single digit with individual         performance of the last few quarters). Net interest income rose
customers.                                                          12.6%.
Results                                                             Costs rose 8.0%, due to the investments in equipment and
Attributable profit (nine months) was EUR 232 million, backed       technology, while provisions increased due to the environment
by solid gross income of EUR 690 million. Of this amount, EUR       and the lower use of generic provisions.
371 million came from net interest income, which improved its
return on assets after the rise in interest rates, and EUR 248      Better performance of insurance business. Attributable profit
million from fee income, due to the importance of asset             was 29.5% higher at EUR 35 million, fuelled by revenues
management business and brokerage of securities.                    (+9.1%) and management of costs (-19.2%).

Loan-loss provisions (EUR 60 million) absorbed only 16% of net      Banif’s net interest income and fee income increased 7.8%,
operating income. In line with the macroeconomic situation, the     which coupled with a fall in loan-loss provisions and
NPL ratio was 4.89%, lower than when the bank was integrated        writedowns pushed up attributable profit by 39.7% to EUR 22
into Grupo Santander, and coverage 65%.                             million.

In local criteria, these results compared very well with those of   Attributable profit from asset management was EUR 10 million
2010, as basic revenues increased 8.2%, provisions were 12.8%       (EUR 11 million in 2010). The main developments were in
lower and attributable profit 21.6% higher.                         gross income, which remained virtually unchanged, lower
                                                                    costs and an unfavourable impact in taxes. Net operating
                                                                    income was better, spurred by mutual funds that did not feed
                                                                    through to profits because of the impact of higher taxes.


     ANNUAL REPORT 2011                                                                                                             113
United Kingdom
Million euros

                                                                                                                           Variation
                                                                                                        2011       2010     amount              %
Income statement
Net interest income                                                                                    4,176      4,766      (590)         (12.4)
Net fees                                                                                               1,070      1,027          44            4.3
Gains (losses) on financial transactions                                                                 405        462        (57)         (12.4)
Other operating income (1)                                                                                26         30           (4)       (12.8)
Gross income                                                                                           5,678      6,285      (607)           (9.7)
Operating expenses                                                                                    (2,554)    (2,549)          (5)          0.2
  General administrative expenses                                                                     (2,203)    (2,241)         37           (1.7)
     Personnel                                                                                        (1,391)    (1,295)        (96)           7.4
      Other general administrative expenses                                                             (812)      (946)       134          (14.1)
  Depreciation and amortisation                                                                         (351)      (309)        (42)          13.6
Net operating income                                                                                   3,123      3,735      (612)         (16.4)
Net loan-loss provisions                                                                                (585)      (930)       345          (37.1)
Other income                                                                                            (972)      (105)      (866)         822.7
Profit before taxes                                                                                    1,567      2,700    (1,133)         (42.0)
Tax on profit                                                                                           (422)      (734)       313          (42.6)
Profit from continuing operations                                                                      1,145      1,965      (820)         (41.7)
Net profit from discontinued operations                                                                    —          —           —             —
Consolidated profit                                                                                    1,145      1,965      (820)         (41.7)
Minority interests                                                                                          0          0          (0)       (99.5)
Attributable profit to the Group                                                                       1,145      1,965      (820)         (41.7)

Balance sheet
Customer loans (2)                                                                                    252,154    233,856     18,298            7.8
Trading portfolio (w/o loans)                                                                          41,440     45,187     (3,747)          (8.3)
Available-for-sale financial assets                                                                        55        204        (149)       (73.0)
Due from credit institutions (2)                                                                       19,672     29,137     (9,465)        (32.5)
Intangible assets and property and equipment                                                            2,288      2,323          (35)        (1.5)
Other assets                                                                                           39,833     42,063     (2,230)          (5.3)
Total assets/liabilities & shareholders' equity                                                      355,443    352,769       2,673            0.8
Customer deposits (2)                                                                                 194,318    184,548       9,770            5.3
Marketable debt securities (2)                                                                         70,504     64,326       6,179            9.6
Subordinated debt (2)                                                                                   8,260      8,143          116           1.4
Insurance liabilities                                                                                      —           1            (1)    (100.0)
Due to credit institutions (2)                                                                         31,178     54,179   (23,000)          (42.5)
Other liabilities                                                                                      38,330     29,811       8,519          28.6
Shareholders' equity (3)                                                                               12,852     11,762       1,090            9.3
Other customer funds under management                                                                 15,744     14,369       1,375            9.6
  Mutual funds                                                                                         15,744     14,369       1,375            9.6
  Pension funds                                                                                            —          —             —            —
  Managed portfolios                                                                                       —          —             —            —
  Savings-insurance policies                                                                               —          —             —            —
Customer funds under management                                                                      288,826    271,386     17,440             6.4

(1).- Including dividends, income from equity-accounted method and other operating income/expenses
(2).- Including all on-balance sheet amounts for this item
(3).- Not including profit of the year


114                                                                                                                        ANNUAL REPORT 2011
Strategy
United Kingdom                                                          Santander UK maintained market shares of 14% in residential
                                                                        mortgages and 10% in retail deposits. It also continued to
        Attributable profit of £993 million:
                                                                        widen its range of products and services, while growth in
        • Lower revenues (-8.6%) impacted by increased                  lending to SMEs remained one of its main priorities.
          liquidity requirements, higher funding costs and
          lower trading gains.                                          Santander UK’s goal is to become a full service, diversified,
                                                                        customer-centred commercial banking franchise. The strategy
        • Provisions 36.3% lower, with arrears performing               has three basic principles: focus on the customer more than on
          better than envisaged.                                        the product, business diversification toward a more balanced
        • Provision of £538 million net of tax in June for              mix and continued operational efficiency compatible with a
          payment protection insurance (PPI) remediation.               good level of customer service.
        Moderate increase in lending (+4.6%) and in                     Our proprietary market-leading IT platform is integral to
        deposits (+2.2%).                                               meeting these goals. We will invest £490 million over the next
        Better funding structure: £25,000 million of                    three years to further improve its functionality and capabilities,
        medium-term funding issuances, with management                  at which point the ability to differentiate and grow the
        seeking to reduce short-term funding and                        businesses faster will be in place.
        unprofitable retail deposits.
                                                                        Activity
        Awarded ‘UK Bank of the Year’ by The Banker for                 Santander UK is focused on the United Kingdom (85% of its
        the third year in succession.                                   balance sheet). More than 80% of customer loans are
                                                                        mortgages for homes in the UK. The portfolio of mortgages is
                                                                        of a high quality, with no exposure to self-certified or subprime
                                                                        mortgages and less than 1% of buy-to-let loans.
Santander UK posted an attributable profit of £993 million,
41.0% less than in 2010.                                                The loan-to-deposit ratio was 130% at the end of 2011, a
                                                                        slight deterioration compared to 2010, largely due to the
This included the impact net of tax of a provision of £538              managed outflow of rate-sensitive deposits in the second half
million in the second quarter, related to payment protection            of 2011.
insurance (PPI) remediation, in line with what has been done by
other British banks. In addition, there were higher costs derived       The following information on activity is in local criteria.
from regulatory changes affecting increased liquidity                   Customer loans amounted to £203,261 million, 2% more than
requirements and higher wholesale funding costs. All of this            in 2010 and driven by the strong increase in loans to SMEs
was in the context of a weak growth and low interest rates              (+25%), offsetting the reduction in unsecured personal loans.
environment.                                                            The stock of residential mortgages was largely unchanged.

Environment                                                             Gross mortgage lending amounted to £23,705 million, £477
GDP growth continued to grow weakly, with an increase of                million less than in 2010. Despite this decline, our gross lending
0.9% for 2011, but with gradually worsening growth rates                market share in the fourth quarter increased to 19.5%, well
which resulted in a negative fourth quarter (-0.8%) annualised.         above our stock share. The fourth quarter results followed the
Inflation (4.5% on average for the year) increased at a faster          improved position of the third quarter, following a sluggish start
pace than the average growth of wages and this reduction in             to the year. Spreads improved, while the new business loan-to-
real terms is impacting consumers and eroding confidence                value (LTV) was 65% and the indexed stock LTV was 53%.
indices.
                                                                        Loans to SMEs via the network of regional business centres
In this environment of uncertainty, the Bank of England held            kept up their strong pace of growth and amounted to
base rates at 0.5% and boosted its quantitative easing                  £10,748 million at the end of 2011, 25% higher than in
programme by £75,000 million to £275,000 million, despite               2010. The market share was 4.3%, 0.7 p.p. greater than in
the increased rate of inflation in 2011.                                December 2010.


Mortgages                           Companies’ loans                    Activity                              Loans / deposits
Billion sterling (local criteria)   Billion sterling (local criteria)   % variation 2011 / 2010 in sterling   %

0%    2011-2010                     +16%      2011-2010
                166


                              166


                                                                                                                                     130
                                                                  31


                                                                                                                  127
                                                                                      +4.6
                                                    27


                                                                                                   +2.2


         2010           2011                 2010           2011                 Loans       Deposits             2010              2011


       ANNUAL REPORT 2011                                                                                                               115
In line with the policy of restricting personal loans (UPLs), the            Net interest income was 11.3% lower, reflecting the higher
balance was 13% lower than in 2010 (£2,883 million). During                  cost of liquid assets. The total commercial spread was lower at
2011, this product began to be selectively marketed at better                1.85%, with higher spreads on loans more than offset by the
risk-adjusted spreads to low risk customers. Gross lending                   greater cost of liquidity and funding. Increases in the
increased 14% relative to 2010.                                              proportion of customers on standard variable rate mortgages
                                                                             helped to partly mitigate the impact of low interest rates.
Santander UK continued to dispose of non-core assets. The                    Higher net interest income in SMEs and corporations reflected
portfolio ended the year at £5,889, 38% lower than at end                    growth in deposits and loans, with spreads on new loans
2010 and 73% below December 2008.                                            continuing to increase.
Retail deposits (£149,192 million) were 3% lower than in 2010.               Net fee income was 5.5% higher, due to a new pricing
The acquisition of deposits slowed in what was a smaller                     structure for current accounts where overdraft interest charges
market of flow and where increased competition led to                        have been replaced with a flat fee.
negative pricing and margins. A managed outflow of these
more rate-sensitive and shorter term deposits was more than                  Gains on financial transactions declined 11.3%, due to the
offset through the additional issuance of medium-term                        impact of lower market activity.
funding.
                                                                             Operating expenses were 1.4% higher, (3% lower in real terms)
This strategy enabled the bank’s funding position to improve                 due to the recruitment of 1,100 people to improve customer
with medium-to long-term funding issuances of £25,000                        service, completed in the first half of 2011, which enabled
million and a substantial reduction in short-term financing. The             Santander UK to repatriate to the UK call centres that were
issuances cover a wide range of products at attractive rates                 abroad, as well as continued investments in Corporate Banking
within the market environment.                                               and Global Banking & Markets. The efficiency ratio was 45.0%.
The opening of some 836,000 current accounts in 2011                         Loan-loss provisions were 36.3% lower, due to the improved
continued to reflect the effort and success in attracting quality            evolution of retail products and to a better than expected
customers.                                                                   arrears performance in the current environment.
A marketing campaign was launched in September to promote                    The NPL ratio was 1.86%, 0.10 p.p. higher than that of 2010.
new current accounts and credit cards, as part of a new                      There was a better performance in all retail products,
strategy to develop better and more lasting relations with                   particularly mortgages and unsecured personal loans, and a
customers. The new current account offers better incentives to               slight deterioration in the fourth quarter in corporate loans,
existing customers, who change their primary account to                      including real estate. The stock of properties in possession
Santander, and the 123 Cashback credit card offer                            remained very low (0.06% of the total portfolio compared to
(reimbursements / rebates on purchases) has helped to increase               0.05% at the end of 2010). In general, the trends were better
openings of credit cards (total: 543,000; +25%).                             than the sector’s, according to the data from the Council of
                                                                             Mortgage Lenders (CML).
Results
Gross income declined from £5,386 million in 2010 to £4,925                  As a result, attributable profit for the year was £993 million.
million, largely due to increased regulatory liquidity
requirements and the higher costs of funding.


Net operating income                   Attributable profit                   NPL ratio                          NPL coverage
Million euros                          Million euros                         %                                  %

-16.4%*          2011-2010            -41.7%*          2011-2010
(*) In sterling: -15.4%               (*) In sterling: -41.0%
                                                                                                     1.86
                   3,735


                                                                                           1.76
                              3,123


                                                          1,965


                                                                                                                              46


                                                                                                                                      38
                                                                     1,145


            2010           2011                   2010            2011              2010          2011                 2010        2011


116                                                                                                                     ANNUAL REPORT 2011
Latin America
Million euros

                                                                                                                               Variation
                                                                                                        2011          2010      amount           %
Income statement
Net interest income                                                                                   16,473       14,678        1,795        12.2
Net fees                                                                                                4,992        4,661           331        7.1
Gains (losses) on financial transactions                                                                1,067        1,410         (344)     (24.4)
Other operating income (1)                                                                                 (90)         (74)         (16)      22.0
Gross income                                                                                          22,442       20,676        1,766          8.5
Operating expenses                                                                                     (8,909)      (7,971)        (938)       11.8
  General administrative expenses                                                                      (7,984)      (7,193)        (790)       11.0
     Personnel                                                                                         (4,456)      (3,955)        (501)       12.7
      Other general administrative expenses                                                            (3,528)      (3,238)        (290)        9.0
  Depreciation and amortisation                                                                          (925)        (778)        (148)       19.0
Net operating income                                                                                  13,533       12,705           828         6.5
Net loan-loss provisions                                                                               (5,447)      (4,687)        (760)       16.2
Other income                                                                                           (1,029)        (747)        (282)       37.7
Profit before taxes                                                                                     7,057        7,271        (214)       (2.9)
Tax on profit                                                                                          (1,654)      (1,693)            39      (2.3)
Profit from continuing operations                                                                       5,402        5,578        (175)       (3.1)
Net profit from discontinued operations                                                                      —            —            —         —
Consolidated profit                                                                                     5,402        5,578        (175)       (3.1)
Minority interests                                                                                         738          850        (111)     (13.1)
Attributable profit to the Group                                                                        4,664        4,728          (64)      (1.4)

Balance sheet
Customer loans (2)                                                                                    139,867      127,268      12,599          9.9
Trading portfolio (w/o loans)                                                                          31,705       31,580          125         0.4
Available-for-sale financial assets                                                                    26,186       30,697      (4,511)      (14.7)
Due from credit institutions (2)                                                                       19,181       21,632      (2,450)      (11.3)
Intangible assets and property and equipment                                                            4,312        4,880         (568)     (11.6)
Other assets                                                                                           53,594       57,186      (3,592)        (6.3)
Total assets/liabilities & shareholders' equity                                                      274,845      273,243        1,603          0.6
Customer deposits (2)                                                                                 134,078      137,848      (3,770)        (2.7)
Marketable debt securities (2)                                                                         23,253       15,376        7,877        51.2
Subordinated debt (2)                                                                                   6,015        5,683          332         5.8
Insurance liabilities                                                                                      —         9,515      (9,515)     (100.0)
Due to credit institutions (2)                                                                         46,813       38,103        8,710        22.9
Other liabilities                                                                                      45,170       45,913         (743)       (1.6)
Shareholders' equity (3)                                                                               19,516       20,805      (1,289)        (6.2)
Other customer funds under management                                                                 69,902       77,180      (7,278)        (9.4)
  Mutual funds                                                                                         55,829       61,621      (5,792)        (9.4)
  Pension funds                                                                                            —            —             —          —
  Managed portfolios                                                                                   14,073       14,800         (728)       (4.9)
  Savings-insurance policies                                                                               —           758         (758)    (100.0)
Customer funds under management                                                                      233,248      236,087      (2,838)        (1.2)

(1).- Including dividends, income from equity-accounted method and other operating income/expenses
(2).- Including all on-balance sheet sheet balance sheets for this item
(3).- Not including profit of the year


       ANNUAL REPORT 2011                                                                                                                       117
The emergence of an increasingly more adverse external
Latin America                                                             scenario as the year progressed, particularly in the second
      Basic revenues from business increased 12.1% and                    quarter, led central banks to change the bias of their monetary
                                                                          policies. After raising interest rates until July, they began to
      were the main driver in profit growth.
                                                                          show their readiness to lower them. Only Brazil’s central bank
      Costs were 13.0% higher due to installed capacity                   decided to begin to cut interest rates, leaving the Selic at 11%
      and some pressure from inflation and the signing of                 at the end of the year (-150 b.p. since July). The central banks of
      collective agreements.                                              Colombia and Uruguay were the only ones to break with this
                                                                          trend and in the last months of 2011 lifted their key rates by 25
      Loan-loss provisions were 16.7% higher, below                       b.p. in Colombia to 4.75% and by 75 b.p. in Uruguay to 8.75%.
      lending growth.
                                                                          Budget deficits continued the reduction begun in 2010,
      Net operating income after provisions increased
                                                                          although at a more moderate pace, thanks to higher tax
      1.9%.                                                               receipts and the end of public investment programmes begun in
      Strong business activity, reflected in a faster pace of             2008-2009. The fiscal deficit was around 2.3% of GDP for the
      lending (+18%) and deposits (+9%) in all countries.                 region, slightly better than in 2010 (2.4%), but a very healthy
                                                                          level. The region thus has a good starting point if the situation
      Best bank in Latin America according to                             worsens and makes it necessary to implement a more expansive
      Euromoney.                                                          policy. The public debt to GDP ratio is very moderate at close to
                                                                          30% on the average for the region.
                                                                          The evolution of external accounts was also good, with a larger
                                                                          trade surplus than in 2010, as a result of lower growth in
                                                                          imports than in exports, although both continued to expand at
Santander generated attributable profit of EUR 4,664 million in           double-digit rates in most countries. Thanks to this, the current
2011, 1.4% less than in 2010 (+0.1% in constant currency).                account deficit for the region remained below 2% of GDP, in
                                                                          line with 2010. This presents no funding problems given the
The main developments were the notable rise in basic revenues             high level of international reserves (close to $680,000, or 14%
(+12.1%), which did not feed through to profits as it was offset          of the region’s GDP).
by the fall in gains on financial transactions due to the market
situation, the commercial investments and the rise in loan-loss           The main impact of the international financial turbulence on
provisions (+16.7%, but less than the 18% increase in lending).           Latin America was felt in its currency and stock markets. Latin
                                                                          American currencies depreciated 10.6% on average in 2011
Economic environment                                                      against the dollar and the main stock market indices fell 14.7%
Following the solid recovery in 2010, overcoming the crisis of            in local currency.
2008-2009, Latin America’s economic growth eased in 2011 to
more sustainable rates (around 4%), and some countries are                On the basis of the countries where Santander operates (Brazil,
beginning to be affected by the deterioration of the                      Mexico, Chile, Argentina, Colombia, Uruguay, Peru and Puerto
International environment.                                                Rico), banking business recovered its growth rates and increased
                                                                          17%. Lending accelerated to 20%, excluding the exchange rate
Domestic demand remained buoyant, although on a downward                  impact. Loans to individual customers grew 21% (cards: +23%;
trend during 2011. The contribution of external demand was                consumer: +17% and mortgages: +27%), while credit to
less negative than in 2010, due to a sharper fall in imports than         companies and institutions increased 19%.
in exports.
                                                                          Savings growth eased a little, but remained double-digit (+15%).
Inflation began to rise and reached an average of 5.7% in                 Demand deposits rose 13%. Generally speaking, and on the
September, to end the year at 5.6%, slightly above the 5.5% of            basis of the main financial systems, Brazil’s growth was the most
2010.                                                                     dynamic, while that of Chile (together with Mexico) was more
                                                                          moderate.


Loans                                Savings                              Net interest income /                      Net operating income
% y-o-y variation w/o forex impact   % y-o-y variation w/o forex impact   provisions % o/ ATAs                       Million euros

                                                                                                                    + 6.5%*        2011-2010
                                                                            6.10                                    (*) Excluding exchange rate impact: +7.3%
                                                                                              6.04
                                                                                                     Net interest
                        +17.9


                                                                                                      income
                                                                                                                                                     13,533
                                                                                                                                      12,705
             +14.7


                                                                            4.15
                                                   +8.1


                                                                                              4.04


                                                                                                     Provisions
                                                             +2.0


                                                                            1.95              2.00

      2010           2011                   2010          2011             2010              2011                              2010            2011


118                                                                                                                              ANNUAL REPORT 2011
Because of their impact on business and on converting figures
into euros, the evolution of interest rates and exchange rates is
                                                                                         Main focuses of management in 2011
commented on:                                                                            1. Permanent watch on capital, liquidity and business
• Average short-term interest rates, based on the region’s                                  risks
  average weighted rate, rose between 2010 and 2011.
                                                                                         2. Focus on generating revenues, with strong business,
• The evolution of results in euros is affected by average                                  management of spreads and activities that generate
  exchange rates. In global terms, Latin American currencies                                fee income.
  appreciated against the dollar (except the Argentine peso),
  while the dollar, the reference currency in Latin America,                             3. Selective growth in lending centred on net risk
  depreciated 5% against the euro. In average terms, the                                    premiums.
  Brazilian real and the Chilean peso appreciated a little (from                         4. Management of customers, focused on linkage,
  2.33 to 2.32 and from 674 to 672, respectively), while the                                transactions and credit quality improvement.
  Mexican peso depreciated from 16.70 to 17.25.
                                                                                         5. Investment in installed capacity in all countries under
Strategy in 2011
                                                                                            the principle of austerity and efficiency.
The financial systems maintained high levels of solvency, liquidity
and credit quality. The strong growth in lending and savings is
beginning to slacken due to the international scenario.
                                                                                        • In July, a global agreement was reached with Zurich for it to
In these circumstances, the Bank continued to keep watch on its                           acquire 51% of the holding which groups the insurers in
levels of capital, liquidity and exposure to business risks. This                         Argentina, Brazil, Chile, Mexico and Uruguay, as well as a
resulted in harmonious growth in the balance sheet, but with a                            product distribution agreement in those countries. During the
clear emphasis on customer deposits and safeguarding the                                  third and fourth quarters, the 51% stake was sold to Zurich
liquidity position.                                                                       and it incorporated the insurers in the countries, after
The Bank also continued to focus on selective growth in                                   obtaining authorisations from local supervisors and from the
lending, managing spreads, optimising the mix of products and                             European Union.
segments and handling appropriately the risk/return relation.                           • In the fourth quarter, the Group completed the sale in the
In a less dynamic context, the bank weighed up all the new                                secondary market of 7.82% of Banco Santander Chile for
commercial projects from the standpoint of future profitability,                          $950 million. This left Grupo Santander with 67% of this
within the principles of austerity and efficiency which create                            bank.
shareholder value.                                                                      • Also in the fourth quarter, the Group announced an
The Group also kept the emphasis on customer management,                                  agreement to sell its business units in Colombia to the Chilean
focusing on linkage, transactions and better quality service.                             group CorpBanca for $1,225 million (estimated capital gains
                                                                                          of EUR 615 million). This operation is due to be completed
In 2011, Grupo Santander carried out the following operations                             during 2012 and it is subject to obtaining the authorisations
in Latin America:                                                                         from the regulatory bodies and a takeover bid delisting Banco
                                                                                          Santander Colombia shares aimed to minority shareholders
• Santander Mexico acquired in the second quarter a portfolio                             who have 2.15% of Santander Colombia. The 2011 results do
  of mortgages from GE Capital Corporation for $1,870                                     not yet incorporate these capital gains.
  million.


Net operating income                         Attributable profit                        NPL ratio                         NPL coverage
after LLPs Million euros                     Million euros                              %                                 %

+ 0.8%*        2011-2010                    -1.4%*       2011-2010
(*) Excluding exchange rate impact: +1.9%   (*) Excluding exchange rate impact: +0.1%
                                                                                                                4.32


                                                                                                                                        104
                                8,086


                                                                                                                                                 97
                                                                                                      4.11
                 8,018


                                                              4,728


                                                                             4,664


          2010            2011                         2010            2011                    2010          2011                2010         2011


        ANNUAL REPORT 2011                                                                                                                             119
At the end of 2011, Grupo Santander had 6,046 points of                Results
attention in Latin America including traditional branches and          Net interest income rose 13.1%, due to larger volumes and
other points of attention and 27,975 ATMs.                             management of spreads in a context of higher interest rates
                                                                       than in 2010.
The number of customers reached 41.7 million, an increase of
1.4 million. The Group’s strategic in 2011 was focused more on         Net fee income increased 8.7%, with that from insurance up
customer linkage than on capturing new customers. Grupo                31.7% and cards 23.7%, while those from managing accounts
Santander is the leading franchise in the region, with business        fell 16.6%. Income from insurance business grew 16.9%,
volumes almost double those of the next competitor. Taking             affected by the impact of the agreement with Zurich (excluding
advantage of the synergies of Santander's differential position in     this impact: +34.8%).
the region, the bank launched International Desk, a project
designed to support SMEs in their internationalisation process,        As a result, basic revenues were 12.1% higher than in 2010,
exploiting the competitive advantage of having the largest             and the fourth quarter was a record one.
branch network in Latin America.
                                                                       Gains on financial transactions dropped 23.5%, due to the
The main developments in business 2011 are set out below. All          volatility of markets in the third and fourth quarters. This fall
percentage changes exclude the exchange-rate impact.                   was more than offset by the rise in basic revenues and gross
                                                                       income increased 9.5%.
Activity
In Latin America (excluding the balances in the New York               Operating expenses were up 13.0%, higher than the inflation
branch, which are more volatile), lending increased 18% (cards:        rate, due to various factors: growth in staff in the networks,
+25%; commercial credits – companies and institutions – +18%:          renegotiation of fees and collective agreements, new business
mortgages: 25% and consumer loans +14%).                               projects, increased installed capacity and redesigning points of
                                                                       attention. The efficiency ratio remained at around 40%.
Also excluding the New York branch, savings rose 5%. Deposits
excluding repos increased 9%, with good performance of time            Loan-loss provisions rose 16.7%, partly due to greater generic
deposits: +22%, while mutual funds dropped 2%.                         provisions. The risk premium went from 3.63% in 2010 to
                                                                       3.81% in 2011. The NPL ratio was 4.32% and coverage 97%,
The average market shares in the countries where the Group             (4.11% and 104% respectively in 2010).
operates are 11.2% in loans; 8.3% in savings and 9.4% in total
banking business.                                                      The Group's attributable profit in the region was EUR 4,664
                                                                       million.
                                                                       Retail Banking’s attributable profit rose 0.8%, while Global
                                                                       Wholesale Banking and Asset Management and Insurance's
                                                                       dropped 1.5% and 1.4% respectively.


Latin America. Income statement
Million euros

                                                                          Gross                Net operating                    Attributable
                                                                        income                       income             profit to the Group
                                                                2011     Var (%)            2011       Var (%)           2011        Var (%)

Brazil                                                       15,940         11.3           9,963         10.6            2,610          (7.2)
Mexico                                                        2,383           1.1          1,387          (3.3)            936          40.9
Chile                                                         2,077           2.2          1,264          (2.5)            611          (9.0)
Argentina                                                       926         12.3             472           4.7             287          (2.7)
Uruguay                                                         172           1.6             40        (46.8)              20        (70.3)
Colombia                                                        207         11.0              91         21.8               58          43.0
Puerto Rico                                                     344          (5.3)           169          (9.3)             34        (10.1)
Rest                                                            105        (24.3)            (15)           —              (24)           —
Subtotal                                                    22,153            8.6         13,371           6.6           4,531         (1.2)
Santander Private Banking                                       289           2.2            162          (0.4)            133          (4.8)
Total                                                       22,442            8.5         13,533           6.5           4,664         (1.4)


120                                                                                                                 ANNUAL REPORT 2011
Latin America. Main units
Million euros

                                                                                            Brazil               Mexico                 Chile
                                                                              2011        Var (%)       2011     Var (%)     2011      Var (%)
Income statement
Net interest income                                                        12,061            15.3       1,680       4.1      1,543         2.9
Net fees                                                                     3,253             8.4        603        6.3       422         2.7
Gains (losses) on financial transactions                                       757          (22.4)         98     (44.3)         77     (14.3)
Other operating income (1)                                                    (131)           15.2           1        —          36        8.1
Gross income                                                               15,940            11.3       2,383       1.1      2,077         2.2
Operating expenses                                                          (5,976)           12.4       (996)       8.0      (814)       10.4
  General administrative expenses                                           (5,326)           10.8       (887)       8.9      (724)       11.2
     Personnel                                                              (2,927)           12.9       (466)       8.4      (459)       12.2
      Other general administrative expenses                                 (2,399)            8.3       (422)       9.5      (265)        9.4
  Depreciation and amortisation                                               (651)           27.9       (108)       1.2        (89)       4.5
Net operating income                                                         9,963           10.6       1,387      (3.3)     1,264       (2.5)
Net loan-loss provisions                                                    (4,508)           21.5       (337)    (28.0)      (380)       17.6
Other income                                                                (1,102)           47.6          33        —          40       31.8
Profit before taxes                                                          4,354           (4.3)      1,083      15.7        924       (7.9)
Tax on profit                                                               (1,198)           (0.1)      (145)       2.2      (126)     (18.9)
Profit from continuing operations                                            3,156           (5.9)        938      18.1        798       (5.9)
Net profit from discontinued operations                                          —              —           —         —           —         —
Consolidated profit                                                          3,156           (5.9)        938      18.1        798       (5.9)
Minority interests                                                              546            1.3           2    (98.7)        187        5.9
Attributable profit to the Group                                             2,610           (7.2)        936      40.9        611       (9.0)

Balance sheet
Customer loans (2)                                                          78,408             10.4     18,185      20.0     25,709        (0.1)
Trading portfolio (w/o loans)                                               12,994             12.7     12,171      (6.4)     3,019      (14.5)
Available-for-sale financial assets                                         18,422           (13.3)      3,410      (8.2)     2,572        (9.0)
Due from credit institutions (2)                                             8,490           (21.8)      4,463      (0.3)     2,049      (12.8)
Intangible assets and property and equipment                                 3,228           (15.3)        369      (7.8)       350        (6.5)
Other assets                                                                36,612           (12.4)      4,253      (3.2)     5,208       30.6
Total assets/liabilities & shareholders' equity                           158,157             (1.3)    42,852        4.1    38,906          0.3
Customer deposits (2)                                                       72,405             (4.3)    21,459        1.5    20,175        11.4
Marketable debt securities (2)                                              16,154             76.3      1,324    264.4       5,601          0.2
Subordinated debt (2)                                                        4,515              3.3         —          —      1,285        16.9
Insurance liabilities                                                           —          (100.0)          —    (100.0)         —     (100.0)
Due to credit institutions (2)                                              28,847             19.0      7,591        1.1     4,851      (12.9)
Other liabilities                                                           25,795             (2.2)     8,715      11.2      5,112      (13.6)
Shareholders' equity (3)                                                    10,440           (10.1)      3,763      (5.7)     1,882      (13.9)
Other customer funds under management                                      42,785           (12.2)       9,432     (6.8)      4,846     (17.5)
  Mutual funds                                                              39,414           (10.3)      9,432      (5.7)     4,846      (16.5)
  Pension funds                                                                 —                —          —          —         —            —
  Managed portfolios                                                         3,371           (19.8)         —          —         —            —
  Savings-insurance policies                                                    —          (100.0)          —    (100.0)         —     (100.0)
Customer funds under management                                           135,859             (1.5)    32,214        1.9    31,908          4.0

(1).- Including dividends, income from equity-accounted method and other operating income/expenses
(2).- Including all on-balance sheet amounts for this item
(3).- Not including profit of the year


       ANNUAL REPORT 2011                                                                                                                   121
Employment rates continued their positive trend, where the
Brazil                                                                           jobless rate reached a record low of 4.7%. In twelve months, 1.9
                                                                                 million new jobs were created and real income increased 7%.
      Greater activity and management of spreads fuelled
      basic revenues growth (+13.7%).                                            Inflation ended the year at 6.5%, the upper ceiling established
                                                                                 by the central bank.
      Higher operating expenses (+12.3%) reflected the
      commercial investment (opening 154 branches) and                           In this context, the central bank, given the international
      the collective agreement.                                                  scenario, started to ease the interest rates (Selic) ending the year
                                                                                 at 11%, after reaching 12.5% in the first half of the year.
      Higher provisions (+21.4%) due to increased business
      and moderate rise in the sector’s NPLs.                                    With the latest available data, the banking system’s total lending
                                                                                 grew 18% and savings 16%.
      Net operating income after provisions increased
      2.9%.                                                                      Strategy
                                                                                 Santander Brazil is the third largest private sector bank in terms
      Lending and savings grew 20% and 16%,                                      of assets, and the leading foreign bank, with a market share of
      respectively.                                                              10.5% in loans. It operates in the main regions, with 3,775
                                                                                 branches and points of banking attention, 18,419 ATMs and
      The main three rating agencies upgraded Santander                          25.3 million customers, of which 19.3 million hold current
      Brazil's ratings giving it the highest rating of any                       accounts.
      Brazilian institution (long-term debt in foreign
      currency).                                                                 The bank's strategy is based on the following goals:
                                                                                 • be the best in quality of service, backed by the strength of the
                                                                                   IT platform;
                                                                                 • intensify relations with customers improving service quality
Santander Brazil generated attributable profit of EUR 2,610                        and infrastructure (it aims to open around 100 - 120 branches
million, 7.2% lower than in 2010 (-7.3% in local currency).                        each year, in 2011-2013);
The top part of the income statement is very solid. Gross income                 • business strengthening in key segments such as SMEs,
rose 11.2% in local currency, spurred by net interest income and                   acquiring business, cards, real estate loans and consumer
fee income, which coupled with a slight improvement in the                         credit; and boost cross-selling;
efficiency ratio, produced a 10.5% increase in net operating
income. This increase enabled the larger provisions to be                        • better recognition of the Santander brand;
absorbed, maintaining net operating income after provisions in
positive growth rates (+2.9%). This, however, did feed through                   • all of this accompanied by prudent risk management.
to profits mainly because of labour disputes, higher tax rate and
minority interests.                                                              Technology integration was completed in the first half of 2011,
                                                                                 adding to unification of the brand carried out in 2010. Functions
Economic environment                                                             were improved in the new unified platform, which is more agile
The latest figures continue to show a favourable picture, with                   and has a wider range of products and services, enabling the
GDP growing at 3% in 2011, fuelled by domestic demand and                        bank to develop activity more productively.
an outlook of sustained growth in the coming years of around
3-4%.                                                                            In products and collectives, an alliance was reached with
                                                                                 Telefónica and with the owners of the Esso, Shell and Mobil
According to IMF estimates, Brazil is the world’s sixth largest                  brands in Brazil to launch the new Santander Esso and
economy.                                                                         Santander Shell cards. Another key segment in the Group’s
                                                                                 strategy is real estate credit, where specific products were
                                                                                 developed for high income customers, such as personalised
                                                                                 advice, discounts in home insurance and special conditions for
                                                                                 investments in time deposits and pension funds.


Loans                                Savings*                                    Net interest income /                      Net operating income
% y-o-y variation w/o forex impact   % y-o-y variation w/o forex impact          provisions % o/ ATAs                       Million euros

                                     (*) Including “letras financeiras”
                                                                                                                           + 10.6%*         2011-2010
                                                                                   7.53                                    (*) Excluding exchange rate impact: +10.5%
                                                                                                     7.47
                                                                                                            Net interest
                         +20.3


                                                                                                             income
                                                                                                                                                            9,963
                                                                          +8.2


                                                                                                                                             9,007
              +16.3


                                                                                   4.86              4.68
                                                       +6.5


                                                                                                            Provisions

                                                                                   2.67              2.79

       2010           2011                      2010             2011             2010               2011                             2010            2011


122                                                                                                                                     ANNUAL REPORT 2011
In the acquiring business, Santander Brazil maintained its good                             The good trend in fee income, (+8.3%) backed by cards and
results and attained a base five times higher than in 2010. It was                          insurance, which increased by more than 30%. The recurrence
the first bank to unite acquiring services with banking services,                           ratio was 61.1%.
which is very attractive for SMEs.
                                                                                            Gains on financial transactions were EUR 757 million, 22.5%
As part of its strategy to become the best and most efficient                               lower due to the lesser contribution from activities linked to the
universal bank in the country, Santander Brazil launched the                                markets. They only accounted for 5% of total revenues reducing
Piloto del Modelo de Atención in order to increase customer                                 their share.
satisfaction.
                                                                                            In short, gross income continued to grow, as the net interest
Also, in order to improve quality and provide a better capacity of                          income has increased in all quarters during the last four years
response, improvements were made to the telephone attention                                 and fee income has done so in four of the last seven quarters.
centres for individuals and companies.                                                      Total basic revenues grew 13.7% in 2011 against 5.9% in 2010.
Lastly, and in order to be more agile in risks, the system has a                            Operating expenses grew 12.3%, due to:
new tool which will enable operations to be approved more
quickly, minimise errors and enhance analysis of results.                                   • the investment made to increase the distribution capacity
                                                                                              (opening of 154 traditional branches in 12 months)
Activity
Lending kept up the growing trend started in 2010. It rose 20%,                             • the new IT platform and
with growth across all segments.
                                                                                            • collective agreements
• Loans to individuals (+23%), particularly mortgages (+40%)
                                                                                            Net operating income rose 10.5% to EUR 9,963 million and the
  and cards (+31%)
                                                                                            efficiency ratio was 37%, similar to that of 2010.
• SMEs and companies (+26% combined).
                                                                                            Provisions for loan losses were 21.4% higher than in 2010, due
• Large companies (+12%).                                                                   to the increase of close to 20% in lending balances and a
                                                                                            moderate rise in the NPLs of individual borrowers, mainly in
Deposits excluding repos rose 6%, with a good performance in                                consumer credit and cards. The NPL ratio was 5.38% (4.91% in
time deposits: +30%, coupled with strong capturing in letras                                December 2010) and coverage 95%.
financeiras, an instrument that provides greater stability and
which started to be marketed in 2010. Including them,                                       Net operating income after provisions increased 2.9%, driven by
customer deposits rose 16%.                                                                 the strength of the most basic revenues, which absorbed the
                                                                                            investments in installed capacity and provisions.
The market share in lending was 10.5% (11.7% in unrestricted
lending) and 7.9% in deposits.                                                              Including the higher provisions for labour disputes, the higher
                                                                                            tax rate and larger minority interests from the partial placement
Results                                                                                     of shares in 2010, attributable profit was 7.3% lower at EUR
In results (always in local currency), gross income kept up the                             2,610 million.
growing trend started in 2010. It amounted to EUR 15,940
million, 11.2% higher.                                                                      Retail Banking and Asset Management and Insurance's
                                                                                            attributable profit was 12.2% and 8.1% lower respectively,
The main component of growth was net interest income                                        while that of GBM rose 4.2%.
(+15.2%), spurred by the larger volumes and management of
spreads.


Net operating income                         Attributable profit                        NPL ratio                         NPL coverage
after LLPs Million euros                     Million euros                              %                                 %

+ 3.0%*        2011-2010                    -7.2%*       2011-2010
(*) Excluding exchange rate impact: +2.9%   (*) Excluding exchange rate impact: -7.3%
                                                                                                               5.38
                                5,456
                 5,299


                                                                                                                                       101
                                                                                                     4.91


                                                                                                                                                95
                                                              2,814


                                                                             2,610


          2010            2011                         2010            2011                   2010          2011                2010         2011


        ANNUAL REPORT 2011                                                                                                                            123
The 11.2% depreciation of the Mexican peso against the dollar
  Mexico                                                                     was one of the main effects of turbulence in the international
                                                                             markets. In order to limit exchange-rate volatility and inject
          Stronger franchise reflected in business and profits               dollar liquidity into the Mexican market, the Bank of Mexico
          performance.                                                       decided at the end of November to auction daily $400 million
                                                                             provided the exchange rate varied in the day by more than 2%
          Basic revenues continued to accelerate (+8.6%)                     against the dollar. At the same time, it suspended the monthly
          fuelled by increased activity and spreads                          auctions of dollars. This measure produced very good results in
          management.                                                        the 2008-2009 crisis and, judging by the high level of
                                                                             international reserves of more than $140,000 million, it will do
          Costs rose 11.6% because of increased commercial                   so again.
          capacity and perimeter.
                                                                             Business picked up. Lending increased 16% (consumer credit
          Lower NPLs produced a 25.7% fall in loan-loss                      and cards: +23%) and savings 11%.
          provisions.
                                                                             Strategy
          Net operating income after provisions increased                    The Mexican financial system remains solid and liquid and has
          12.4% and profit before minority interests 22.0%.                  good risk quality indicators. The international environment has
                                                                             not hit banking activity and growth in both lending and
          Strong rise in business: lending rose 22% on a like-               savings remains strong.
          for-like basis and deposits 10%.
                                                                             In this context, Santander is the third largest banking group by
                                                                             business volume, with market shares of 16.0% in lending and
                                                                             14.7% in savings. The Group has 1,125 branches and 9.3
                                                                             million customers.
Attributable profit was 40.9% higher at EUR 936 million
(+45.6% in local currency), partly benefiting from lower                     In 2011, Santander Mexico continued to consolidate its
minority interests.                                                          franchise by increasing its customer base and linkage and
                                                                             improving the quality of its services. Integral risk management
Results showed a good trend, with growth in net interest                     and efficiency in costs continue to complement a strategy
income and fee income and lower provisions.                                  aimed at creating value for customers and shareholders.
Economic environment                                                         The bank offered its customers innovative products and of
GDP growth slowed in 2011 (to 3.8% from 5.4% in 2010,                        high value added, tailored to each segment.
according to the latest estimates), with more moderate
domestic demand, due to an easing of both private and public                 The strategy in mortgages is aimed at medium and residential
consumption, while investment grew strongly and recovered                    housing segments (market share of close to 19%, 7 p.p. more
the pre-crisis levels. The contribution of net external demand               than in 2010). This sharp rise was due to organic growth, with
was similar to that of 2010, but with a significant moderation               the launch of products such as Hipoteca Light and the
in exports and imports.                                                      acquisition of GE Capital Corporation's mortgage portfolio in
                                                                             Mexico.
Job creation continued but at a slower pace (610,000 in
2011).                                                                       The strategy in credit cards focused on placing new accounts
                                                                             mainly with current customers, paying particular attention to the
Inflation was around 3.5% in 2011, closing the year at 3.8%.                 quality of the portfolio. In consumer credit, the use of alternative
Medium- and long-term expectations continued at these rates                  channels is key for increasing balances (more than 30%), which
(3.5%), despite the peso’s depreciation. In this context, the                was achieved with an improvement in the index of the past-due
Bank of Mexico held its key rate at 4.5%.                                    portfolio. Other campaigns for customers were Vive la magia,
                                                                             Ganas o ganas and Auto compara in car insurance.


 Loans*                                 Savings                              Net interest income /                      Net operating income
 % y-o-y variation w/o forex impact     % y-o-y variation w/o forex impact   provisions % sobre ATAs                    Million euros

                                                                                                                       -3.3%*       2011-2010
(*) Without perimeter: +22.4%
                                                                               3.98                                    (*) Excluding exchange rate impact: -0.1%
                                                                                                 3.81
                                +30.9


                                                                                                        Net interest
                                                                                                         income
                                                                                                                                         1,434


                                                                               2.82
                                                                                                                                                         1,387


                                                                                                 3.04
                                                      +13.9
                +15.4


                                                                               1.16
                                                                 +7.6


                                                                                                        Provisions
                                                                                                 0.77


         2010           2011                   2010           2011            2010               2011                             2010            2011


124                                                                                                                                 ANNUAL REPORT 2011
In SMEs, one of the strategic segments, programmes were                                   Results
strengthened with NAFIN (Nacional Financiera) to support                                  Gross income increased 4.5%. Net interest income grew 7.5%
entrepreneurs, constructors and travel agencies. The market                               due to greater activity and active management of spreads
share rose by more than two points in 2011 to more than                                   (record fourth quarter). Fee income rose 9.8%, with a positive
21%. In corporate finance and companies, strategies were                                  performance in insurance and transactional banking and a
implemented to increase the number of customers and                                       decline from cards and mutual funds.
products were designed for agricultural business, confirming
and foreign trade, which help to boost volumes. The magazine                              Gains on financial transactions dropped 42.5%, as a result of
Trade Finance awarded the bank its “Deal of the year” prize for                           the market's instability and volatility of interest rates.
financing Volkswagen.
                                                                                          Operating expenses were 11.6% higher, reflecting the larger
Other recognitions came from the magazine América Economía                                perimeter and greater installed capacity. Provisions confirmed
as the best bank in Mexico in its ranking of 25 banks in Latin                            the trend of previous quarters, falling 25.7%, in line with the
America, and from Global Finance, which recognised Santander                              improvement in risk premiums.
as the safest bank in Mexico in its Latin American ranking.
                                                                                          Net operating income after provisions increased 12.4%.
Activity
                                                                                          Attributable profit jumped 40.9% to EUR 936 million, mainly
As a result of this activity, the Group ‘s growth in lending
                                                                                          due to lower minority interests (+45.6% in local currency).
accelerated (+31%), with all products performing well and
spurred by the acquisition of GE Capital Corporation's                                    Retail banking’s profit was up 69.7% due to lower provisions
mortgage portfolio.                                                                       and revenues recovery. Asset Management and Insurance’s
                                                                                          rose 46.9% and Global Wholesale Banking’s dropped 22.8%,
Lending rose 22% on a like-for-like basis (excluding GE).
                                                                                          due to reduced results from markets and the worsening global
Mortgages increased 81% (+30% on a like-for-like basis),
                                                                                          economic environment.
commercial credit 22% and consumer loans 33%, while loans
via cards increased 14%.                                                                  The efficiency ratio was 41.8%, the recurrence ratio 68.0% and
                                                                                          ROE 21.2%. The NPL ratio (1.82%) and coverage (176%) were
Savings increased 8%, with demand deposits up 14%, time
                                                                                          still of high quality and evolved favourably during the year.
6% and mutual funds 3%.


Net operating income                          Attributable profit                         NPL ratio                         NPL coverage
after LLPs Million euros                      Million euros                               %                                 %

+ 8.8%*        2011-2010                     + 40.9%*         2011-2010
(*) Excluding exchange rate impact: +12.4%


                                                                                                                                         215
                                             (*) Excluding exchange rate impact: +45.6%
                                1,050


                                                                                                                                                  176
                                                                              936
                 965


                                                                                                        1.84


                                                                                                                  1.82
                                                               664


          2010            2011                          2010           2011                      2010          2011               2010         2011


        ANNUAL REPORT 2011                                                                                                                              125
Strategy
Chile                                                                     Santander Chile's strategy in 2011 was focused on
                                                                          strengthening its retail banking and improving customer
      Basic revenues rose 2.7%. Net interest income                       management by combining commercial assertiveness with
      accelerated in the fourth quarter (+13.8% over the                  prudence in risks.
      same period of 2010).
                                                                          Moreover, the strategy was aimed at obtaining the highest
      Operating expenses rose 10.1% because of the                        return from the various businesses, particularly via loans and
      signing of the collective agreement and greater                     savings with individual customers and SMEs, with special focus
      business.                                                           on deposits to boost the liquidity position.
                                                                          2011 was the “Year of Service” for Santander Chile through a
      Loan-loss provisions were 17.3% higher.                             customer plan focused on retention, improving service and
                                                                          working on key factors that impact on customer relations. The
      Net operating income after provisions dropped 9.4%.                 central idea was to foster changes in attitude toward the
                                                                          customer and the quality of attention, using parameters of
      Focus on strengthening liquidity: deposits increased                quality and transparency.
      19% and loans 7%.
                                                                          Grupo Santander sold 7.82% of Banco Santander Chile for
                                                                          $950 million, leaving it with 67%.
                                                                          The UK magazine The Banker chose Banco Santander as “Bank
                                                                          of the Year” in Chile and the fourth safest bank in emerging
Attributable profit was EUR 611 million, 9.0% less than in 2010           markets (the safest in Latin America), according to the magazine
(-9.3% in local currency).                                                Global Finance.
Santander is the largest financial group in Chile in terms of             Activity
assets and profits. It has 499 branches and more than 3.5                 Lending accelerated thanks to the higher economic growth
million customers and market shares of 19.7% in loans and                 and the positive impact of reconstruction following the 2010
17.3% in savings.                                                         earthquake. Loans rose 7%, with cards up 15%, mortgages
Economic environment                                                      10% and consumer credit 8%. Commercial credit grew 4%.
The pace of growth during 2011 returned to a more “normal”                Savings grew 11%. Time deposits increased 29% and mutual
rate as the impact of the post-earthquake recovery wore off.              funds declined 10%.
Domestic demand, however, continued to grow a brisk pace
(close to 10% for the whole year). External demand’s                      Results
contribution to GDP growth was negative, due to imports rising            In results (and always in local currency), gross income rose a
faster than exports.                                                      modest 1.9%, although the quarterly trend has been good. Net
                                                                          interest income increased 2.6%, affected by higher interest rates
Inflation gradually rose to 4.4%, higher than initial expectations.       and pressure on lending spreads.
In this context, the central bank raised its key rate by 200 b.p. to
5.25% during the first half of the year and then introduced a
downward bias in its monetary policy as a result of the
worsening of the international context. It cut its key rate to
5.0% in January 2012. The peso depreciated 9.8% against the
dollar, but the central bank continued to buy dollars in order to
fulfil its goal of increasing the stock of reserves.
Lending rose 17% (+18% in consumer credit and cards and
+19% in commercial credit). Savings rose 14%.


Loans                                Savings                              Net interest income /                     Net operating income
% y-o-y variation w/o forex impact   % y-o-y variation w/o forex impact   provisions % sobre ATAs                   Million euros

                                                                                                                   -2.5%*       2011-2010
                                                                            4.35                                   (*) Excluding exchange rate impact: -2.7%
                                                                                             3.99
              +13.6


                                                                                                    Net interest
                                                             +11.4


                                                                                                     income
                                                                                                                                     1,296


                                                                                                                                                     1,264


                                                                            3.41
                         +7.3


                                                                                             3.01


                                                                                                    Provisions
                                                   +2.0


                                                                            0.94             0.98

       2010           2011                  2010          2011             2010              2011                             2010            2011


126                                                                                                                             ANNUAL REPORT 2011
Fee income, on the other hand, rose 2.4%, with a good                                       Argentina
performance in that from cash management (+12.0%) and cards
(+7.7%), while that from administration of accounts and mutual                          Activity                              Attributable profit
funds dropped 20.7% and 5.2% respectively. Fee income from                              % y-o-y variation w/o forex impact    Million euros
insurance remained virtually flat (-0.5%).                                                                                   -2.7%*       2011-2010
                                                                                                                             (*) Excluding exchange rate impact: +8.0%
Gains on financial transactions were 14.5% lower.


                                                                                                    +28.3


                                                                                                                 +27.4


                                                                                                                                             295
Operating expenses rose 10.1%, higher than inflation, due to


                                                                                                                                                            287
the collective agreement, the increase in the rent for branches
following their transfer in the second half of 2010 and
strengthening business activity.
Net loan-loss provisions rose 17.3% and attributable profit was
                                                                                                                                      2010            2011
9.0% lower at EUR 611 million (-9.3% in local currency).                                      Loans         Savings

Retail Banking’s profit dropped 14.8%, Asset Management and
Insurance’s was 3.3% lower and Global Wholesale Banking’s                               Attributable profit was EUR 287 million, 2.7% lower (8.0%
increased 16.1%.                                                                        higher in local currency).
The efficiency ratio was 39.2%, the recurrence ratio 58.2% and                          Santander Río is one of the country’s leading banks, with
ROE 25.4%. The NPL ratio was 3.85% and coverage 73%.                                    market shares of 8.9% in lending and 10.1% in savings. It has
                                                                                        358 branches and 2.5 million customers.
                                                                                        Santander Río was chosen as the best bank in Argentina in
Net operating income                         Attributable profit                        2011 by The Banker, Euromoney and Global Finance.
after LLPs Million euros                     Million euros
                                                                                        Economic environment
-9.2%*       2011-2010                      -9.0%*       2011-2010                      The economy grew briskly, although with some slowing down
(*) Excluding exchange rate impact: -9.4%   (*) Excluding exchange rate impact: -9.3%   (estimated 7% for the year). Domestic demand eased and the
                                                                                        net contribution of external demand to GDP growth was more
                                                                                        negative.
                 973


                                 884


                                                              671


                                                                                        Export growth in real terms dropped sharply from 14% in 2010
                                                                             611


                                                                                        to 4%, while imports continued to grow at double-digit rates.
                                                                                        Inflation was 9.5% in December, while interest rates rose
                                                                                        significantly in the last months of 2011. The Badlar rate for
                                                                                        private sector banks rose above 21% before ending the year at
          2010            2011                         2010            2011
                                                                                        around 19% (+750 b.p. over 2010).
                                                                                        The peso depreciated 7.7% against the dollar and international
                                                                                        reserves dropped by $5,600 to $46,000 million (10.6% of
 NPL ratio                                   NPL coverage                               GDP).
 %                                           %
                                                                                        Growth in the financial system’s savings and lending was 28%
                                                                                        and 50%, respectively, maintaining high levels of liquidity and
                                                                                        a capitalisation ratio of close to 16%. The NPL ratio was 1.4%
                                                                                        and coverage 172%.
                                 3.85


                                                             89
                  3.74


                                                                             73


                                                                                        Strategy
                                                                                        The Group focused its strategy in 2011 on maximising the
                                                                                        strengths of the franchise, sustained by a successful
                                                                                        transactional banking model resting on low funding costs
                                                                                        (demand deposits accounted for 68% of total deposits) and
                                                                                        high levels of revenues from services (recurrence ratio of 88%).
           2010            2011                       2010            2011
                                                                                        The bank increased its retail network by 10%, mainly in the
                                                                                        interior of the country and within what it calls its “strategic
                                                                                        corridor” (high income regions, with strong growth prospects
                                                                                        and trade links with Brazil).
                                                                                        The strategy rested on balance sheet strength (liquid and well
                                                                                        capitalised) and focused on business and management of
                                                                                        NPLs, coupled with a differentiated customer attention model,
                                                                                        a multichannel distribution network and an offer of products
                                                                                        tailored to needs.


        ANNUAL REPORT 2011                                                                                                                                               127
Santander Río launched in 2011 the Super Préstamo Inversión        Uruguay
pyme which offers long-term financing to SMEs.
Emphasis was also placed on customer satisfaction, with        Activity                              Attributable profit
improvements in quality and service levels.                    % y-o-y variation w/o forex impact    Million euros

Activity and Results                                                                                -70.3%*        2011-2010
                                                                                                    (*) Excluding exchange rate impact: -69.9%
During the year lending continued to grow strongly (+28%)


                                                                           +39.2
and also savings (+27%). Demand deposits rose 20%, time


                                                                                                                    67
42% and mutual funds 35%.
Gross income rose 24.7%, fuelled by basic revenues (+26.1%).


                                                                                                                                    20
                                                                                        +8.1
Operating expenses rose 34.8%, due to inflation and growth
in installed capacity (net opening of 34 branches between
2010 and 2011, from 324 to 358). In addition, the number of          Loans         Savings                   2010            2011

contact-centre positions increased and the number of
employees from 6,466 to 6,777.
Net operating income increased 16.3%. Provisions were          Attributable profit was EUR 20 million, 70.3% lower (-69.9% in
121.6% higher, mainly due to the increase in generic           local currency), due to the 50.8% fall in gains on financial
provisions. This produced an 8.2% increase in net operating    transactions (capital gains in 2010 in the portfolio of securities),
income after provisions and attributable profit rose 8.0%.     costs (+42.5%) resulting from the new collective agreement and
                                                               the new IT platform.
The efficiency ratio was 49.0%, the recurrence ratio 88.4%
and ROE 52.1%. The NPL ratio was 1.15% and coverage            Good performance of basic revenues which rose 27.9% in the
207%.                                                          year.
                                                               Santander is the largest private sector bank in the country in
                                                               terms of the number of branches (78) and business (market share
                                                               of 18.6% in lending and 16.0% in deposits). It has 247,000
                                                               customers.
                                                               The economy grew 6.4%, according to the most recent
                                                               estimates, down from 8.5% in 2010. Domestic demand growth
                                                               remained very high at close to 9%, with strong private
                                                               consumption and investment. However, due to the sharp
                                                               slowdown in exports in real terms, the contribution of net
                                                               external demand was more negative (reducing GDP growth by
                                                               three points).
                                                               As a result of inflation rising continuously, the central bank raised
                                                               its key rate by 225 b.p. to 8.75%. The exchange rate remained
                                                               stable against the dollar (19.95 pesos/$). International reserves
                                                               ended the year at $10,300 million (over 20% of GDP) and
                                                               $2,600 million more than in 2010.
                                                               In local currency, the financial system's lending rose at a slower
                                                               pace (+22%) and deposits grew 13%.
                                                               The Group focused on retail business, creating a more massive
                                                               model with new products and channels. Since 2010, it has
                                                               conducted insurance business, making Santander the only bank
                                                               in the country to be involved in this market. Under the
                                                               framework of this strategy of increasing the number of
                                                               customers to be offered this type of product, a finance company,
                                                               Creditel, was acquired which has a strong position in medium
                                                               and low sectors, enabling it to not only expand business but also
                                                               incorporate the know how to get closer to customers.
                                                               Lending rose 39% with the incorporation of Creditel and 30% on
                                                               a like-for-like basis. Savings rose 8%. The efficiency ratio is
                                                               76.5%, the recurrence ratio 29.8%, the NPL ratio is only 0.64%
                                                               and coverage remains very high.


128                                                                                                              ANNUAL REPORT 2011
Colombia                                                                          Puerto Rico

Activity                              Attributable profit                         Activity                              Attributable profit
% y-o-y variation w/o forex impact    Million euros                               % y-o-y variation w/o forex impact    Million euros
                                     + 43.0%*         2011-2010                                                        -10.1%*        2011-2010
                                     (*) Excluding exchange rate impact: +46.5%                                        (*) Excluding exchange rate impact: -5.6%


                         +21.4


                                                                                                           +17.2
                                                                    58


                                                                                                                                       38


                                                                                                                                                       34
                                                     41
            +11.9


                                                                                              +3.3
      Loans         Savings                   2010            2011                      Loans         Savings                   2010            2011


Attributable profit was 43.0% higher at EUR 58 million (+46.5%                    Attributable profit was EUR 34 million, 10.1% lower (-5.6% in
in local currency), due to gross income (+13.7%), controlled                      dollars), because of higher taxes, as net operating income after
costs (+6.3%, a little above inflation) and provisions for loan                   provisions increased 42.4% thanks to lower provisions.
losses (-5.0%).
                                                                                  Santander has 121 branches, 508,000 customers and market
The Group has 80 branches, 297,000 customers and a market                         shares of 10.2% in loans, 11.8% in deposits and 21.6% in
share of 2.7% in banking business.                                                mutual funds.
The economy showed no signs of slowing down, and grew by                          In a context of recession, the bank remained one of the three
more than 5%, Domestic demand was buoyant, while the                              main banks by volume of loans, deposits and mutual funds, and
contribution of net external demand to GDP growth, was                            it continued to strengthen recovery management of loans in an
negative.                                                                         irregular situation and grow selectively in business with
                                                                                  individuals and companies.
Inflation rose to 3.7% from 3.2% at the end of 2010, leading the
central bank to raise its key rate, despite the deterioration of the              For the fifth year running the magazine Global Finance
external scenario in the second half, to 4.75% (+175 b.p. during                  recognised Santander Puerto Rico as the best bank in Puerto
the year).                                                                        Rico and The Banker for the sixth year.
The peso depreciated 8% against the dollar in the second half,                    The bank improved the diversification of its revenues toward
but compared to the end of 2010 the weakening was very                            other stable and recurrent sources. A great effort was made to
moderate (only 1.0%). International reserves increased by $3,800                  maximise linkage of customers right from the start of their
million to $32,300 million.                                                       relation with the bank, while using the channels available for
                                                                                  reducing the costs of acquisition boosted commercial
In 2011, the strategy focused on selective growth in business,                    productivity.
preserving appropriate levels of customer linkage of high and
medium income customers and boosting transaction and                              The efficiency ratio was 50.9%, the recurrence ratio 39.2%, the
insurance business. Management of NPLs is based on anticipation                   NPL ratio 8.64% and coverage 51%.
and knowledge of the customer.
Lending increased 12% and savings 21%. The efficiency ratio is
56.2% and the recurrence ratio 49.0%. The NPL ratio is 1.01%                          Perú
and coverage 299%.
As already mentioned, the Group announced agreement to sell its
                                                                                  Activity                              Attributable profit
                                                                                  % y-o-y variation w/o forex impact    Million euros
business in Colombia to the Chilean group CorpBanca. The
operation is expected to be completed in the first quarter of                                                          + 56.4%*         2011-2010
                                                                                                                       (*) Excluding exchange rate impact: +60.3%
2012, once the regulatory authorisations have been obtained.
                                                                                                           +34.5


                                                                                                                                                       11
                                                                                                                                       7
                                                                                              +19.0


                                                                                                      Savings                   2010            2011
                                                                                        Loans


                                                                                  Activity is focused on companies and to the Group’s global
                                                                                  customers. Attributable profit was EUR 11 million (EUR 7
                                                                                  million in 2010), due to the good evolution of net interest
                                                                                  income (+56.0%).


     ANNUAL REPORT 2011                                                                                                                                             129
Sovereign
Million euros

                                                                                                                                               Variation
                                                                                                      2011                      2010            amount                          %
Income statement
Net interest income                                                                                   1,678                 1,736                    (57)                    (3.3)
Net fees                                                                                                374                   408                     (33)                    (8.2)
Gains (losses) on financial transactions                                                                190                     29                    161                   560.8
Other operating income (1)                                                                               (55)                  (66)                    11                   (17.3)
Gross income                                                                                          2,188                 2,106                      82                      3.9
Operating expenses                                                                                     (976)                 (937)                    (39)                     4.2
  General administrative expenses                                                                      (863)                 (832)                    (31)                     3.7
     Personnel                                                                                         (469)                 (468)                      (1)                     0.3
      Other general administrative expenses                                                            (394)                 (364)                    (30)                      8.1
  Depreciation and amortisation                                                                        (113)                 (105)                      (8)                     8.0
Net operating income                                                                                  1,212                 1,169                      43                      3.7
Net loan-loss provisions                                                                               (374)                 (510)                    136                   (26.6)
Other income                                                                                             (61)                  (92)                     30                  (33.1)
Profit before taxes                                                                                     776                   567                    209                     36.9
Tax on profit                                                                                          (250)                 (143)                  (107)                     75.0
Profit from continuing operations                                                                       526                   424                    102                     24.0
Net profit from discontinued operations                                                                    —                     —                      —                        —
Consolidated profit                                                                                     526                   424                    102                     24.0
Minority interests                                                                                         —                     —                      —                        —
Attributable profit to the Group                                                                        526                   424                    102                     24.0

Balance sheet
Customer loans (2)                                                                                    40,194               36,724                 3,470                         9.4
Trading portfolio (w/o loans)                                                                            271                  211                     60                      28.5
Available-for-sale financial assets                                                                   12,435               10,203                 2,232                       21.9
Due from credit institutions (2)                                                                         677                  722                    (45)                      (6.3)
Intangible assets and property and equipment                                                             480                  507                    (27)                      (5.3)
Other assets                                                                                           3,643                3,430                    213                        6.2
Total assets/liabilities & shareholders' equity                                                      57,700               51,797                  5,903                       11.4
Customer deposits (2)                                                                                 36,884               32,007                 4,877                       15.2
Marketable debt securities (2)                                                                         1,653                1,945                  (292)                     (15.0)
Subordinated debt (2)                                                                                  2,275                2,781                  (506)                     (18.2)
Insurance liabilities                                                                                     —                    —                       —                          —
Due to credit institutions (2)                                                                         9,934                9,567                    368                         3.8
Other liabilities                                                                                      2,412                2,297                    115                         5.0
Shareholders' equity (3)                                                                               4,542                3,200                 1,341                       41.9
Other customer funds under management                                                                      1                   30                   (29)                    (98.0)
  Mutual funds                                                                                            —                    —                       —                          —
  Pension funds                                                                                           —                    —                       —                          —
  Managed portfolios                                                                                       1                   30                    (29)                    (98.0)
  Savings-insurance policies                                                                              —                    —                       —                          —
Customer funds under management                                                                      40,812               36,763                  4,049                       11.0

(1).- Including dividends, income from equity-accounted method and other operating income/expenses
(2).- Including all on-balance sheet sheet balance sheets for this item
(3).- Not including profit of the year


Loans                                       Deposits                                   Net interest income /                        Net operating income
% y-o-y variation w/o forex impact          % y-o-y variation w/o forex impact         provisions % o/ ATAs                         Million euros
                                                                                                                                   + 3.7%*        2011-2010
                                                                                          3.30              3.21
                                                                       +11.6


                                                                                                                   Net interest    (*) Excluding exchange rate impact: +9.0%
                                                                                                                    income
                          +6.0


                                                                                                                                                                    1,212


                                                                                           2.33
                                                                                                                                                     1,169


                                                                                                            2.50


                                                                                          0.97
                                                           -3.9


                                                                                                                   Provisions
               -1.6


                                                                                                            0.71

        2010          2011                          2010          2011                   2010               2011                              2010            2011


130                                                                                                                                             ANNUAL REPORT 2011
Strategy
Sovereign                                                                                 Sovereign, with 723 branches, 2,303 ATMs and more than 1.7
                                                                                          million customers, is developing a business model focused on
        Higher gross income (+9.2%) and lower provisions                                  retail customers and companies. It operates in the northeast of
        (-22.9%).                                                                         the US, one of the country’s most prosperous areas, where it
                                                                                          has significant market shares.
        Net operating income after provisions up 33.6%.
                                                                                          The transformation phase in 2010, which put the franchise on
        Improved trend in loans over previous years (+6%)                                 the path to profits, continued in 2011 with a phase of
        and deposits (+12%).                                                              stabilisation and laying the foundations for the creation of a
                                                                                          stronger retail and commercial bank in the northeast of the US.
        Non-performing loans and coverage improved for
        the eighth quarter running.                                                       In a year marked by low demand for loans, Sovereign focused
                                                                                          on profitability.
        Sovereign was granted the licence to become a
                                                                                          In funds, the number of current accounts continued to grow,
        federal bank, which will enable a wider range of
                                                                                          breaking the negative trend of previous years. This resulted in an
        products to be offered to a lager number of
                                                                                          increase in the volume of customer deposits, enabling the bank
        customers.
                                                                                          to finance growth in lending as well as reduce the volume of
                                                                                          wholesale funding and improve the diversification and stability
                                                                                          of the sources of financing.
                                                                                          The commercial drive also offset the negative impact on fee
Sovereign posted an attributable profit of $732 million (EUR 526                          income of the new US regulatory framework.
million), 30.3% more than in 2010.
                                                                                          Of note in liquidity was the positive impact of growth in
Economic environment                                                                      deposits and the capacity to tap the US debt markets,
Sovereign conducted its activity in an environment of slower                              underscored by the bank’s issue during 2011.
GDP growth than in 2010, with a weak housing sector, a jobless
rate close to historic highs and interest rates at minimums.                              Costs centred on creating the pillars to guarantee future
                                                                                          growth. Particularly noteworthy were investments in human
Lending by banks increased in the second and third quarters                               capital (teams in commercial and control functions) and in IT
(+0.9% and 0.3%, respectively) for the first time since June                              platforms (Partenon will be running during the second half of
2008, although it is too early yet to speak of a change of trend.                         2012).
Growth was due to the increase in commercial loans (+1.8% in
the second quarter and +0.3% in the third) and less in consumer                           Risk admission and renewal of loans remained rigorous together
credit (flat in the second quarter and +0.3% in the third).                               with their proactive management, reflected in a continuous
Deposits continued to flow toward those of the greatest                                   improvement in NPL ratios, the lower need for provisions and
availability (+4.9% over the second quarter) from time deposits                           higher coverage.
(-2.4% vs. the second quarter).


Net operating income                          Attributable profit                         NPL ratio                          NPL coverage
after LLPs Million euros                      Million euros                               %                                  %

+ 27.1%*         2011-2010                   + 24.0%*         2011-2010
(*) Excluding exchange rate impact: +33.6%   (*) Excluding exchange rate impact: +30.3%
                                                                                                                                                  96
                                                                                                        4.61
                                838


                                                                              526


                                                                                                                                          75
                 659


                                                                                                                  2.85
                                                               424


          2010            2011                          2010           2011                      2010          2011                2010        2011


        ANNUAL REPORT 2011                                                                                                                               131
Lastly, an effort was made to adjust organisational and              The increase in lending was financed by the rise in customer
management structures in response to the increasing regulatory       deposits (+12%), which improved the diversification and stability
requirements. This process culminated with approval by the           of the funding sources. This, coupled with the reduction in the
regulators of the change in the banking licence of Sovereign,        volume of wholesale financing, reduced the cost of deposits by
which turned it into a National Bank Association in 2012.            21 b.p.
The conversion of Sovereign into a National Bank is an               The focus on expanding the customer base is beginning to bear
important milestone which, coupled with the unification and the      fruit. The number of current accounts continuously rose in
improvement process in the IT platform already begun, will           2011, breaking the negative trend of 2010. The monthly record
convert a mainly single product bank into a retail franchise with    for opening new accounts was repeatedly broken.
a full range of products, improving both the offer capacity as
well as the penetration of customers.                                Results
                                                                     Gross income was $3,042 million (+9.2%). Net interest income
The strong generation of recurring results in 2011, high levels of   (+1.6%) reflected management of volumes and prices that
efficiency, enhanced credit quality, solid capital ratios,           offset the impact of the sharp decline in interest rates. In fee
comfortable levels of liquidity and the improved capacity to offer   income (-3.5%), the negative impact of the new US regulatory
products, put Sovereign in a privileged position to bolster and      framework was offset partly by a greater business drive. Lastly,
expand the franchise and make it one of the reference banks in       another contributor was the growth in capital gains generated
the north east of the US.                                            in the ALCO portfolio.
Activity                                                             The 9.5% growth in operating costs reflects the impact of
Balance sheet management remained characterised by an                investments in technology and the increase in commercial
increase in profitability and a better mix of lending and funding    structures begun in the second half of 2010. The efficiency ratio
products, enabling spreads to improve on new and renewed             was 44.6%, virtually the same as in 2010, and net operating
operations over those of 2010.                                       income increased 9.0%.
In lending, the portfolio continued to be repositioned, with a       Net loan-loss provisions were 22.9% lower, thanks to
gradual exit from higher risk segments into more attractive ones.    containment of NPLs and the recovery capacity throughout the
Although the bank continued to deepen business in residential        credit cycle. This is reflected in a better than expected evolution
segments, the asset mix benefited from growth in loans to            in credit quality.
companies and GBM. Sovereign continued to prepare its
commercial and regulatory structure in order to take advantage       Net operating income after provisions was 33.6% higher at
of the incipient recovery in these segments.                         $1,165 million and profit before tax was $1,080 million
                                                                     (43.8%).
Total lending grew 6% and 8% excluding the non-strategic
portfolio. The improvement in the composition of the portfolio       In short, the results show a solid income statement backed by
combined with risk management produced a further fall in the         the generation of recurring revenues, a reduction in the cost of
NPL ratio to 2.85% (4.61% in 2010) and a rise in coverage to         deposits and an improvement in the levels of provisions. All of
96% (75% in 2010). Both improved for the eighth quarter              this was the result of the improvement in the balance sheet
running.                                                             structure, which, together with the recovery in volumes of basic
                                                                     loans and control of spending, provide a solid base for 2012.


  Pro forma US results                                               Grupo Santander’s total attributable profit from the US
  Million $                                                          (Sovereign Bank, Santander Consumer USA, Santander Private
                                                                     Banking USA, Puerto Rico and the New York branch)
                                                                     amounted to $1,472 million, 44.3% more than in 2010.
                                    2011         2010      Var (%)
                                                                     The main reasons for this were strong growth by Sovereign
 Gross income                       6,479        5,694        13.8   and the consumer finance unit.
 Net operating income               4,189        3,671        14.1
 Attributable profit to the Group   1,472        1,020        44.3


132                                                                                                              ANNUAL REPORT 2011
Corporate Activities
 Million euros

                                                                                        Variation
                                                                2011          2010       amount            %
Income statement
Net interest income                                           (2,172)      (1,828)         (344)         18.8
Net fees                                                           (16)         (40)           24       (60.3)
Gains (losses) on financial transactions                          605         (142)          746             —
Dividends                                                           57           64             (7)     (11.1)
Income from equity-accounted method                                   5           (2)            7           —
Other operating income/expenses (net)                             129          137              (8)       (6.1)
Gross income                                                  (1,392)      (1,810)           418       (23.1)
Operating expenses                                               (838)        (822)          (16)          2.0
  General administrative expenses                                (733)        (689)          (44)          6.4
     Personnel                                                   (285)        (268)           (16)         6.1
      Other general administrative expenses                      (448)        (420)           (28)         6.6
  Depreciation and amortisation                                  (105)        (133)            28       (20.9)
Net operating income                                          (2,230)      (2,632)           401       (15.2)
Net loan-loss provisions                                             37       (111)          149             —
Other income                                                     (429)        (428)             (2)         0.4
Profit before taxes (w/o capital gains)                       (2,623)      (3,171)           548       (17.3)
Tax on profit                                                      440          867         (427)       (49.3)
Profit from continuing operations (w/o capital gains)         (2,183)      (2,304)           121         (5.3)
Net profit from discontinued operations                              —          (13)            13    (100.0)
Consolidated profit (w/o capital gains)                       (2,183)      (2,317)           134         (5.8)
Minority interests                                                 (20)         (25)              6     (22.6)
Attributable profit to the Group (w/o capital gains)          (2,163)      (2,291)           128         (5.6)
Net extraordinary capital gains and provisions                 (1,670)            —      (1,670)             —
Attributable profit to the Group                              (3,833)      (2,291)      (1,542)          67.3

Balance sheet
Trading portfolio (w/o loans)                                   7,727        5,123         2,605         50.8
Available-for-sale financial assets                            23,297       21,288         2,009          9.4
Investments                                                       908           38           870           —
Goodwill                                                       25,089       24,622           466          1.9
Liquidity lent to the Group                                    10,440       28,265      (17,825)       (63.1)
Capital assigned to Group areas                                67,699       63,187         4,512          7.1
Other assets                                                  101,749       64,806        36,943         57.0
Total assets/liabilities & shareholders' equity              236,908      207,329        29,579         14.3
Customer deposits (1)                                          19,672       14,258         5,415         38.0
Marketable debt securities (1)                                 62,253       62,812          (559)        (0.9)
Subordinated debt (1)                                           5,477       12,128        (6,651)      (54.8)
Other liabilities                                              72,391       47,709        24,682         51.7
Group capital and reserves (2)                                 77,115       70,423         6,692          9.5
Other customer funds under management                              —            —              —           —
  Mutual funds                                                     —            —              —           —
  Pension funds                                                    —            —              —           —
  Managed portfolios                                               —            —              —           —
  Savings-insurance policies                                       —            —              —           —
Customer funds under management                               87,402       89,198        (1,796)        (2.0)

(1).- Including all on-balance sheet amounts for this item
(2).- Not including profit of the year


       ANNUAL REPORT 2011                                                                                  133
The Group considers it necessary to immunise the impact which,
Corporate Activities                                                 in situations of high volatility in the markets, sharp movements
                                                                     in exchange rates would have on these exposures of a
      This area’s results recorded extraordinary provisions          permanent nature. The investments which are currently covered
      net of tax of EUR 3,183 million, of which EUR 1,513            are those of the UK, Poland, Brazil, Mexico and Chile, and the
      were drawn from capital gains and EUR 1,670                    instruments used are spot contracts, FX forwards or tunnel
      million from the fourth quarter profit.                        options.
      Excluding this impact, the area’s results were                 The objective of the hedging is set as part of the shareholders’
      almost the same as in 2010:                                    equity of the unit equivalent to a percentage of risk-weighted
                                                                     assets, which can be changed.
      • Higher cost of funding and reduced recovery of
        taxes increased the losses.                                  Meanwhile, exposures of a temporary nature (i.e. those
                                                                     regarding the results which the Group’s units will contribute
      • This impact was offset by greater gains on                   over the next 12 months), when they are in currencies other
        financial transactions, mainly hedging of exchange           than the euro, are also covered on centralised basis. These
        rates.                                                       results, generated in the local currencies of the units, are
                                                                     hedged with exchange-rate derivatives. The objective is to
                                                                     establish the euros resulting from the exchange rate at the
                                                                     beginning of the year. These policies immunise both the
                                                                     investment in the shareholders’ equity as well as the
Corporate Activities covers, on the one hand, a series of            contribution to results of the various units.
centralised activities to manage the structural risks of the Group
and of the parent bank. It coordinates and/or executes the           The impact of the hedging is in gains/losses on financial
necessary activities for managing interest rates, exposure to        transactions, and the hedging of results compensates, in the
exchange-rate movements and measures to obtain the required          opposite way, the greater or lesser value in euros from the
levels of liquidity in the Group. On the other, it acts as the       contribution of businesses.
Group’s holding, managing global capital as well as that of each
of the units.                                                        Management of structural liquidity aims to finance the Group’s
                                                                     recurrent activity in optimum conditions of maturity and cost.
As regards interest rate management, this activity is conducted      The decisions regarding whether to go to the wholesale markets
on a coordinated basis by all the units, but this business only      to capture funds and cover stable and permanent liquidity
registers the part relative to the balance sheet of the parent       needs, the type of instrument used, the structure by maturity
bank, via the ALCO portfolios (at the volume levels and duration     dates, as well as management of the associated risks of interest
considered optimum at each moment).                                  rates and exchange rates of the various financing sources, are
                                                                     also conducted on a centralised basis.
These portfolios, which normally take the form of sovereign bonds
of European countries, aim to mitigate the impact of interest rate   The overriding objective of this activity is to maintain an
movements on the balance sheet of retail banking, structurally       appropriate liquidity profile by diversifying the sources of
sensitive by maturities to these movements and managing to           financing and controlling short-term financing (diversity in
maintain recurrent results reflected as net interest income.         maturities, currencies and markets) and medium-and long-
                                                                     term.
In order to achieve these goals, and in so far as market interest
rate movements are envisaged, the Group’s financial                  Logically, the objectives that the Group as such wants to cover
management area can decide to immunise the net interest              may or may not coincide with the financing provided to the
income of these portfolios from possible adverse movements in        units and which is based more on their individual needs. The
results by hedging interest rates.                                   mismatch in maturities, currencies or instruments is a corporate
                                                                     decision and is reflected in this unit in a centralised way.
Management of the exposure to exchange-rate movements,
both from investments in the shareholders’ equity of units in        The financial cost of the various financing sources recorded in
currencies other than the euro, as well as that regarding the        the books of the parent bank (although part of them reflects the
results generated for the Group by each of the units, also in        Group’s needs as such) are registered in Corporate Activities and
various currencies, is also conducted on a centralised basis.        can be issues of commercial paper, senior debt, covered bonds,
                                                                     subordinated debt, preference shares and securitisation of
This management (dynamic) is carried out by exchange-rate            assets.
derivative instruments, optimising at each moment the financial
cost of hedging.                                                     The Financial Management unit usually covers in new issues the
                                                                     interest rate and exchange rate risks from the start of the
In this sense, hedging of net investments in the shareholders’       operation. It uses financial derivatives for this. The net impact of
equity of businesses abroad aims to neutralise the impact on         this hedging is recorded in the gains/loss on financial
them of converting to euros the balances of the main                 transactions in Corporate Activities.
consolidated entities whose functional currency is not the euro.


134                                                                                                               ANNUAL REPORT 2011
The Financial Management area also analyses the strategies for         This higher cost also impacted on financing the goodwill of
structural management of credit risk where the aim is to reduce        the Group’s investments, which by definition have a negative
concentrations by sectors, which naturally occur as a result of        nature, and which increased the cost of their financing
commercial activity. Derivative operations here achieve an effect      proportionately.
similar to that of the sale of assets and their compensation
through the acquisition of other assets enables us to diversify        The net interest income of the ALCO portfolios registered here
the credit portfolio as a whole.                                       was higher in 2011, while maintaining a similar volume of
                                                                       portfolios than in 2010 thanks to the greater return on them.
Lastly, and separately from the financial management described
here, Corporate Activities acts as the Group’s holding. It manages   • Gains on financial transaction, which are mainly those from
all capital and reserves and allocations of capital to each of the     the centralised management of interest rate and currency
units as well as providing the liquidity that some of the business     risk of the parent bank and, to a lesser extent, from equities,
units might need (mainly the Santander Branch Network and              were EUR 605 million positive compared to losses of EUR
corporate in Spain). The price at which these operations are           142 million in 2010. The difference was mainly due to
carried out is the market rate (euribor or swap) for each of the       hedging.
maturities of repricing operations, increased by a liquidity
                                                                       In 2011, the impact of hedging the results of subsidiaries was
premium that varies on the basis of the duration of operations.
                                                                       positive (offsetting the lower value in euros of the results of
Finally, and more marginally, the equity stakes that the Group         the business units) and more than EUR 500 million above
takes within its policy of optimising investments is reflected in      2010.
Corporate Activities.
                                                                       In 2010, there were higher losses from the hedging of the
In 2011 the area made a loss of EUR 3,833 million compared to          results of subsidiaries and writedowns of financial
a loss of EUR 2,291 million in 2010.                                   investments in the portfolio of equity stakes, both of which
                                                                       were partly offset by positive returns from the hedging of
This was mainly due to the following:                                  interest rates.
Grupo Santander decided to realise extraordinary provisions net      • Operating costs were almost flat (+2%). The growth in
of taxes of EUR 3,183 million, of which EUR 1,513 million were         general costs from the increase in rents was offset by lower
drawn from capital gains and EUR 1,670 million from the fourth         amortisations.
quarter profits.
                                                                     • Net loan-loss provisions include a release of EUR 37 million
The bank charged EUR 1,812 million pre-tax provisions against          compared to an allowance of EUR 111 million in 2010 to
the fourth quarter earnings to cover real estate exposure in           strengthen the balance sheet.
Spain and EUR 601 million in pre-tax provisions to amortise
goodwill related to Santander Totta.                                   Other small movements were recorded in this item from
                                                                       normal allocations and releases from portfolios that configure
Moreover, net capital gains of EUR 1,513 million generated in          the ALCO strategies, and from others that constitute positions
2011 (EUR 872 million arising from the entry of new partners in        of centralised management.
the capital of Consumer Finance USA and EUR 641 million from
the sale of the insurance holding in Latin America) were             • Other income, which includes various provisions and
assigned to the portfolios provisions for EUR 620 million and to       provisions, was EUR 429 million negative compared to EUR
the amortisation of intangibles, pensions and other                    428 million negative in 2010.
contingencies (EUR 893 million).
                                                                       This item includes provisions derived from the management
Second, and after eliminating the effects already commented            and sale of foreclosed properties. These were higher in 2011
on, the losses from the area’s ordinary activity were EUR 128          because of more entries than in 2010. Other types of
million less than in 2010.                                             provisions are included such as derivatives of goodwill and
                                                                       losses in the value of equity stakes.
The main developments were:
                                                                     • Lastly, the tax line reflects a lower rate arising from the
• Net interest income was EUR 2,172 million negative                   recovery of losses as a result of the different impact that
  compared to EUR 1,828 million also negative in 2010. The             certain one-off items had in both years.
  increase was largely due to the greater cost of wholesale
  funding. The reasons for this were concentrated in the higher
  level of market reference interest rates and the rise in the
  credit spreads of issues, as well as the cost of maintaining in
  the balance sheet a prudent liquidity position.


     ANNUAL REPORT 2011                                                                                                               135
2. Secondary segments or by business
                                                                                                 Attributable profit was EUR 6,893 million, 9.1% less than 2010
Retail Banking                                                                                   and affected by the provision of EUR 620 million in the second
                                                                                                 quarter for customer remediation in the UK.
       Net interest income grew 6.3% and net fee
       income 10.8%.                                                                             Results were also slightly impacted by the perimeter effect
                                                                                                 (mainly the incorporation of Poland’s Bank Zachodni WBK). The
       Costs rose 9.9% because of new projects and an                                            impact was three/four percentage points positive on revenues
       increase in installed capacity.                                                           and costs. The evolution of exchange rates during the period
                                                                                                 had a negative impact of one/two points.
       Risk management reflected in lower specific
       provisions, offset by the reduced availability of                                         Gross income increased 6.0% to EUR 39,892 million, due to the
       generic provisions.                                                                       6.3% rise in net interest income, the main component, and
                                                                                                 strongly backed by fee income (+10.8%).
       Profit hit by the PPI remediation in the UK in the
       second quarter to cover possible customer                                                 Operating expenses rose 9.9% (+6.8% without the perimeter
       remediation.                                                                              and exchange rate effects). As a result, the efficiency ratio was
                                                                                                 42.8% and net operating income was 3.3% higher at EUR
 Net operating income                       Attributable profit                                  22,817 million.
 Million euros                              Million euros
                                                                                                 Net loan-loss provisions were only 3.1% higher, reflecting the
+ 3.3%     2011-2010                       -9.1%     2011-2010                                   efforts made in previous years to improve risk management in
                                                                                                 the Group’s units which led to lower specific provisions. This,
                                                                                                 together with the one-off impact of the provision made in 2010
                                                                                                 in Spain because of the change in rules, offset the lower release
                             22,817


                                                            7,579


                                                                                                 of generic provisions. Net operating income after provisions
                 22,088


                                                                              6,893


                                                                                                 increased 3.5%
                                                                                                 Both lending and customer deposits increased a little (+2% and
                                                                                                 +4%, respectively).
         2010             2011                      2010                2011


 Income statement and business volumes secondary segments
 Million euros

                                                                             Operating                             Retail               Global          Asset Management
                                                                         business areas                          Banking     Wholesale Banking               and Insurance
                                                                        2011          Var (%)          2011       Var (%)       2011      Var (%)           2011     Var (%)
Income statement
Net interest income                                                   32,993              6.3        30,273           6.3       2,458         5.2            263       13.2
Net fees                                                               10,487             7.3          8,933         10.8       1,174        (8.8)           380      (10.5)
Gains (losses) on financial transactions                                1,895          (31.0)          1,106       (17.3)         785      (42.3)                4    (91.3)
Other operating income (1)                                                278            (2.6)          (420)        64.0         258        55.0            440        17.3
Gross income                                                          45,655              4.1        39,892           6.0       4,675       (9.2)          1,088         0.6
Operating expenses                                                   (19,052)             9.7       (17,076)          9.9      (1,643)       10.1           (333)       (2.8)
  General administrative expenses                                    (17,048)             9.5       (15,243)          9.5      (1,507)       11.9           (298)        0.8
     Personnel                                                       (10,041)           10.8          (8,874)        10.8        (998)       11.6           (169)        5.1
      Other general administrative expenses                            (7,007)            7.7         (6,369)         7.6        (509)       12.5           (129)       (4.3)
  Depreciation and amortisation                                        (2,004)          10.9          (1,832)        13.5        (136)       (6.5)            (35)    (25.5)
Net operating income                                                  26,603              0.4        22,817           3.3       3,032     (17.1)             754         2.2
Net loan-loss provisions                                             (10,599)              4.5      (10,459)          3.1        (141)         —                 0        —
Other income                                                           (2,565)         129.9          (2,476)      127.6           (32)    192.1              (57)    230.8
Profit before taxes                                                   13,439          (11.7)           9,882        (9.0)       2,859     (21.5)             698       (3.3)
Tax on profit                                                          (3,376)         (10.9)         (2,382)        (9.0)       (766)     (21.2)           (227)       13.2
Profit from continuing operations                                     10,064          (12.0)           7,500        (9.0)       2,093     (21.7)             471       (9.6)
Net profit from discontinued operations                                    (24)          77.7             (24)       77.7            —         —                —         —
Consolidated profit                                                   10,039          (12.1)           7,475        (9.1)       2,093     (21.7)             471       (9.6)
Minority interests                                                         855           (9.6)            583        (9.8)         221       (8.2)              52    (13.0)
Attributable profit to the Group                                        9,184         (12.3)           6,893        (9.1)       1,872     (23.0)             419       (9.2)

Business volumes
Total assets                                                        1,191,780             1.3       888,242           3.3     277,723        (2.2)         25,814     (21.9)
Customer loans                                                        747,297             3.6       665,875           2.4      81,000       14.8              421       (8.2)
Customer deposits                                                     612,861             1.8       532,029           3.6      75,134      (11.2)           5,699      39.0
(1).- Including dividends, income from equity-accounted method and other operating income/expenses


136                                                                                                                                                  ANNUAL REPORT 2011
Retail Banking. Income statement
Million euros

                                                                          Gross               Net operating                   Attributable
                                                                        income                      income            profit to the Group
                                                              2011       Var (%)           2011      Var (%)           2011        Var (%)

Continental Europe                                           13,531          7.9          7,772           4.3          2,302         (3.0)
o/w: Spain                                                     7,143        (2.3)         3,745          (3.0)           737        (36.3)
     Portugal                                                    785      (20.8)            292        (40.4)             95        (72.5)
United Kingdom                                                 5,118       (8.6)          2,812       (13.9)             889       (43.2)
Latin America                                                19,134          9.8         11,087           8.3          3,209         (0.9)
o/w: Brazil                                                   13,660        11.9          8,147         11.5           1,588        (12.1)
     Mexico                                                    2,023          7.0         1,145            5.3           762          64.3
     Chile                                                     1,758          2.3         1,032          (3.2)           438        (14.5)
Sovereign                                                      2,109         2.2          1,145           0.5            493         21.2
Total Retail Banking                                         39,892          6.0         22,817           3.3          6,893         (9.1)


Retail banking in continental Europe, despite the recovery in          All the stock markets in the countries where we operate fell in
revenues and the positive impact of incorporations to the              2011 (double-digit falls, close to and even higher than 20% in
Group, was conditioned by the higher amount assigned to                some markets except for the US).
provisions and writedowns (from the fall in the amount released
from generic provisions). Attributable profit declined 3.0%.           Despite this difficult environment, the total volume of managed
                                                                       assets rose, the fruit of commercial efforts. Of note was the
Retail banking in the UK was 42.5% lower in sterling as it was         capturing of new business by the Latin American units,
hit by the PPI charge. Excluding this impact, attributable profit      especially Brazil. Business grew in Italy because of own activity
was almost the same as in 2010. Gross income declined,                 as well as the acquisition of Banca Privada MeliorBanca.
affected by regulatory changes, but this was offset by flat costs
and reduced needs for provisions.                                      The volume of managed customer funds was EUR 101,000
                                                                       million at the end of 2011 (+4%).
Retail banking revenues in Latin America continued to grow and
also costs, compatible with business development. Net                  Profit before tax was 2.0% higher (+4.7% excluding exchange
operating income was 9.2% higher, excluding the exchange rate          rate impact) at EUR 370 million, due to the rise in net interest
impact.                                                                income (+9.2%) and reduced needs for provisions and
                                                                       writedowns, which offset the lower gains on financial
Attributable profit, after loan-loss provisions and writedowns,        transactions and higher operating expenses (+9.1%).
was 0.8% higher than in 2010 in constant currency.
                                                                       The higher tax charge absorbed almost four points of growth in
Global Private Banking includes institutions that specialise in        attributable profit which at EUR 279 million was 1.5% lower
financial advice and asset management for high-income clients          than in 2010 (+1.4% excluding the exchange rate impact).
(Banco Banif in Spain and Santander Private Banking in the UK,
Latin America and Italy), as well as the units of domestic private     In Europe, the profit generated by Banco Banif grew notably
banking in Portugal and Latin America, jointly managed with            and dropped in the UK and Portugal. Of note in Latin America
local retail banks.                                                    was the strong growth in Brazil and the higher contribution of
                                                                       Chile. International Private Banking’s contribution was lower,
The division continued to install and adapt its common business        due to higher taxes.
model, the commercial processes of advice, differentiated
management of customers, personnel training, standardisation           Banco Banif in Spain and the private banking unit in Latin
of investment strategies and discretional management and               America were chosen by the magazine Euromoney as the best
unification of products.                                               private banks in Spain and Latin America.

IT platforms for management of clients continued to be adapted
so that they will be the same for all units. This platform is
currently operating in Spain, Italy and Mexico, and is being
installed in Brazil.


     ANNUAL REPORT 2011                                                                                                                137
The division also continued to invest in resources to strengthen
Global Banking & Market                                                its operational capacities and distribution of basic treasury
                                                                       products, with a special focus on forex and fixed-income
                                                                       businesses. The generation of recurring revenues and strict
       Businesses and results were affected by the                     management of the cost base is enabling Santander Global
       economic weakness and tensions in markets,                      Banking to absorb these investments and improve its efficiency
       particularly in Europe.                                         ratio to 35.1%, among the best of its peers.

       Attributable profit was 23.0% lower.                            Meanwhile, and with a medium-term view in response to the
                                                                       market’s new conditions and the new regulatory framework,
       Customer revenues accounted for 87% of total                    Santander Global Banking & Markets took the first steps to
       revenues.                                                       develop its business model in order to raise its market share in
                                                                       products that consume little capital and liquidity.
       Impact on costs of the investment effort, although              This meant further efforts to improve the area’s transactional
       the efficiency ratio remained very good.                        capacity in a process that will last several years and which,
                                                                       already in 2011, showed signs of its potential: revenues
       Rigorous management of risk, liquidity and capital.             generated by transactional activities continued to increase
                                                                       compared to the decline in wholesale activities.
                                                                       The same idea is behind the measures taken in Poland and in
                                                                       the north east of the United States to accompany the Group in
Santander Global Banking & Markets posted an attributable              its international development. The objective is to exploit the
profit of EUR 1,872 million, 23.0% lower than in 2010.                 revenue synergies and management of clients’ current and
                                                                       potential commercial flows in the two countries where the
Markets were very unstable, beginning in the spring and                Group has strong business units.
intensified in the second half of the year due to the euro zone’s
sovereign debt crisis. This environment had a significant impact       Results and activity
on revenues, particularly those derived from equities and those        Profits declined because of the fall in gross income from the
not related to customers, whose falls explain the larger               sharp reduction in gains on financial transactions and in fee
reduction in profits.                                                  income, coupled with higher costs and provisions.
This area contributed 10% of gross income and 20% of                   Gross income declined 9.2%, following the 42.3% drop in
attributable profit of the operating areas.                            trading gains and after three quarters at their lowest levels since
                                                                       2007. Basic revenues were virtually unchanged, with net interest
Strategy                                                               income up 5.2% due to adjustments to spreads and larger
Santander Global Banking & Markets continued to maintain the           volumes, while fee income was 8.8% lower due to reduced
key drivers of its business model: centred on clients, the             activity in the markets.
division’s global scope and inter connection with local units.
                                                                       Costs (+10.1%) reflected the investment in equipment and
At the strategic level, and in a very complex year, the division       technology. Net operating income was 17.1% lower at EUR
focused on maintaining the results of its franchise and on             3,032 million. Provisions were higher, partly because of the
reducing exposure to risk (for example, cutting the risk of            lower release of generic provisions, as specific ones declined
trading activity), which helped to improve the Group’s capital         significantly. As a result, attributable profit fell 23.0%.
and liquidity positions, particularly in those countries with the
greatest tensions.                                                     The results were supported by strong and diversified client
                                                                       revenues, accounting for 87% of total gross income and
                                                                       showing greater stability, although somewhat shaken in the last
                                                                       two quarters of very high stress.
Net operating income                Attributable profit
Million euros                       Million euros                      Client revenues were 8.1% lower than in 2010, when they were
                                                                       particularly high because of certain operations and the positive
-17.1%     2011-2010               -23.0%     2011-2010
                                                                       impact on the books of high volatility in some markets.
                                                                       All countries client revenues fell except Sovereign in the US,
                                                                       which almost doubled them, within a sustained trend to reach
                3,658


                                                                       its natural share in corporate business. Among the big areas,
                           3,032


                                                    2,432


                                                                       Latin America only dropped 4%, affected by Mexico (-14%) as
                                                               1,872


                                                                       Brazil and Chile were more stable. Greater weakness in Europe,
                                                                       particularly Spain (-17%) and the UK (-18%), hit by tensions and
                                                                       falls in markets in the last few months.

        2010            2011                2010            2011
                                                                       The revenues generated by clients in the Global Relation Model,
                                                                       which give the area great stability, were stronger. They were
                                                                       only 4% lower and already account for 70% of total client
                                                                       revenues.
                                                                       The performance of the business areas was as follows:


138                                                                                                                ANNUAL REPORT 2011
Global Transaction Banking                                           Credit Markets
This area, which includes Cash Management, Trade Finance,            Credit Markets, which include origination and distribution of
Basic Financing and Custody, increased its client revenues 4%.       corporate loans or structured finance, bond origination and
                                                                     securitisation teams and asset and capital structuring, reduced
Cash Management revenues grew 18%, with rises in all                 client revenues by 3%. The growth in Latin America, strongly
countries. Of note were the four large units in Spain, Brazil,       backed by Mexico, and in the US was offset by the sharp decline
Mexico and Chile, particularly the last two which grew higher        in Europe, particularly in the UK after the exceptional operations
than the average.                                                    in 2010.
Custody and Settlement registered solid growth (+7%), backed         In loans, Santander maintained its reference position in Europe
by the positive contribution of Spain and strong rises in Mexico     and Latin America. Of note was the participation in the $12,500
and Chile.                                                           million loan for Sab Miller to finance the takeover of the
                                                                     Australian beer company Fosters. Santander was the book
Moderate growth in Basic Financing (+3%) in a context of
                                                                     runner and mandated lead arranger. Of note in Latin America
greater disintermediation and containment of risk assets which
                                                                     was the loan for Grupo Suramericana to acquire ING’s assets in
was offset by active management of spreads.
                                                                     the region.
Trade Finance dropped 7% after the high levels reached in 2010
                                                                     In project finance, Santander consolidated itself as one of the
in Latin America, particularly in Brazil. Good evolution in Spain,
                                                                     world’s leading banks. Of note was its presence in the
the UK and Sovereign.
                                                                     operations of Meerwind Offshore Wind Project (a 400 MW
Corporate Finance                                                    wind farm in the German North Sea) and participation in the
In a sluggish market, this area (mergers and acquisitions)           largest high speed train concession in France (Tours-Bordeaux)
reduced its client revenues 29%, but this did not hinder notable     amounting to EUR 7,800 million. In Latin America, Santander
participation in important transactions.                             capitalised on its experience in financing renewable energy
                                                                     and infrastructure and structured projects in Brazil, Mexico and
Of note was the advice provided for several of the most              Chile.
significant operations in the Group’s reference markets,
including the acquisition by a consortium led by Iberdrola of        In bonds, the area continued to consolidate business. In
electricity and gas distributors from AEI Energy (Ashmore Energy     Europe, Santander maintained an important presence in capital
International) in seven Latin American countries; the integration    markets throughout the year, despite the sharp fall in the
of Vivo and Telesp in Brazil; the entry of Qatar Holding into        volume issued in the second half. Latin America fared better.
Iberdrola and the purchase by the French Schneider of Telvent,       Of note was the role in the $6,000 million bond issue of
listed on Nasdaq.                                                    Petrobras, the largest issue ever in Latin America, and the
                                                                     placement of bonds for the Republic of Brazil, with the lowest
Participation in these operations enabled Santander to maintain      yield in history and the lowest spread against US Treasuries.
leading positions in the advisory rankings (according to             Also noteworthy was the second project bond of a Brazilian
Bloomberg and Thomson): second in Spain and Portugal and             company, and the second loan structured by Santander ($700
fourth in Latin America by volumes brokered ($19,947 million         million) for Queiroz Galvão.
and $15,559 million, respectively).
                                                                     Asset and Capital Structuring continued to increase its
                                                                     portfolio of clients in Europe, Latin America and the US, which
Gross income breakdown                                               produced strong growth in revenues and a positive
Million euros
                                                                     contribution from all countries. Of note were the structured
                                                                     lease operations in Europe for Veolia (electric trains) and
                     Total     5,150   -9%    4,675
                                                                     Hochtief (ship to install wind turbines offshore) and the
      Proprietary trading &                                          structuring and sale of a solar plant to Munich Re in Latin
                  portfolios           -16%    619                   America. A significant structured leasing operation was
                     Equity            -44%    356                   completed with TAM Linhas Aéreas and two renewable energy
                                                                     operations were structured in Mexico for Grupo Renovalia and
                      Rates            -7%    1,293                  Sowitec.
                                                      Customers
                     Credit            -3%     769      -8%

        Corporate Finance              -29%    56

Global Transaction Banking             +4%    1,582

                               2010           2011


      ANNUAL REPORT 2011                                                                                                            139
Rates                                                                              Equities
This area, which restructured its businesses into three activities,                The fall in revenues from Global Equities (those related to the
(Fixed Income sales, Fixed Income Flow and FX) registered a 7%                     equity markets) was 44% in 2011. This was due to the weak
fall in its client revenues. Improved sales were offset by the                     generation in the second half of the year as against high
weakness of the sovereign debt markets and its impact on                           revenues in 2010.
management of books.
                                                                                   In addition, the lower volumes and high levels of volatility in the
Fixed Income sales (sale and distribution of derivatives) increased                markets in the second half reduced the revenues from equities
its revenue 6%, backed by the UK and Brazil. Of note by client                     brokerage, derivatives and structure products revenues, as well
type was the good performance of corporates (+21%). The retail                     as the contribution to the income statement from management
segment repeated the results of 2010 while the focus on the                        of books.
institutional segment produced 9% growth.
                                                                                   The uncertainty over the economic recovery hit the primary
Revenues from Fixed Income Flow activity (distribution of                          market hard, delaying some key operations in Europe and Latin
corporate and government bonds, interest rate, credit and                          America.
inflation derivatives) was sharply down (-23%) due to the impact
on the markets of the European Union’s sovereign debt crisis                       Lastly, there was a noteworthy increase in Santander’s activity in
which countered the solid rise in sales.                                           exchange traded derivative markets as access provider to main
                                                                                   markets worldwide, boosting revenues.
Lastly, FX (trading activities and hedging of exchange rates and
short-term money markets for the Group’s wholesale and retail
clients) maintained sustained growth (+9%) firmly backed by the
UK and Latin America, particularly Brazil. Good contribution
from all client segments (retail, corporate and institutional), as
well as a solid performance from activity in the short-term
money markets in Europe, in an environment of high volatility.


 Ranking in 2011

               Activity                                                           Area       Country / Region                Source

Award          Best International Trade Bank                                       GTB       Brazil/Chile                    Trade Finance Magazine
Award          Best Overall Trade Bank                                             GTB       Latin America                   Trade Finance Magazine
Award          World's Best Sub-Custodian Banks                                    GTB       Spain                           Revista Global Finance
Award          M&A Latin American deal of the year: Amapola                        CIB       Latin America                   Euromoney
Award          Germany: Meerwind. European Offshore Wind Deal of the Year          CM        Europe                          Euromoney
Award          Best Quasi-Sovereign Bond - Petrobras $6bn                          CM        Latin America / Brazil          Latin Finance
Award          Best Infrastructure Bank                                            CM        Latin America                   Latin Finance
Award          Best Foreign Exchange Provider                                      RT        Spain/Chile/Portugal/Uruguay    Global Finance
N1.*           Mejor Banco en Derivados de Foreign Exchange                        RT        Spain                           Risk,net
N1.*           Mejor Banco en Derivados de Tipos                                   RT        Spain                           Risk,net
N1.*           Equities Research en Iberia                                         EQ        Iberia                          Institutional Investors
N1.**          Equity Capital Markets en Iberia                                    EQ        Iberia                          Dealogic
N2.**          Equity Capital Markets de Latin America                             EQ        Latin America                   Bloomberg

(*).- Ranking depending on the criterion               (**).- Ranking by volume

 GTB: Global Transaction Banking           CIB: Corporate and Investment Banking            CM: Credits and Markets         RT: Rates         EQ: Equity


140                                                                                                                            ANNUAL REPORT 2011
In Latin America, Santander signed a global agreement in July
Asset Management and Insurance                                    with the insurer Zurich to bolster business in the region. Under
                                                                  the agreement, which came into effect in the fourth quarter,
                                                                  Zurich has 51% of the holding company which groups
       Strong growth (+9%) in total revenues, (9.5% of
                                                                  Santander’s insurers in Argentina, Brazil, Chile, Mexico and
       the operating areas’ total).
                                                                  Uruguay, as well as a product distribution agreement in these
                                                                  countries.
       Mutual and pension funds: lower volumes partly
       offset by the better mix of products.                      Results
                                                                  Gross income flat at 0.6%, while net operating income rose
       Insurance: faster pace in revenues in Brazil and the       2.2% after the 2.8% fall in operating expenses. The other
       rest of Latin America and sustained recovery in            negative results and a higher tax charge caused attributable
       Spain and in consumer business.                            profit to be 9.2% lower. These results include a negative
                                                                  impact of EUR 64 million in gross income and EUR 53 million in
       The strategic alliance with Zurich was completed           net operating income from the global agreement with Zurich in
       and will boost the insurance offer in Latin America.       the fourth quarter. Excluding this impact, gross income
                                                                  increased 6.6% and net operating income 9.2%.
                                                                  The area’s total revenues contributed to the Group including
                                                                  those recorded by the distribution networks amounted to EUR
                                                                  4,334 million, 9.3% more than in 2010. The total contribution
                                                                  (profit before tax plus fees paid to the networks) was EUR
Total revenues generated by asset management and insurance        3,944 million (+9.4%).
rose 9.3% to EUR 4,334 million and accounted for 9.5% of the
Group’s total revenues from its operating areas.                     Asset Management

Attributable profit, after deducting distribution and             The global area of Santander Asset Management posted an
transformation costs, dropped 9.2% to EUR 419 million, largely    attributable profit of EUR 53 million. The total contribution
affected by lower revenues from insurance in the fourth quarter   (profit before tax and fees paid to the networks was EUR
after the global agreement with Zurich materialised.              1,062 million, 4.7% less than in 2010 and due to flat total
                                                                  revenues (-2.1%).
Strategy
Santander Asset Management advanced in developing a global        The revenue reduction was the result of a fall in managed
business model based on the Group’s management capacities         volumes, accelerated in the second half, which was partly
and the market knowledge of local fund managers. The push         offset by a better mix of products and, in consequence, in
given to the multimanager team to manage funds of funds, as       average revenues.
well as the creation of global teams to manage Latin American
and European mandates, underlined the progress.                   Total mutual and pension funds under management amounted
                                                                  to EUR 112,000 million, 10% less than in December 2010. The
Santander Insurance also continued to build its global business   preference for liquidity and on-balance sheet funds, together
model by launching units and businesses to respond to the         with more unstable markets in the second half of the year and
needs of local networks and customers, while preserving a low     the impact on prices, explain the fall in volumes.
risk profile model and one very efficient in its operations.
                                                                  The main developments by units and countries were as follows:
                                                                  • In traditional management of assets, mutual fund
Net operating income              Attributable profit               business remained resilient in a very demanding environment.
Million euros                     Million euros
                                                                    In this segment, the Group manages EUR 110,000 million in
+ 2.2%    2011-2010              -9.2%    2011-2010                 funds, investment companies and pension plans (-8%), of
                                                                    which 90% comes from four large markets (Brazil, the UK,
                                                                    Spain and Mexico).
                         754


                                                                    Business in Brazil, the main market for the Group by volume
                739


                                                                    (EUR 39,400 million), slowed down in the fourth quarter and
                                                  462


                                                                    ended the year 2% lower in local currency. In this market,
                                                           419


                                                                    where there is pressure for liquidity in certain segments and
                                                                    good capturing of funds that enable the treasury surpluses of
                                                                    companies to be maximised, Santander has a share of around
                                                                    14%. This is above its natural share in the retail segment, the
        2010          2011                2010          2011
                                                                    most profitable one.


      ANNUAL REPORT 2011                                                                                                          141
The UK continued to increase its retail balances under              • In non-traditional management (real estate, alternative
  management (+6% in sterling to EUR 15,700 million), backed            management and private equity funds), Santander Asset
  by growth in multimanager funds of funds. Our fund                    Management continued to adjust its activity to the scant
  management entity achieved the largest net capturing in this          demand for these products.
  type of product according to the Fundscape Pridham Report.
                                                                        In the first quarter, Grupo Santander decided, for solely
  This performance was recognised by the market. The                    commercial reasons, to provide funds to Santander Banif
  multimanager team in the UK received the award for Best               Inmobiliario, by subscribing to new units and granting a two-
  Manager of the Year by Investment Week in the category of             year liquidity guarantee in order to meet any outstanding
  funds of funds.                                                       redemption claims. This measure ended the suspension of
                                                                        reimbursements and returned the fund to normal.
  In Spain, large net reimbursements continued throughout the
  sector, reflecting the preference of banks for liquidity. In this     Greater stability in alternative funds after the restructuring in
  environment, Santander Asset Management focused                       previous years, and in the private equity segment, which is
  successfully on mixed and guaranteed funds. Of note was the           aimed at institutional clients who invest long term in unlisted
  more than EUR 1,000 million captured by the range of Select           companies.
  funds. Also notable was the awarding to Santander of the
  first institutional mandate for private fixed income securities
  outside of Spain (Germany).
                                                                      Total Group revenues
  All of this helped to consolidate the Group as the market           Million euros
  leader in mutual funds (16.6% market share, according to
  Inverco), and maintain assets under traditional management in
  Spain, including pension plans, at EUR 34,000 million (-13%).                                           +9%      4,334
                                                                                         Total    3,966
  Mexico benefited from the launch of new mixed and
  guaranteed funds and increased its volume 3% in pesos to
  EUR 9,400 million and improved the mix of products.                                 Insurance                    3,083
                                                                                                          +15%
  In the rest of markets, Chile’s volume dropped 10% in pesos,
  because of the push into deposits. In Portugal, the shift into
  deposits and the impact of markets accelerated the fall in
                                                                           Asset Management               -2%      1,251
  mutual and pension funds (-42%).

                                                                                                  2010             2011


142                                                                                                               ANNUAL REPORT 2011
Insurance                                                        Insurance (breakdown PBT + Fees)
                                                                    %
The global area of Santander Insurance posted an attributable
profit of EUR 366 million, 3.8% more than in 2010. This result
was affected by the sale of 51% of the insurance companies in
Latin America completed in the fourth quarter as, without it,            Other Latin America                     Spain 14%
                                                                                       16%
growth would have been 4.0%.
Insurance business generated for the Group total revenues
(including fee income paid to the commercial networks) of EUR                                                           Germany 13%
3,083 million (+14.7%). The total contribution to profits
(income before taxes of insurers and brokers plus fee income
received by the networks) increased 15.7% to EUR 2,882
million, and 17.9% higher excluding the impact of the sale of                                                          Other
the insurance companies.                                                     Brazil 37%                                Europe 12%

The total volume of premium income increased 9% due to the                                                       United Kingdom 7%
good evolution of protection insurance premiums (+13%) as                                      Sovereign 1%
well as the recovery in the distribution of savings insurance
whose premium income rose 7% after falling in 2010.
Continental Europe‘s contribution increased 7%, backed by the
solid performance of Santander Consumer Finance and the             Latin America increased its contribution 26%, excluding the
recovery in Spain.                                                  exchange rate impact (+31% without the impact of the sale of
                                                                    the insurance companies). This clearly reflected the region’s
Excluding consumer business, Spain increased its contribution       high potential. The greater efficiency in selling via banking
by 8% due basically to the relaunch of savings-investment           networks and other channels, together with the development
products and the competitiveness of protection products.            of simple products independent of loans, pushed up the
Portugal’s contribution continued to decline (-19%) because of      region’s activity and results.
the greater pressure from deposits, while the contribution of
Poland (BZ WBK) is still small.                                     Of note was Brazil, which contributed more than two-thirds of
                                                                    the region’s total (+28%), and Mexico (+46%), while Chile only
Santander Consumer Finance maintained its strong pace of            grew 2%. On a like-for-like basis, Brazil’s growth would have
selling, adjusted to each market, which enabled it to increase      been 33%, Mexico 49% and Chile 5%, all in local currency.
its total contribution by 11%. The acceleration of the German
market and the contribution of new entities offset the decline      Sovereign, still installing its insurance model, continued to
in some peripheral markets.                                         increase its total contribution (+15% in dollars).

The UK’s total contribution rose 4% in sterling. The quarterly
evolution was better.


Asset Management and Insurance. Income statement
Million euros

                                                                       Gross                    Net operating                  Attributable
                                                                     income                           income           profit to the Group
                                                             2011       Var (%)           2011         Var (%)          2011         Var (%)

Mutual funds                                                  266         (0.3)                111       (1.9)            43          (38.9)
Pension funds                                                  23         (8.1)                 15       (5.7)            10            (4.8)
Insurance                                                     799          1.1                 629        3.1            366            (3.8)
Total Asset Management and Insurance                        1,088          0.6                 754        2.2            419           (9.2)


     ANNUAL REPORT 2011                                                                                                                  143
Informe_Gestion Riesgos 2011_ENG_V17:esp 28/02/12 11:17 Página 144


                                        Risk management report
Informe_Gestion Riesgos 2011_ENG_V17:esp 28/02/12 11:17 Página 145


                                                                     14    Executive summary
                                                                     148   Corporate principles of risk management
                                                                     152   Corporate governance of the risks function
                                                                     154   Integral control of risk
                                                                     15    Credit risk
                                                                     166      Credit exposure in Spain
                                                                     178   Market risk
                                                                     188      Management of financing and liquidity risk
                                                                     1 3   Operational risk
                                                                     1     Reputational risk
                                                                     1 8   Adjustment to the new regulatory framework
                                                                     200   Economic capital
                                                                     203   Risk training activities
Informe_Gestion Riesgos 2011_ENG_V17:esp 28/02/12 11:17 Página 146


            Executive summary
        Banco Santander’s risk management principles
            pages 148 to 151


                  Independence of the risk function.
                  Involvement of senior management in decision-taking.
                  Collegiate decisions that ensure the contrast of opinions.
                  Clear definition of attributions.
                  Control and management of risk integrated via a corporate
                  structure with all risk, all businesses and all countries scope.


            Credit risk
            pages 156 to 177

            Credit to clients (gross)
            % of operating areas                                                                          225      Total Spain (Billion euros)
                                     Chile Rest of Latin America                                          12       Public administrations
                            Mexico 3% 3% 2% Sovereign 5%
                    Brazil 11%
                                                                                                          59       Residential mortgages

                                                                                                          26       Other loans to individuals

                                                                 Spain 29%
                                                                                                          105      Companies excluding
                                                                                                                   real estate purpose

       United Kingdom
                 34%                                                                                      23.4     With real estate purpose
                                                  Portugal 4%                                                                                     32.0
                                               Germany 4%                                                 8.6      Foreclosed properties
                          Rest of Europe 4% Commercial Poland 1%


            Exposure to real estate sector in Spain
            pages 168 to 170

                  It accounts for 4% of the Group's gross loans plus foreclosed properties in Spain.

            Exposure to the construction sector and                              Impact on Grupo Santander of the financial
            real estate promotion Billion euros                                  reform in Spain Million euros
            Total: 32.0                                                          Amount of provisions
                               Foreclosed properties 8.6 (27%)
                                                                                 Additional provisions under new rules at 31.12.2011               6,100
                                                                                 Against results 2011                                             -1,800
                                                                                 Buffer covered with surplus of existing capital                  -2,000
                                                            Doubtful loans
                                                            6.7 (21%)            Provisions pending                                              = 2,300

                                                                                 Financing of new provisions in 2012                              2,300
                                                                                 Charged to capital gains from the sale of Santander Colombia       900
                                                                                 Charged to other capital gains and ordinary                       1,400
            Normal portfolio
                12.8 (40%)                              Sub standard 3.9 (12%)   allowances 2012


      146                                                                                                                           ANNUAL REPORT 2011
Informe_Gestion Riesgos 2011_ENG_V17:esp 28/02/12 11:17 Página 147


               Economic capital
               pages 200 to 202

                Analysis of the global risk profile                                             • The Group’s economic capital at the end of 2011
                By type of risk                                                                   was EUR 45,838 million.
                                                                                                • By business units, continental Europe accounts
                                                                                                  for 39%, Latin America 34%, the UK 10%,
                                                             Credit 64%                           Sovereign 6% and financial management and
                                                                                                  equity stakes 11%.
                                                                                                • The Group’s diversification generates economic
                                                                                                  capital savings.

                     Non-trading
                      equity 4%                               Material assets 2%
                    FX structural 5%                       Business 7%
                            Trading 1%
                                         ALM 8%    Operational 9%


               Management of funding and liquidity risk
               pages 188 to 192


               • Santander’s subsidiaries are autonomous and self-                  Monitoring metrics
                 sufficient in capital and liquidity and are subject to
                 coordination and the Group’s corporate policies.                  Metrics                                      2011           2010   2009
               • The portfolio of loans (77% of net assets) is wholly              Loans/Net assets                             77%            75%    79%
                 financed by customer deposits and medium- and long-               Customer deposits, insurance                 113%          115%    106%
                 term funding.                                                     and medium and long-term
               • In 2011, EUR 40,000 million of debt was issued,                   funding/Lending
                 covering 124% of the year’s maturities and                        Customer deposits, insurance and             114%          117%    110%
                 amortisations.                                                    medium and long-term financing,
                                                                                   shareholders’ funds and other liabilities/
               • Santander has a total discounting capacity in central             Loans+fixed assets
                 banks of around EUR 100,000 million.
                                                                                   Short-term funding/Net liabilities            2%             3%     5%
                                                                                   Loan-to-deposit ratio                        117%          117%    135%


                                                                                   VaR evolution in 2011
               Market risk                                                         Million euros. VaR at 99%. Time frame of one day

               pages 178 to 192                                                      34
                                                                                                           Max. (33.2)
               • Santander maintains a moderate exposure to                          30
                 market risk.
                                                                                     26
               • Despite high volatility in financial markets, the
                 average exposure in trading activity was lower                      22
                 than in 2010.
                                                                                     18
               • In 2011, the Group continued to reduce, from an
                 already low level, its exposure related to complex                  14
                 structured assets.
                                                                                     10                                                Min. (12.0)
                                                                                           03 Jan.
                                                                                           22 Jan.
                                                                                          10 Feb.
                                                                                          20 Mar.
                                                                                           08 Apr.
                                                                                           27 Apr.
                                                                                          16 May.
                                                                                           04 Jun.
                                                                                           23 Jun.
                                                                                            12 Jul.
                                                                                            31 Jul.
                                                                                          19 Aug.
                                                                                          07 Sep.
                                                                                          26 Sep.
                                                                                          15 Oct.
                                                                                          03 Nov.
                                                                                          22 Nov.
                                                                                          11 Dec.
                                                                                          30 Dec.


                  ANNUAL REPORT 2011                                                                                                                         147
Informe_Gestion Riesgos 2011_ENG_V17:esp 28/02/12 11:17 Página 148


      Corporate principles of risk management,
      control and appetite


      The importance of Grupo Santander’s risk policy was                 Management and control of risk is developed in the following
      underscored again in 2011. The policy is focused on maintaining     way:
      a medium-low and predictive profile in all risks, which, together
                                                                          • Formulate the risk appetite. The purpose is to delimit,
      with the Group’s high degree of diversification, was again the
                                                                            synthetically and explicitly, the levels and types of risk that the
      differential element that enabled Santander to maintain a
                                                                            bank is ready to assume in the development of its business.
      leading position in the market.
                                                                          • Establish risk policies and procedures. They constitute the
      For Grupo Santander, quality management of risk is one of its
                                                                            basic framework for regulating risk activities and processes. At
      hallmarks and thus a priority in its activity. Throughout its 150
                                                                            the local level, the risk units incorporate the corporate rules to
      years, Santander has combined prudence in risk management
                                                                            their internal policies.
      with use of advanced risk management techniques, which have
      proven to be decisive in generating recurrent and balanced          • Building, independent validation and approval of the risk
      earnings and creating shareholder value.                              models developed in accordance with the corporate
                                                                            methodological guidelines. These models systemise the risk
      The risks model is based on the following principles:
                                                                            origination processes as well as their monitoring and recovery
      • Independent working from the business areas. Mr. Matías             processes, calculate the expected loss, the capital needed and
        Rodríguez Inciarte, the Group’s third vice-chairman and             evaluate the products in the trading portfolio.
        chairman of the board’s risk committee, reports directly to the
                                                                          • Execute a system to monitor and control risks, which verifies
        executive committee and to the board. The establishment of
                                                                            every day and with the corresponding reports the extent to
        separate functions between the business areas (risk takers)
                                                                            which Santander’s risks profile is in line with the risk policies
        and the risk areas responsible for measurement, analysis,
                                                                            approved and the limits established.
        control and information provides sufficient independence and
        autonomy to control risks appropriately.                          Santander’s risk management is fully identified with the Basel
      • Involvement of senior management in all decisions taken.          principles as it recognises and supports the industry’s most
                                                                          advanced practices which the Group has been anticipating and,
      • Collegiate decision-making (including at the branch level),       as a result, it has been using for many years various tools and
        which ensures a variety of opinions and does not make results     techniques which will be referred to later in this section. They
        dependent on decisions solely taken by individuals. Joint         include:
        responsibility for decisions on credit operations between risk
        and business areas, with the former having the last word in       • Internal rating and scoring models which, by assessing the
        the event of disagreement.                                          various qualitative and quantitative components by client and
                                                                            operation, enable the probability of failure to be estimated
      • Defining functions. Each risk taker unit and, where                 first and then, on the basis of estimates of loss given default,
        appropriate, risk manager has clearly defined the types of          the expected loss.
        activities, segments, risks in which they could incur and
        decisions they might make in the sphere of risks, in              • Economic capital, as the homogeneous metric of the risk
        accordance with delegated powers. How risk is contracted,           assumed and the basis for measuring management, using
        managed and where operations are recorded is also defined.          RORAC, for pricing operations (bottom up), and for analysis of
                                                                            portfolios and units (top down), and VaR, as the element of
      • Centralised control. Risk control and management is
                                                                            control and setting the market risk limits of the various trading
        conducted on an integrated basis through a corporate
                                                                            portfolios.
        structure, with global scope responsibilities (all risk, all
        businesses, all countries).                                       • Analysis of scenarios and stress tests to complement the
                                                                            analysis of market and credit risk, in order to assess the
                                                                            impact of alternative scenarios, including on provisions and
                                                                            on the capital.


      148                                                                                                              ANNUAL REPORT 2011
Informe_Gestion Riesgos 2011_ENG_V17:esp 28/02/12 11:17 Página 149


             Grupo Santander calculates the minimum regulatory capital in         Risk appetite framework
             accordance with Bank of Spain circular 3/2008 and subsequent         Santander’s risk appetite framework has quantitative as well as
             changes on determining and controlling the minimum equity of         qualitative elements that are integrated into a series of basic
             credit institutions. This regulation completed the transfer to       metrics (applicable to both the whole of the Group as well as its
             Spanish banking legislation of various EU directives.                main business units) and another series of transversal metrics
                                                                                  which because of their nature are directly applied for the whole
             As a result of the new elements introduced into the regulatory       of the Group’s units.
             framework, commonly known as BIS III, Grupo Santander took
             steps to apply with sufficient prevision the future requirements     Qualitative elements of the risk appetite:
             indicated in BIS III. This entails a greater requirement for high    The qualitative elements of the risk appetite framework define,
             quality capital, sufficiency of capital conservation and counter     both generally and for the main risk factors, the positioning that
             cyclical.                                                            Santander’s senior management wises to adopt or maintain in
                                                                                  the development of its business model. Generally, Grupo
                                                                                  Santander’s risk appetite framework is based on maintaining the
                                                                                  following qualitative objectives:
             Grupo Santander’s risk appetite
                                                                                  • A general medium-low and predictable risk profile based on a
             The risk appetite is defined in Santander as the amount and type       diversified business model, focused on retail banking and with
             of risks considered reasonable to assume for implementing its          an internationally diversified presence and with significant
             business strategy, so that the Group can maintain its ordinary         market shares. Develop a wholesale banking model which
             activity in the event of unexpected events that could have a           attaches importance to the relationship with clients in the
             negative impact on its level of capital, levels of profitability       Group’s core markets.
             and/or its share price.
                                                                                  • Maintain a rating in a range between AA- and A- on the basis
             The board is responsible for establishing the risk appetite and        of the environment at both Group level as well as in the local
             monitoring the risk profile and ensuring the consistency               units (in local scale), and the evolution of sovereign risk.
             between both of them. Senior management is responsible for           • Maintain a stable and recurring policy of profit generation and
             achieving the desired risk profile as well managing risks on a         shareholder remuneration on the foundations of a strong
             daily basis. The establishment of the risk appetite covers both        capital base and liquidity and an efficient diversification
             the risks whose assumption constitutes the strategic objective         strategy by sources and maturities.
             and for which maximum exposure criteria are set —minimum
             objectives of return/risk— as well as those whose assumption is      • Maintain an organisational structure based on autonomous
             not desired but which cannot be avoided in an integral way. The        and self-sufficient subsidiaries in terms of capital and liquidity,
             board will ensure that the amount and type of risks relevant for       minimising the use of non-operational or investment
             the bank have been taken into account. These derive from the           companies, and ensuring that no subsidiary has a risk profile
             annual budget approved as well as the medium-term strategic            that could jeopardise the Group’s solvency.
             plan. It also ensures that sufficient resources have been assigned   • Maintain an independent risk function and intense
             to manage and control these risks, at both the global and local        involvement by senior management that guarantees a strong
             levels.                                                                risk culture centred on protecting and ensuring an adequate
                                                                                    return on capital.
             The board will regularly revise, at least once a year, the Group’s
             risk appetite and its management framework, analysing the            • Maintain a management model that ensure a global vision
             impact of unlikely but plausible tension scenarios and adopting        and one inter-related with all risks, through an environment
             the pertinent measures to ensure the policies set are met.             of control and robust corporate monitoring of risks, with
                                                                                    global scope responsibilities: all risk, all businesses, all
             The risk appetite is formulated for the whole Group as well as         countries.
             for each of its main business units. The boards of the
             subsidiaries must approve the respective risk appetite proposals     • Focus the business model on those products which the Group
             adapted to the corporate framework.                                    has sufficient knowledge of and the management capacity
                                                                                    (systems, processes and resources).
                                                                                  • The confidence of customers, shareholders, employees and
                                                                                    professional counterparts, guaranteeing the development of
                                                                                    their activity within its social and reputational commitment, in
                                                                                    accordance with the Group’s strategic objectives.
                                                                                  • Maintain adequate and sufficient availability of the necessary
                                                                                    human resources, systems and tools that guarantee the
                                                                                    continuation of a risk profile compatible with the risk appetite
                                                                                    established, both at the global and local levels.
                                                                                  • Implement a remuneration policy that contains the necessary
                                                                                    incentives to ensure that the individual interests of employees
                                                                                    and executives are aligned with the corporate framework of
                                                                                    risk appetite and these are consistent with the evolution of
                                                                                    the institution’s results over the long term.


                  ANNUAL REPORT 2011                                                                                                                149
Informe_Gestion Riesgos 2011_ENG_V17:esp 28/02/12 11:17 Página 150


      Quantitative elements of risk appetite                               Liquidity position
      The quantitative elements that comprise the risk appetite            The Group’s liquidity management model is based on the
      framework are specified in the following basic metrics:              following principles:
      • The maximum losses that the bank has to assume,                    • Decentralised liquidity model: autonomy of the subsidiaries
                                                                             within management coordinated at the Group level.
      • The minimum capital position that the bank wants to
        maintain, and                                                      • Comfortable structural liquidity position supported by stable
      • The minimum liquidity position that the bank wishes to have          funding: mainly customer deposits (principally in the retail
                                                                             segment) and medium- and long-term wholesale funding
      in the event of unlikely but plausible tension scenarios.              (with an objective of an average maturity of more than three
      The Group also has a series of transversal metrics to limit the        years).
      excessive concentration of the Group’s risk profile, both by risk    • Ample access to wholesale markets and diversification by
      factors as well as from the standpoint of customers, businesses,       markets, instruments and maturities.
      countries and products.
                                                                           • High discounting capacity in central banks.
      The risk appetite framework distinguishes between:
                                                                           Bearing in mind the Group’s wish to be structured on the basis
      a) Risk capacity: the maximum level of risk that the Group can
                                                                           of autonomous subsidiaries, liquidity management is executed
         technically assume in the development of its business plans
                                                                           by each of our subsidiaries. All of them, thus, must be self-
         without compromising its commercial viability;
                                                                           sufficient as regards the availability of liquidity.
      b) Risk appetite: the level, type of risk and geographic
         distribution that the Group is ready to accept in order to        Transversal metrics of risk appetite:
         attain the strategic objectives in its business plan;             concentration
                                                                           Santander wants to maintain a well diversified risk portfolio from
      c) Objective risk: the level and type of risk the Group              the standpoint of its exposure to large risks, certain markets and
         incorporates into its budgets.                                    specific products. In the first instance, this is achieved by virtue of
      Risk tolerance is defined as the difference between risk             Santander’s focus on retail banking business with a high degree
      appetite and objective risk. The risk appetite framework includes    of international diversification.
      setting a series of triggers as the risk tolerance is consumed.
                                                                           Concentration risk: this is measured via three focuses, which
      Once these levels are reached and the board is informed the
                                                                           include limits set as signs of alert or control:
      necessary management measures are adopted so that the risk
      profile can be reconducted.                                          • Customer: individual and aggregate exposure to the 20 largest
                                                                             clients as a proportion of shareholders’ funds.
      Losses
      One of the three basic metrics used to formulate Santander’s         • Product: maximum exposure of clients to derivatives.
      risk appetite is expressed in terms of the maximum losses it is
      prepared to assume in the event of unfavourable                      • Sector: maximum percentage of exposure of the portfolio of
      scenarios —internal and external— whose probability of                 companies to an economic sector.
      occurrence is considered low but plausible.
                                                                           Specific objectives by type of risk
      We regularly conduct analysis of the impact, in terms of losses,     In addition, Grupo Santander’s risk appetite framework includes
      of submitting the portfolios and other elements that make up         specific objectives for the following types of risk:
      the bank’s risk profile to stress scenarios that take into account
      various degrees of the probability of occurring.                     Credit risk
                                                                           • Complete management of the credit risk cycle with a
      The time frame for materialisation of the negative impact for all      corporate model based on establishing budgets, structure of
      risks considered will normally be 12 months, except for credit         limits and management plans for them and on monitoring
      risk where an additional impact analysis is conducted with a           and control integrated with global reach responsibilities.
      three year time frame.                                               • Global and inter-related vision of the credit exposure, with
      Capital position                                                       portfolio vision, including, for example, lines committed,
      Santander wants to operate with a large capital base that              guarantees, off-balance sheet, etc.
      enables it not only to comply with the regulatory requirements       • Involvement of the risk function in all credit risk admissions,
      but also have a reasonable surplus of capital. Its core capital        avoiding the taking of discretionary decisions at the personal
      target is 10%, which is one percentage point above the 9%              level, combined with a strict structure of delegation of
      required by the European Banking Authority (EBA).                      powers.
      The capital target extends to a period of three years, within the    • Systematic use of scoring and rating models.
      capital planning process implemented in the Group.                   • Centralised control and in real time of the counterparty risk.


      150                                                                                                                ANNUAL REPORT 2011
Informe_Gestion Riesgos 2011_ENG_V17:esp 28/02/12 11:17 Página 151


             Market risk                                                           Compliance and reputational risk
             • Moderate market risk appetite.                                      • Compliance with all the regulatory requirements, ensuring
                                                                                     qualifications and substantial recommendations are avoided
             • Business model focused on the customer with scant exposure
                                                                                     in audits and supervisors’ reviews.
               to own account business activities.
             • Independent calculation of the results of market activities by      • Maintain the confidence of customers, shareholders and
               the risk function.                                                    employees, as well as society in general, regarding solvency
                                                                                     and reputation.
             • Daily centralised control of the market risk of trading activity
               (VaR).                                                              • Maintain a zero appetite in compliance and reputational risk
                                                                                     through corporate policies, with local implementation, backed
             • Strict control ex ante of products, underlying assets,
                                                                                     by risk indicators and the functioning of corporate and local
               currencies, etc, for which operations are authorised as well as
                                                                                     committees that enable risk to be identified, monitored and
               of the corresponding valuation models.
                                                                                     mitigated in matters of:
             Structural risks
                                                                                   • – Prevention of money laundering: (Analysis and resolution
             • Conservative management of balance sheet and of liquidity               Committee);
               risk on the basis of the what is stated in the previous sections.
             • Active management of exchange rates in relation to the              • – Compliance (committee of compliance with regulations):
               hedging of capital and the results in subsidiaries.                     codes of conduct in the securities market; suspicious
                                                                                       operations; abuse of market; institutional relations; Markets
             • Reduced sensitivity of margins and capital to changes in                in Financial Instruments Directive (MiFid); customers’
               interest rates in stress situations.                                    complaints to supervisors; data protection regulations and
             • Limited assumption of credit risk in managing the Group’s               code of conduct of employees;
               balance sheet.                                                      • – Commercialisation of products: reputational risk
             • Limited assumption of cross-border risk.                                management office and committees of approval, marketing
                                                                                       and monitoring of products, observing operational, conduct
             Technology and operational risk                                           and reputational risk criteria.
             • Supervision of technology and operational risk management
               through approval of the management framework and of the             • Registry and monitoring of disciplinary procedures, total cost
               structure of the corresponding limits.                                by losses including fines and sanctions.

             • Management focus centred on risk mitigation, based on               • Continuous monitoring of audits and revisions of the
               monitoring and controlling gross losses/gross income, self-           supervisors and of their corresponding recommendations in
               assessment questionnaires/risk maps and management                    the sphere of compliance and reputational risk.
               indicators.
                                                                                   Risk appetite and living will
             • Operational and technology integration model via corporate          The Group has an organisational structure based on
               platforms and tools.                                                autonomous and self-sufficient subsidiaries in terms of capital
             • Systems’ architecture with adequate redundancies and                and liquidity, minimising the use of non-operating or investment
               controls in order to guarantee a minimum probability of             companies, and ensuring that no subsidiary has a risk profile
               occurrence of high impact events and which, in their case,          that could jeopardise the Group’s solvency.
               limit their severity.
                                                                                   Grupo Santander was the first of the international financial
             • Business Continuity Master Plan with local developments;            institutions considered globally systemic by the Financial Stability
               local plans of contingency coordinated with the corporate           Board to present (in 2010) to its consolidated supervisor (the
               area of technology and operational risk.                            Bank of Spain) its corporate living will including, as required, a
                                                                                   viability plan and all the information needed to plan a possible
                                                                                   liquidation (resolution plan). Furthermore, and even though not
                                                                                   required, in 2010 more summarised individual plans were drawn
                                                                                   up for the main geographic units, including Brazil, Mexico, Chile,
                                                                                   Portugal and the UK. The second version of the corporate living
                                                                                   will was presented in 2011 and also the second version of the
                                                                                   main summarised local and voluntary plans, and progress was
                                                                                   made in drawing up the local obligatory plans for the Group’s
                                                                                   entities which must be eventually presented.
                                                                                   Also noteworthy was the significant contribution that the living
                                                                                   will exercise made to the conceptual delimitation of the Group’s
                                                                                   risk appetite and risk profile.


                  ANNUAL REPORT 2011                                                                                                               151
Informe_Gestion Riesgos 2011_ENG_V17:esp 28/02/12 11:17 Página 152


      1. Corporate governance
         of the risks function


      The risk committee is responsible for proposing to the board the      The main responsibilities of the board’s risk committee are:
      Group’s risk policy, approval of which corresponds to the board
                                                                            • Propose to the board the risk policy for the Group, which
      under its powers of administration and supervision. The
                                                                              must, in particular, identify:
      committee also ensures that the Group’s activities are consistent
      with its risk tolerance level and establishes the global limits for   • – The different types of risk (operational, technological,
      the main risk exposures, reviewing them systematically and                financial, legal and reputational, among others) facing the
      resolving those operations that exceed the powers delegated in            Group.
      bodies lower down the hierarchy.
                                                                            • – The information and internal control systems used to
      The committee is of an executive nature and takes decisions in            control and manage these risks.
      the sphere of the powers delegated in it by the board. It is          • – Set the level of risk considered acceptable.
      chaired by the third vice-chairman of Grupo Santander and four
      other board members are also members of the committee.                • – The measures envisaged to mitigate the impact of identified
                                                                                risks, in the event that they materialise.
      The committee met 99 times during 2011, underscoring the
                                                                            • Systematically review exposures with the main customers,
      importance that Grupo Santander attaches to appropriate
                                                                              economic sectors, geographic areas and types of risk.
      management of its risks.
                                                                            • Authorise the management tools and risk models and be
                                                                              familiar with the results of the internal validation.
                                                                            • Ensure that the Group’s actions are consistent with the
                                                                              previously decided risk appetite level.
                                                                            • Know, assess and monitor the observations and
                                                                              recommendations periodically formulated by the supervisory
                                                                              authorities in the exercise of their function.
                                                                            • Resolve operations beyond the powers delegated to bodies
                                                                              lower down the hierarchy, as well as the global limits of pre-
                                                                              classification of economic groups or in relation to exposures
                                                                              by classes of risk.


      152                                                                                                              ANNUAL REPORT 2011
Informe_Gestion Riesgos 2011_ENG_V17:esp 28/02/12 11:17 Página 153


             The board’s risk committee delegates some of its powers in risk        • – These functions have a global action sphere, i.e. they
             committees which are structured by geographic area, business               intervene in all the units where the risk division acts and
             and types of risk, all of them defined in the corporate                    there is a reflection of the same structure in the local units.
             governance risk model.                                                     The main elements through which the global functions are
                                                                                        replicated in each of the units are corporate frameworks.
             In addition, both the executive committee and the Bank’s board             These are central elements to communicate and transfer
             pay particular attention to management of the Group’s risks.               global practices, reflect the criteria and policies for each of
                                                                                        the areas and set the Group’s compliance standards to be
             The Group’s third vice-president is the maximum executive in
                                                                                        applied in all local units.
             risk management. He is a member of the board and chairman of
             the risk committee. Two directorates-general of risks, which are       • – Generally speaking it is possible to distinguish the main
             independent of the business areas, both from the hierarchical              functions developed respectively by the GDR’s global areas
             and functional standpoint, report to the third vice-president.             and by the units:
             The organisational and functional framework is as follows:
                                                                                    • – – The general directorate of risks establishes risk policies and
             • The general directorate of risk (GDR) is responsible for the               criteria, the global limits and the decision-making and
               executive functions of credit and financial risk management                control processes; it generates management frameworks,
               and is adapted to the business structure, both by customer                 systems and tools; and adapts the best practices, both the
               type as well as by activity and country (global/local vision). The         banking industry's as well as those of the different local
               GDR is structured around two fundamental functions, which                  units, for their implementation in the Group.
               are replicated locally and globally.
                                                                                    • – – The local units apply the policies and systems to the local
             • The GDR is configured in two blocks:                                       market: they adapt the organisation and the management
                                                                                          frameworks to the corporate frameworks; they contribute
             • – A corporate structure, with global scope responsibilities
                                                                                          critical and best practices and lead the local sphere
                 (“all risk, all countries”), entrusted with establishing the
                                                                                          projects.
                 policies, methodologies and control. In this block, also
                 denominated “intelligence”, and Global Control, are the            • General directorate of integral control and internal
                 areas/functions of solvency risks, market risk and                   validation of risks, with global reach responsibilities and of
                 methodology.                                                         corporate nature and support for the Group’s governance
                                                                                      bodies, which are:
             • – A structure of businesses, focused on executing and
                 integrating management of the risk functions in the Group’s        • – Internal validation of credit, market and economic capital
                 local and global commercial businesses. In this block, also            risk models in order to assess their suitability for
                 denominated execution and integration in management,                   management and regulatory purposes. Validation involves
                 the following areas/functions are grouped: management of               reviewing the model’s theoretical foundations, the quality of
                 standardised risks, management of segmented company                    the data used to build and calibrate it, the use to which it is
                 risks, global recoveries, management of wholesale banking              put and the process of governance associated.
                 risk, management of Santander Consumer Finance risks and
                                                                                    • – Integral control of risks, whose mission is to supervise the
                 management of global business risks.
                                                                                        quality of the Group’s risk management, guaranteeing that
             • – Complementing the three corporate structure areas and the              the management and control systems of the various risks
                 six business areas is a seventh area of global and systemic            inherent in its activity comply with the most demanding
                 governance, which supports and advises the GDR, and is                 criteria and best practices observed in the banking industry
                 responsible for implementing the organisational model,                 and/or are required by regulators, and verifying that the
                 overseeing effective execution of internal control and the             profile of effective risk assumed is adjusted to what senior
                 systems model.                                                         management has established.


                  ANNUAL REPORT 2011                                                                                                                 153
Informe_Gestion Riesgos 2011_ENG_V17:esp 28/02/12 11:17 Página 154


      2. Integral control of risk


      Grupo Santander launched in 2008 the function of integral             Internal control of risk supports the work of the risk committee,
      control of risks, anticipating the new regulatory requirements,       providing it with the best practices in risk management.
      then being discussed in the main organisations and forums
      — Basel Committee, CEBS, FSF, etc,— as well as the                    The main features of this function are:
      recommendations on best risk management practices                     • Global and corporate scope: all risks, all businesses, all
      formulated by various public and private bodies.                        countries;
      Organisation, mission and features                                    • It is configured as a third layer of control, following the one
      of the function                                                         by the person responsible for managing and controlling each
      The organisation of this function is part of the directorate            risk in the sphere of each business or functional unit (first
      general of integral control and internal validation of risk. This       layer of control) and the corporate control of each risk
      function supports the Group’s governance bodies in risk                 (second layer). This ensures the vision and thus integral
      management and control.                                                 control of all risks incurred during the year in Santander’s
                                                                              activity.
      Particular attention is paid to credit risk (including the risks of
                                                                            • Special attention is paid to the development of best practices
      concentration and counterparty); market risk (including liquidity
                                                                              in the sphere of the financial industry, in order to be able to
      risk as well as structural risks of interest rates and exchange
                                                                              incorporate within Santander and at once any advances
      rates); operational and technology risks and risk of compliance
                                                                              deemed opportune.
      and reputational risk.
                                                                            • Both the information available as well as the resources that
      Integral control of risks is based on three complementary               Grupo Santander assigns to controlling the various risks are
      activities:                                                             optimised, avoiding overlapping.
      1) Ensure that the management and control systems of the
         various risks inherent in Grupo Santander’s activity meet the
         most demanding criteria and the best practices observed in
         the industry and/or required by regulators.
      2) Ensure that senior management has at its disposal an integral
         vision of the profile of the various risks assumed and that
         these risks are in line with the previously agreed appetite for
         risks; and
      3) Supervise appropriate compliance in time and form with the
         recommendations drawn up for risk management matters
         following inspections by internal auditing and by the
         supervisors to whom Santander is subject.


      154                                                                                                                ANNUAL REPORT 2011
Informe_Gestion Riesgos 2011_ENG_V17:esp 28/02/12 11:17 Página 155


             Methodology and tools                                                  Module 3
             This function is backed by an internally developed methodology         In order to monitor proactively the recommendations made by
             and a series of tools that support it, in order to systemise the       internal auditing and by the supervisors regarding risk control
             exercise of it and adjust it to Santander’s specific needs. This       and management, there is the SEGRE. This also enables the
             enables application of the methodology to be formalised and            recommendations arising from integral control to be registered.
             traceable. The methodology and the tools of the three activities
             are articulated through the following modules:                         The Bank of Spain can access these tools if it so wishes and thus
                                                                                    also the work papers used to develop the function of integral
             Module 1                                                               control of risks.
             A guide of tests or reviews exists for each risk, divided in spheres
             of control (for example, corporate governance, organisational          During 2011
             structure, management systems, integration in management,              (a) The third cycle of reviewing the various risks was completed
             technology environment, contingency plans and business                     in close contact with the corporate areas of control,
             continuity, etc).                                                          contrasting and assessing the control and management
                                                                                        systems of these risks. Improvements were identified and
             Applying the tests and obtaining the relevant evidence, which is           made into recommendations —with their corresponding
             assessed and enables the parameters of control of the various              schedule for implementation agreed with the risk areas—,
             risks to be homogenised, is done every 12 months. New tests                along with half yearly monitoring of the progress achieved in
             are incorporated where needed. The tests were fully reviewed               the recommendations made in 2010.
             during 2011, using as a reference the most recent best practices
             observed in the banking industry and/or required by the                (b) The board and the executive committee were regularly
             regulators, and also taking into account the experience garnered           informed and given an integral vision of all risks, and the risk
             in previous years in this sphere.                                          committee and the audit and compliance committee were
                                                                                        also informed of the function.
             The support tool is the risk control monitor (RCM), which is a
                                                                                    (c) Work continued on extending the integral control of risks
             repository of the results of each test and its work papers. A
                                                                                        model to the Group’s main units, also coordinating the
             review of the situation of each risk is also conducted every six
                                                                                        initiatives in this sphere in the various countries; and
             months, with monitoring of the recommendations that emanate
             from the annual report of integral control.                            (d) There was also participation, in coordination with the public
                                                                                        policy and other areas, in representing the Group in forums
             Module 2                                                                   such as the Financial Stability Board (FSB) and Eurofi in
             Senior management is able to monitor the integral vision of the            matters such as transparency in information on risks.
             various risks assumed and their adjustment to the previously
             formulated risk appetites.                                                                           ***
                                                                                    We will now look at the Group’s main risks: credit, market,
                                                                                    operational and reputational.


                  ANNUAL REPORT 2011                                                                                                                  155
Informe_Gestion Riesgos 2011_ENG_V17:esp 28/02/12 11:17 Página 156


      3. Credit Risk


      3.1 Introduction to the treatment                                    • Those under individualised management are assigned, mainly
                                                                             because of the risk assumed, a risk analyst. This category
      of credit risk                                                         includes the companies of wholesale banking, financial
                                                                             institutions and some of the companies of retail banking. Risk
      Credit risk is the possibility of losses stemming from the failure     management is conducted through expert analysis backed up
      of clients or counterparties to meet their financial obligations       by tools to support decision-making based on internal models
      with the Group.                                                        of risk assessment.
                                                                           • Standardised: a customer who has not been specifically
      The Group’s risks function is organised on the basis of the type       assigned a risk analyst. This category generally includes
      of customer in order to distinguish during the risk management         individuals, individual businessmen and retail banking
      process companies under individualised management from                 companies that are not segmented. Management of these
      standardised customers.                                                risks is based on internal models of assessment and automatic
                                                                             decisions, complemented where the model does not go far
                                                                             enough or is not sufficiently precise by teams of analysts
                                                                             specialised in this type of risk.


      156                                                                                                            ANNUAL REPORT 2011
Informe_Gestion Riesgos 2011_ENG_V17:esp 28/02/12 11:17 Página 157


             3.2 Main magnitudes                                                                                            Excluding the exchange rate impact during 2011 of the main
                                                                                                                            currencies against the euro, and the change in the
             and evolution                                                                                                  aforementioned consolidation method, the increase in the
                                                                                                                            exposure would be 2.8%.
             The Group’s credit risk profile is characterised by diversified
             geographic distribution and predominantly retail banking                                                       Spain was still the main unit as regards exposure to credit risk,
             activity.                                                                                                      although 1.4% less than at the end of 2010. Of note in the rest
                                                                                                                            of Europe, which accounts for more than one-third of the credit
             A. Global map of credit risk, 2011                                                                             exposure, is the presence in the UK. Overall, Europe, including
             The table below sets out the global credit risk exposure in                                                    Spain, accounted for 71% of the total exposure.
             nominal amounts (except for derivatives and repos exposure
                                                                                                                            In Latin America, which accounted for 22% of the exposure,
             which is expressed in equivalent credit) at December 31, 2011.
                                                                                                                            97% of the exposure to credit risk is classified as investment-
             The year 2011 was characterised by small growth of 0.8% in the                                                 grade.
             credit risk exposure due, on the one hand, to a change in the
                                                                                                                            The US accounted for 6.1% of the Group’s total credit exposure
             method for consolidating a Group companies in the US, which
                                                                                                                            at the end of 2011.
             mainly reflects a drop in the effective credit amount by customer
             and, on the other, the combination of two factors: reduction in
             disbursements by customer (-0.2%), as a result of the lower
             volume of committed lines in an economic environment of
             weaker demand for loans in the main units; and growth in the
             effective amount with credit institutions (13.6%).


              Grupo Santander - Gross exposure to credit risk classified in accordance with legal company criteria
              Million euros. Data at December 31, 2011.


                                                                                            Sovereign fixed                 Private fixed      Outstanding     Commitments     Derivatives
                                             Outstanding          Commitments                       income                       income           to credit        to credit   and Repos
                                            to customers           to customers             (excluding trading)        (excluding trading)          entities        entities        (REC)         Total
             Spain                               252,165                   55,526                    32,318                        8,040           33,092             3,465      36,535       421,142
             Parent bank                          151,644                   42,075                     21,025                       5,356           25,094            3,236       30,232       278,663
             Banesto                                73,184                    7,674                     7,223                       1,129            6,178              218        5,658       101,264
             Others                                 27,337                    5,777                     4,070                       1,555            1,820               10          646        41,215
             Rest of Europe                      341,350                   50,232                      6,292                       4,664           33,374                 0      11,840       447,754
             Germany                                30,413                       536                           0                          93         2,492                0             8       33,541
             Portugal                               25,858                    6,036                     3,734                       1,744            1,698                0        2,171        41,241
             UK                                   248,425                   39,500                             0                    2,679           27,757                0        8,961       327,321
             Others                                 36,655                    4,161                     2,558                         148            1,428                0          700        45,651
             Latin America                       148,579                   56,992                    20,079                        5,879           30,849                 0        9,919      272,297
             Brazil                                 88,398                  40,804                    13,194                        4,857           23,760                0        5,305       176,317
             Chile                                  27,888                    7,103                     1,948                         527            3,527                0        2,414        43,406
             Mexico                                 18,101                    7,501                     3,376                         324            1,600                0        1,874        32,777
             Others                                 14,192                    1,584                     1,562                         171            1,961                0          327        19,797
             United States                        43,107                   15,271                      1,437                     10,577              2,766                0          559       73,717
             Rest of world                              774                       72                           2                           1           115                0             0         964
             Total group                        785,975                  178,094                     60,129                      29,160           100,196             3,465      58,854      1,215,874
             % of total                            64.6%                    14.6%                       4.9%                       2.4%              8.2%             0.3%         4.8%        100.0%
             % change. s/Dec. 10                    -0.2%                   -0.2%                      -0.2%                      -1.3%             13.6%          132.4%         -2.8%          0.8%

             ECR (equivalent credit risk: net value of replacement plus the maximum potential value. Includes mitigants)
             Balances with customers include contingent risks and exclude repos (EUR 8,467 million) and other customer financial
             assets (EUR 20,137 million)
             The total fixed income excludes the portfolio of trading and investments of third party takers of insurance.
             Sovereign fixed income refers to securities issued by public administrations in general, including the state, regional and
             local administrations and institutions that operate with the guarantee of the state.
             Balances with credit entities and central banks include contingent risks and exclude repos, the trading portfolio and other
             financial assets. Of the total, EUR 81,611 million are deposits in central banks.


                      ANNUAL REPORT 2011                                                                                                                                                           157
Informe_Gestion Riesgos 2011_ENG_V17:esp 28/02/12 11:17 Página 158


      B. Evolution of the magnitudes in 2011                                                                countries most affected by the crisis (Spain and Portugal) and, to
      The evolution of non-performing loans reflect the impact of the                                       a lesser extent, in those with a better situation in the economic
      deterioration of the economic environment, while the reduction                                        cycle, such as the UK. In the whole of Latin America, the rise in
      in the cost of credit during 2011 underscores the prudent and                                         the NPL ratio went hand in hand with the growth in lending
      anticipative management of risk, enabling Santander, in                                               while maintaining a stable cost of credit. NPL coverage was
      general, to maintain both figures lower than those of its                                             61.4% compared to 72.7% at the end of 2010.
      competitors. As a result, the Group maintains a significant level
      of coverage and available generic provisions.                                                         Specific provisions for loan losses, net of bad debt recoveries,
                                                                                                            amounted to EUR 11,137 million, 1.41% of the average credit
      The NPL ratio was 3.89% at the end of 2011 (+34 b.p). Growth                                          exposure with customers (the year’s average lending plus
      in this ratio slowed down in the last few quarters. NPLs declined                                     financial guarantees), down from 1.56% in 2010.
      in Santander Consumer Finance and Sovereign and rose in the


       Grupo Santander - Risk, NPLs, coverage, provisions and cost of credit
       Million euros


                                                  Credit risk with                                                                      Spec. prov net of              Credit cost
                                                   customers(*)                         NPL ratio                 Coverage           recovered write-offs (**)          of risk(3)
                                                    (million euros)                          %                          %                  (million euros)                    %

                                                   2011             2010            2011             2010       2011         2010       2011             2010       2011(2)       2010 (1)

      Continental Europe                     364,622          370,673               5.20             4.34        55.5         71.4     4,569            6,190         1.10           1.62
      Santander Branch Network 118,060                          126,705             8.47             5.52        39.9         51.8     1,735             2,454        1.42           1.89
      Banesto                                   78,860           86,213             5.01             4.11        53.1         54.4       778             1,272        0.96           1.52
      Santander Consumer Finance 63,093                          67,820             3.77             4.95       113.0        128.4     1,503             1,884        1.43           2.85
      Portugal                                  30,607           32,265             4.06             2.90        54.9         60.0       283                 105      0.90           0.30
      United Kingdom                         255,735          244,707               1.86             1.76        38.1         45.8       779                 826      0.32           0.34
      Latin America                          159,445          149,333               4.32             4.11        97.0        103.6     5,379            4,758         3.57           3.53
      Brazil                                    91,035           84,440             5.38             4.91        95.2        100.5     4,554             3,703        5.28           4.93
      Mexico                                    19,446           16,432             1.82             1.84       175.7        214.9       293                 469      1.63           3.12
      Chile                                     28,462           28,858             3.85             3.74        73.4         88.7       395                 390      1.40           1.57
      Puerto Rico                                 4,559            4,360            8.64            10.59        51.4         57.5        95                 143      2.25           3.22
      Colombia                                    2,568            2,275            1.01             1.56       299.1        199.6        14                  15      0.59           0.68
      Argentina                                   4,957            4,097            1.15             1.69       206.9        149.1        29                  26      0.67           0.72
      Sovereign                                43,052           40,604              2.85             4.61        96.2         75.4       416                 479      1.04           1.16
      Total Group                            822,657          804,036               3.89             3.55        61.4         72.7   11,137           12,342          1.41           1.56


      Memo item
      Spain                                  271,180          283,424               5.49             4.24        45.5         57.9     2,821            4,352         1.04           1.53

       (*) Includes gross loans to customers, guarantees and documentary credits (ECR EUR 8,339 million)
      (**) Bad debts recovered.


      (1) Excludes the incorporation of AIG in Santander Consumer Finance Poland.
      (2) Excludes the incorporation of Bank Zachodni WBK.
      (3) (Specific provisions-bad debts recovered)/Total average credit risk.


      158                                                                                                                                                     ANNUAL REPORT 2011
Informe_Gestion Riesgos 2011_ENG_V17:esp 28/02/12 11:18 Página 159


             C. Distribution of credit risk
             The charts below show the diversification of Santander’s loans
             by countries and customer segments. The Group is
             geographically diversified and focused on its main markets.
             Grupo Santander’s profile is essentially retail (85.6% retail
             banking), and most portfolios are products with a real guarantee
             (e.g. mortgages).


             Customer loans (gross)                                               Distribution of credit risk by type of risk
             % of operating areas                                                 %

             BY GEOGRAPHIC AREA                                                        BY SEGMENT

                                                Spain 29%


                         Sovereign 5%                                                             Others
                                                                   Portugal 4%                       1%
                             Rest of                                                                                                 Individuals 57%
                  Latin America 2%                                   Germany 4%           Public sector
                                                                     Commercial                    3%
                         Chile 3%                                    Poland 1%
                       Mexico 3%                                     Rest of
                                                                     Europe 4%        Global wholesale
                                                                                                14%
                         Brazil 11%


                                                            UK 34%
                                                                                                                  Companies and SMEs 25%


             The distribution by geographic area and product of lending in
             the segment of standardised risks is set out below.


              Standardised risks
              %


             BY GEOGRAPHIC AREA                                                        BY PRODUCT
                                                             UK 44%                                                             Mortgages 65%

                         Poland 1%

                        Santander                                                  SMEs and others 9%
                        Consumer
                     Finance 16%                                                            Cards 3%


                     United States 3%                             Spain 16%
                                                                                               Consumer 23%
                            Latin America 16%       Portugal 4%


                    ANNUAL REPORT 2011                                                                                                           159
Informe_Gestion Riesgos 2011_ENG_V17:esp 28/02/12 11:18 Página 160


      3.3 Metrics and measurement                                                  B. Paramenters of credit risk
                                                                                   The assessment of a customer or operation, through ratings or
      toools                                                                       scorings, constitutes a judgement of the credit quality, which is
                                                                                   quantified via probability of default (PD in the terminology of
      A. Rating tools                                                              Basel).
      The Group has been using since 1993 its own models for
      assigning solvency and internal ratings (known as internal                   As well as the probability of default, quantifying credit risk
      ratings or scoring), which measure the degree of risk of a client            requires other parameters to be estimated such as exposure at
      or transaction. Each rating or scoring corresponds to a certain              default (EaD) and the percentage of EaD that might not be
      probability of default or non-payment, determined on the basis               recovered (loss given default or LGD). Other aspects are also
      of the entity’s past experience, except for some termed low                  included such as quantifying off-balance sheet exposures, which
      default portfolios, where the probability is assigned using                  depend on the type of product, or analysis of expected
      external sources. More than 200 internal rating models used in               recoveries, related to the guarantees existing and other features
      the admission process and risk monitoring existed in the Group.              of the operation: type of product, maturity, etc.

      Global rating tools are used for the segments of sovereign risk,             These factors comprise the main credit risk parameters. Their
      financial institutions and global wholesale banking. Their                   combination enables the probable or expected loss (EL) to be
      management is centralised in the Group, both for determining                 calculated. This loss is considered as one more cost of the
      their rating as well monitoring the risk. These tools assign a               activity as it reflects the risk premium and should be
      rating for each customer resulting from a quantitative or                    incorporated into the price of operations.
      automatic module, based on balance sheet ratios or                           The following charts show the distribution of failed consumer
      macroeconomic variables, and supplemented by the expert view                 loans and mortgages since 2001 on the basis of the percentage
      of an analyst.                                                               recovered after discounting all the costs —including the
      In the case of companies and institutions under individualised               financial —of the recovery process.
      management, the parent company of Grupo Santander has
      defined a single methodology for formulating a rating in each                       Spain-parent bank. Mortgages
                                                                                          Distribution of operations by the percentage recovered
      country. The rating is determined by an automatic model which
      reflects a first intervention by the analyst and which can or not                   70%
      be later complemented. The automatic model determines the
      rating in two phases, one quantitative and the other qualitative                    60%
      based on a corrective questionnaire which enables the analyst to
                                                                                          50%
      modify the automatic scoring by a maximum of ±2 points of
                                                                          % operations


      rating. The quantitative rating is determined by analysing the                      40%
      credit performance of a sample of customers and the correlation
      with their financial statements. The corrective questionnaire has                   30%
      24 questions divided into six areas of assessment. The automatic                    20%
      rating (quantitative +corrective questionnaire) can be changed
      by an analyst by writing over it or by using a manual assessment                    10%
      model.
                                                                                           0%
                                                                                                          >10%&


                                                                                                                  >20%&


                                                                                                                          >30%&


                                                                                                                                   >40%&


                                                                                                                                           >50%&


                                                                                                                                                   >60%&


                                                                                                                                                           >70%&


                                                                                                                                                                   >80%&
                                                                                                  <=10%


                                                                                                          <=20%


                                                                                                                  <=30%


                                                                                                                          <=40%


                                                                                                                                   <=50%


                                                                                                                                           <=60%


                                                                                                                                                   <=70%


                                                                                                                                                           <=80%


                                                                                                                                                                   <=90%
      The ratings accorded to customers are regularly reviewed,


                                                                                                                                                                           >90%
      incorporating new financial information available and the
      experience in the development of the banking relation. The                                                                  % recovered
      regularity of the reviews increases in the case of clients who
      reach certain levels in the automatic warning systems and in
      those classified as special watch. The rating tools are also                        Spain- parent bank. Consumer-retail.
      reviewed so that their accuracy can be fine-tuned.                                  Distribution of operations by the percentage recovered

      In the case of standardised risks, both for companies as well as                     60%
      individuals, there are scoring tools which automatically assess
                                                                                           50%
      the operations.
                                                                           % operations


                                                                                           40%
      These admission systems are complemented by performance
      assessment models which enable the risk assumed to be better                         30%
      predicted. They are used for both preventative activities as well
                                                                                           20%
      as sales and assigning limits
                                                                                           10%

                                                                                            0%
                                                                                                          >10%&


                                                                                                                  >20%&


                                                                                                                          >30%&


                                                                                                                                   >40%&


                                                                                                                                           >50%&


                                                                                                                                                   >60%&


                                                                                                                                                           >70%&


                                                                                                                                                                   >80%&
                                                                                                  <=10%


                                                                                                          <=20%


                                                                                                                  <=30%


                                                                                                                          <=40%


                                                                                                                                   <=50%


                                                                                                                                           <=60%


                                                                                                                                                   <=70%


                                                                                                                                                           <=80%


                                                                                                                                                                   <=90%

                                                                                                                                                                           >90%


                                                                                                                                  % recovered


      160                                                                                                                                          ANNUAL REPORT 2011
Informe_Gestion Riesgos 2011_ENG_V17:esp 28/02/12 11:18 Página 161


             The risk parameters also calculate the regulatory capital in           C. Master scale of global ratings
             accordance with the rules derived from Circular 3/2008 of the          The following tables are used to calculate regulatory capital.
             Bank of Spain on determining and control of minimum equity             They assign a PD on the basis of the internal rating, with a
             and subsequent changes. The regulatory capital is the difference       minimum value of 0.03%.
             between the unexpected and the expected loss.
                                                                                     Probability of default
             The unexpected loss is the basis for calculating the capital and
             makes reference to a very high level of loss, but not very
             probable, not considered recurrent and which must be met with          Wholesale Banking                                         Banks
             equity.
                                                                                    Internal                                                   Internal
             In portfolios where the internal experience of defaults is scant,      rating                              PD                     rating                            PD
             such as banks, sovereigns or global wholesale banking,                 8.5 to 9.3                        0.030%                  8.5 to 9.3                      0.030%
             estimates of the parameters come from alternative sources:             8.0 to 8.5                        0.033%                  8.0 to 8.5                      0.039%
             market prices or studies by external agencies which draw on the        7.5 to 8.0                        0.056%                  7.5 to 8.0                      0.066%
             shared experience of a sufficient number of institutions. These        7.0 to 7.5                        0.095%                  7.0 to 7.5                      0.111%
             portfolios are called low default portfolios.                          6.5 to 7.0                        0.161%                  6.5 to 7.0                      0.186%
                                                                                    6.0 to 6.5                        0,271%                  6.0 to 6.5                      0.311%
             For the rest of portfolios, estimates are based on the institution’s
             internal experience. The PD is calculated by observing NPL             5.5 to 6.0                        0.458%                  5.5 to 6.0                      0.521%
             entries and putting them in relation to the final rating assigned      5.0 to 5.5                        1.104%                  5.0 to 5.5                      0.874%
             to the customer or with the scoring assigned to the operations.        4.5 to 5.0                        2.126%                  4.5 to 5.0                      1.465%
                                                                                    4.0 to 4.5                        3.407%                  4.0 to 4.5                      2.456%
             The LGD calculation is based on observing the recovery process         3.5 to 4.0                        5.462%                  3.5 to 4.0                      4.117%
             of operations not fulfilled, taking into account not only the
                                                                                    3.0 to 3.5                        8.757%                  3.0 to 3.5                      6.901%
             revenues and costs associated with this process, but also the
                                                                                    2.5 to 3.0                       14.038%                  2.5 to 3.0                     11.569%
             moment when they are produced and the indirect costs incurred
             in recovery activity.                                                  2.0 to 2.5                       22.504%                  2.0 to 2.5                     19.393%
                                                                                    1.5 to 2.0                       36.077%                  1.5 to 2.0                     32.509%
             The estimation of the EaD comes from comparing the use of the          < 1.5                            57.834%                  < 1.5                          54.496%
             lines committed at the moment of default and a normal
             situation.
                                                                                    These PDs are applied uniformly throughout the group in
             The parameters estimated for global portfolios are the same for        accordance with the global management of these portfolios. As
             all the Group’s units. A financial institution with a rating of 8.5    can be seen, the PD assigned to the internal rating is not exactly
             will have the same PD regardless of the unit in which its              equal for a same rating in both portfolios, although it is very similar
             exposure is recorded. On the other hand, retail portfolios have        in the tranches where most of the exposure is concentrated (i.e. in
             specific scoring systems in each unit of the group. This requires      tranches of rating of more than six).
             separate estimates and specific assignment in each case.
                                                                                    D. Distribution of EaD and expected loss
             The parameters are then assigned to the operations present in          (EL) associated
             the balance sheet of units in order to calculate the expected          The table below sets out the distribution by segments of the
             losses and the capital requirements associated with their              outstanding credit exposure to customers in terms of EaD. PD,
             exposure.                                                              LGD and EL. Approximately 78% of total risk with clients
                                                                                    (excluding sovereign, counterparty risks and other assets)
                                                                                    corresponds to companies, SMEs and loans to individuals,
                                                                                    underlining the retail focus of business and of Santander’s risks.
                                                                                    The expected loss from customer exposure is 1.30% (1.05% for
                                                                                    the Group’s total credit exposure), which can be considered as a
                                                                                    medium-to-low risk profile.

                                                                                     Segmentation of credit risk exposure
                                                                                     Million euros %
                                                                                                                                                           PD.    LGD
                                                                                                                             EaD(1)             %      Average Average                 EL
                                                                                    Sovereign debt                      159,775           15.2%         0.14%            13.9%   0.02%
                                                                                    Counterparty                         51,574            4.9%         0.27%            59.6%   0.16%
                                                                                    Public sector                        14,654            1.4%         1.44%            14.8%   0.21%
                                                                                    Corporate                           155,702           14.8%         0.94%            39.9%   0.37%
                                                                                    SMEs                                163,005           15.5%         5.44%            30.5%   1.66%
                                                                                    Mortgages (individuals)             330,435           31.5%         3.10%             8.9%   0.28%
                                                                                    Consumer loans                      124,913           11.9%         7.94%            55.1%   4.38%
                                                                                    Credit cards of individuals          32,374            3.1%         4.74%            64.8%   3.07%
                                                                                    Other assets                         17,465            1.7%         3.73%            27.5%   1.02%
                                                                                    Memorandom item                     821,083           78.2%         3.93%            33.1%   1.30%
                                                                                    customers(2)
                                                                                    Total                           1,049,897             100%         3.17%             33.0% 1.05%

                                                                                    Data at December 2011.
                                                                                    (1) Excluding doubtful loans.
                                                                                    (2) Excluding sovereign debt, banks and other financial entities and other assets.


                  ANNUAL REPORT 2011                                                                                                                                                  161
Informe_Gestion Riesgos 2011_ENG_V17:esp 28/02/12 11:18 Página 162


      3.4. Loss observed: measurements of                                                          The three approaches measure the same reality and,
                                                                                                   consequently, converge in the long term although they
      credit cost                                                                                  represent successive moments in credit cost measurement: flows
                                                                                                   of non-performing loans (non-performing loans management
      As well as using these advanced models, other usual measures                                 variation, NPLMV), coverage of doubtful loans (net loan-loss
      are employed which provide prudent and effective management                                  provisions, NLLPs) and becoming write offs (net write-offs),
      of credit risk on the basis of the loss observed.                                            respectively. And this without detriment that in the long term
                                                                                                   and within the same economic cycle, the three show differences
      Grupo Santander’s cost of credit is measured by various means:                               at certain times, particularly significant at the start of a change
      change in net entries (final doubtful loans —initial doubtful                                of cycle. These differences are due to the various moments at
      loans + write offs —recovered write offs), net loan-loss                                     which the losses are calculated, which are basically determined
      provisions (net specific provisions – recovered write-offs) and net                          by accounting rules. In addition, the analysis can be complicated
      write-offs (write offs – recovered write-offs).                                              by changes in the policy of coverage and entry into write offs,
                                                                                                   composition of the portfolio, doubtful loans of entities acquired,
                                                                                                   changes in accounting rules, sale of portfolios, etc.


       Grupo Santander´s total cost of credit
       % of average portfolio

         Average 2002-2011
         Change in net enties: 0.98%
         Net LLPs: 0.82%
         Net write-offs: 0.66%

      2.5%

      2.2%

      1.9%

      1.6%

      1.3%

      1.0%

      0.7%

      0.4%
      0.1%
                DEC. 02              DEC. 03            DEC. 04              DEC. 05     DEC. 06        DEC. 07       DEC. 08       DEC. 09       DEC. 10      DEC. 11

      Note: The data for 2009 reflects the incorporation of A&L and in 2010 Sovereign.
      December 2011 does not include the incorporation of Bank Zachodni WBK.


      162                                                                                                                                     ANNUAL REPORT 2011
Informe_Gestion Riesgos 2011_ENG_V17:esp 28/02/12 11:18 Página 163


             The following charts reflect the cost of Grupo Santander’s credit
             risk in its main areas of activity in 2011 and the comparison with
             prior years, measured in various ways:


              Net write-offs
              Change in doubtful loans plus net write-offs (% of average balances)

                                                                                                                                                                                  6.25
                2007          2008         2009         2010          2011
                                                                                                                                                                                         4.67
                                                                                                                                                                                                3.80
                                                                                                                                                                    2.61 2.85
                            2.35
                                                                                    1.96
                                   1.73 1.80
                    1.62                                        1.67 1.93 1.49
                                                                                                              1.34                   1.17 1.37 1.36 1.41 1.36
             0.70                                                                                                      0.53 0.54
                                                        0.34                                   0.23 0.37

                           Group                                      Spain                                       UK                        Rest of Europe           Latin America (incl. Brazil)


              Net loan-loss provisions
              Net specific provisions less recovered write offs (% of average balances)
                                                                                                                                                                                  4.91
                2007          2008         2009         2010          2011
                                                                                                                                                                                         3.86
                                                                                                                                                                                                3.81
                                                                                                                                                                           3.70


                                                                                                                                                                    2.28
                            1.57 1.56                                         1.51 1.26
                                          1.41                        1.18                                                                            1.18 1.16
                    1.16
                                                               0.73                                                                         0.65 0.95
             0.50                                                                                             0.55 0.44 0.33         0.46
                                                      0.15                                     0.23 0.25

                           Group                                      Spain                                   UK                            Rest of Europe           Latin America (incl. Brazil)

              Net entries
              Write-offs less recovery of write-offs (% of average balances)

                2007          2008         2009         2010          2011                                                                                                        4.56
                                                                                                                                                                                         3.68
                                                                                                                                                                                                3.28

                                                                                                                                                                           2.44
                                                                                                                                                                    1.67
                                          1.32
                            1.17 1.23
                                                                                 0.94                                                                        1.10
                    0.72                                                  0.73                                                                        0.91
             0.43                                                 0.55                               0.52 0.47 0.36                            0.64
                                                    0.16 0.20                              0.20 0.17                               0.43 0.36

                           Group                                  Spain                                      UK                         Rest of Europe               Latin America (incl. Brazil)

             Note: Data drawn up in accordance with legal company criteria. 2011 does not include Bank
             Zachodni WBK, and in the case of net provisions also does not include Santander Consumer USA.
             The figures for 2010 reflect the incorporation of Sovereign.
             2008 excludes A&L and 2009 excludes Sovereign and Venezuela.


             The general trend over the past few years has been to maintain
             the cost of Santander’s credit at low levels. In 2011, the decline
             of 15 b.p. in the cost of credit was due to the still significant
             deterioration of the economic environment and of the mix of
             retail portfolios which, although with a higher expected loss,
             have higher levels of direct and indirect profitability and a more
             predictable nature of risk.


                     ANNUAL REPORT 2011                                                                                                                                                           163
Informe_Gestion Riesgos 2011_ENG_V17:esp 28/02/12 11:18 Página 164


      3.5 Credit risk cycle                                                   B. Risk study and process
                                                                              of credit rating
      Risk management consists of identifying, measuring, analysing,          The study of risk is obviously a prior requirement for authorising
      controlling, negotiating and deciding the risks incurred by the         customer operations by the Group.
      Group’s operations. The process involves risk takers and senior
      management, as well as the risk areas.                                  This study consists of analysing the capacity of the customer to
                                                                              meet their contractual obligations with the bank. This entails
      The process emanates from senior management, via the board              analysing the customer’s credit quality, risk operations, solvency
      of directors and the risk committee; they set the risk policies and     and return in accordance with the risk assumed.
      procedures, the limits and delegating of powers, and approve
      and supervise the framework of the risks function.                      The risk study is carried out every time there is a new customer
                                                                              or operation or with a pre-established regularity, depending on
      The risk cycle has three phases: pre-sale, sale and after sale:         the segment. In addition, the rating is studied and reviewed
                                                                              every time there is an alert or something that affects the
      • Pre-sale: this includes the planning and setting of objectives,       customer/operation.
        determining the appetite for risk, approving new products,
        studying the risk and rating loans, and establishing limits.          C. Decisions on operations
      • Sale: this covers the phase of decision-making both for               The purpose of the decision-making process is to analyse and
        operations under pre-classification as well as one-off                resolve operations, taking into consideration both the risk
        transactions.                                                         appetite as well as those elements of the operation that are
                                                                              relevant in the search for the balance between risk and return.
      • After sale: monitoring, measurement, control and recovery
        management.                                                           The Group has been using RORAC methodology (return on risk
                                                                              adjusted capital) since 1993 to analyse and set prices for
      A. Planning and setting limits                                          operations and businesses.
      Setting limits is a dynamic process which identifies the Group’s
      risk appetite by discussing business proposals and the opinion of       D. Monitoring
      risks.                                                                  As well as the tasks carried out by the internal auditing division,
                                                                              the directorate general of risks, through local and global teams,
      The global plan of limits, the document drawn up on the basis           controls credit quality by monitoring the risks and has the
      of consensus which provides complete management of the                  resources and specific people to do it.
      balance sheet and of the inherent risks, establishes the risk
      appetite in the various factors.                                        The monitoring is based on a continuous process of permanent
                                                                              observation, which enables incidents to be detected in advance
      The limits are based on two structures: customers/segments and          in the evolution of risk, operations, customers, and their
      products.                                                               environment in order to take steps to mitigate them. The
                                                                              monitoring is conducted on the basis of customer
      The most basic level in individualised management is the
                                                                              segmentation.
      customer and when certain features are present —generally of
      relative importance— an individual limit (pre-classification) is set.   The Group has a system called companies in special watch
                                                                              (FEVE) which identifies four levels on the basis of the degree of
      A pre-classification model based on a system for measuring and
                                                                              concern arising from the circumstances observed (extinguish,
      monitoring economic capital is used for large corporate groups.
                                                                              secure, reduce, monitor). The inclusion of a company in FEVE
      A more simplified version is used for those companies who meet
                                                                              does not mean there have been defaults, but rather the
      certain requirements (high knowledge, rating, etc).
                                                                              advisability of adopting a specific policy toward that company
      In the sphere of standardised risk, the planning and setting of         and establishing the person and time frame for it. Clients in
      limits is done through credit management programmes (CMPs),             FEVE are reviewed at least every six months, and every quarter
      a document reached by consensus between the business and                for the most serious cases. A company can end up in special
      risk areas and approved by the risk committee or committees             watch as a result of monitoring, a review conducted by internal
      delegated by it. The CMPs set out the expected results of               auditing, a decision of the person responsible for the company
      business in terms of risk and return, as well as the limits to          or the entry into functioning of the system established for
      which activity is subject and management of the associated              automatic warnings.
      risks.


      164                                                                                                                 ANNUAL REPORT 2011
Informe_Gestion Riesgos 2011_ENG_V17:esp 28/02/12 11:18 Página 165


              Ratings of risk balances according to the FEVE monitoring                                                   Grupo Santander restricts these operations, with rigorous and
              system                                                                                                      selective criteria, to:
              Million euros at December 2011
                                                                                                                          • viable operations, which in origin do not have a very severe
                                              Extinguish          Secure Reduce              Monitor           Total        deterioration;
             Retail banking Spain                   4,760             485 11,250              12,649        29,143
                                                                                                                          • where the customer wishes to pay;
             Banesto                                7,467             151       2,018         11,154        20,790
                                                                                                                          • that improve the bank’s position in terms of expected loss;
             Portugal                                  394            247          987          2,221         3,848
                                                    1,112          N.A.(*)      N.A.(*)           417         1,529
                                                                                                                          • and where restructuring does not discourage additional
             Poland
                                                                                                                            efforts by the customer.
             United Kingdom                            235              60         844          1,923         3,062
             Sovereign                              1,678               46      1,167           2,002         4,894       In standardised customers, the general principles stated below
                                                                                                                          are applied rigorously, tending to exceptional circumstances
             Latin America                          1,339             437       1,876           7,248       10,901
                                                                                                                          when necessary. In the case of segmented customers, these
             Total                               16,984           1,426 18,142               37,614         74,166        principles can be used as an element of reference, but
                                                                                                                          particularly important is individualised analysis of each case.
             Note: 2011 shows the application of the FEVE tool in Poland. The classification of risk in FEVE is
             independent in each institution and responds to the various criteria for classification of these risks and
             management of them on the basis of the category in which they are classified.
                                                                                                                          • The customer’s overall risk is assessed.
             (*) Not applicable.                                                                                          • The risk with the customer does not increase.
             Ratings are reviewed at least every year, but if weaknesses are                                              • All the refinancing alternatives are assessed and their impact,
             detected, or on the basis of the rating, it is done more regularly.                                            ensuring that their results would be better than those likely
                                                                                                                            to be obtained if this process was not carried out.
             As regards the risks of standardised clients, the main indicators
             are monitored in order to detect shifts in the performance of the                                            • Particular attention is paid to guarantees and the possible
             loan portfolio with respect to the forecasts made in the credit                                                future evolution of their value.
             management programmes.                                                                                       • Their use is restricted, rewarding the restructuring of risks
                                                                                                                            with additional efforts by customers and avoiding actions that
             Payment restructurings and agreements
                                                                                                                            only postpone the problem.
             The restructuring of debts is part of the continuous
             management of risks with customers although it is during                                                     • Monitoring of these operations is carried out in a special way,
             periods of economic downturn when this practice assumes                                                        and maintained until the total extinction of the debt.
             greater importance. It arises when the customer is not in a
                                                                                                                          • For segmented customers, a very detailed analysis is carried
             condition to comply with the payment obligations contracted
                                                                                                                            out, case by case, where the expert opinion enables
             with the bank and so the possibility of adjusting the debt to the
                                                                                                                            adjustment of the most appropriate conditions.
             customer’s new payment capacity and/or improve the
             guarantees is contemplated.                                                                                  As well as close monitoring of these portfolios by the Group’s
                                                                                                                          risk management teams, both the various supervisory authorities
             The use of debt restructuring by Grupo Santander’s banks
                                                                                                                          to which Grupo Santander is subject and the internal audit of
             makes it necessary to establish common practices, which enable
                                                                                                                          the Group pay particular attention to control and appropriate
             these risks to be overseen. With this in mind, the corporate
                                                                                                                          assessment of the restructured portfolios.
             policy for restructuring the debts of customers was created,
             approved by the risk committee, which incorporates a series of                                               Depending on the management situation in which operations
             definitions, general principles and policies that must be applied                                            under restructuring find themselves in, we distinguish two types
             by all the Group.                                                                                            of operation:
             Within the activity of continuous monitoring, the risk                                                       • Those for customers under normal classification (without non-
             departments and the business area of recoveries, in coordination                                               performing loans) who, due to a change in their economic
             with the business areas, carry out centralised actions to identify                                             situation, could suffer an eventual deterioration in their
             those customers who might need to restructure their debts. The                                                 payment capacity. This contingency can be resolved by
             payment capacity is the central factor of analysis, given that the                                             adapting the debt conditions to the customer’s new capacity,
             purpose of restructuring is that the customer continue to pay                                                  thereby facilitating compliance with the payment obligation.
             back their loans. The factors taken into consideration are                                                     These operations are not the subject of concern, but a one-off
             indicative of the changes in the economic situation and, thus,                                                 circumstance to tackle within the normal customer
             signify a deterioration in the customer’s payment capacity.                                                    relationship. Moreover, as there was no need to anticipate
                                                                                                                            possible losses, it is not necessary to make loan-loss provisions
             The risk departments, in coordination with the business area of                                                to cover these operations. Once the conditions have changed,
             recoveries, are entrusted with approving the restructuring                                                     there is a certainty that the customer will comply with the
             operation, modifying the terms of the loan and improving                                                       payment periods with no problems and continuously.
             guarantees, if possible, as well as analysing the risks assumed.
                                                                                                                          • Loans classified as non-performing, due to delays in payment
                                                                                                                            or other situations, are known as refinancing.


                      ANNUAL REPORT 2011                                                                                                                                                   165
Informe_Gestion Riesgos 2011_ENG_V17:esp 28/02/12 13:58 Página 166


      Refinancings do not signify release of provisions. The                 Payment agreements
      classification of the risk as non-performing is maintained unless:     These criteria are mainly aimed at situations of low impact on
                                                                             the customer’s payment capacity. For situations of serious
      • The criteria envisaged in the regulations based on Bank of
                                                                             deterioration, the restructuring of the loan is not considered an
        Spain circulars (payment of ordinary interest pending and, in
                                                                             option and agreements are sought with the customer to recover
        any case, contribution of new effective guarantees or a
                                                                             all or part of the loan, minimising the losses and assuming
        reasonable certainty of payment capacity) are met;
                                                                             sometimes, one or several of the following circumstances:
      • The cautions under a criterion of prudence in the Group’s
                                                                             • There is not a reasonable certainty of payment; delays of 180
        corporate policy (sustained payment during a period of
                                                                               days or debts classified as bad.
        between 3 and 12 months, on the basis of the features of the
        operation and the type of guarantees existing) are met.              • Contractual conditions were agreed that do not meet the
                                                                               general principles set out in the corporate policy of
      As for loan-loss provisions, the restructuring must not carry            restructuring mentioned in the previous section: condonation
      weight in assigning provisions for a particular operation. The           of the principle and/of interest payments, a quota that does
      fact that the entry into irregularity of a restructured operation is     not cover the ordinary interest or there is an increase in the
      considered substandard entails an increase in provisions for the         risk.
      Group. In restructured operations that return to being non-
      performing, the applicable coverage percentage will be                 The logic of normalisation of these operations is based on using
      calculated on the basis of the date when the operation first           as a rule the experience with the customer, setting a graduation
      became non-performing.                                                 in the level of requirement of the observation periods
                                                                             considering both the customer’s initial situation before
      The amount of the portfolio refinanced at the end of 2011 was          renegotiation, as well as the concessions made by the bank to
      barely 1% of the Group’s total lending and its structure was as        reach the agreement. The greater the deterioration, the greater
      follows:                                                               the degree of prudence, establishing a longer observation
                                                                             period. When estimating the length of a possible real recovery
      Amount of the refinanced portfolio. Main countries
                                                                             of the payment capacity a period of between 18 and 24 months
      Million euros
                                                                             is considered for an agreement without a haircut, and between
      Spain                                                          4,172   24 and 36 months for an agreement with a haircut.
      Portugal                                                         914   Credit exposure in Spain
      UK                                                             1,007   a. General view of the portfolio
      Brazil                                                         2,844   At the end of 2011, Santander’s total credit exposure (including
      Latin America                                                    496
                                                                             guarantees and documentary credits) in Spain amounted to EUR
                                                                             271,180 million, with an appropriate level of diversification,
      Sovereign                                                        338   both by product as well as customer segment.

      The structure by segments of the total refinanced portfolio at         The credit risk of commercial networks of the main businesses in
      the end of 2011 was as follows:                                        Spain (Santander Branch Network, Banesto, Banif and Santander
                                                                             Consumer) accounted for 23% of the Group’s total, distributed as
       Structure by segment of the total refinanced portfolio                follows:
       Million euros
                                                                              Segmentation of the commercial networks in Spain
      Mortgages                                                      2,037    %
      Consumer                                                       2,617
      Companies                                                      4,497
                                                                                                                                                    Comps. indiv.
      Corporate                                                      1,016                                                                          man. 42%
                                                                               Other segments 6%

                                                                                    Institutions 6%

                                                                                       Standardised
                                                                                     companies 4%
                                                                                                 Other
                                                                                      (individuals) 2%
                                                                                                 Consumer 6%                                Mortgages 34%


                                                                             Includes the commercial networks of the main businesses in Spain (Santander Retail Banking, Banesto,
                                                                             Banif and Santander Consumer).


      166                                                                                                                                     ANNUAL REPORT 2011
Informe_Gestion Riesgos 2011_ENG_V17:esp 28/02/12 13:58 Página 167


             In accordance with Bank of Spain rules, the Group regards as                           b. Analysis of the mortgage portfolio of individual
             doubtful loans those which have not been serviced for more                             customers
             than 90 days and includes the total debt of the customer when                          In line with the Bank of Spain’s guidelines for greater
             the unpaid part represents more than 25% of it or when pre-                            transparency in information for the market regarding property,
             judicial actions are taken. Also considered as doubtful loans are                      the table below sets out the loans granted to households to buy
             those which, without entering into non-compliance, have                                homes by the main businesses in Spain. This portfolio, one of
             reasonable doubts of being fully repaid. These criteria are not                        the main ones in Spain, stood at EUR 59,453 million at the end
             limited to just credit risk in Spain, but also to all units, where                     of 2011 (22% of total credit risk in Spain). Of this, 98% of the
             these are combined with the regulations that each local                                loans have mortgage guarantees.
             regulator has established.
             The NPL ratio in Spain in 2011 was 5.49%, concentrated in                              Lending to households to acquire homes
             those sectors which were most affected by the economic                                 Million euros
             downturn. Although this figure is higher than in 2010, its
                                                                                                                                                            Gross amount             Of which: doubtful
             increase was below the aggregate rise of banks in Spain
             (according to the regular information published by the Bank of                         Loans to acquire property                                    59,453                                     1,607
             Spain). This underscored the Group’s traditionally prudent risk                           Without mortgage guarantee                                             918                             28
             management criteria as well as the fact that the NPL ratios of a                          With mortgage guarantee                                   58,535                                     1,579
             large percentage of the credit portfolios in Spain registered
             lower growth during the year. Santander’s positive differential
             with banking system widened in 2011 by 67 b.p.                                         The NPL ratio of the portfolio with mortgage guarantee, which
             Total provisions for covering the possible loss of these risks                         reflects the evolution of the economic environment during
             represent coverage of 45.5%.                                                           2011, was 2.7% at the end of the year, 50 b.p. more than in
                                                                                                    2010 and well below that of other businesses in Spain.
             In line with the Bank of Spain’s rules and indications, loans
             classified as substandard are those which, while being up to                           The portfolio of mortgages for property in Spain has features
             date on payments and with no reason to be classified as                                that maintained its medium-low risk profile and had limited
             doubtful, show some weakness which could lead to non-                                  expectations of further deterioration:
             payments and losses, as they involve the weakest customers                             • All mortgages pay principal from the very first day of the
             from certain collectives or sectors affected by extraordinary                            operation.
             circumstances of greater risk.
                                                                                                    • The usual practice is to repay it ahead of time and so the
                                                                                                      average life of the operation is well below that of the
                                                                                                      contract.
             Evolution of non-performing loans 2008-2011
             %                                                                                      • The borrower responds with all assets and not just the
                                                                                                      property.
                 Deposit taking institutions
                 Grupo Santander total Spain                                                        • Most mortgages have variable interest rates with spreads over
                                                                                                      Euribor.
              8.00
              7.50
                                                                                        7.67        • High quality of collateral, almost entirely in mortgages for the
                                                                                                      first residence.
              7.00                                                           6.68
              6.50                                                                                  • 88% of the portfolio has a LTV of less than 80%, calculated as
              6.00                                                                                    the total risk against the amount of the latest available
                                                                 5.75                                 valuation.
              5.50
                                                      5.26
              5.00                         4.97                                         5.49
                                                                                                    • The average affordability rate remained at close to 29%.
              4.50              4.49                                         4.81
              4.00                                                                                  LTV ranges. Total
              3.50 3.29                                           4.24                              Million euros
                                                      3.71
                                                                                                                                                                                         80% < LTV < 100%


              3.00
                                                                                                                                          40% < LTV < 60%


                                                                                                                                                                   60% < LTV < 80%


              2.50                         3.41
                                                                                                                                                                                                               LTV > 100%
                                                                                                                           LTV < 40%


              2.00              2.72
              1.50
                       1.95
             1.00
             0.50
                                                                                                    Gross amount      13,020           16,503                  21,940                6,474                   597
                      Dec. 08


                                 Jun. 09


                                            Dec. 09


                                                       Jun. 10


                                                                   Dec. 10


                                                                              Jun. 11


                                                                                          Dec. 11


                                                                                                     Of which: doubtful 177              271                      598                  425                   107


                     ANNUAL REPORT 2011                                                                                                                                                                       167
Informe_Gestion Riesgos 2011_ENG_V17:esp 28/02/12 13:58 Página 168


         Loan to value                                                                                        the maturity of their loan, in order to compensate the grace
                                                                                                              period, without having to change the loan’s financial conditions,
                                                                                                              neither during the period of grace nor at the end of it.
                                                                                        38%
                  LTV < 40%                                                                                   This measure helped to mitigate the social impact of the
                  40% - 60%                      1%                                                           economic crisis, while preserving the good culture of payment,
                  60% - 80%
                                                                                                              one of the differential elements of the Spanish mortgage
                  80% - 100%
                                            11%                                                               market. At the end of 2011, 6,000 customers of the Santander
                                                                                                              Branch Network in Spain had taken advantage of this
                  > 100%
                                                                                                              moratorium for a total amount of close to EUR 1,000 million.
                                                                                                              c. Financing provided for construction and real estate
                                                                                               28%            promotion with real estate purpose
                                                            22%                                               Lending to these sectors, in line with the Bank of Spain’s
                                                                                                              guidelines regarding classification by purpose, amounted in
                                                                                                              Spain to EUR 23,442 million, 25% lower than in 2009 and 14%
         Affordability rate                                                                                   below 2010 using like-for-like criteria. This represents a market
         Average 29%                                                                                          share of around 10% on the basis of the latest information
                                                                                                              published for June 2011, substantially lower than that of the
                                                                                         52%                  Group’s total businesses in Spain. Including EUR 8,552 million of
                                                                                                              foreclosed properties, the total amount is EUR 31,994 million
                  TE < 30%                                                                                    (4% of the Group’s total lending).
                  30% < TE < 40%
                  TE > 40%                                                                                    The reduction in risk was largely due to a strict policy in
                                                                                                              admitting new loans with the consequent amortisation of the
                                           24%                                                                credit operations of the portfolio outstanding and proactive
                                                                                                              management of existing risks.
                                                                                                              The non-performing loan ratio of this portfolio at the end of 2011
                                                                                                              was 28.6%, underscoring the deterioration in this sector. Of the
                                                                           24%                                EUR 10,638 million classified as doubtful and sub-standard loans,
      Note: The affordability rates at Santander and Banesto.                                                 58% were up-to-date with payments, which underscored the
      Loan to Value: relation between the amount of the loan and the appraised value of the mortgaged
      property. On the basis of management criteria, the average LTV of the portfolio of mortgages for
                                                                                                              Group’s conservative policy in anticipating the bad loan
      individuals to buy homes was 51.6%                                                                      classification. Coverage with specific provisions was 32.8%, in
      Affordability rate: relation between the annual payments and the customer’s net income.                 accordance with the regulations at the end of the year.

      Despite the economy’s situation and its gradual deterioration                                           Financing for construction and real estate development:
      during the last three years, the measures taken in admission                                            doubtful and substandard loans
      produced a good evolution of vintages. For new loans between                                            Million euros
      2008 and 2011 in the Santander network in Spain, the maturity
      of vintages is shown below.                                                                                                                          Risk               Coverage

                                                                                                                                                       Amount          Amount            %
          Evolution of the default rate by the number of operations
                                                                                                              Doubtful loans                             6,722           2,211           33
          by vintages
                                                                                                              Substandard                                3,916             613           16
                    3%
                                                                                                              Coverage with generic provisions                             327
                  2.5%                                                                                        Total                                    10,638            3,151           30

                    2%                                                                         2008
                                                                                              2.49%
                                                                                                              A large part of the exposure to the construction and real estate
      NPL ratio


                  1.5%                                                                                        activity sectors are loans with mortgage guarantee (EUR 18,705
                                                                                                              million, 80% of the portfolio compared to 78% in 2010). Their
                    1%                                                                                        distribution is shown below:
                                                                               2009
                                                                              0.85%
                  0.5%
                                                                                                              Credit exposure to the construction and real estate
                     0                   2011
                                                             2010
                                                            0.22%
                                                                                                              development sector
                                        0.15%                                                                 Million euros

                         0   5   10   15        20     25      30     35      40      45      50         55
                                                                                                              Total: 23,442 million.
                                                                                                                                                                    Finished buildings
                                                        Months                                                                                                      (11,805) 50%
      Note: mortgage vintages of the Santander Branch Network in Spain.


      Banco Santander’s branch network in Spain offered as of
                                                                                                               Without mortgage
      August 1, 2011 a three year moratorium in capital in order to                                                    guarantee
      ease the situation of individual customers and the self-                                                      (4,737) 20%
      employed, with objective causes of economic problems, such as
      being unemployed or having suffered a fall of more than 25% in                                              Other land (244) 1%
      their income, and who were having temporary problems in                                                                                                         Buildings under construction
                                                                                                                                                                      (1,985) 9%
      repaying their mortgages on their normal residence. Customers                                              Land that can be developed
      who adhere to this measure have the possibility of extending                                                              (1,553) 7%       Land developed (3,118)
                                                                                                                                                 13%


      168                                                                                                                                                         ANNUAL REPORT 2011
Informe_Gestion Riesgos 2011_ENG_V17:esp 28/02/12 11:18 Página 169


             A particularly important product in the real estate promotion          The admission processes are managed by specialised teams who
             portfolio is mortgage loans to real estate developers. At the end      coordinate directly with commercial teams, and have well
             of 2011, this amounted to EUR 7,467 million and represented            defined policies and criteria:
             around 0.9% of Grupo Santander’s total credit portfolio. The
             reduction in the exposure to this product accelerated during 2011      • Promoters with an ample solvency profile and with proven
             (24% compared to 20% in 2010 and 9.3% in 2009).                          experience in the market.
                                                                                    • Strict criteria of parameters inherent in operations. Exclusive
             At the end of 2011, this portfolio of loans had a low degree of          financing for the cost of building, high percentages of sales
             concentration and an appropriate level of guarantees and                 accredited, financing of the first residence, etc.
             coverage.
                                                                                    • Support for the financing of social housing with accredited
             The situation was as follows:                                            percentages of sale.
             • Developments completed and with the final certificate of             • Restricted financing of land, reduced to the re-establishment
               work: 79.2% of outstanding risk.                                       of the appropriate level of coverage in already existing
                                                                                      financings or an increase in the guarantees.
             • Developments more than 80% completed: 6.4% of
               outstanding risk.                                                    As well as the permanent control by teams of monitoring the
                                                                                    Group’s risks, there is a technical team specialised in monitoring
             • Developments between 50% and 80% completed: 5.2% of                  and controlling this portfolio in relation to progress in building,
               outstanding risk.                                                    compliance with plans and control of sales, as well as with the
             • Developments less than 50% completed: 9.2%.                          validation and control of disbursements through certifications.
                                                                                    Santander has specific tools created for this purpose. All the
             Furthermore, close to 86% of this financing of real estate             mortgage distributions, disbursements for any type of concept,
             developments is totally completed or close to it, having               changes to the grace periods, etc, are authorised on a
             overcome the risk of construction.                                     centralised basis.

             Policies and strategies established for management of                  In the case of projects under construction with some kind of
             these risks                                                            problems, the criterion to be followed is to guarantee
             The policies in force for managing this portfolio, regularly           completion in order to have buildings that can be sold. In order
             reviewed and approved by the Group’s senior management, are            to achieve this, each project is analysed individually so that the
             currently focused on reducing and securing the exposure,               most effective series of measures can be adopted for each case
             without overlooking new business identified as viable.                 (payment structures to suppliers that guarantee completion of
                                                                                    the work, setting schedules of specific disbursements, etc).
             In order to manage this credit exposure, Grupo Santander has
             specialised equipment that not only fits within the risk areas, but    In those cases that require as a result of the analysis some kind
             also complements its management and covers the whole life              of restructuring of the exposure, the restructuring is carried out
             cycle of these operations: their commercial management,                jointly between risks and the business area of recoveries,
             juridical treatment, eventuality of recovery management, etc.          anticipating non-payment situations, with criteria centred on
                                                                                    providing the projects with a payments structure that produces
             As already commented on in this same point, anticipative               a good result. These authorisations are conducted on a
             management of these risks enabled the Group to reduce its              centralised basis and by expert teams ensuring strict criteria are
             exposure significantly (-45% in mortgage loans for promoters           applied in line with the Group’s principles of prudence in risk
             between 2008 and 2011) and attain a granular portfolio and             management. Recognition of the possible losses materialises
             diversified by territories where the volume of loans for second        when they are identified, classifying the positions without
             homes is very low.                                                     waiting for non-payment in accordance with the rules set by the
                                                                                    Bank of Spain, with the corresponding provision giving coverage
             Mortgages for land not developed account for only 6% of the            to the expected loss in these positions.
             mortgage exposure, with the rest already classified as developed
             land or land that can be developed.                                    Companies specialised in selling properties (Altamira Santander
                                                                                    Real Estate and Promodomus) manage real estate assets, backed
             In the event of loans for homes not yet completed, the significant     up by the commercial network structure. Sales are made with
             reduction in the exposure of 24% in 2011 was due to various            price reduction levels reflecting the market’s situation and with
             actions. As well as the already existing specialised channels,         the levels of provisions of this portfolio.
             campaigns were conducted supported by teams of specific
             managers for this function which, in the case of the Santander
             Branch Network, were directly supervised by the business area of
             recoveries, where direct management of them with promoters
             and buyers applying criteria of sale price reductions and adapting
             to the financing conditions to the needs of buyers, enabled
             subrogations of already existing loans to be made. These
             subrogations diversify risk in a business segment that has a clearly
             lower NPL ratio.


                  ANNUAL REPORT 2011                                                                                                                169
Informe_Gestion Riesgos 2011_ENG_V17:esp 28/02/12 11:18 Página 170


      d. Real estate foreclosed                                                 These additional needs will be entirely met in 2012 as follows:
      In the last instance, one of the mechanisms used in Spain to
      manage risk efficiently is the purchase and foreclosure of real           • EUR 1,800 million was charged against the Group's fourth
      estate assets. The net balance of these assets at the end of 2011           quarter 2011 earnings, of which EUR 1,517 million was
      was EUR 4,274 million, the result of a gross amount of EUR                  assigned to an additional fund to the one already existing for
      8,552 million and provisions of EUR 4,278 million.                          coverage of foreclosed properties and which lifted coverage
                                                                                  of these assets to 50%.
      In accordance with the Group's usual criteria of prudence and             • EUR 2,000 million are a capital buffer required by the rules
      anticipating future regulatory changes regarding coverage of                and which are covered by capital already held by the Group.
      these properties, at the end of 2011 EUR 1,800 million was set
      aside for real estate risk, of which EUR 1,517 million was used           • The remaining EUR 2,300 million will be covered through
      to constitute an additional fund, which raised coverage of all              capital gains which may be obtained during the year—
      these assets to 50%.                                                        including EUR 900 million from the capital gain on the sale of
                                                                                  Banco Santander Colombia— and through ordinary
      The following table shows the structure at the end of 2011 of               contributions to provisions during 2012.
      properties foreclosed by the main businesses in Spain:
                                                                                Impact on Grupo Santander of the financial
                                                                                reform in Spain
      Spain: Foreclosed properties                                              Million euros
      Million euros

                                     Gross amount       Coverage   Net amount   Amount of provisions

      Finished buildings                   3,753           39%         2,272    Additional provisions under new rules at 31.12.2011                     6,100
      Buildings under construction           521           51%           256    Against results 2011                                                -1,800
      Developed land                       2,661           58%         1,120    Buffer covered with surplus of existing capital                     -2,000
      Land that can be developed           1,339           61%           521    Provisions pending                                                 = 2,300
      Other land                             279           62%           105
      Total                                8,552           50%         4,274    Financing of new provisions in 2012                                 2,300
                                                                                Charged to capital gains from the sale of Santander Colombia             900

      Of the total amount, 45% corresponds to completed buildings               Charged to other capital gains and ordinary allowances 2012             1,400
      available for sale and of the total land 94% is developed or can
      be developed.
                                                                                 Foreclosed properties
      In the last few years, the Group regarded acquisition/foreclosure          Billion euros
      as an efficient tool for resolving unpaid loans as against going
                                                                                   Coverage                                              8.6
      through systems of legal processes. In both 2010 and 2011, net
                                                                                   Net volume                               7.5
      entries of foreclosed and acquired properties continued to fall,
      due to a faster pace of sales (+12%) than entries (+8%). In the                                               6.5
      fourth quarter of 2011, the balance of these assets was slightly                                                       2.3         4.3
      lower and this trend was expected to continue in the coming                                                   2.0
                                                                                                        4.8
      years.                                                                                            0.5

                                                                                                        4.3         4.5      5.2         4.3
      Spain: Foreclosed properties
      Billion euros
                                                2011         2010
      Gross entries                               2.3          2.1        8%
      Sales                                       1.3          1.1       12%
                                                                                                       2008         2009    2010     2011
      Difference                                 1.0           1.0

                                                                                Foreclosed properties:
      e. New regulatory requirements                                            Coverage ratio
                                                                                                                                   50%


      After approval of Royal Decree Law 2/2012, which establishes
      the new requirements for provisions for real estate assets in the
      Spanish financial system, the Bank announced that the amount
      that Grupo Santander needed to cover to meet the
                                                                                                                            31%
                                                                                                                      31%


      requirements was EUR 6,100 million.
                                                                                                              10%


                                                                                                         2008        2009   2010   2011


      170                                                                                                                          ANNUAL REPORT 2011
Informe_Gestion Riesgos 2011_ENG_V17:esp 28/02/12 11:18 Página 171


             Analysis of the mortgage portfolio in the UK                                                             The following table shows the distribution by type of loan:
             As well as the risk portfolio in Spain, of note in standardised
             risks and because of its importance in Grupo Santander’s total                                            Portfolio of residential mortagages
             lending is the UK mortgage portfolio.                                                                     Million euros

             This portfolio consists of first home mortgages distributed in UK                                                                                                         December 2011
             territory, as there are no operations that entail second or                                                                                                                         % of total UK
             successive charges on mortgaged properties.                                                                                                                       Portfolio             portfolio
                                                                                                                      Residential mortgages                                    198,789                    82.1
             Most of the mortgages are in Greater London, where housing
             prices are more stable even during a period of economic                                                       First Time Buyer                                     33,010                      13.6
             slowdown.                                                                                                     Mover                                                71,295                      29.4
             All the properties are assessed by authorised valuers before each                                             Remortgage                                           94,484                      39.0
             operation is approved, in accordance with the principles                                                 First time buyer:customers who buy a home for the first time.
             established by the Group for risk management and in line with                                            Mover: customers who change home with or without changing the bank that granted the mortgage.
             the methodology defined by the Royal Institution of Chartered                                            Remortgage: customers who transfer their mortgage from another bank.

             Surveyors.                                                                                               An additional indicator of the portfolio’s good performance is
             The portfolio performed favourably during 2011. Its NPL ratio was                                        the small volume of foreclosed homes (EUR 160 million at the
             1.46% (1.41% in 2010), the result of both the constant                                                   end of 2011, only 0.07% of the total mortgage exposure).
             monitoring and control as well as the strict credit policies which                                       Efficient management of these cases and the existence of a
             include, among other measures, maximum loan-to-value criteria                                            dynamic market for this type of property which enables sales to
             in relation to properties in guarantee. On the basis of these                                            take place in a short period contributed to the good results.
             policies, since 2009 no mortgages have been granted with LTVs
             of more than 100%. The average LTV is 53%.
                                                                                                                      E. Control function
                                                                                                                      The management process is also aided during the various
             There is no risk appetite for loans considered as high risk                                              phases of the risk cycle by the function of control. This provides
             (subprime mortgages). The credit risk policies explicitly forbid                                         a global vision of the Group’s portfolio of loans with the
             this type of loan, establishing tough requirements for credit                                            sufficient level of detail, enabling the current risk position and its
             quality, both the operations as well as customers. Buy-to-let                                            evolution to be assessed.
             mortgages with a higher risk profile account for a small
             percentage of the total volume of the portfolio (barely 1%).                                             The objective of the control model is to assess the risk of
                                                                                                                      solvency assumed in order to detect focuses of attention and
             The following charts give the structure in LTV terms of and the
                                                                                                                      propose measures that tend to correct eventual deterioration. It
             distribution in terms of the income multiple:
                                                                                                                      is therefore vital that to the control activity in the proper sense
                                                                                                                      of the word is added an analysis component that facilitates
                                                                                                                      proactivity regarding early detection of problems and the
              Loan to value (1) Average: 52.6%                                                                        subsequent recommendation of action plans.
                < 75%
                                                                                                61.4%                 The evolution of risk with regard to budgets, limits and
                75% - 90%                                                                                             standards of reference is constantly and systematically controlled
                > 90%                                                                                                 and the impact in future situations evaluated, both exogenous
                                                                                                                      as well as those arising from strategic decisions, in order to
                                                        12.8%
                                                                                                                      establish measures that put the profile and volume of the
                                                                                                                      portfolio of risks within the parameters set by the Group.

                                                                  25.7%                                               The control function is conducted by assessing risks from various
                                                                                                                      perspectives and establishing as the main elements control by
                                                                                                                      countries, business areas, management models, products and
                                                                                                                      processes. This facilitates the detection of focuses of specific
                                                                                                                      attention for decision-making.
                                                                                                                      The control processes, which ensure compliance with the
              Income multiple Average: 3.1                                                                            Group’s corporate criteria in credit risk management, were
                 < 3.0
                                                                                                                      strengthened in 2011. Meanwhile, the homogeneous nature of
                 3.0 - 3.99                                                                     34.5%                 the control model enabled standards in the flow of information
                 > 4.0
                                                                                                                      to be established, their analysis by portfolios and monitoring of
                                                                                                                      the main management metrics, in an exercise of coordination
                                                                                                                      between the global area and the various units in which
                                                                                                                      programmes were created with specific targets that enable the
                                                                                                                      situation of each of the units to converge with the global
                                                         30.6%
                                                                                               34.9%                  model.
                                                                                                                      In 2006, under the corporate framework established in the
                                                                                                                      Group for complying with the Sarbanes-Oxley Act, a tool was
             (1) Indexed                                                                                              created in the Group’s intranet to document and certify all sub
             (*) Loan to value: Relation between the amount of the loan and the appraised value of the mortgaged      processes, operational risks and controls that mitigate them. The
             property. Income multiple (opposite of affordability rate): Relation between the total original amount
             of the mortgage and the borrower’s gross annual income. The figures are only for the loans granted
                                                                                                                      Risks Division, as part of the Group, evaluates every year the
             in the year.                                                                                             efficiency of internal control of its activities.


                     ANNUAL REPORT 2011                                                                                                                                                                         171
Informe_Gestion Riesgos 2011_ENG_V17:esp 28/02/12 11:18 Página 172


      Analysis of scenarios                                                      The EBA’s stress test analysed the level of capital that banks would
      As part of its management of monitoring and continuous                     reach in 2012 and their evolution since the end of 2010 (the
      control, the Group conducts simulations of its portfolio using             starting point) in two types of scenario: a benchmark scenario and
      adverse scenarios and stress tests in order to assess the Group’s          an adverse one. The exercise assumed that the balance sheet
      solvency in the face of certain situations in the future. These            remained without changes over its starting position, the business
      simulations cover all the Group’s most relevant portfolios and             model remained constant by countries and product strategies, and
      are done systematically using a corporate methodology which:               there are no acquisitions or disposals. It therefore does not reflect
                                                                                 the estimate that the bank’s management could have of the
      • Determines the sensitivity of risk factors (PD, LGD) to certain
                                                                                 development of the Group’s results over the next two years. The
        macroeconomic variables.
                                                                                 banks submitted to the test had to have, initially, a Tier 1 core ratio
      • Defines reference scenarios (at the global level as well as for          of at least 5% in the most adverse scenario.
        each of the Group’s units).
                                                                                 In the case of Santander, the stress tests showed the strength and
      • Identifies rupture scenarios (levels as of which the sensitivity
                                                                                 validity of its business model. The results published on July 15,
        of risk factors to macroeconomic variables is more
                                                                                 2011 show that even in the most adverse scenario, the Group is
        accentuated) and the distance of these scenarios from the
                                                                                 able to generate profits, distribute dividends and continue to
        current situation and the reference scenarios.
                                                                                 generate capital. Santander will end 2012 with a Tier 1 capital of
      • Estimates the expected loss of each scenario and the                     8.4% in the most adverse scenario and 8.9% including generic
        evolution of the risk profile of each portfolio in the face of           provisions.
        movements in certain macroeconomic variables.
      The simulation models use the data of a complete economic                  These results compare very well with those of our competitors.
      cycle to measure the performance of risk factors in the face of            Santander will be the bank that will post the most profits in the
      changes in macroeconomic variables.                                        most adverse scenario (EUR 8,092 million in 2011 and 2012).

      The scenarios take into account the vision of each unit as well as         F. Recovery activity
      the global vision. The macroeconomic variables include:                    Recovery management is a strategic element in the bank’s risk
                                                                                 management.
      • The unemployment rate
      • Property prices                                                          In order to carry out this function, which is essentially a business
                                                                                 activity, the bank has a corporate model of management which
      • GDP
                                                                                 sets the guidelines and general rules to be applied in the
      • Interest rates                                                           countries where it operates, with the necessary adjustments on
      • Inflation                                                                the basis of local business models and the economic situation of
      The analysis of scenarios enables senior management to better              the respective environments.
      understand the foreseeable evolution of the portfolio in the face of       This corporate model basically establishes procedures and
      market conditions and changing situations, and it is a key tool for        management circuits on the basis of customers’ features,
      assessing the sufficiency of the provisions established for stress         making a distinction between massive level management with
      scenarios.                                                                 the use of multiple channels and a more personalised or
      The analysis of the baseline and acid scenarios for the whole              segmented management with specific managers assigned.
      Group and for each unit, with a time frame of three years, shows           As a result, with this segmentation in management, various
      the strength of the balance sheet to different market and                  mechanisms were established to ensure recovery management
      macroeconomic situations.                                                  of customers in non-payment situations from the earliest phases
      EU Stress test exercises                                                   to the writing off of the debt. The sphere of action of the
      In order to assess the solvency and resistance of banks to an              recovery function begins the very first day of non-payment of
      adverse scenario, the European Banking Authority (EBA), in                 the loan and ends when it has been paid or reclassified.
      cooperation with the Bank of Spain, the European Central Bank,             Preventative management is conducted in some segments
      the European Commission and the European Systemic Risk                     before a non-payment situation arises.
      Board, conducted in 2011 a stress test on 91 banks representing
      65% of the total assets of the European banking system.

       Stress test results. Grupo Santander

                                                                                                               Baseline scenario         Adverse scenario
      Sufficiency of capital (million euros)                                                                  2011        2012            2011      2012
      Risk weighted assets (constant balance sheet assumption)                                              613,279     622,571         626,921   650,979
      Common equity according to EBA definition                                                              47,002      59,374          45,053    54,364
           Of which ordinary shares subscribed by the government                                                  0           0               0         0
      Other existing subscribed government capital (before December 31, 2010)                                     0           0               0         0
      Core Tier 1 capital (constant balance sheet assumption)                                                47,002      59,374          45,053    54,364
      Tier 1 ratio (%)                                                                                        7.7%        9.5%            7.2%      8.4%
      Results (million euros)
      Net interest income                                                                                    27,918      29,005          27,919     27,168
      Trading income                                                                                            895         895             352        352
      Other operating income                                                                                  1,530       1,128           2,323      2,355
      Operating profit before impairments                                                                    21,954      22,639          22,207     21,487
      Operating profit after impairments and other losses from the stress test                               11,192      14,280           7,205      6,716
      Other income                                                                                           -1,838      -1,797          -2,114     -1,708
      Net profit after tax                                                                                    7,246       9,545           4,088      4,004
      Source: European Banking Authority (EBA).


      172                                                                                                                          ANNUAL REPORT 2011
Informe_Gestion Riesgos 2011_ENG_V17:esp 28/02/12 11:18 Página 173


             Recovery activity, understood as an integral business, is              3.6 Other standpoints
             supported by constant reviewing of the management processes
             and methodology. It is backed by all the Group’s capacities and        of credit risk
             with the participation and cooperation of other areas
             (commercial, resources, technology, human resources) as well as        There are spheres and/or specific points in credit risk that
             the development of technology solutions to improve                     deserve specialised attention and which complement global
             effectiveness and efficiency.                                          management.
             In recoveries we have a practical and hands on training plan           A. Risk of concentration
             which deepens knowledge, facilitates the exchange of ideas and
                                                                                    Control of risk concentration is a vital part of management. The
             best practices and professionally develops teams, while always
                                                                                    Group continuously tracks the degree of concentration of its
             striving to integrate recovery activity into the Group’s ordinary
                                                                                    credit risk portfolios using various criteria: geographic areas and
             and commercial activity.
                                                                                    countries, economic sectors, products and groups of clients.
             During 2011, the indicators for management of loan recoveries
             underscored the difficult economic situation of some countries         The board’s risk committee establishes the policies and reviews
             where the Group operates, with a change in net entries that            the appropriate exposure limits for appropriate management of
             was higher than in 2010, mainly due to the local economic              the degree of concentration of credit risk portfolios.
             conditions and, consequently, greater difficulty in obtaining          The Group is subject to the Bank of Spain regulation on large
             recovery results in these units. The management capacity has           risks. In accordance with Circular 3/2008 (on determining and
             been ensured and new strategies implemented to increase the            control of minimum equity) and subsequent changes, the value
             recovery of non-performing loans.                                      of all the risks that a credit institution contracts with the same
             Nevertheless, the results for the recovery of written-off assets       person, entity or economic group, including that in the part
             were very good. Action plans were put in place in countries            which is non-consolidatable, cannot exceed 25% of its equity.
             designed to improve this line of activity, with proactive strategies   The risks maintained with the same person, whether an
             defined at the level of each customer and type of portfolio. This      individual or a company or an economic group, are considered
             made possible a greater degree of recovery in this line of activity    large risks when their values exceeds 10% of the equity of the
             than in previous years, and in relation to the evolution in the        credit institution. The exception from this treatment are
             declaration of write offs.                                             exposures to OECD governments and central banks.
             As a way of early recognition and rigorous management of               At December 31, 2011, there were several financial groups that
             problematic loans in the portfolio, Grupo Santander takes into         exceeded 10% of shareholders’ funds: three EU financial
             consideration portfolio sales as a possible alternative solution to    institutions, two US financial entities and an EU central
             be assessed. This activity, via a process of evaluation and            counterparty entity. After applying risk mitigation techniques
             commercialisation, enables the recovery results with recurrence        and the rules for large risks, all of them were below 3.5% of
             vocation to be accelerated.                                            eligible equity.
             In addition, portfolio sales provide the following advantages:
                                                                                    At December 31, 2011, the 20 largest economic and financial
             • Avoid possible future deteriorations from changes in the             groups, excluding AAA governments and sovereign securities
               macroeconomic environment.                                           denominated in local currency, represented 5.0% of the
             • Avoid costs with low return.                                         outstanding credit risk of the Group’s clients (lending plus
             • Reduce or adjust structures.                                         guarantees), which compares favourably with the 6% in 2010.
             • Improve liquidity for other businesses.                              The distribution of the portfolio of companies by sectors is
             • Ensure revenue recurrence in case of sales flows.                    adequately diversified. The chart below shows the distribution of
                                                                                    the credit exposure in the Group’s main units.
             The Bank has specialised teams in this activity. They are
             responsible for relations with investors, identification of the
             portfolio, valuation (and subsequent back testing), management
             of the back office, as well as evaluating the legal and fiscal
             contingencies. In 2010, the creation of units specialised in this
             management was strengthened in the Group, particularly in
             Spain.


                  ANNUAL REPORT 2011                                                                                                                173
Informe_Gestion Riesgos 2011_ENG_V17:esp 28/02/12 11:18 Página 174


       Distribution of risk by sector Grupo Santander                                                            The Group’s risks division works closely with the financial
       %                                                                                                         division to actively manage credit portfolios. Its activities include
                                                                                                                 reducing the concentration of exposures through various
                                                                                                                 techniques such as using credit derivatives and securitisation to
                                                                                                                 optimise the risk-return relation of the whole portfolio.
                                                                                 Individuals 56%
                        Real estate
                            activity
                               8%
        Commerce and repairs
                          5%
                 Transport and
          communications 4%
                    Construction
           and public works 4%
         Elect. Gas and water prod.
                      and distr. 3%               Other
                                                  business    Rest 17%
                                                  services 3%


      *Rest includes sectors with concentration below 2%.


       OTC derivatives: distribution by equivalent credit risk and market value including mitigation impact
       Million euros at December 31, 2011

                                                                                                                                                                     Total market value
                                                                                                                       Total ECR                               including mitigation impact(*)

                                                                                                  Trading             Hedging                     Total   Trading       Hedging                 Total

      CDS Protection Acquired                                                                          397                  117                   515      1,627              79           1,706
      CDS Protection Sold                                                                               34                      0                   34    -1,735             -68           -1,803
      TRS Total Return Swap                                                                               0                     0                    0         0               0                   0
      CDS Options                                                                                         0                     0                    0         0               0                   0
      Total credit derivatives                                                                        431                   118                   549       -107              10                 -97
      Equity Forwards                                                                                     1                 118                   119          0               -8                 -8
      Equity Options                                                                                   512                  778                  1,290      -107            -245                -352
      Equity Swaps                                                                                        0                 643                   643          0             340                340
      Equity Spot                                                                                         0                     0                    0         0               0                   0
      Total equity derivatives                                                                        513                1,539                  2,052       -107              88                 -19
      Fixed-income Forwards                                                                             30                    99                  130          0              75                  75
      Fixed-income Options                                                                                0                     0                    0         0               0                   0
      Fixed-income Spot                                                                                   0                     0                    0         0               0                   0
      Total fixed income derivatives                                                                    30                    99                  130          0              75                 75
      Asset Swaps                                                                                   1,312                 2,360                  3,672       -22             311                289
      Exchange-rate Options                                                                            302                  264                   566       -168             -24                -192
      Exchange-rate Swaps                                                                           4,346               11,655                  16,001       437           1,256           1,693
      Other Exchange-rate Derivatives                                                                     2                     2                    4         -1              0                  -1
      Total exchange rates                                                                         5,962               14,281               20,243          246           1,543            1,789
      Asset Swaps                                                                                         0                 412                   412          0             134                134
      Call Money Swaps                                                                                 349                    52                  401       -187              14                -173
      IRS                                                                                         20,432                16,596                  37,028       562           5,186           5,748
      Forward Interest Rates                                                                            16                    21                    37       -25             -19                 -43
      Other Interest-rate Derivatives                                                               1,215                 1,574                  2,789       871            -848                  23
      Interest Rate Structures                                                                        229                   599                   828       135             -434                -298
      Total interest-rate derivatives                                                             22,240                19,254                  41,494     1,357          4,034            5,391
      Commodities                                                                                      287                  111                   398        235               8                243
      Total commodity derivatives                                                                     287                   111                   398       235                8                243
      Total otc derivatives                                                                      29,464                35,402               64,866        1,623           5,759            7,381
      Collateral                                                                                          0           -11,508              -11,508
      Total                                                                                      29,464                23,894               53,358
      (*) Market value used to take into account the impact of mitigating agreements in order to calculate the exposure by counterparty risk.


      174                                                                                                                                                             ANNUAL REPORT 2011
Informe_Gestion Riesgos 2011_ENG_V17:esp 28/02/12 11:18 Página 175


             B. Credit risk by activities                                                        which, once the expected loss is subtracted, constitutes the
             in financial markets                                                                economic capital, net of guarantees and recovery).
             This section covers credit risk generated in treasury activities                    The total exposure to credit risk from activities in the financial
             with clients, mainly with credit institutions. This is developed                    markets was 59.6% with credit institutions. By product type, the
             through financing products in the money market with different                       exposure to derivatives was 59.4%, mainly products without
             financial institutions, as well as derivatives to provide service to                options, and 40.6% to liquidity products and traditional
             the Group’s clients.                                                                financing.
             Risk is controlled through an integrated system and in real time                    Derivative operations are concentrated in high credit quality
             which enables us to know at any moment the exposure limit                           counterparties; 56.6% of risk with counterparties has a rating
             available with any counterparty, in any product and maturity                        equal to or more than A. The total exposure in 2011 in terms of
             and in all of the Group’s units.                                                    equivalent credit risk amounted to EUR 53,358 million.
             Risk is measured by its prevailing market as well as potential
             value (value of risk positions taking into account the future
             variation of underlying market factors in contracts). The
             equivalent credit risk (ECR) is the net replacement value plus the
             maximum potential value of these contracts in the future. The
             capital at risk or unexpected loss is also calculated (i.e. the loss


              Notional OTC derivative products by maturity
              Million euros at December 31, 2011


                                                       1 year                   1-5 years                5-10 years               Over 10 years             Total REC

                                                   T     H      Total     T      H    Total          T      H   Total        T       H     Total        T        H       Total

             CDS Protection Acquired              19     9        28    226     11     237          27     58     85       126      39      166       397     117        515
             CDS Protection Sold                   8     0         8     17       0         17       9      0         9      0        0       0        34        0         34
             TRS Total Return Swap                 0     0         0      0       0          0       0      0         0      0        0       0         0        0          0
             CDS Options                           0     0         0      0       0          0       0      0         0      0        0       0         0        0          0
             Total credit derivatives            26      9       35     243     11     254          36     58     94       126      40     166       431      118        549
             Equity Forwards                       1   118      119       0       0          0       0      0         0      0        0       0         1     118        119
             Equity Options                      314   319      633     196    392     588           3     58     61         0        9       9       512     778       1,290
             Equity Swaps                          0   296      296       0    344     344           0      3         3      0        0       0         0     643        643
             Equity Spot                           0     0         0      0       0          0       0      0         0      0        0       0         0        0          0
             Total equity derivatives           315    733 1,048        196    736     931           3     61     64         0       9        9      513    1,539       2,052
             Fixed-income Forwards                30    99      129       0       0          0       0      0         0      0        0       0        30       99       130
             Fixed-income Options                  0     0         0      0       0          0       0      0         0      0        0       0         0        0          0
             Fixed-income Spot                     0     0         0      0       0          0       0      0         0      0        0       0         0        0          0
             Total fixed income derivatives 30          99      129       0      0          0        0      0         0      0       0        0       30       99        130
             Asset Swaps                         985 1,902 2,887        323    442     765           4     16     20         0        0       0     1,312   2,360       3,672
             Exchange-rate Options               211   254      465      90     11     101           0      0         0      0        0       0       302     264        566
             Exchange-rate Swaps               1,549 1,782 3,331 1,666        5,821   7,487 1,132        2,045 3,536         0 1,647      1,647     4,346 11,655 16,001
             Other exchange-rate Derivatives       2     2         4      0       0          0       0      0         0      0        0       0         2        2          4
             Total exchange rates              2,747 3,941 6,688 2,079 6,274 8,353 1,136 2,421 3,556                         0 1,647 1,647          5,962 14,281 20,243
             Asset Swaps                           0     2         2      0     36          36       0     77     77         0     297      297         0     412        412
             Call Money Swaps                    167    27      195     156     12     168          12     12     24        14        0      14       349       52       401
             IRS                                 353   636      989 4,169     5,120   9,289 5,201        3,871 9,072 10,079 6,970 17,678 20,432 16,596 37,028
             Forward Interest Rates               16    21        37      0       0          0       0      0         0      0        0       0        16       21         37
             Other Interest-rate Derivatives       1   107      108      21    468     488         117    468    584      1,076    531    1,608     1,215   1,574       2.789
             Interest Rate Structures             35    57        92     83    106     189          25     31     56        85     405      490       229     599        828
             Total interest-rate
             derivatives                        573    850 1,422 4,429 5,742 10,171 5,354 4,460 9,814 11,884 8,202 20,087 22,240 19,254 41,494
             Commodities                         122    45      166     146     66     212          20      0     20         0        0       0       287     111        398
             Total Commodity derivatives 122            45      166     146     66     212          20      0     20         0       0        0      287      111        398
             Total OTC derivatives             3,813 5,676 9,489 7,092 12,829 19,921 6,548 7,000 13,549 12,011 9,897 21,908 29,464 35,402 64,866
             Collateral                                                                                                                                0 -11,508 -11,508
             Total                                                                                                                                 29,464 23,894 53,358

             H = Hedging
             T = Trading


                     ANNUAL REPORT 2011                                                                                                                                   175
Informe_Gestion Riesgos 2011_ENG_V17:esp 28/02/12 11:18 Página 176


      Distribution of risk in OTC derivatives                                                        The distribution of risk in derivatives by type of counterparty was
      by rating of counterparty                                                                      46% with banks, 33% with large companies and 9% with SMEs.

      Rating                                                                                    %    As regards the geographic distribution of risk, 13% is with
      AAA                                                                                  11.7
                                                                                                     Spanish counterparties, 18% with UK counterparties (mainly
                                                                                                     Santander UK’s operations), 30% the rest of Europe, 10% the
      AA                                                                                       9.8   US and 14% Latin America.
      A                                                                                    35.1
                                                                                                     Actividad in credit derivatives
      BBB                                                                                  19.4
                                                                                                     Grupo Santander uses credit derivatives to cover loans,
      BB                                                                                   21.0      customer business in financial markets and, to a lesser extent,
      B                                                                                        2.3   within trading operations. The volume of this activity is small
      Rest                                                                                     0.7   compared to that of our peers and, moreover, is subject to a
                                                                                                     solid environment of internal controls and minimising
                                                                                                     operational risk.
      Distribution of risk in OTC derivatives                                                        The risk of these activities is controlled via a broad series of
      by type of counterparty                                                                        limits such as VaR, nominal by rating, sensitivity to the spread by
                                                                                                     rating and name, sensitivity to the rate of recovery and to
                                                                      Banks 46%                      correlation. Jump-to-default limits are also set by individual
                Pub. & priv. inst.                                                                   name, geographic area, sector and liquidity.
                             2%
                                                                                                     In notional terms, the CDS position incorporates EUR 57,220
                Companies 9%                                                                         million of acquired protection and EUR 51,212 million of sold
                                                                                                     protection.
                                                                              Securitisation
                                                                              4%                     At December 31, 2011, for the Group’s trading activity, the
                 Sovereign 6%
                                                                                                     sensitivity of lending to increases in spreads of one basis point
                                                                                                     was minus EUR 0.3 million, and the average VaR during the year
                                                        Corporate 33%                                was EUR 10.6 million. Both were significantly lower than in
                                                                                                     2010 (sensitivity of –EUR 1.5 million and average VaR of EUR
                                                                                                     17.2 million).
      Distribution of risk in OTC derivatives
      by geographic areas
                                                                                                     C. Country risk
                                                                                                     Country risk is a credit risk component in all cross-border credit
                                                          Rest of Europe 30%
                                                                                                     operations for circumstances different to the usual commercial
                                                                                                     risk. Its main elements are sovereign risk, the risk of transfer and
                                                                                                     other risks which could affect international financial activity
                                                                                                     (wars, natural disasters, balance of payments crisis, etc).
                                                                         UK
                                                                         18%                         The exposure susceptible to country-risk provisions at the end of
                Spain 13%
                                                                                                     2011 was EUR 380 million, of which EUR 19 million
                                                                                                     corresponded to intragroup operations. At the end of 2010, the
                                                                                                     total country risk in need of provisions was EUR 435 million.
                                                                                                     Total provisions in 2011 stood at EUR 55 million compared with
                        Others 15%                                Latin American                     EUR 69 million in 2010.
                                                                           14%
                                                                                                     The country risk management principles continued to follow
                                                       US10%                                         maximum prudence criteria, assuming country risk in a very
                                                                                                     selective way in operations clearly profitable for the Group,
                                                                                                     and which strengthen the global relationship with customers.
       Evolution of country-risk subject to provisions and
       provisions assigned
       Million euros
                                                        5,422
                           1,437
                  977


                                           971


                                                 916
          810


                                     710


                                                                444


                                                                        435


                                                                                  380


      DEC 02 DEC 03 DEC 04 DEC 05 DEC 06 DEC 07 DEC 08 DEC 09 DEC 10 DEC 11


      176                                                                                                                                         ANNUAL REPORT 2011
Informe_Gestion Riesgos 2011_ENG_V17:esp 28/02/12 11:18 Página 177


             D. Sovereign risk                                                   E. Environmental risk
             As a general criterion, sovereign risk is that contracted in        Analysis of the environmental risk of credit operations is one of
             transactions with a central bank (including the regulatory cash     the main aspects of the strategic plan of corporate social
             reserve requirement), the issuer risk of the Treasury or the        responsibility. It revolves around the following two large points:
             Republic (portfolio of state debt) and that arising from
                                                                                 • Equator principles: this is an initiative of the World Bank’s
             operations with public institutions with the following features:
                                                                                   International Financial Corporation. It is an international
             their funds only come from institutions directly integrated into
                                                                                   standard for analysing the social and environmental impact of
             the state sector; and their activities are of a non-commercial
                                                                                   project finance operations. The assumption of these principles
             nature.
                                                                                   represents a commitment to evaluating, on the basis of
             At December 31, 2011, according to Santander’s criteria,              sequential methodology, the social and environmental risks of
             Europe accounted for 56.3% of total risk, Latin America 35.4%,        the projects financed:
             the US 7.3% and others 1.0%. Of note in Europe were Spain           • – For operations with an amount equal to or more than $10
             (29.8%), the UK (16.1%) and in Latin America Brazil (24.3%)             million, an initial questionnaire is filled out, of a generic
             and Mexico (6.6%). Total risk was higher than in 2010 largely           nature, designed to establish the project’s risk in the socio-
             because of the increase in sovereign risk positions with Spain,         environmental sphere (according to categories A, B and C or
             Germany, the US and Mexico, and the incorporation of the                greater to lower risk, respectively) and the operation’s
             positions of Banco Zachodni (concentrated in Poland) to the             degree of compliance with the Equator Principles.
             perimeter of consolidation, which were partly offset by a
             reduction of positions with the UK and Switzerland.                 • – For those projects classified within the categories of greater
                                                                                     risk (categories A and B), a more detailed questionnaire has
             As regards the European peripheral countries, their share of the        to be filled out, adapted according to the sector of activity.
             total portfolio is low: Portugal (2.0%), Italy (0.4%), Ireland
                                                                                 • – According to the category and location of the projects a
             (0.02%) and Greece (0.04%).
                                                                                     social and environmental audit is carried out (by
             Latin America’s exposure to sovereign risk mainly comes from            independent external auditors). Specific questionnaires have
             the obligations to which our subsidiary banks are subject for           been developed for those sectors where the bank is most
             constituting certain deposits in the corresponding central banks        active. The bank also gives training courses in social and
             as well as from fixed-income portfolios maintained as part of the       environmental matters to risk teams as well as to those
             structural interest rate risk management strategy. These                responsible for business.
             exposures are in local currency and are financed by locally         • VIDA tool: used since 2004, its main purpose is to assess the
             captured customer deposits, also denominated in local currency.       environmental risk of corporate clients, both current and
             The exposures to sovereign risk of Latin American issuers             potential, through a system that classifies in seven categories
             denominated in currencies other than the official one of the          each of the companies on the basis of the environmental risk
             country of issue amounted to EUR 2,462 million (3.5% of total         contracted. In 2011, 39,575 companies were assessed by this
             sovereign risk with Latin American issuers).                          tool in Spain (total risk of EUR 59,770 million).

                                                                                  Environmental risk classification
                                                                                  Billion euros

                                                                                  30


                                                                                  25


                                                                                  20


                                                                                  15


                                                                                  10


                                                                                   5


                                                                                   0
                                                                                                       VL        L-      L+       M-      M+        H-   H+
                                                                                 Note: VIDA companies assessed in the retail banking network in Spain.
                                                                                 VB: very low; L: low; M: medium and A: high.

                                                                                 Low or very low environmental risk accounts for 78.3% of total
                                                                                 risk. In 2011, there was a sharp fall in medium environmental
                                                                                 risk (54.4% less than in 2010).


                  ANNUAL REPORT 2011                                                                                                                          177
Informe_Gestion Riesgos 2011_ENG_V17:esp 28/02/12 11:18 Página 178


      4. Market risk


      4.1 Activities subject to                                               The aim of financial management is to inject stability and
                                                                              recurrence into the net interest margin of commercial activity
      market risk                                                             and the Group’s economic value by maintaining appropriate
                                                                              levels of liquidity and solvency.
      The perimeter for measuring, controlling and monitoring the
      area of market risk covers those operations where equity risk is        Each of these activities is measured and analysed with different
      assumed. This risk comes from the change in interest rates,             tools in order to show in the most precise way their risk profile.
      exchange rates, shares, the spread on loans, raw material prices
      and from the volatility of each of these elements, as well as the
      liquidity risk of the various products and markets in which the
      Group operates.
                                                                              4.2 Methodologies
      On the basis of the finality of the risk, activities are segmented in   A. Trading Activity
      the following way:                                                      The standard methodology that Grupo Santander applied to
                                                                              trading activities during 2011 was Value at Risk (VaR), which
      a) Trading: this includes financial services for customers and the      measures the maximum expected loss with a certain confidence
         buying and selling and positioning mainly in fixed-income,           level and time frame. The standard for historic simulation is a
         equity and currency products.                                        confidence level of 99% and a time frame of one day. Statistical
      b) Balance Sheet Management: Interest rate and liquidity risk           adjustments are applied enabling the most recent developments
         arises from mismatches between maturities and repricing of           that condition the levels of risk assumed to be efficiently and
         assets and liabilities. It also includes active management of        quickly incorporated. A time frame of two years or at least 520
         credit risk inherent in the Group’s balance sheet.                   days from the reference date of the VaR calculation is used.1
                                                                              Two figures are calculated every day, one applying an
      c) Structural risks:                                                    exponential decline factor which accords less weight to the
         • Structural Exchange-Rate Risk/Hedging of Results: Exchange         observations furthest away in time and another with the same
           rate risk, due to the currency in which the investment is          weight for all observations. The reported VaR is the higher of
           made, both in companies that consolidate and do not                the two.
           consolidate (structural exchange rate) and exchange rate
           risk arising from the hedging of future results generated in       The VaR is not the only measure used. It is used because it is
           currencies other than the euro (hedging of results).               easy to calculate and is a good reference for the Group’s level of
                                                                              risk. There are also other measures that allow greater control of
         • Structural equity: This covers equity stake investments in         risks in all the markets where the Group operates.
           financial and non-financial companies that do not
           consolidate, generating risk in equities.                          They include analysis of scenarios which define alternatives for
                                                                              the performance of different financial variables and provide the
      The Treasury area is responsible for managing the taking of             impact on results. These scenarios can replicate critical
      trading activity positions.                                             developments or circumstances that happened in the past (such
      The Financial Management area is responsible for the centralised        as a crisis) or determine plausible alternatives that are not
      management of these structural risks, applying standardised             concerned with past events. A minimum of three types of
      methodologies, adapted to each market where the Group                   scenario are given: plausible, severe and extreme, and a VaR is
      operates. In the area of convertible currencies, financial              obtained as well as a much fuller picture of the risk profile.
      management directly manages the parent bank’s risks and                 The market risk area, at the level of each unit and globally and
      coordinates management of the rest of the units which operate           following the principle of independence of the business units,
      in these currencies. The management decisions for these risks           carries out daily monitoring of positions, through an exhaustive
      are taken by each country’s ALCO committee and, in the last             control of the changes that take place in the portfolios in order
      instance, by the markets committee of the parent bank.                  to detect possible new developments for immediate correction.
                                                                              The daily preparation of the income statement is an excellent
                                                                              indicator of risk levels, as it enables us to identify the impact of
                                                                              changes on financial variables in the portfolios.


                                                                              1. Since October 2011, the stressed VaR began to be calculated with the same methodology as for
                                                                              the usual VaR, but using as a time frame a fixed frame of one year, which covers a representative
                                                                              market crisis period for the trading portfolio of each unit within the perimeter of the internal model .


      178                                                                                                                                          ANNUAL REPORT 2011
Informe_Gestion Riesgos 2011_ENG_V17:esp 28/02/12 11:18 Página 179


             Lastly, in order to control derivative activities and credit           b) Net interest margin sensitivity (NIM)
             management, because of its atypical nature, specific measures          The sensitivity of net interest margin measures the change in the
             are conducted daily. In the first case, sensitivity to the price       short/medium term in the accruals expected over a particular
             movements of the underlying asset (delta and gamma), volatility        period (12 months), in response to a shift in the yield curve.
             (vega) and time (theta) is controlled. In the second case,
             measures such as the spread sensitivity, jump-to-default, and          It is calculated by simulating the net interest margin, both for a
             concentration of positions by rating levels, etc, are systematically   scenario of a shift in the yield curve as well as for the current
             reviewed.                                                              situation. The sensitivity is the difference between the two
                                                                                    margins calculated.
             As regards the credit risk inherent in trading portfolios and in
             line with the recommendations of the Basel Committee on                c) Market value of equity sensitivity (MVE)
             Banking Supervision and prevailing regulations, an additional          This is an additional measure to the sensitivity of the net interest
             measurement began to be calculated (incremental risk charge,           margin.
             IRC), in order to cover the risk of default and rating migration
                                                                                    It measures the interest risk implicit in net worth (equity) on the
             that is not adequately captured in the VaR, via changes in
                                                                                    basis of the impact of a change in interest rates on the current
             lending spreads. The controlled products are basically fixed-rate
                                                                                    values of financial assets and liabilities.
             bonds, both public and private sector, derivatives on bonds
             (forwards, options, etc) and credit derivatives (credit default        d) Value at Risk (VaR)
             swaps, asset backed securities, etc). The method for calculating       The Value at Risk for balance sheet activity and investment
             the IRC is based on direct measurements of the tails of the            portfolios is calculated with the same standard as for trading:
             distribution of losses to the appropriate percentile (99.9%). The      maximum expected loss under historic simulation with a
             Monte Carlo methodology is used, applying a million                    confidence level of 99% and a time frame of one day. As for the
             simulations.                                                           trading portfolios, a time frame of two years, or 520 daily
                                                                                    figures, is used, obtained from the reference date of the VaR
             B. Balance sheet management                                            calculation back in time.
             Interest rate risk
             The Group analyzes the sensitivity of net interest margin and          e) Analysis of scenarios
             market value of equity to changes in interest rates. This              Two scenarios for the performance of interest rates are
             sensitivity arises from gaps in maturity dates and the review of       established: maximum volatility and severe crisis. These
             interest rates in the different asset and liability items.             scenarios are applied to the balance sheet, obtaining the impact
                                                                                    on net worth as well as the projections of net interest margin
             On the basis of the positioning of balance sheet interest rates,       for the year.
             as well as the situation and outlook for the market, the financial
             measures are agreed to adjust the positioning to that desired by       Liquidity risk
             the bank. These measures range from taking positions in                Liquidity risk is associated with the Group’s capacity to finance
             markets to defining the interest rate features of commercial           its commitments, at reasonable market prices, as well as carry
             products.                                                              out its business plans with stable sources of funding. The Group
                                                                                    permanently monitors maximum gap profiles.
             The metrics used by the Group to control interest rate risk in
             these activities are the interest rate gap, the sensitivity of net     The measures used for liquidity risk control in balance sheet
             interest margin and of net worth to changes in interest rates,         management are the liquidity gap, liquidity ratios, stress
             Value at Risk (VaR) and analysis of scenarios.                         scenarios and contingency plans.

             a) Interest rate gap of assets and liabilities                         a) Liquidity gap
             Interest rate gap analysis focuses on lags or mismatches               The liquidity gap provides information on contractual and
             between changes in the value of asset, liability and off-balance       expected cash inflows and outflows for a certain period of time,
             sheet items. It provides a basic representation of the balance         for each of the currencies in which the Group operates. The gap
             sheet structure and allows for the detection of interest rate risk     measures the net need or net excess of funds at a particular
             by concentration of maturities. It is also a useful tool for           date, and reflects the level of liquidity maintained under normal
             estimating the impact of eventual interest rate movements on           market conditions.
             net interest margin or equity.
                                                                                    Two types of liquidity gap analysis are made, on the basis of the
             All on- and off-balance sheet items must be disaggregated by           balance sheet item:
             their flows and looked at in terms of repricing/maturity. In the
             case of those items that do not have a contractual maturity, an        1. Contractual liquidity gap: All on-and off-balance sheet
             internal model of analysis is used and estimates made of the           items are analysed provided they contribute cash flows placed in
             duration and sensitivity of them.                                      the point of contractual maturity. For those assets and liabilities
                                                                                    without a contractual maturity, an internal analysis model is
                                                                                    used, based on statistical research of the historical series of
                                                                                    products, and which determines what we call the stability and
                                                                                    instability impact for liquidity purposes.
                                                                                    2. Operational liquidity gap: This is a scenario in normal
                                                                                    conditions of liquidity profile, as the flows of the balance sheet
                                                                                    items are placed in the point of probable liquidity and not in the
                                                                                    point of contractual maturity. In this analysis defining the
                                                                                    behaviour scenario —renewal of liabilities, discounts in sales of
                                                                                    portfolios, renewal of assets— is the fundamental point.


                  ANNUAL REPORT 2011                                                                                                                 179
Informe_Gestion Riesgos 2011_ENG_V17:esp 28/02/12 11:18 Página 180


      b) Liquidity ratios                                                                                     C. Structural exchange-rate risk/Hedging of
      The liquidity coefficient compares liquid assets available for sale                                     results/Structural equity
      (after applying the relevant discounts and adjustments) with                                            These activities are monitored by position measures, VaR and
      total liabilities to be settled, including contingencies. This                                          results.
      coefficient shows, for currencies that cannot be consolidated,
      the level of immediate response to firm commitments.                                                    D. Additional measures
      Net accumulated illiquidity is defined as the 30-day accumulated                                        Back-testing
      gap obtained from the modified liquidity gap. The modified                                              Back-testing is an a posteriori comparative analysis between
      contractual liquidity gap is drawn up on the basis of the                                               Value at Risk (VaR) estimates and the “clean” daily results
      contractual liquidity gap and placing liquid assets in the point of                                     actually generated (results of the portfolios at the end of the day
      settlement or repos and not in their point of maturity. This                                            valued at the next day’s prices). The purpose of these tests is to
      indicator is calculated for each of the main currencies.                                                verify and measure the precision of the models used to calculate
                                                                                                              VaR.
      In addition, other ratios or metrics regarding the structural
      position of liquidity are followed:                                                                     The back-testing analysis carried out by Grupo Santander
                                                                                                              complies, as a minimum, with the BIS recommendations
      • Loans/net assets.                                                                                     regarding the verification of the internal systems used to
      • Customer deposits, insurance and medium and long-term                                                 measure and manage market risks. In addition, back-testing
        financing/lending.                                                                                    includes the hypothesis test: tests of excess, normality,
                                                                                                              Spearman rank correlation, measures of excess average, etc.
      • Customer deposits, insurance and medium and long-term
        financing, shareholders’ funds and other liabilities/the sum of                                       The valuation models are fine-tuned and tested regularly by a
        credits and fixed assets.                                                                             specialized unit.
      • Short-term financing/net liabilities.                                                                 Analysis of scenarios
      • Survival horizon.                                                                                     The potential impact on results of applying different stress
                                                                                                              scenarios on all the trading portfolios and using the same
      c) Analysis of scenarios/Contingency plan                                                               suppositions by risk factor is calculated and analysed regularly
      The Group’s liquidity management focuses on taking all the                                              (at least every month).
      necessary measures to prevent a crisis. Liquidity crises, and their
      immediate causes, cannot always be predicted. Consequently,                                             In addition, there are triggers for global scenarios, on the basis
      the Group’s contingency plans concentrate on creating models                                            of the historic results of these scenarios and the capital
      of potential crises by analyzing different scenarios, identifying                                       associated with the portfolio in question. If these triggers are
      crisis types, internal and external communications and individual                                       surpassed those in charge of managing the portfolio are notified
      responsibilities.                                                                                       so that the pertinent measures can be taken. The results of
                                                                                                              stress exercises at the global level, as well as the possible
      The contingency plan covers the sphere of activity of a local unit                                      excesses on the triggers are regularly reviewed by the global
      and of central headquarters. It specifies clear lines of                                                committee of market risk, so that, if necessary, senior
      communication at the first sign of crisis and suggests a wide                                           management can be informed.
      range of responses to different levels of crisis.
                                                                                                              Coordination with other areas
      As a crisis can occur locally or globally, each local unit must                                         Every day work is carried out jointly with other areas to offset
      prepare a contingency financing plan. The contingency plan of                                           the operational risk. This entails the conciliation of positions,
      each local unit must be communicated to the central unit at least                                       risks and results.
      every six months so that it can be reviewed and updated. These
      plans, however, must be updated more frequently if market
      circumstances make it advisable.
      Lastly, Grupo Santander continues to actively participate in the
      process opened by the Basel Committee and other international
      institutions to strengthen the liquidity of banks 2, with a two-
      pronged approach: on the one hand, participating in calibrating
      the regulatory changes raised —basically, the introduction of
      two new ratios: Liquidity Coverage Ratio (LCR) and Net Stable
      Funding Ratio (NSFR)— and, on the other, being present in the
      different forums to discuss and make suggestions on the issue
      (European Banking Federation, etc), maintaining in both cases
      close co-operation with the Bank of Spain.
      2. Basel III: International framework for liquidity risk measurement, standards and monitoring (Basel
      Committee on Banking Supervision, December 2010).


      180                                                                                                                                                 ANNUAL REPORT 2011
Informe_Gestion Riesgos 2011_ENG_V17:esp 28/02/12 11:18 Página 181


             4.3. Control system                                                   4.4. Risks and results in 2011
             A. Definition of limits                                               A. Trading activity
             The process of setting limits takes place together with the           Quantitative analysis of VaR in 2011
             budgetary process, and is the means used by the Group to              The Group’s risk performance with regard to trading activity in
             establish the level of equity that each activity has available. The   financial markets during 2011, as measured by VaR, was as
             process of definition of limits is dynamic, and responds to the       follows:
             level of risk appetite considered acceptable by senior
             management.                                                           Evolution of VaR during 2011
                                                                                   Million euros. VaR at 99% with a time frame of one day
             B. Objectives of the structure of limits
             The structure of limits require a process that takes into account
                                                                                    34
             the following aspects, among others:                                                       Max. (33.2)

             • Identify and define, efficiently and comprehensively, the main       30
               types of risk incurred so that they are consistent with the
               management of business and with the strategy drawn up.               26
             • Quantify and inform the business areas of the risk levels and
               profile that senior management believes can be assumed, in           22
               order to avoid undesired risks.
             • Give flexibility to the business areas to build risk positions       18
               efficiently and opportunely according to changes in the
               market, and in the business strategies, and always within            14
               the risk levels regarded as acceptable by the entity.
                                                                                                                                     Min. (12.0)
                                                                                    10
             • Allow the generators of business to assume prudent risks


                                                                                          03 Jan.
                                                                                          22 Jan.
                                                                                         10 Feb.
                                                                                         20 Mar.
                                                                                          08 Apr.
                                                                                          27 Apr.
                                                                                         16 May.
                                                                                          04 Jun.
                                                                                          23 Jun.
                                                                                           12 Jul.
                                                                                            31Jul.
                                                                                         19 Aug.
                                                                                         07 Sep.
                                                                                         26 Sep.
                                                                                         15 Oct.
                                                                                         03 Nov.
                                                                                         22 Nov.
                                                                                         11 Dec.
                                                                                         30 Dec.
               but sufficient to attain the budgeted results.
             • Define the range of products and underlying assets with
               which each treasury unit can operate, bearing in mind
               features such as the model and valuation systems, the
               liquidity of the tools used, etc.                                   VaR during 2011 fluctuated between EUR 12 million and EUR 34
                                                                                   million. It rose as of the end of April to a maximum for the year
                                                                                   of EUR 33.2 million on May 24, due to an increase in interest
                                                                                   rate and exchange rate risk in Spain and Brazil. The increase in
                                                                                   VaR during the first half of July was due to the rise in exchange
                                                                                   rate risk and volatility in Brazil. As of then, dynamic
                                                                                   management of portfolios, together with a reduction in
                                                                                   exchange rate and interest rate risk in the treasuries of Madrid
                                                                                   and Brazil, produced a downward path until the end of the year.
                                                                                   The VaR reported as of November 15, 2011 excludes the risk
                                                                                   from changes in the credit spreads of securitisations and
                                                                                   portfolios affected by credit correlation. For regulatory reasons
                                                                                   (BIS 2.5), these exposures are considered as banking book for
                                                                                   capital purposes. This change caused a decline in risk in VaR
                                                                                   terms, both at the total level as well as by credit spread.
                                                                                   The average VaR of the Group’s trading portfolio in 2011 (EUR
                                                                                   22.4 million) was lower than in 2010 (EUR 28.7 million), even
                                                                                   though volatility remained high in markets because of Europe’s
                                                                                   sovereign debt crisis. Meanwhile, in relation to other
                                                                                   comparable financial groups, the Group has a low trading risk
                                                                                   profile. Dynamic management of it enables the Group to adopt
                                                                                   changes of strategy in order to exploit opportunities in an
                                                                                   environment of uncertainty.


                  ANNUAL REPORT 2011                                                                                                               181
Informe_Gestion Riesgos 2011_ENG_V17:esp 28/02/12 11:18 Pági
Santander Bank Annual Report  2011

Santander Bank Annual Report 2011

  • 1.
  • 2.
    Thousand year oldolive trees at Grupo Santander City, Boadilla del Monte, Madrid, Spain
  • 3.
    2 Key figures 48 Report on corporate governance 4 Letter from the Chairman 51 Ownership structure 8 Letter from the Chief Executive Officer 54 Banco Santander’s board of directors 12 Corporate governance 70 Shareholders’ rights and 16 The share general shareholders’ meeting 72 Banco Santander’s senior management 18 Banco Santander’s business model 74 Transparency and independence 19 Commercial focus 76 Unified Good Governance Code 22 Disciplined use of capital and financial strength 23 Prudence in risks 78 Financial and economic report 24 Geographic diversification 80 Consolidated financial report 26 Model of subsidiaries 99 Report by business areas 27 The Santander brand 10 1. Main segments or geographical areas 27 Efficiency 136 2. Secondary segments or businesses 28 Santander’s businesses in 2011 144 Risk management report 28 Grupo Santander results 146 Executive summary 30 Continental Europe 148 Corporate principles of risk management 34 United Kingdom 152 Corporate governance of the risks function 36 Latin America 154 Integral control of risk 40 United States-Sovereign 156 Credit risk 41 Global businesses 166 Credit exposure in Spain 178 Market risk 44 Sustainability 188 Management of financing and liquidity risk 47 Human resources 193 Operational risk 196 Reputational risk 198 Adjustment to the new regulatory framework 200 Economic capital 203 Risk training activities 204 Appendices 206 Compliance programme 210 Historical data 212 General information
  • 4.
    Key figures Balance sheetand income statement Million euros 2011 2010 % 2011/2010 2009 Total assets 1,251,525 1,217,501 2.8 1,110,529 Customer loans (net) 750,100 724,154 3.6 682,551 Customer deposits 632,533 616,376 2.6 506,976 Managed customer funds 984,353 985,269 (0.1) 900,057 Shareholder’s funds(1) 80,629 75,273 7.1 70,006 Total managed funds 1,382,980 1,362,289 1.5 1,245,420 Net interest income 30,821 29,224 5.5 26,299 Gross income 44,262 42,049 5.3 39,381 Net operating income 24,373 23.853 2.2 22,960 Profit from continuing operations 7,881 9,129 (13.7) 9,427 Attributable profit to the Group 5,351 8,181 (34.6) 8,943 Ratios (%) 2011 2010 2009 Efficiency (with amortization) 44.9 43.3 41.7 ROE 7.14 11.80 13.90 ROTE(2) 10.81 18.11 21.05 ROA 0.50 0.76 0.86 RoRWA 1.07 1.55 1.74 Core capital (BIS II) 10.02 8.80 8.61 Tier 1 11.01 10.02 10,08 BIS II ratio 13.56 13.11 14.19 Tangible capital/tangible assets(3) 4.4 4.4 4.3 Ratio of basic financing(4) 81.2 79.6 76.0 Loan-to-deposit ratio(5) 117 117 135 Non-performing loan (NPL) ratio 3.89 3.55 3.24 NPL coverage 61 73 75 The share and capitalisation 2011 2010 % 2011/2010 2009 Number of shares in circulation (million)(6) 8,909 8,329 7.0 8,229 Share price (euros) 5.870 7.928 (26.0) 11.550 Market capitalisation (million euros) 50,290 66,033 (23.8) 95,043 Shareholders’ funds per share (euros)(1) 8.62 8.58 8.04 Share price/shareholders’ funds per share (times) 0.68 0.92 1.44 PER (share price/attributable profit per share) (times) 9.75 8.42 11.05 Attributable profit per share (euros) 0.6018 0.9418 (36.1) 1.0454 Diluted attributable profit per share (euros) 0.5974 0.9356 (36.1) 1.0382 Remuneration per share (euros) 0.6000 0.6000 0.0 0.6000 Total shareholder return (million euros) 5,260 4,999 5.2 4,919 Other figures 2011 2010 % 2011/2010 2009 Number of shareholders 3,293,537 3,202,324 2.8 3,062,633 Number of employees 193,349 178,869 8.1 169,460 Continental Europe 63,866 54,518 17.1 49,870 United Kingdom 26,295 23,649 11.2 22,949 Latin America 91,887 89,526 2.6 85,974 Sovereign 8,968 8,647 3.7 8,847 Corporate activities 2,333 2,529 (7.8) 1,820 Number of branches 14,756 14,082 4.8 13,660 Continental Europe 6,608 6,063 9.0 5,871 United Kingdom 1,379 1,416 (2.6) 1,322 Latin America 6,046 5,882 2.8 5.745 Sovereign 723 721 0.3 722 (1) In 2011, scrip dividend for May 2012 estimate. (2) Return on tangible capital. (3) (Capital +Reserves+Minority Interests+Profits-Treasury stock-Dividends-Valuation adjustments-Goodwill-Intangibles)/(Total assets-Goodwill-Intangibles). (4) (Deposits+Medium and long-term wholesale financing+net equity/Total assets (excluding derivatives). (5) Includes retail commercial paper in Spain. (6) In 2011, includes shares issued to meet the exchange of preferential shares in December 2011. 2 ANNUAL REPORT 2011
  • 5.
    Santander posted anattributable profit of EUR 5,351 million in 2011 and assigned EUR 3,183 million to provisions, while strengthening its solvency and maintaining shareholder remuneration at EUR 0.60 per share for the third year running. Gross income Net operating income Million euros Million euros + 5.3% 2011/2010 + 2.2% 2011/2010 24,373 44,262 23,853 42,049 22,960 39,381 2009 2010 2011 2009 2010 2011 Attributable profit Total dividend payout Million euros Million euros – 34.6% 2011/2010 + 5.2% 2011/2010 5,260 8,943 8,181 4,999 4,919 5,351 2009 2010 2011 2009 2010 2011 Efficiency Core capital % BIS II criteria. % + 1.6 p.p. 2011/2010 + 1.22 p.p. DEC 2011/DEC 2010 10.02 44.9 43.3 41.7 8.80 8.61 2009 2010 2011 DEC 09 DEC 10 DEC 11 ANNUAL REPORT 2011 3
  • 6.
    Letter from theChairman Emilio Botín In a very difficult economic, financial and regulatory environment, Banco Santander maintained its policy of giving priority to strengthening its balance sheet as regards capital, liquidity and provisions and generated an attributable profit of EUR 5,351 million, 34.6% less than in 2010. This profit was generated after setting aside EUR 1,812 million of gross provisions, which were not required, to clean up our real estate assets. This increased coverage for repossessed property to 50% and got ahead of the extra provisioning requirements for the financial system approved by the government on February 3, 2012. This provisions, together with writing down part of the goodwill of Banco Santander Portugal, reduced net profits for the year by EUR 1,670 million. Net capital gains in 2011 from the strategic alliance with the insurer Zurich in Latin America and the entry of new partners into the capital of Santander Consumer Finance in the United States amounted to EUR 1,513 million and were used to bolster the balance sheet via other provisions. Net operating income (gross income less operating expenses) was EUR 24,373 million, underscoring the Group’s strength and capacity to generate results. We improved the capital base and liquidity and notably reinforced our balance sheet. With a core capital of 9.01%, according to the more demanding criteria of the European Banking Authority, Banco Santander complied with the EBA’s Emilio Botín new capital requirements six months ahead of the deadline. The requirements recently approved by the government and the Bank of Spain to raise coverage of bad property loans in Spain “In the last five years, the total will require EUR 2,300 million of provisions, over and above those made ahead of time against 2011’s earnings. These shareholder remuneration paid provisions will be fully charged in 2012. by Banco Santander was EUR 24,000 million” 4 ANNUAL REPORT 2011
  • 7.
    Shareholder remuneration 1. Geographic diversification and recurring nature The Group’s sound results will enable, as I said at the last of revenues shareholders’ meeting, the total remuneration per share to be Banco Santander has achieved a geographic positioning in the maintained at EUR 0.60 for the third year running. I would like last few years centred on its 10 core markets, with an to point out that in the last five years, thanks to recurring profits appropriate balance between developed countries (which and international diversification, Banco Santander’s shareholder contribute 46% of the Group’s profits) and emerging markets remuneration amounted to EUR 24,000 million. (54%). The Santander Dividendo Elección (scrip dividend) offers our The retail banking model, developed via our 15,000 branches, shareholders the option to receive part of the dividend in cash which provide services to 102 million customers, give us or new shares. Since its launch three years ago, more than 80% recurring growth in commercial revenues in most of the of capital has chosen shares. The board agreed to propose to countries where we operate. the next shareholders’ meeting applying this programme for the fourth dividend payment (May 2012). In 2011, we sold Banco Santander Colombia for $ 1,225 million. Our market share in Colombia is far from the 10% we aspire to In short, Banco Santander demonstrated its capacity to generate have in the markets in which we are present in order to create results to meet simultaneously the EBA’s capital requirements, value for our shareholders. This operation generated EUR 615 substantially increase provisions for bad property loans and million of net capital gains, which will be recorded in 2012 and maintain the remuneration at EUR 0.60 per share. assigned to further clean up bad property loans, in accordance with the new rules. Banco Santander’s response to the challenges of the environment 2. Capital and liquidity management and model for subsidiaries In my view, the Bank faced three big challenges in 2011 and Our overriding priority objective in 2011 was to strengthen the they will continue to determine the international economic and balance sheet. financial situation in the coming quarters: In October 2011, the European Banking Authority announced • Weak economic activity, particularly in developed countries. the core capital requirements for the main European banks and • Very unstable financial markets, especially European sovereign set June 30 2012 as the deadline for meeting them. In debt markets. December, the EBA said Santander needed a further EUR 15,302 million of capital to comply with these requirements. • And very significant regulatory measures and changes, particularly higher liquidity and capital requirements for banks. Banco Santander has yet again demonstrated its flexibility and capacity of execution and, in just two months, we reached the Banco Santander has four management drivers, enabling it, core capital of 9% required by the EBA. from a position of strength, to comply with this new scenario and continue to gain ground over its competitors: Our goal is to have a core capital of 10%, one percentage point above the EBA’s requirement and well above the demands of the new Basel III regulation and those applicable to systemically important financial institutions. We maintained a comfortable liquidity position by increasing our deposits base without having to remunerate above market rates. Meanwhile, the maturity profile of our debt, concentrated in the medium and long term, enables us not to have to go to the debt markets in Spain and Portugal. All of this, coupled with weak demand for loans in developed countries, produced an improvement in our liquidity situation. The loan-to-deposit ratio reached 117% at the end of 2011 (135% in 2009). ANNUAL REPORT 2011 5
  • 8.
    The Group’s internationalexpansion model, via subsidiaries that 4. Model of operational and commercial efficiency are autonomous in capital and liquidity and in many cases listed, Banco Santander is the most efficient international bank among gives us access to markets in an efficient and rapid way and it its competitors, with a cost-to-income (efficiency) ratio of 45% facilitates the funding of aquisitions. compared to the average of 60% of our competitors. The financial autonomy of these units is very well viewed by the The model of operational and commercial efficiency, with the Group’s regulator and by local regulators, as it acts as a fire- same technology for the Group’s banks, generates cost break, limiting the risk of contagion from any problem between synergies and economies of scale, allows for the exchange of the Group’s units. best business practices between countries and enables us to make significant investments in innovation, development and We were the first international bank to present its living will to security for the benefit of our customers. the regulator thanks to the transparency of our model of autonomous subsidiaries. These four management drivers are strengthened by the strong, solid and attractive Santander brand. Santander is today the 3. Prudent risk management world’s fourth most valuable financial brand according to Brand Banco Santander’s traditional policy of prudence in risks has Finance. enabled the Group to maintain a non-performing loans (NPLs) ratio lower than the sector’s average in all countries where we *** do business. Moreover, in the current socio-economic environment, Santander remains firmly committed to sustainability, focusing The evolution of NPLs in Spain was worse than expected for two on higher education, and also attaches importance to social reasons: on the one hand, the downturn in the economy was actions and respect for the environment. The Santander more severe than envisaged and, on the other, the fall in Universities programme continues to grow and already has 990 lending meant the NPL ratio increased to a greater extent than agreements and has awarded 16,000 travel scholarships. the volume of non-performing loans. Furthermore, in 2011 Banco Santander launched in Spain an Real estate risk in Spain continued to fall and, at the end of ambitious youth employment plan, with 5,000 grants for 2011, represented 4% of the Group’s total lending, including internships in small-and medium-sized firms. foreclosed properties. “Banco Santander complied with the EBA’s new capital requirements six months ahead of the deadline” 6 ANNUAL REPORT 2011
  • 9.
    “Net operating incomeof EUR 24,373 million underscored the Group’s strength and capacity to generate results” Future prospects: Banco Santander’s The performance of the Santander share in 2011 was not in unique positioning accordance with the Group’s level of recurring profits, Some of the factors that have affected the financial sector in soundness and solvency or with the stability of earnings per recent years are likely to persist in 2012. It is therefore vital that share. the European Union approves as soon as possible the decisions Our share is the most liquid of Eurostoxx and ended 2011 with a needed to quickly restore confidence. dividend yield of more than 10%. The share’s low price was In the medium- and long-term, it is likely that, led by European mainly due to external factors, such as the penalisation of the countries, economic growth rates will gradually return to whole banking sector and the pressure exerted on the sovereign normal, which will make the financial markets more stable and debt of various euro zone countries, which have made it difficult reduce unemployment. to estimate adequately Banco Santander’s profit expectations, In this scenario, Banco Santander is in a unique position to I am convinced we will reach all our goals and this will push up create value for its shareholders, continue to register strong the share price significantly. You can rest assured that everyone growth in profits in emerging markets and profitably gain who works for the Group, from the board to the more than market shares in the most mature markets. 190,000 people at the service of our 102 million customers, will do all they can to make Banco Santander a safe and profitable Banco Santander has no significant acquisition or disposal plans investment for its more than three million shareholders. for the medium term, but it will be on the look out to take advantage of opportunities to strengthen itself in its core There were changes in the composition of the board during markets. In an environment of higher cost of capital, the strict 2011. In May, Mr Luis Ángel Rojo died and his place was taken criteria the Bank has always used for its acquisitions assume by the appointment of Mr Vittorio Corbo. Later, Mr Antoine even greater importance: attain in the third year a return on the Bernheim (representing Assicurazioni Generali) and Mr Francisco investment greater than the cost of capital and a positive Luzón left the board. At the next shareholders' meeting, and if contribution to earnings per share. the board's proposal is approved, Mr Antonio Basagoiti, Mr Antonio Escámez and Mr Luis Alberto Salazar-Simpson will All of this will enable us, as I said last September at the Bank’s leave the board and Ms Esther Giménez-Salinas will become Investor Day in London, to boost Santander’s ROE to 12%-14% a director. On behalf of the board and on my own behalf I in 2014 and ROTE (return on tangible equity) to 16%-18% from would like to thank the outgoing directors for their work. I am the current 10.81%. sure the contribution to the board of the two new members will be very positive. Thank you for your support and confidence. Emilio Botín CHAIRMAN ANNUAL REPORT 2011 7
  • 10.
    Letter from theChief Executive Officer Alfredo Sáenz Results and the Santander share Grupo Santander generated an attributable profit, excluding extraordinaries, of EUR 7,021 million, 14.2% less than in 2010. Including provisions and capital gains, profit was 34.6% lower at EUR 5,351 million. Earnings per share were EUR 0.60, 36.1% less than in 2010. Both our net profit as well as our share price, which dropped 26% in 2011, are at cyclically low levels as they were affected by the worsening of the international environment due to the euro zone’s sovereign debt crisis. I would like to point out, nevertheless, the good performance of operating profit, which amounted to EUR 24,373 million: net interest income was up 5.5%; net fee income rose 7.6% and net operating income (before provisions) was 2.2% higher. Very few international banks have been able to generate growth in revenue and in net operating income. This reflects the good commercial performance of our businesses, and underlines our strong potential to generate future results. I would like to transmit a clear message: the results we presented in 2011 do not represent our Group’s potential pace of profit generation. Over the next two or three years we will recover levels of profitability and growth that reflect the potential of our businesses. A vital first step in this process is to absorb, in 2011 and 2012, the regulatory and economic cycle impact. Once this has been done we can return to the profit levels the Group was used to before the crisis. Alfredo Sáenz Balance sheet soundness Banco Santander has given priority to balance sheet strengthening over short-term results. In 2011, we put the “Banco Santander has given emphasis on three corporate initiatives that enabled us to priority to balance sheet bolster the balance sheet: strengthening over short-term 1. Capital. We achieved the core capital ratio requirement of the European Banking Authority six months ahead of the deadline. results, placing emphasis on 1. The core capital ratio, with Basel II criteria, increased from capital, liquidity and provisions for 8.8% in 2010 to 10.0%. real estate assets in Spain“ 2. Liquidity. During the last three years, we have carried out a significant strengthening of our liquidity position. Leveraging in Spain and Portugal and the improvement in the savings rate enabled us to gradually reduce the gap between loans and deposits, additional liquidity that will finance debt maturities in the coming years. 8 INFORME ANUAL 2011
  • 11.
    3. Provisions forreal estate assets in Spain. We increased 6. Lastly, we have a high level of profit generation before coverage of repossessed properties to 50% and in 2012 provisions. This gives us the capacity to absorb provisions we will complete the provisions required by Royal Decree-law when the economic cycle is weak and to generate profits and 2/2012. capital when the cycle improves. We made a significant effort to complete the three measures in Results and management priorities by units the shortest time possible,while most of our competitors are still During 2011, many of our units had to absorb negative impacts: trying to absorb all these cyclical and regulatory effects. a cyclically high level of provisions, in the case of Spain; regulatory effects, as in the UK; and, in other cases, a higher It is very important for the financial sector to complete this cost of wholesale liquidity and a worse than expected economic process of balance sheet strengthening. For this to happen, performance. moreover, two external conditions are vital: However, we are actively managing these effects and are very • First, financial stability: governments, regulators and central aware that, in the coming years, an excellent execution will be banks have to ensure a macroeconomic environment of even more vital. financial stability so that banks can capture liquidity normally and in reasonable conditions. Banco Santander has the necessary drivers, both in mature and • Second, regulatory clarity: banks have to have a clear idea of emerging markets, to return to its normal profit levels. the capital and liquidity ratios required; how they are A. Mature markets calculated; what types of balance sheet are sustainable and The challenges facing banking units in mature markets are well other types of costs to be assumed. Only in this way can they known: low demand for loans; economies under pressure; low make medium- and long-term business plans and adequate interest rate environments and higher cost of liquidity. financing of the economy can be assured. At the moment many of the regulatory changes are clearly pro-cyclical and We believe, however, that the dominant banks in these markets have a negative effect on economic growth. have a great opportunity to create value in the medium term: Only when these two conditions are met will the financial sector recover attractive profitability; gain market share and become return to its role of financing the economy normally. large generators of capital. Strengths as a Group Spain and Portugal We must concentrate all our efforts on taking advantage of our In 2011, I told you that we were seeing a turning point in these business opportunities and ensuring we return to a level of units. However, during 2011 the sovereign debt crisis triggered profitability and growth that befits our business mix and the a downturn in the Spanish and Portuguese economies, and quality of the organization. further falls in interest rates, which delayed the process of returning to the average profitability of our businesses in these In order to achieve this normalization of profits, we are starting countries. from a privileged position. We have strengths as a Group that set us apart from our international competitors: Both the results of the Santander Branch Network and Banesto in Spain as well as those of Portugal, suffered a sharp 1. The diversification of our business portfolio is clearly better setback. The aggregate profit of the three units dropped from than the rest of international banks. EUR 1,722 million in 2010 to EUR 964 million in 2011. 2. We have a major presence in growth markets. We generate However, our medium-term view has not changed: the crisis is more than 50% of our profits in high growth emerging offering the most solid banks opportunities to gain market share markets. and improve their competitive position. We have a unique situation to gain en edge in the Spanish and Portuguese markets, 3. We have very strong local positions, with market shares of and we are going to exploit it. more than 10%. Many of our competitors have banks without scale in many markets, and this prevents them The management priorities for the next two years remain as attaining an acceptable level of profitability. follows: adapt prices to the new environment; maintain firm 4. Our business model is sustainable in the new regulatory control on costs and gain profitable market share from and liquidity environment. Other banks are having to step up competitors immersed in processes of integration and the pace of reducing the size of their wholesale balance sheet. restructuring. Our objective in Spain and Portugal is to recover in the medium-term the level of profits we had in 2008. 5. Our solvency and credit quality are clearly better than those of our local competitors. INFORME ANUAL 2011 9
  • 12.
    Rest of ContinentalEurope/Santander Consumer b. Emerging markets Santander Consumer posted an attributable profit of EUR 1,228 The growth opportunities in emerging markets are well known. million, 51.5% more than in 2010, largely due to an improved However, not all banks that operate in these markets will be cost of the provisions made in the main markets where it able to create value in the medium- and long-term: it is operates. This result includes the contribution of Santander necessary to have a good local critical mass; a strong culture Consumer USA which, as of 2012, leaves the perimeter of and commercial model and an adequate risk appetite, with a Santander Consumer and will be included in the US. good view of the credit. Santander meets all these requirements. Santander Consumer can continue over the coming years to take advantage of its position of strength in its markets, Brazil’s attributable profit declined 7.2% to EUR 2,610 million. maintaining good management of prices and risk. Despite the good growth in net operating income (+10.6%), profits were under pressure from higher provisions and Moreover, we have a good opportunity to develop retail writedowns. banking in Germany, on the basis of the business acquired from SEB. As you know, we have been betting on growth in Germany Once the integration of Santander and Banco Real is concluded, for many years and today we generate close to EUR 500 million the challenge is to narrow the profitability gap with our local of profits there. Our consumer business operations in the rest of competitors. This should give us a sustained 15% growth Continental Europe are also delivering very good profitability. potential in profits in the coming years. United Kingdom In México, attributable profit was 40.9% higher at EUR 936 The profit from our business in the UK was 41.7% lower at EUR million. The management priority for the next few years is to 1,145 million. It was hit by the provision for payment protection consolidate the business improvement achieved in 2011 and insurance remediation (PPI) and by regulatory impacts on the continue to participate in the market’s growth opportunities. cost of liquidity which exerted pressure on Santander UK’s In my view, our potential in Mexico is very high and we expect results. profit growth of more than 15% a year. The objective in the UK is to take the necessary measures to In Chile, attributable profit fell 9.0% to EUR 611 million due to absorb the regulatory impact. This includes actively managing the increase in provisions. We have a privileged position in this prices, the structure of the balance sheet and the cost base. market: in market share, customer base and quality of Moreover, we continue to develop our business with companies, management. We have to be able to adapt our price and costs a segment where we still have a presence below that of our structure in order to absorb the new regulatory framework. natural share. In Argentina, attributable profit declined 2.7% to EUR 287 For this, we have the business acquired from Royal Bank of million, but in local currency terms it was 8.0% higher. Scotland. We expect the big investment effort in installed capacity (34 new branches in 2011) to enable us to boost the profit United States contribution of this unit in the coming years. Sovereign’s attributable profit increased 24.0% to EUR 526 million, largely due to the sharp fall in provisions. In Poland, the attributable profit from nine months consolidation with the Group was EUR 232 million, and for the whole year After dedicating three years to strengthening the balance sheet EUR 288 million. and managing costs, our main challenge in the US for the next few years is to boost revenue generation and establish the Bank Zachodni WBK, our commercial bank in Poland, has technology and operational foundations needed to grow in the a long way to go and is already well positioned to capture country. The generation of fee income is clearly below that of growth opportunities. Furthermore, we can add value in the our regional competitors and we will have to work to gradually cooperation between this local unit in Poland and the Group’s narrow this divide. Our technology systems enable us to global units. increase the offer of transactional products and improve cross- The good results in 2011 enable us to reaffirm the goal of a selling to customers. profit contribution to the Group of more than EUR 450 million in 2013. 10 ANNUAL REPORT 2011
  • 13.
    “Our business unitsmust pay particular attention to successfully carrying out the measures put into effect to improve their profitability” The combination of cyclical normalisation and the measures Conclusions taken by our units will enable us to return to normal profits I want to leave you with four clear messages: in the coming years. 1. The first is that we have been able to generate excellent In September, we held our Investor Day in London at which we operating results, and this is a good reflection of our presented our strategy to analysts and investors. The message of business. However, we are very aware that the net profit in these sessions was clear, and I want to reiterate it in this letter: 2011 does not reflect at all the potential profitability of our as a Group, our normalised profitability is clearly higher than the businesses in the medium term. current levels. 2. The second is that we are taking the necessary steps to Our goals are: normalise our profitability. We do not base our future by • A return on equity of between 12% and 14% within three trusting the economic recovery will make our profits grow. years. On the contrary, we are very conscious that it is up to us to define and execute the strategies enabling us to attain our • A return on tangible equity (excluding goodwill) of between goals. 16% and 18%. 3. The third message is that, in order to carry out this profit We believe that these objectives represent our normalised normalisation, we have the best professionals in profitability, i.e. a return in accordance with the potential of our international commercial banking. We have a high quality businesses, and which is not dragged down by the current team which is very motivated and has shown in the past its cyclical moment. In order to attain these levels, we need three capacity to assume ambitious goals and meet or even surpass conditions: them. First, it is vital to complete the threefold strengthening of 4. Fourth, the Santander share is currently at a level that does the balance sheet: capital, liquidity and provisions for real not reflect the structural profitability or our medium-term estate assets. We will finish this process during 2012. growth potential. As our capacity to normalise our profits becomes clear, this will be reflected in the share price. Second, we see some cyclical recovery, mainly in Europe, which we expect to begin in 2013 and consolidate in 2014 and I am very optimistic about the prospects for your investment 2015. This means lower needs for specific provisions, reduced in the coming years. liquidity tensions and a rise in interest rates. Lastly, our business units must pay particular attention to successfully carrying out the measures put into effect to improve their profitability, adapt to the environment and take advantage of the opportunities that arise. We believe this will be the case as we are very aware that, in a complicated environment, execution is the key and we are not going to fail. Alfredo Sáenz CHIEF EXECUTIVE OFFICER ANNUAL REPORT 2011 11
  • 14.
    Corporate governance Grupo Santander City, Boadilla del Monte, Madrid, Spain The board of directors Banco Santander’s corporate Banco Santander’s board of directors is the maximum decision- governance model making body, except for matters reserved for the general meeting of shareholders. It is responsible, among other things, for the Group’s strategy. Its functioning and activities are Equality of shareholders’ rights. regulated by the Bank’s internal rules and principles of transparency, efficiency and defence of shareholders’ interests • The principle of one share, one vote, one dividend. guide it. The board oversees compliance with the best • No anti-takeover measures in the corporate By-laws. international practices in corporate governance and closely involves itself in the Group’s risks. In particular, the board, at the • Informed participation of shareholders in meetings. proposal of senior management, is the body responsible for establishing and monitoring the Bank’s risk appetite. The board has a balanced composition between executive and Maximum transparency, particularly non-executive directors, all members are recognised for their in remunerations. professional capacity, integrity and independence. There were changes to the board in 2011. Mr Luis Ángel Rojo A corporate governance model recognised by Duque, governor of the Bank of Spain between 1992 and 2000, socially responsible investment indices. died on May 24. He joined the board in 2005. In July, • Santander has been in the FTSE4Good and DJSI indices Mr Vittorio Corbo Lioi, chairman of the Central Bank of Chile since 2003 and 2000, respectively. between 2003 and 2007, joined the board as a non-executive director and in October Assicurazioni Generali S.p.A., also a non-executive director, left the board after reducing its stake in the Bank. 12 ANNUAL REPORT 2011
  • 15.
    Transparency and remunerationpolicy Transparency for Banco Santander is vital for generating confidence and security among shareholders and investors, even more so at times of financial uncertainty and volatility such as today’s. In particular, the remuneration policy for directors and the Bank’s senior management has transparency as the fundamental principle driven by the board for many years. The other two pillars are: 1. Involvement of the board, as, at the proposal of the appointments and remuneration committee, it approves the report on the remuneration policy for directors, as well as their remuneration and contracts and of those of the other senior members of management and the remunerations of the remaining managers of the identified staff. 2. The board submits to the shareholders’ meeting on a consultative basis and as a separate item on the agenda the report on the remuneration policy for directors. 2. Anticipation and adapting to regulatory changes, given the importance that Santander has always attached to rigorous management of risk and a remuneration policy consistent On January 23, 2012, Mr Francisco Luzón López resigned as an with it. executive director and executive vice-president responsible for 2. Towers Watson, an independent expert, certificated that the America division. Grupo Santander’s remuneration policy was in accordance On the occasion of the next general shareholders’ meeting, with the new regulatory framework. and if the board’s proposal is accepted, Mr Antonio Basagoiti, Mr Antonio Escámez and Mr Luis Alberto Salazar-Simpson will The board’s remuneration in 2011 cease to hold office as directors and Ms Esther Giménez-Salinas, In 2011, the board agreed to reduce all directors’ remuneration, rector of the Ramon Llull University, will be appointed as for all items, by 8%. independent director to the board. The amount paid to its members for exercising their functions of The board expressed its gratitude for the outstanding supervision and collegiate decision-making has been reduced by contribution made by the outgoing directors over the years they 6% over 2010. This amount has been unchanged since 2008. had formed part of it, highlighting the important executive responsibilities undertaken by several of them throughout their As regards executive directors, the board decided to maintain the professional careers in the Bank. fixed remuneration for 2012 and reduce by an average of 16% the variable ones for 2011. With these changes, the size of the board is reduced from 20 directors at the beginning of 2011 to 16. Full details of director compensation policy in 2011 may be found in the report by the appointments & remuneration committee The board in 2011 which forms part of Banco Santander’s corporate documentation. • It held 14 meetings, two of which were dedicated to the Group’s global strategy. • During 2011, the second vice-chairman and chief executive officer presented to the board eight management reports and the third vice-chairman, responsible for the risk division, presented reports on his area. ANNUAL REPORT 2011 13
  • 16.
    Board of directorsof Banco Santander London, November 21, 2011 General secretary Director Director Director Director First vice-chairman and of the board Mr Ángel Jado Mr Luis Alberto Mr Abel Matutes Mr Antonio Basagoiti Mr Fernando de Asúa Álvarez Mr Ignacio Benjumea Becerro de Bengoa Salazar-Simpson Bos Juan García-Tuñón Cabeza de Vaca Director Director Director Fourth vice-chairman Chairman Mr Juan Rodríguez Ms Ana Patricia Botín-Sanz Mr Rodrigo Echenique Mr Manuel Soto Mr Emilio Botín-Sanz de Inciarte de Sautuola y O’Shea Gordillo Serrano Sautuola y García de los Ríos 14 ANNUAL REPORT 2011
  • 17.
    Executive committee Risk committee Audit and compliance committee Appointments and remuneration committee International committee Technology, productivity and quality committee Second vice-chairman and Director Director Director Director chief executive officer Mr Antonio Escámez Ms Isabel Tocino Lord Terence Burns Mr Vittorio Corbo Lioi Mr Alfredo Sáenz Abad Torres Biscarolasaga Third vice-chairman Director Director Director Mr Matías Rodríguez Inciarte Mr Guillermo de la Dehesa Romero Mr Francisco Luzón López * Mr Javier Botín-Sanz de Sautuola y O’Shea * Resigned his position on the board January 2012. ANNUAL REPORT 2011 15
  • 18.
    The Santander share Generalmeeting of shareholders, June 17, 2011, Santander, Cantabria, Spain Shareholder remuneration Banco Santander assigned EUR 5,260 million to shareholder EUR 5,260 million assigned to remuneration in 2011, 5.2% more than in 2010. The high degree of recurrence of profits and the soundness of shareholder remuneration. Santander’s capital enabled the Bank to pay out more than EUR 24,000 million in the last five years. Market capitalization of EUR 50,290 As part of this remuneration, Santander has the Dividendo million at the end of 2011. Elección programme (scrip dividend), which enables shareholders to opt to receive an amount equivalent to certain The largest bank in the euro zone by dividends in the form of cash or new Santander shares. The Bank offers flexible remuneration, enabling its shareholders market value. to benefit from tax advantages. Some 80% of the Bank’s capital chose to receive shares in 2011. EUR 0.60 remuneration per share in Banco Santander paid against 2011 results: the last three years. • A first interim dividend of EUR 0.135 per share (August 2011); 3,3 million shareholders. • A scrip dividend of EUR 0.126 per share equivalent to the second interim dividend (November 2011); • A scrip dividend of EUR 0.119 per share equivalent to the third interim dividend (February 2012). The board also approved applying the Santander Dividendo Elección programme, with a remuneration of EUR 0.220 per share, at the date when the final dividend is normally paid (April/May 2012). This would bring the total remuneration per share to EUR 0.60 for the third year running. 16 ANNUAL REPORT 2011
  • 19.
    Investor Day, September29 and 30, 2011, London, United Kingdom Comparative performance of the Santander share Distribution of the capital stock by type of shareholder and indices Number of shares and % Data from December 31 2010 to December 31 2011 December 2011 Santander Dow Jones Stoxx 50 Base: 100 Dow Jones Stoxx Banks Ibex 35 Shares (%) 120 Board 198,130,573 2.22 110 Institutional 4,687,628,721 52.62 100 Retail 4,023,283,909 45.16 90 Total 8,909,043,203 100.00 80 70 60 50 31/12/10 31/12/11 Performance of the Santander share Shareholder base and capital The Santander share ended 2011 at EUR 5.87, 26% lower than The number of Banco Santander shareholders continued to a year earlier. This performance does not reflect the path of rise in 2011. It increased by 91,213 to 3.3 million. results, the soundness of the Bank’s balance sheet or its future prospects. The very volatile markets, as a result of the European At the end of the year, 2.2% of the capital stock was in the sovereign debt crisis and doubts on the euro, penalized hands of the board of directors, 45.2% with individual European stock market indices and, in particular, the financial shareholders and rest with institutional investors. Of the total sector. This situation was also accentuated by doubts on the capital stock, 87.85% is located in Europe, 11.85% in the recovery in global economic growth and by the new regulatory Americas and 0.30% in the rest of the world. requirements for banks. Banco Santander carried out four capital increases in 2011 to Santander’s performance, however, was better than that of tend to the Santander Dividendo Elección programmes (February the DJ Stoxx Banks (-32.5%), the main European banking index. and November), the conversion of 3,458 bonds (October) and Santander remains in a privileged position as the largest bank in the exchange of preferred shares for ordinary shares the euro zone by market value and the 13th on the world, (December). A total of 579,921,105 new shares were issued. with a capitalization of EUR 50,290 million at the end of 2011. In 2011, Banco Santander continued to strengthen its Furthermore, the Santander share is the most liquid in information and attention channels for shareholders in Spain, Eurostoxx. the United Kingdom, the United States, Brazil, Argentina, Mexico, Portugal and Chile. These offices tended to 232,430 consultations by telephone, 51,616 e-mails and 19,819 shareholders attended 206 forums and events held in various countries. On September 29 and 30, 2011 the Investor Day was held in London, at which the chairman and the chief executive officer, together with Banco Santander’s senior management, presented the Bank’s strategy for the coming years to more than 300 analysts and investors. ANNUAL REPORT 2011 17
  • 20.
    The Santander businessmodel Commercial focus Disciplined Efficiency use of capital and financial strength Santander brand Prudence in risk Geographic diversification and model of subsidiaries Banco Santander’s business model gives substantial Santander complied with the European Banking recurrence in results. Authority’s core capital requirement of 9% six months ahead of schedule. Retail banking generates 87% of revenues. Santander has 102 million customers who are Santander did not need public funds at any time tended to via 14,756 branches, the largest network during the crisis and is one of the world’s most of an international bank. solid and solvent banks. Geographic diversification in 10 core countries In an environment of tensions in financial markets, provides Santander with an appropriate balance Santander’s liquidity position has remained between mature and emerging markets. comfortable. The Bank’s international expansion was achieved Grupo Santander’s non-performing loans ratio is with subsidiaries autonomous in capital and below the sector’s average in the main countries liquidity, giving us advantages when financing and where it operates. limiting the risk of contagion. Santander was recognized by Brand Finance as the The Group’s technology and its control of costs fourth most valuable brand in the world. make Santander one of the world’s most efficient banks. 18 ANNUAL REPORT 2011
  • 21.
    Banco Santander branchin Madrid, Spain Commercial focus Total Group customers The customer is the focal point of Banco Santander’s activity. (Million) Grupo Santander’s customer base has grown notably in the last Santander Branch Network 9.6 few years and more than doubled between 2003 and 2011 Banesto 2.4 (from 41 million to 102 million). The geographic distribution of customers was as follows: 40.8% in Latin America, 31.3% in Portugal 2.0 continental Europe, 26.2% in the UK and 1.7% in the US. Bank Zachodni WBK 2.4 Santander Consumer Finance 15.5 The Bank’s retail business focus sets it apart from other global competitors, underlined by the fact that 99.8% of the Group’s Rest 0.1 customers are in the segments of commercial banking and Total continental Europe 32.0 consumer finance. United Kingdom 26.7 Lasting relations and greater value-added with customers are Brazil 25.3 generated and maintained in branches. Santander has 14,756 Mexico 9.3 branches, the largest network of an international bank. In 2011, Chile 3.5 Grupo Santander increased its distribution capacity with the addition of 674 branches mainly as a result of the incorporation Argentina 2.5 of new businesses in Poland and Germany and plans to open Uruguay 0.2 new branches in high growth countries such as Brazil, Mexico Colombia 0.3 and Argentina. Puerto Rico 0.5 In addition to this network, the Bank also has other channels, Peru 0.1 available around-the-clock, such as online banking, mobile Rest 0.1 telephone banking and telephone banking. In 2011, Santander stepped up its investment in its call centres in the UK in order to Total Latin America 41.7 improve its customer service. It also launched applications that United States-Sovereign 1.7 enable it to operate via iPhone and other mobile telephone Total customers 102.1 means in some of the Group’s banks. Customers Branches Million Number 102.1 14,756 14,082 97.2 13,660 92.0 2009 2010 2011 2009 2010 2011 ANNUAL REPORT 2011 19
  • 22.
    Santander branch inGermany Quality of service and customer satisfaction There was also a significant advance in 2011 in implementing the Quality of service is a fundamental part of Banco Santander’s corporate model of complaints, which aims to unify the criteria strategy. applied in managing the customer attention services of the Group’s various units. In 2011, customer satisfaction with the services provided by Banco Santander through various channels (branches, telephone and This model revolves around three elements: Internet) improved. Some 88.2% of customers said they were • Policies to improve customer attention, confidence and satisfied, generating greater linkage, proximity and loyalty, as well satisfaction. as higher customer revenues. • Decision-taking structure based on agile and efficient In order to improve the quality of service, the Group has a governance systems, with reports made to the first executive corporate model called META 100, which has been extended to level. more countries year after year. The main objectives of META 100 are to reflect the voice of customers and integrate it into the • Management of complaints in accordance with the prevailing Bank’s businesses; establish a culture of quality (i.e. an organisation regulations as well as the good banking practices that that is closer to and focused on customers) and generate dynamics regulators require in each country. of continuous improvement, centred on customer satisfaction. Banco Santander’s professionals receive continuous training in order to inform and advise customers transparently and rigorously Customer satisfaction and provide the best service. In the last quarters of 2011, % of individual customers satisfied programmes to foster this culture were put into effect such as El año del servicio in Chile, Nuestro estilo in Argentina and Santander Branch Network 88.0 Impulsa tu lado Pro in Banco Santander Spain. The corporate Banesto 91.2 function of Brand Customer Experience was also created, which Portugal 92.9 oversees the consistency and coherence between the promise of the brand and the customer’s experience. United Kingdom 89.1 Argentina 91.8 Santander has an advanced model for managing incidents called Brazil 83.0 MIRÓ, which channels all the disagreements that the customer transmits to the Bank via various channels. Chile 90.4 Uruguay 83.7 The objective of MIRÓ is to achieve a quick resolution of complaints. It channels internally its treatment to specialised units Mexico 95.6 and keeps the customer informed of the state of the incident. Puerto Rico 96.6 MIRÓ also identifies the main reasons why customers are not Total 88.2 satisfied and the causes of the incidents so that steps can be taken to correct them. Customer satisfaction by channel % of individual customers satisfied Branches Telephone Internet 93.7 90.2 89.7 89.1 88.9 87.5 2010 2011 2010 2011 2010 2011 20 ANNUAL REPORT 2011
  • 23.
    Banco Santander branchin Mexico Banco Santander branch in Brazil Products and services Corporate school of commercial banking Banco Santander has a wide range of financial products and In order to improve Grupo Santander’s commercial banking services based on the risk profile of its customers and skills, the corporate school of commercial banking was created characterised, in all its markets, by anticipation and dynamism in 2010. when launching new value offers. Of note among the products and services launched in 2011 were: This project is supported and involves Banco Santander’s senior management: the governing board of the school is headed by • In the UK, more than 100,000 123 Cashback credit cards, Mr. Alfredo Sáenz, the chief executive officer, and comprises which return money to customers on the basis of the usage, senior executives responsible for the main countries and were sold in the first two months after its launch. divisions. • In Spain, Santander gave those customers with difficulties as a The school’s mission is to gather the best commercial and result of the crisis the possibility of benefiting from a three- business practices which make up the Group’s commercial year moratorium on the capital repayments of the mortgages banking and promote their transmission in order to drive for their main home. Almost 6,000 customers took up the business development in the various units. The school also offer. enables new countries that integrate into the Group to quickly • In Brazil, agreements were signed with major companies, such and efficiently adapt to Banco Santander’s commercial banking as the petrol distributor Shell and the telecoms company Vivo model. (Telefónica), to launch credit cards with added advantages for the Bank’s customers. The school is structured into knowledge areas that respond to the various fields and/or segments of commercial banking. Each • In the US, the SMEs area of Sovereign launched the Boost area has someone in charge and consists of expert teams for Your Business programme, designed to attract new customers each of the matters arising from the countries in which the and increase the already existing linkage. This programme Group operates. The school capitalises on the best commercial offers SMEs very attractive interest rates, new financial practices of countries, in terms of products, services, quality, products and advice shared by specialists. business intelligence, etc, and thereby becomes an extra competitive tool for the Group. The first phase of the school concentrated on individual customers. In 2011, it also began to work on company and SME banking, taking advantage of the experience acquired and incorporated the new countries to its sphere of action (the US, Poland and Germany). Advertising campaigns in Brazil, the UK and Mexico ANNUAL REPORT 2011 21
  • 24.
    Grupo Santander City,Boadilla del Monte, Madrid, Spain Disciplined use of capital Liquidity and financial strength Santander finances most of its loans with customer deposits, maintains comfortable access to wholesale funding and has Capital many instruments and markets to obtain liquidity. Strengthening the balance sheet is a priority objective for Banco Santander, which has quickly and efficiently adapted to the new In 2011, Banco Santander continued to strengthen its liquidity capital requirements of international and European banking with an increase of more than EUR 16,000 million in customer authorities, such as Basel III, regarding globally systemic banks, deposits and debt issues that exceeded the year’s maturities by and the new requirements of the European Banking Authority more than EUR 8,000 million. All these issues were carried out (EBA). without the state’s guarantee. Banco Santander carried out various measures regarding capital Active management of the business portfolio in the last months of 2011, allowing it to achieve a core capital Santander made some selective sales in 2011 and obtained ratio of 9% six months ahead of the EBA’s deadline of June 30, EUR 1,513 million of capital gains: 2012. • The strategic alliance with the insurer Zurich to develop According to the EBA, Banco Santander’s additional capital business in Latin America which generated EUR 641 million needs amounted to EUR 15,302 million. This amount has been of capital gains. reached as follows: • The entry of new partners into the capital of Santander • EUR 6,829 million of Valores Santander, which have to be Consumer USA. This operation valued the bank at $4,000 converted into shares before October 2012. million and meant EUR 872 million of capital gains. • EUR 1,943 million through the exchange of preferred shares Santander also reached an agreement to sell the Group’s for ordinary new shares. businesses in Colombia for $1,225 million (net gain of • EUR 1,660 million through the application of the Santander EUR 615 million to be recorded in 2012). Dividendo Elección programme (scrip dividend) at the time of the final dividend corresponding to fiscal year 2011. • EUR 4,890 million through organic capital generation and the transfer of certain stakes, mainly in Chile and Brazil. Core capital Loan-to-deposit ratio(*) Regarding the latter, Santander reached in December 2011 BIS II. criteria. % % an agreement (implemented during the first week of 2012) to transfer 4.41% of Santander Brazil to a major international 135 10.02 financial institution which will deliver such shares to holders of convertible bonds issued in October, 2010, by Banco Santander, 117 117 when these mature, pursuant to the terms of said convertible 8.80 bonds. 8.61 Santander is one of the world’s most solid and well-capitalised banks, and at no time has had to recourse to public funds, as a result of which it is one of the international banks with the best rating. 2009 2010 2011 2009 2010 2011 (*) Includes retail commercial paper in Spain. 22 ANNUAL REPORT 2011
  • 25.
    Grupo Santander’s newdata-processing centre in Cantabria, Spain Prudence in risk These additional needs will be entirely met in 2012 as follows: Prudent risk management has been a hallmark of Banco • EUR 1,800 million already charged against the Group’s fourth Santander since it was founded more than 150 years ago. quarter 2011 results, which lifted coverage of repossessed Everyone is involved in risk management, from the daily properties to 50% from 31%. transactions in branches, where business managers also have risk objectives, to senior management and the board, whose risk • EUR 2,000 million are a capital buffer required by the rules committee comprises five directors and meets for some 300 and which are covered by capital already held by the Group. hours a year. • The remaining EUR 2,300 million will be covered through capital gains which may be obtained during the year – Of note among the corporate risk management principles is that including EUR 900 million from the capital gain on the sale of the risk function is independent of business. The head of the Banco Santander Colombia – and through ordinary Group’s Risk Division, Matías Rodríguez Inciarte, third vice- contributions to provisions during 2012. chairman and chairman of the risk committee, reports directly to the executive committee and to the board. Santander’s exposure to the real estate promotion sector represented 14% of its total lending in Spain at the end of 2011 A low and predictable risk profile and only 4% of the Group’s total loans, including repossessed The board sets the Bank’s risk appetite at a medium-low level. homes. Santander’s market share of this business is estimated Some 86% of Grupo Santander’s risk comes from retail banking. at 10%, well below that of the Group’s total business in Spain Proximity to the customer enables us to act rigorously and with (14%). anticipation when admitting, monitoring and recovering loans. Santander has units dedicated to recovering unpaid loans, Moreover, Santander assigned EUR 1,513 million of capital gains which, under a corporate model, are integrated as one more obtained in 2011 to strengthening the balance sheet. business areas in the Group’s various countries and divisions. *** Santander’s risk profiles are highly diversified and their Banco Santander’s risk management principles are treated in more detail on pages 148 to 151 of this annual report. concentration in customers, business groups, sectors, products and countries is subject to limits. The Group has the most advanced risk management models, such as use of tools for calculating ratings and internal scoring, economic capital, price-setting systems via return on risk- adjusted capital (RoRAC), use of value at risk (VaR) in market risk, and stress testing. Non-performing loan ratio Coverage ratio Risk quality % % The Group’s non-performing loan ratio increased to 3.89% in 2011, but remains below the average on all the countries where 3.89 75 73 it operates. In Spain, the NPL ratio was 5.49%, also well below 61 3.55 the sector’s average. 3.24 After approval of Royal Decree Law 2/2012, which sets new requirements for cleaning up bad property loans in Spain, the Bank announced that the amount of provisions Grupo Santander in Spain needs to meet these requirements is EUR 6,100 million. 2009 2010 2011 2009 2010 2011 ANNUAL REPORT 2011 23
  • 26.
    Geographic diversification Grupo Santander has a geographic diversification balanced between mature and emerging markets (46% and 54% of profits, respectively, in 2011). The Bank concentrates on 10 core markets: Spain, Germany, Poland, Portugal, the UK, Brazil, Mexico, Chile, Argentina and the US. The global areas also develop products that are distributed in the Group’s commercial networks and tend to global sphere clients. Contribution to the Group´s attributable profit % United States 12% Mexico 10% Brazil 28% Chile 7% Argentina 3% Rest of Latin America 3% 24 ANNUAL REPORT 2011
  • 27.
    Main countries. Other countries where Banco Santander has retail banking businesses: Peru, Puerto Rico, Uruguay, Colombia, Norway, Sweden, Finland, Denmark, Netherlands, Belgium, Austria, Switzerland and Italy. United Kingdom 12% Poland Germany 3% 5% Spain 13% Portugal 2% Rest of Europe 2% ANNUAL REPORT 2011 25
  • 28.
    Banco Santander branchin Sao Paulo, Brazil Model of subsidiaries • They guarantee a high level of transparency and corporate Grupo Santander’s international expansion was carried out via governance and reinforce the brand in various countries. subsidiaries that are independent and autonomous in capital and liquidity: Banco Santander combines the financial flexibility of its subsidiaries with their operations as an integrated group that • Capital: the local units have the capital required to develop creates high synergies. The corporate systems and policies that their activity autonomously and meet regulatory requirements. Banco Santander implements in all the Group’s institutions • Liquidity: each subsidiary develops their financial plans, enable the following: liquidity projections and calculates their finance needs, • Synergies in costs and revenues, by developing with global without counting on funds or guarantees from the parent strategies the Santander retail banking model and sharing the bank. The Group’s liquidity position is coordinated by the best practices among countries and units. ALCO committees (assets and liabilities). • Strengthen the Santander culture, with particular importance The model of subsidiaries autonomous in capital and liquidity, attached to managing risks at the global level and controlling with some of them listed, such as Santander Brazil, Santander the business units. Chile and Banesto, has strategic and regulatory advantages: • Greater efficiency in investment by sharing systems globally. • The autonomy of the subsidiaries limits, during a crisis, the possibilities of contagion between the various Group units, All of this enables the Group to obtain better results than each thereby reducing systemic risk. local bank would have achieved on its own. • The subsidiaries are submitted to a double level of supervision (local and global) and internal control. • This model facilitates management of and resolving the crisis while generating incentives for good local management. • The listed subsidiaries allow for access to capital efficiently and quickly, always choosing the best alternative for shareholders, and they are subject to the market’s discipline. • The shares of the subsidiaries are an attractive bargaining chip for acquisitions in the local market and an alternative to investing the Group’s capital. • They give visibility in the Group’s valuation to various business units. Banco Santander branch in Madrid, Spain Banco Santander branch in London, United Kingdom 26
  • 29.
    The Santander brand Efficiency The Santander brand transmits the Bank’s corporate values Santander’s IT and operations platform enables it to be very to customers, shareholders, employees and society in general. productive and know in detail and with an integral view These values are: dynamism, strength, innovation, leadership, customers’ financial needs. The Bank is also making a commercial focus and quality service, professional ethics and continuous effort to improve its processes, direct customer sustainability. attention and its business support areas in order to provide the best service. Santander has a significant presence in the brand rankings of the main consultancy firms, such as Interbrand, Millward Brown Santander continues to advance in implementing its corporate and Brand Finance. In 2011, the brand continued to consolidate technology platforms in all its business units, which is creating itself in the Group’s key markets, boosting its renown in Brazil, value through revenue synergies and cost savings. In 2011, the UK and Germany. In the US and Poland, the transition integration of Santander’s IT platforms and those of Real in toward the Santander brand continued to make progress. Brazil were consolidated. The branches acquired from the Meanwhile, Santander continues to unify its identity in global Swedish group SEB in Germany and from Bank Zachodni WBK segments, such as Select for personal banking, in order to align in Poland were integrated into the Group. the positioning in these markets with the Group’s values. A new data-processing centre began to operate in 2011 in Banco Santander has an international advertising strategy, which Cantabria, Spain, which joins the Group’s network of such helps to strengthen and consolidate the Bank’s international centres that provide service from Madrid-Boadilla del Monte positioning and supports business. In 2011, when banking was (Spain), London (UK), Querétaro (Mexico) and Sao Paulo (Brazil). particularly hard hit, the Bank’s corporate message was focused The new centre boost the capacity for processing the Group’s on solvency and the geographically diversified business model, operations, guarantees business growth in the future and without forgetting our positioning of proximity, confidence and reduces to a minimum the operational risk with customers. commitment to the customer. The Bank’s recurring growth in revenues, the culture of Corporate sponsorships have proved to be a key platform for controlling costs and the high degree of productivity of increasing Santander’s renown, consolidate the Bank’s branches makes Santander one of the world’s most efficient international positioning and support business. banks, with a cost-to-income ratio of 44.9%. • In 2011, Santander sponsored for the second year running The continuous improvements in efficiency are leading to the Formula 1 Ferrari team, an excellent business tool, as greater value-added for customers. The Bank, in some of its underlined by more than 370,000 Santander-Ferrari credit core markets, decided to eliminate commissions for its linked cards sold throughout the world. Santander continues to customers: in Spain, with the We want to be your Bank plan in sponsor the McLaren team, the main advertising tool in the the Santander Branch Network and in the UK wih the Santander UK. Zero Current Account. • In Latin America, Santander continued to work to be the football bank, sponsoring the Santander Libertadores Cup, the 2011 America’s Cup in Argentina, the South American Cup and the agreement in Brazil with the football player Neymar. In 2012, and via the strategic committee of corporate marketing and brand, chaired by the CEO, the Bank will continue to foster brand unification in all countries, bolstering its global positioning, maximizing corporate sponsorships and working to create a good brand experience for all customers. ANNUAL REPORT 2011 27
  • 30.
    Santander’s businesses in2011 Grupo Santander results Grupo Santander conducted its business in 2011 against a backdrop of slower growth in the global economy, continuous tensions in the European sovereign debt markets and in the Santander posted an attributable profit of world’s main stock markets and increasing regulatory pressure. EUR 5,351 million in 2011, 34.6% less than Geographic diversification, with the growing importance of in 2010, after setting aside EUR 3,183 emerging countries, Banco Santander’s retail banking model and the incorporation of new businesses pushed up gross million for provisions. income to EUR 44,262 million, a new record. Operating expenses grew 9.3% as a result of the integration of Of note was the EUR 1,812 million gross provision new businesses and investment in technology. However, the for real estate assets in Spain. performance varied between countries such as Spain and The recurring profit was EUR 7,021 million Portugal, where they fell; mature countries where the Bank is (-14.2%). strengthening its commercial franchise (Germany, the UK and Profit before provisions was EUR 24,373 million, the US), and emerging countries, where the Group continues to invest in increasing commercial capacities. The cost-to-income one of the largest among international banks. (efficiency) ratio was 44.9%, making Santander one of the Santander reached the core capital ratio of 9% set world’s most efficient international banks. by the EBA six months ahead of the deadline. Profit before provisions was EUR 24,373 million, underscoring The loan-to-deposit ratio was 117%,18 p.p. lower Grupo Santander’s capacity to generate results. Banco than in 2009. Santander’s attributable profit in 2011 was EUR 5,351 million. The Bank aims to increase its ROE to 12-14% in It would have been EUR 7,021 million (-14,2%) but for the 2014 and its ROTE to 16-18%. fourth quarter EUR 1,812 million gross provision for real estate assets in Spain (which raised coverage of repossessed properties from 31% to 50%), as well as amortisation of EUR 601 million gross of goodwill of Santander Totta in Portugal. The Bank also assigned EUR 1,513 million net of capital gains to other provisions. 28 ANNUAL REPORT 2011
  • 31.
    Santander branch inLondon, United Kingdom Commercial activity and balance sheet strength Medium- and long-term objectives From the business standpoint, the main strategy is still to In September 2011, Grupo Santander held a meeting in London capture and link more and better customers and offer them a for more than 300 investors and analysts. Senior management good service, and improve the structure of funding loans with explained in detail at this Investor Day the Group’s strategy and more stable deposits (+3% in 2011). The growth in lending objectives for the medium- and long-term, as well as for the (+3%) varied between mature countries, where demand by various business units. households and companies was weak, and emerging countries, where the increase was notable. Under a scenario for 2012 of continued weak growth in the global economy and assuming as of 2013 a normalization of the This evolution of loans and deposits enabled the Group to economic environment, Santander expects to lift its return on improve its liquidity position. The loan-to-deposit ratio was equity (ROE) from 7.1% (9.4% taking into account the recurring 117%, 18 p.p. lower than in 2009. Moreover, the Group profit) to 12%-14% in 2014 and its return on tangible equity maintained during 2011 its capacity of recourse to the markets from 10.8% (14.2% bearing in mind the recurring profit) to for funding, underlined by the fact that the year’s total issues 16%-18%, through: exceeded maturities by EUR 8,000 million. • A gradual normalization of profits in mature markets, Grupo Santander’s core capital ratio at the start of 2012 was including lower needs for provisions. 9% (according to the EBA’s criteria). The 9% ratio, required by • Organic growth in emerging markets. the European Banking Authority for Europe’s main banks, was reached six months ahead of the June 30, 2012 deadline. • Better optimization of costs and revenues. ANNUAL REPORT 2011 29
  • 32.
    Continental Europe Spain-Santander Branch Network In 2011, the Santander Branch Network contributed EUR Continental Europe’s attributable profit 660 million to the Group’s profits, 22.1% less than in 2010. was 15.1% lower at EUR 2,849 million. The environment in which business was conducted in Spain was characterized by weak GDP growth, higher unemployment, Santander has a large network of restructuring in the financial sector and tough competition for branches in Continental Europe (6,608), deposits. In this scenario, the network’s priorities were to which tend to 32 million customers. It actively manage customer spreads, strengthen the balance sheet through capturing deposits, credit risk quality, austerity in carries out retail banking business in costs and capturing, linking and retaining customers. Spain, Portugal, Germany and Poland, and consumer finance in 13 countries. Gross income grew 2.4%, consolidating the change seen at the end of 2010. Operating expenses were 1.2% lower and the The Group also has wholesale banking, number of branches remained virtually the same. The efficiency asset management and insurance ratio improved to 46.5%. businesses. The worsening of the economic environment continued to exert upward pressure on the Group’s non-performing loan ratio in Spain The commercial strategy is centred on (to 5.49%), although it was still below the sector’s average. capturing funds in an environment of weak Exposure to the real estate sector continued to decline and at the demand for loans. Basic revenues (net interest end of 2011 represented only 4% of the Group’s total lending, income, fee income and insurance) grew including repossessed properties. 8.4%. Commercial and customer strategy In Spain, the change of trend in revenues was The Santander Branch Network serves 9.6 million customers, of consolidated. which almost 8.2 million are individuals, mainly salaried workers, the young and pensioners, more than 260,000 are private and In Portugal, Santander Totta is the most personal banking customers and 1.1 million are companies, solvent bank and has the country’s best rating. SMEs, businesses and institutions. In Poland, Bank Zachodni WBK, with 526 branches and 2.4 million customers, was incorporated to the Group. Santander Consumer Finance notched up record revenues and profits. Santander was named by the prestigious magazine The Banker the best bank in Western Europe, Spain and Portugal in 2011. Attributable profit Net operating income Million euros Million euros - 22.1% 2011/2010 + 5.7% 2011/2010 847 2,353 2,227 660 2010 2011 2010 2011 30 ANNUAL REPORT 2011
  • 33.
    Santander branch inMadrid, Spain Banesto branch in Madrid, Spain Since 2006, Queremos ser tu Banco (We want to be your Bank) Spain-Banesto has been the strategic plan for capturing new customers and Banesto contributed attributable profit of EUR 130 million establishing stable and lasting relations with them. The 3.8 to the Group, 68.9% less than in 2010. million customers in this plan benefit from not having to pay service commissions, which makes them more satisfied and This bank focuses on individual customers, SMEs and companies, increases the linkage and, thus, more profitable for the Bank. which, overall, provide 90% of its revenues. Santander also has a commercial intelligence, backed by its Despite the complex domestic environment in 2011, Banesto vanguard technology and with an innovative multichannel improved its competitive position in terms of profitability, strategy in products and services. efficiency and quality of risk and increased its customer base In 2011, 227,000 loans were granted for a total of EUR 25,000 and linkage, as well as enhancing the quality of service in its million. Yet again Santander was the sector’s leader in branch network: intermediating the ICO finance lines (market share of around • 193,000 new customers were captured and 72,000 20%). companies, SMEs, commerce and the self-employed. More than 50% of customers have their pay cheque paid into Santander has been very active in capturing customer funds, their account. reducing at the same time the cost of deposits by taking advantage of its position as a solvent and solid bank. In the last • The efficiency ratio was 47.4%. two years, Santander has increased its market share of deposits • Real estate risk was reduced, and only represents 6.1% by more than a percentage point. of total lending. In order to support customers with temporary problems due to • The non-performing loan ratio was 5.01%, one of the economic crisis in Spain, the Santander Branch Network the sector’s lowest. offered, as of August 1, a three-year moratorium on repaying the capital of mortgages for the main residence. At the end of Medium- and long-term objectives 2011, close to 6,000 customers benefited from this offer for a Banesto will continue to strengthen its competitive position in total of almost EUR 1,000 million. order to: Medium- and long-term objectives • Achieve an efficiency ratio below 40% in 2013, with revenue growth supported by management of prices and strict control • Sustained growth in revenues and improvement in the of costs. efficiency ratio to 39%-41%. • Improve the loan-to-deposit ratio. • Boost deposits by 5%. • Maintain risk quality above the sector’s average. • Consolidate the customer base and increase transactional linkage. • Strengthen leadership in high-income segments and foster multichannel business. ANNUAL REPORT 2011 31
  • 34.
    Continental Europe Portugal Poland Santander Totta contributed an attributable profit of EUR Bank Zachodni WBK posted an attributable profit of EUR 174 million, 61.8% less than in 2010. 232 million in the last three quarters of 2011. The Bank’s gross income declined 18.3% due to the reduction in Santander conducts its retail banking business in Poland through net interest income, caused by the increase in funding costs Bank Zachodni WBK, which has the country’s third largest from greater competition in capturing deposits, and the drop in distribution network (622 branches, including 96 agencies), business. Operating expenses fell 2.1%. Santander Totta’s non- 2.4 million customers and more than EUR 20,000 million of performing loan ratio (4.06%) was below the sector’s average. loans and deposits. Grupo Santander also carries out consumer Provisions rose 87.7%, due to prudent management in an finance business through Santander Consumer Bank Poland. unfavourable environment. Bank Zachodni WBK has been part of Grupo Santander since Following Portugal’s financial rescue, the authorities asked April 1, 2011, consolidating the results and business Portuguese banks to implement various adjustment measures to corresponding to the last three quarters of the year. In an reduce their leverage, increase their capital and reduce recourse environment of strong economic growth and banking business, to the European Central Bank (ECB). Santander Totta is at rates of close to 10%, its profits grew at an annual rate 22%, progressing in this process: thanks to robust revenues. • The focus on capturing deposits (+8% to EUR 23,465 million), Bank Zachodni WBK’s net lending to customers amounted to coupled with the fall in lending (-6% to EUR 28,403 million) is EUR 8,479 million and deposits to EUR 10,359 million. Loans reducing the commercial gap. and deposits rose 14% in the first nine months under Santander management, due to growth with companies as well as • Santander Totta increased its core capital ratio to 11.2% and individuals. The efficiency ratio was 47.0% and the non- remained the most solvent bank in the country and with the performing loan ratio 4.89%. best rating. • The level of exposure to the ECB was also reduced (to 3.8% Bank Zachodni WBK’s business model fits perfectly into Grupo of assets at the end of 2011). Santander’s commercial banking model: focus on retail customer and company, supplemented by a notable presence in asset The magazines The Banker, Euromoney and Global Finance management business and brokerage of securities and leasing. chose Santander Totta as the best bank in Portugal. This bank offers a significant potential in results in the coming years, both through business as well as from the synergies from its Medium- and long-term objectives integration into the Group’s IT platform. • Improve the revenue structure with greater recurrence. Medium- and long-term objectives • Reach an efficiency ratio of below 50% in 2013. • Double-digit growth in gross income. • Continue to reduce the commercial gap in line with the Bank of Portugal’s requirement (43% of this amount already • Efficiency ratio of between 41% and 43%. attained). • Gain market share. • Consolidation as one of Poland’s three main banks in terms of profits, efficiency, solvency and customer service. Santander Totta branch in Lisbon, Portugal Bank Zachodni WBK branch in Poland 32 INFORME REPORT 2011 ANNUAL ANUAL
  • 35.
    Santander Consumer Finance Germany, the United States and other countries Santander Consumer Finance generated a record Santander has 303 branches in Germany, EUR 30,403 million of attributable profit of EUR 1,228 million, 51.5% more than loans, EUR 31,174 million of deposits and more than 7 million in 2010. customers. Santander is the market leader in consumer finance and the second in auto finance in Germany. Since January 2011, Santander carries out its consumer finance business in 13 it has a retail banking unit. Its profit increased 10.0% in 2011, European countries, notably Germany, and also in the US. The with significant growth in loans and an improvement in credit risk. business model is based on offering financial solutions through more than 135,000 distributors (auto concessionaires and Santander Consumer USA’s profit surged 99.2% in dollars to shops). Once a relation is started with a customer, direct EUR 484 million, spurred by the increase in managed credit commercial actions are taken to link them and make them loyal. volumes, the rise in revenues from managing third party portfolios With a business centred on auto finance, Santander Consumer and a lower cost of credit. The entry of new partners into the Finance has signed 37 agreements with nine car producers in capital was announced in September, which valued the unit the last three years. SCF also has other products such as at $4,000 million. personal loans, credit for buying consumer durables and credit cards. The rest of countries also produced positive results, particularly: • Nordic countries (+14.5% in profits in local currency). Results and activity in 2011 In a globally unfavourable economic environment, gross lending • UK (+38.1% in sterling) stood at EUR 62,959 million, 16% (*) more than in 2010, thanks • Spain, with a positive result in a very weak market. to organic growth and the incorporation in Germany. Deposits • Santander Consumer Bank Poland almost doubled its profits. rose 28% to EUR 33,198 million (Germany accounted for 94%). Gross income increased 14.0% (+13.6% net interest income and Medium- and long-term objectives +18.0% net fee income). • Maintain high profitability. Santander Consumer Finance has the best efficiency ratio • Consolidate the Top 3 position in key markets. (31.8%) and return on assets compared to its main competitors. • Strengthen leadership in the reference financial entity model The non-performing loan ratio continued to decline to 3.77%. for car producers. (*) Isolating Santander Consumer USA which consolidated by the equity accounted method in • Maintain leadership in efficiency and reinforce specialization December 2011. in payments and recoveries. Lending by countries Lending by segments % % Germany 48% Cars – new 25% Credit cards Netherlands 2% 2% Austria 2% Cars- second hand 22% Stock Finance 5% Portugal 2% UK 6% Other 7% Spain 12% Poland 5% Electrical household appliances 5% Direct businesses 17% Nordic countries 11% Italy 12% Mortgages 17% Santander B. Zachodni Santander Total Continental Europe Branch Network Banesto Portugal WBK Consumer Finance Rest Customers (million) 9.6 2.4 2.0 2.4 15.5 0.1 32.0 Branches (number) 2,915 1,714 716 526 647 90 6,608 Employees (number) 18,704 9,548 6,091 9,383 15,610 4,530 63,866 Customer loans on the balance sheet(*) 102,643 68,850 28,403 8,479 60,276 46,429 315,081 Managed customer funds(*) 107,469 82,444 31,188 12,383 39,008 61,571 334,064 ( ) Net operating income * 2,353 1,112 443 366 3,604 857 8,735 Attributable profit(*) 660 130 174 232 1,228 424 2,849 Efficiency (%) 46.5 47.4 54.4 47.0 31.8 54.6 43.1 (*) Million euros ANNUAL REPORT 2011 33
  • 36.
    United Kingdom Results Santander UK carried out is activity in 2011 in an environment Santander UK’s attributable profit was of low economic growth, interest rates at minimums and EUR 1,145 million. substantial regulatory uncertainty. Profit was EUR 1,145 million, after constituting a £538 million The Bank has 1,379 branches, which fund for possible payment protection insurance remediation tend to 27 million customers, and is the (PPI). This measure was also taken by the other main UK banks, third largest bank in the UK by retail although in the case of Santander UK the amount was relatively less than that announced by its competitors. deposits and mortgages. Gross income was EUR 5,678 million, pressured downward by market circumstances such as the new regulations for liquidity The Bank has a comfortable position in and the increased cost of funding, as well as low interest rates. liquidity and high levels of capitalization. Net operating income after provisions was EUR 2,538 million, It granted one out of every six mortgages 8.4% less than in 2010 in local currency. in the UK and increased its market share in lending to SMEs by a full percentage point. Loan-loss provisions were 36.3% lower than in 2010. The non- It is committed to quality of service: it performing loan ratio (1.86%) evolved better than expected in the current economic environment and all products for repatriated its call centres to the UK and individuals, particularly mortgages and personal loans, created 1,100 jobs to improve customer improved. attention. Santander UK was recognized by The Banker Santander UK has a comfortable liquidity position and high magazine as the best bank in the UK for the levels of capitalisation. The loan-to-deposit ratio was 130% third year running. at the end of 2011. Its goal is to become the most efficient and profitable bank in the UK in 2014. United Kingdom Customers (million) 26.7 Branches (number) 1,379 Employees (number) 26,295 Customer loans(*) 252,154 Managed customer funds(*) 288,826 Net operating income(*) 3,123 Attributable profit(*) 1,145 Efficiency (%) 45.0 ( ) Million euros * 34 ANNUAL REPORT 2011
  • 37.
    Santander branch inLondon, United Kingdom Commercial activity Strategy Despite the difficult environment, Santander UK continued to Santander UK’s strategy is aimed at transforming the bank into a support business with households and companies. The Bank more diversified financial franchise, capable of providing all kinds granted one out of every six mortgages in 2011, which of services and focused on the customer, via: represented a market share in new lending higher than • Boosting customer linkage, moving from a model centred on Santander UK’s total mortgage share (14%). The customer products to one focused on the customer. spread improved, while these new loans had a very conservative loan-to-value of only 65%. • Strengthen business with companies. The integration of the 318 branches acquired from Royal Bank of Scotland will raise New loans to SMEs grew 25% to more than £2,000 million and by five percentage points the market share of company surpassed the targets set by the UK government. The market business. share in this segment rose by almost one percentage point to 4.3%. At the end of the year, Santander UK launched • Maintain high operational efficiency and improve the quality Breakthrough, a new initiative for further promoting loans to of service. Santander UK will invest £490 million in its IT SMEs and which makes available to this type of customer a platform. programme of full support, with training, tutorials, international experience and practices. Medium- and long-term objectives Santander UK wants to be the most efficient and profitable During 2011 836,000 current accounts were opened as a bank in the UK in 2014 with: result of the focus on capturing and linking new and existing customers. Within this strategy, more than 100,000 123 • An efficiency ratio of below 44%. Cashback credit cards, which return money to customers on • Revenue growth of between 15% and 20% a year in the basis of usage, were sold in the first two months after company banking. the launch. • The system’s lowest non-performing loan ratio. In July 2011, Santander UK repatriated its call centres to the UK from India. As a result, 1,100 jobs were created and the building of a new corporate centre in Leicester was announced, all of it in order to enhance customer service. Attributable profit Net operating income Million euros Million euros - 41.7%(*) 2011/2010 - 16.4%(*) 2011/2010 3,735 1,965 1,145 3,123 2010 2011(1) 2010 2011 (1) Affected by the provision in the second quarter of 2011 for possible payment protection insurance (*) Excluding the exchange-rate impact: -15.4% remediation (PPI). ( ) Excluding the exchange-rate impact: -41.0% * ANNUAL REPORT 2011 35
  • 38.
    Latin America Brazil The attributable profit of EUR 2,610 million accounted for Latin America contributed 51% of the 28% of the global total. Brazil is a strategic market for the Group’s profits and is one of Santander’s Group. main growth commitments. The Group Santander Brazil is the country’s third largest private sector has leadership positions in the most bank in terms of assets, with 3,775 branches and points of dynamic and solid economies such as attention, 18,419 ATMs and 25.3 million customers. In Brazil, Mexico, Chile and Argentina, 2011, technology integration and brand unification was completed with Banco Real. through 6,046 branches, which serve 42 million customers. The Brazilian economy, the world’s sixth largest, continued to provide a favourable environment for the Group’s business. GDP grew around 3% and growth of 3-4% is expected to be Latin America’s profit of EUR 4,664 million was maintained in the next few years. 0.1% higher than in 2010 in constant currency. The country has big investment and infrastructure plans, partly The Group’s lending continued to grow due to holding the 2014 World Football Cup and the 2016 (+18%). Olympic Games. Santander Brazil posted an attributable profit In this scenario, the financial sector grew strongly (+18% in of EUR 2,610 million. loans) and is expected to continue to do so on a sustained basis Santander Mexico increased its profit 45.6% in in the coming years, thanks to the rise in the size of the middle pesos, spurred by strong lending and deposits. class and in the country’s “bankarisation” levels. The magazine The Banker recognized Santander Chile as the bank of the year and the safest one in Latin America by Global Finance. Argentina’s attributable profit was 8.0% higher in local currency (+24.7% in gross income). Santander branch in Brazil 36 ANNUAL REPORT 2011
  • 39.
    Banco Santander branchin Brazil Activity and results Strategy Santander Brazil’s attributable profit of EUR 2,610 million was Technology integration and brand unification with Banco Real 7.3% lower in local currency. Gross income rose 11.2% and was completed successfully in 2011 and now, with an optimum operating expenses 12.3%, due to investments in the new IT commercial banking platform and a wider range of products platform and the opening of 154 branches in 2011, coupled and services, Santander Brazil is best placed to carry out its with inflationary pressure and wage agreements. Net operating business. income increased 10.6%. Provisions were 21.4% higher due to the moderate rise in the non-performing loan ratio (5.38%). The Bank’s structure in Brazil is difficult for its international competitors to replicate as it has latest generation technology, Lending grew 20%, spurred by the 23% rise to individual distribution networks with sufficient capacity to guarantee customers and the 26% growth to SMEs and companies. attention throughout the country and a good brand positioning. Bank savings, including financial letters, increased 8% (+30% Its strategy is based on the following pillars: time deposits). Santander Brazil has a 10.5% market share in loans (11.7% for unrestricted credit) and 7.9% in deposits. • Be the best bank in quality of service, backed by the strength of its IT platform. • Intensify relations with customers with the opening of 100 to 120 branches a year between 2011 and 2013. • Strengthen businesses in the key segments such as SMEs, acquiring business (point-of-sale terminals in shops), cards (association agreements were signed with Shell and other companies, and the offer to non-customers was stepped up), real estate and consumer loans, particularly auto finance. Attributable profit Net operating income • Continue to construct and strengthen the Santander brand. Million euros Million euros • Maintain strong growth combined with prudent risk -7.2% (*) 2011/2010 +10.6% (*) 2011/2010 management. 9,963 2,814 Medium- and long-term objectives 9,007 2,610 Santander Brazil aims to become the best universal bank in the country, the most efficient in generating shareholder value and the best in customer and employee satisfaction. In 2012-2013 Santander expects: • 15% growth in profits. 2010 2011 2010 2011 • 15%-17% rise in lending. (*) Excluding exchange-rate impact:-7.3% (*)Excluding exchange-rate impact: +10.5% ANNUAL REPORT 2011 37
  • 40.
    Santander Select branchin Mexico Santander branch in Chile Mexico Chile Santander Mexico’s attributable profit increased 45.6% in Santander Chile posted an attributable profit of EUR 611 local currency to EUR 936 million and contributed 10% of million, 9.3% less in pesos and 7% of the Group’s total. total profits. With 499 branches and 3.5 million customers, Santander is Santander is the third largest bank in the country with more Chile’s main bank in terms of assets and profits. It has a market than 9 million customers, 1,125 branches and a market share share of 19.7% in loans and 17.3% in savings. of 15.2% in banking business. Gross income rose 1.9% in local currency, with fee income up Gross income rose 4.5% (+7.5% in net interest income), in line 2.4%. Operating expenses were 10.1% higher and loan-loss with the recovery in commercial business. Operating expenses provisions 17.3%. rose 11.6% due to the increase in installed capacity, while provisions declined 25.7% in line with the improvement in the Lending increased 7% and bank savings 11% (+29% in time Bank’s risk premium. deposits). Lending increased 31%, partly driven by acquiring the mortgage Santander Chile’s strategy is aimed at boosting the profitability of business of GE Capital Corporation (+22% on a like-for-like various businesses, particularly through loans to and savings from basis). Bank savings grew 8%. individuals and SMEs, with the emphasis on deposits to reinforce the liquidity position. The improvement in the quality of service Santander Mexico took advantage of the favourable economic remains a priority for increasing linkage and transactions. situation to strengthen customer linkage and deepen it in high value segments (high income customers and SMEs), while In December 2011, Grupo Santander sold 7.82% of Banco remaining prudent in risks and efficient in management of costs. Santander Chile as part of its plans to increase the Group’s core capital ratio. The $950 million operation was one of the largest The magazine Global Finance recognized Santander Mexico as so far in the local market. Santander now owns 67% of the the safest bank. bank. The magazine The Banker recognized Santander Chile as the Medium- and long-term objectives bank of the year in Chile. • Continue to implement the strategic plan to become a universal bank (commercial and investment). Medium-and long-term objectives • Maintain double-digit profit growth. Santander Chile wants to push its commercial banking business, • Achieve strong growth in business with SMEs, companies, particularly for medium-high income customers and SMEs, real estate loans, consumer credit and insurance. control costs and maintain a conservative risk policy for 2011- 2013: • Double-digit growth in net operating income with good efficiency ratios. • Achieve double-digit growth in gross income. • Improve the efficiency ratio to 35%-37%. 38 ANNUAL REPORT 2011
  • 41.
    Santander Río branchin Argentina Santander branch in Puerto Rico Argentina Other countries The Bank generated an attributable profit of EUR 287 Uruguay million, 8% more in local currency. Santander Uruguay is the main private sector bank by profits, business and branches, with market shares of 18.6% in loans Santander Río is the country’s largest private sector bank in and 16.0% in savings and 78 branches. Its strategy in 2011 terms of assets and profits, with a market share of 8.9% in loans centred on driving retail business through new products and and 10.1% in bank savings. It has 358 branches which tend to channels and increasing business with companies. Profit was 2.5 million individual customers and more than 125,000 SME 69.9% less in local currency at EUR 20 million. and company clients. Puerto Rico In an environment of high growth, mainly fuelled by internal Santander is one of the main banks in Puerto Rico. It has 121 consumption and high employment, gross income increased branches and market shares of 10.2% in loans, 11.8% in 24.7%, largely due to fee income (+32.6%). deposits and 21.6% in mutual funds. In the context of The strategy is aimed at capturing and linking the largest recession, its attributable profit was EUR 34 million, 5.6% lower number of customers through a multichannel commercial in dollars. The Bank was recognized for the fifth year running as network. Santander Río increased its network by 10% in 2011. the best in Puerto Rico by Global Finance and for the sixth This expansion largely took place in the interior of the country straight year by The Banker. and within what the Bank considers its strategic corridor: high- income regions, with strong growth prospects and strong trade Peru links with Brazil. Attributable profit was EUR 11 million, up from EUR 7 million in 2010. Business centres on companies and the Group’s global The magazines The Banker, Euromoney and Global Finance clients. named Santander Río as the best bank in Argentina. Colombia At the end of 2011, Santander reached agreement to sell its Medium- and long-term objectives units and businesses in Colombia to the Chilean group • Improve efficiency through investments in technology and CorpBanca for $1,225 million. The transaction will become management of costs. effective in 2012. This business did not reach a sufficient critical • Maintain high levels of profitability through leadership in mass for the full development of Santander’s retail banking in transactional banking, and credit and savings growth. the country. Colombia contributed EUR 58 million of attributable profit. Latin America Brazil Mexico Chile Argentina Uruguay Colombia Puerto Rico Peru Rest Total Customers (million) 25.3 9.3 3.5 2.5 0.2 0.3 0.5 0.1 0.1 41.7 Branches (number) 3,775 1,125 499 358 78 80 121 1 9 6,046 Employees (number) 54,265 13,162 12,089 6,777 1,206 1,515 1,764 48 1,061 91,887 Customer loans* 78,408 18,185 25,709 4,787 1,452 2,213 4,335 538 4,240 139,867 Managed customer funds* 135,859 32,214 31,908 6,639 2,742 4,253 9,886 483 9,264 233,248 Net operating income* 9,963 1,387 1,264 472 40 91 169 14 132 13,533 Attributable profit* 2,610 936 611 287 20 58 34 11 98 4,664 Efficiency (%) 37.5 41.8 39.2 49.0 76.5 56.2 50.9 34.8 64.5 39.7 (*) Million euros ANNUAL REPORT 2011 39
  • 42.
    United States-Sovereign Sovereign’s profit was 30.3% higher in dollars than in 2010. These results were supported by solid revenues (+9.2%) thanks Sovereign’s profit amounted to EUR 526 to optimum management of volumes and prices. The 9.5% million in 2011. growth in costs reflects the investment in technology and the strengthening of commercial structures. The efficiency ratio was 44.6%. Sovereign has 723 branches, 2,303 ATMs and 8,968 employees serving 1.7 million Sovereign’s risk quality continued to improve. Its non- customers. Its headquarters are in Boston and performing loan ratio dropped to 2.85% and coverage rose its business concentrated in the northeast of to 96%. the US. Lending grew 6%. This growth was funded by a 12% rise in In order to respond to the requirements of US deposits, which ensured the diversification and stability of the supervisors, a structure was created that bank’s financing sources. groups together the various units in the country under the name of Santander US. Medium- and long-term objectives Sovereign received approval from the US After completing the first phase of the restructuring (2009- federal regulator to become a national bank, 2011), Sovereign focused on relaunching itself as a commercial enabling it to tend to new customer segments universal bank. Three main objectives were set for the next two and strengthen its competitive position. years: • Implement the Group’s IT platform. • Launch a range of products and services that satisfy the needs of the various customer profiles (cards, investment products, treasury management services, insurance and trade finance). • Positioning in the segment of medium and large companies, a business where Santander’s capacities and global reach can be best exploited. *** Attributable profit generated by all Grupo Santander’s units in the US (Sovereign Bank, Santander Consumer USA, Santander Private Banking USA, Puerto Rico and the New York branch) was EUR 1,059 million. United States-Sovereign Customers (million) 1.7 Branches (number) 723 Employees (number) 8,968 Customer loans(*) 40,194 Managed customer funds(*) 40,812 ( ) Net operating income * 1,212 Attributable profit(*) 526 Efficiency (%) 44.6 ( ) * Million euros Sovereign branch in the United States. 40 ANNUAL REPORT 2011
  • 43.
    Global businesses Global WholesaleBanking Large operations in 2011 Santander Global Banking & Markets posted a profit of • Santander participated as co-manager in the listing of the EUR 1,872 million (-23.0%). It is the global business unit Swiss company Glencore, the world’s largest raw materials responsible for satisfying customers’ needs which, because company. It was the biggest listing ever in Europe. of their size, complexity and sophistication, require tailored wholesale services or products of higher value-added. • Schneider Electric acquired from Abengoa 40% of Telvent. The unit operates in 22 countries and has local and global Santander was the advisor for the operation and of the teams (2,722 professionals) with wide knowledge of subsequent takeover bid for the rest of the capital. financial markets, and who cover all financing, lending and • SabMiller, the world’s second largest beer group by sales coverage needs. volume, acquired the Australian beer company Foster’s. Santander Global Banking & Markets’ profit was lower in 2011 Santander was the book runner in the loan for a total of because of the higher cost of funding, due to tensions in $12,500 million. European sovereign debt markets and the reduced activity in the • Santander advised Iberdrola (Spain), Sempra Energy (US), business areas of markets, as a result of their instability. Empresas Públicas de Medellín (Colombia) and Pampa Energía (Argentina) on buying seven electricity distribution companies Revenues generated by client business accounted for 87% of in Brazil, Chile, Peru, Panama, Guatemala and Argentina from total revenues and within them those generated within the AEI Energy (US). global relationship model, which includes 759 large international corporations, 186 global sphere banks and 199 Medium- and long-term objectives financial sponsors, performed well. • Increase the market share in products with low capital and Strategy in 2011 liquidity consumption. Santander Global Banking & Markets maintained the main pillars • Create units in Sovereign and Bank Zachodni WBK. of its business model centred on the client, reducing risk and freeing up capital and liquidity. In 2011, it continued to invest in resources and additional capacities to develop projects, aimed at strengthening operational capacities and distributing basic treasury products, with a particular focus on forex and fixed-income business. This effort had its first results in businesses such as fixed-income distribution to companies in Europe. The generation of recurring revenues and strict management of costs are enabling Santander Global Banking & Markets to absorb these investments and have an efficiency ratio of 35.1%, still the reference among our competitors. Global Wholesale Banking Attributable profit Million euros Million euros Customer loans 81,000 -23.0% 2011-2010 2,432 Customer deposits 75,134 Net operating income 3,032 1,872 Attributable profit 1,872 Efficiency (%) 35.1 2010 2011 ANNUAL REPORT 2011 41
  • 44.
    Asset Management Global Private Banking Santander Asset Management integrates the Group’s asset This business includes the entities dedicated to financial management business, offering a wide range of savings advice and wealth management for the Group’s high- and investment products which cover customers’ different income customers. needs and which are distributed globally by all the It carries out business through: commercial networks. • Banif in Spain. Its activity is organized around three business areas: • Santander Private Banking in Latin America, the UK and Italy. • Santander Asset Management for mutual and pension funds, companies and discretional portfolios. There are also domestic private banking units in Portugal and Latin America, which are managed on a shared basis with local • Santander Real Estate, specialized in managing real estate commercial banks. investment products. • Santander Private Equity for venture capital. Despite the negative impact of the markets, managed assets have increased since 2010, backed by the creation of new In 2011, Santander Asset Management advanced in developing business and the increase in the customer base. The volume of its global business model for identifying synergies between assets under management stood at EUR 101,411 million, 4% countries and thereby increasing the value added for customers. more than in 2010, and attributable profit was EUR 279 million. It strengthened its global investment management capacities and created dedicated teams, took advantage of product Global Private Banking continued to further adapt and synergies through the range of Luxembourg funds and implement a corporate business model and a common IT reinforced the relationship models with the distribution and platform in the countries where it operates. customer networks. All of this enhances the quality of customer service, enables The global management capacities and local knowledge of Santander to align portfolios with objectives and the value offer countries enables customer service to be improved and assume of all the units and obtain synergies. medium and long-term objectives, such as entering new countries and accessing institutional business. Santander aims to become the reference private bank in the main markets where it operates, with a sustained increase in Over the next few years, Santander will focus on further managed assets. developing a global investment proposal and operational platforms and common risks; have a selective presence in institutional markets; develop products based on customer segmentation; create a global team of selection of third party products and develop a new relationship model with commercial networks. Asset Management Global Private Banking Million euros Million euros Assets under management 112,256 Assets under management 101,411 Gross income 289 Gross income 816 Attributable profit 53 Attributable profit 279 Efficiency (%) 56.4 Efficiency (%) 50.9 42 ANNUAL REPORT 2011
  • 45.
    Insurance Means of Payment Santander Insurance develops products for protection and Santander Cards covers all businesses related to means of household savings, which are distributed through the payment and offers customers credit and debit cards. It also Group’s branches and alternative channels such as the provides services for capturing and processing payments in telephone and Internet. It has 15 million customers. shops. The unit currently manages 92 million cards and operates in 16 countries. Insurance generated total revenues for the Group (gross income plus fee income received by the commercial networks) of EUR The unit is geographically diverse and is integrated into each 3,083 million, 14.7% more than in 2010. country’s commercial banking strategy. Its global strategy enables best practices to be incorporated and business innovation and Activity in 2011 concentrated on: creativity in accordance with the local features of markets. An • Strengthening the range of products through selective example of this is the Santander Ferrari card, which is issued in agreements with insurance leaders. Spain, Portugal, Germany, Mexico and Brazil and has more than 370,000 customers. • Driving the Group’s strategy in financial savings management, through competitive savings insurance. The most noteworthy strategies of Santander Cards in 2011 were: • Develop Santander own model for distribution of auto • In Brazil, customer linkage and alliances with partners such as insurance in Spain and Latin America. Shell and Vivo, and positioning in acquiring business. • Install the corporate model of insurance in Poland. • In the rest of Latin America, continued leadership in and Banco Santander and the insurer Zurich agreed to form a development of cards business. In Mexico, alliances with large strategic alliance to develop bancassurance business in Brazil, companies to offer the Fiesta Rewards card, and segmented Chile, Mexico, Argentina and Uruguay. The aim is to increase products such as the Black Unlimited card. In Chile, business significantly the revenues from distribution of insurance with retails was deepened and programmes with Lan and products in these countries. This operation produced capital Movistar were renegotiated. gains of EUR 641 million. • In the UK, the Santander 123 Cashback card was launched, which returns to customers part of their spending. Looking ahead, the Santander Insurance model will progress from selling products to providing integral protection for • In Spain and Portugal, continued growth thanks to the customers, supported by segmentation based on the customer development of means of payment campaigns. and not on the products. • In the US, the debit card with the global Santander design was incorporated and positioning with innovative promotion campaigns. • In Poland, the unit’s business model was installed. Santander Cards expects to obtain strong growth in net revenues after provisions with a differentiated strategy in its main markets. Insurance Means of payment1 Million euros Contribution to the Group: pre-tax profit+fee income 2,882 Total number of credit cards (million) 29 Gross income 799 Total number of debit cards (million) 63 Attributable profit 366 Lending (million euros) 14,989 Gross income (million euros) 4,115 1. Perimeter of retail banks excluding Banesto, Santander Consumer Finance and Open Bank. ANNUAL REPORT 2011 43
  • 46.
    Sustainability Santander Universities global division Investment in higher education is the centrepiece of the Bank’s Sustainability, for Banco Santander, means corporate social responsibility strategy, as it is convinced that contributing through its activity to this is the best way to contribute to the economic and social economic and social progress in the development of the countries in which it operates. communities where it operates and taking The global division, with a team of 2,187 professionals in into account the impact of its business on 17 countries, coordinates and manages Banco Santander’s the environment and fostering stable commitment to higher education. Its long-term alliance with universities forged over the last 15 years is unique in the world. relations with its stakeholders. Banco Santander’s contribution to co-operation projects with universities amounted to more than EUR 110 million in 2011. Banco Santander’s sustainability strategy revolves around three main elements: Santander co-operates with universities in launching projects to – Support for higher education. improve education, internationalisation, geographic mobility, innovation and the transfer of knowledge to society. The Bank – Protecting the environment has agreements with universities in Spain, Germany, Portugal, – Supporting local communities. the UK, Brazil, Mexico, Chile, Argentina, Colombia, Peru, Santander has stable and lasting relations with Singapore, Puerto Rico, Uruguay, Poland, the United States, its shareholders and investors, customers, China and Russia. employees, suppliers and society on general. Banco Santander’s co-operation with universities revolves In 2011, Santander invested more than EUR 160 around the following four pillars: million in corporate social responsibility projects: 70% in universities, 18% in the community and • Integral cooperation agreements, which put into effect in the environment and 12% in art and culture. 2011 4,455 academic, financial and technological projects with universities. During 2011, the sustainability committee, headed by the CEO, promoted, among others, • Support for international co-operation programmes between strategic corporate volunteering projects, universities, such as national and international travel financial education, microcredit’s and energy programmes for students and teachers. efficiency. • Fostering co-operation with international academic networks, The Santander share forms part of the DJSI and such as the Latin American University Network for the Incubation of Companies (Red Emprendia). FTSE4Good sustainable investment indices. • Supporting global projects, such as Universia, the largest online network of university co-operation in the Spanish- and Portuguese-speaking world, and the Miguel de Cervantes Virtual Library, the portal with the largest digitalisation of Hispanic culture. International initiatives in which Banco Santander joined or participated in UN Global Compact UNEP Finance Initiative Equator principles State council of the Spanish government for social responsibility in business Carbon disclosure project Forge Group Brazilian Institute of Governance The Bank’s main corporate social responsibility activities Roundtable on Responsible Soy Association are set out in the Sustainability Report, which can be Wolfsberg Group consulted at www.santander.com Banking & Environment Initiative Principles for Responsible Investment (PRI) 44 ANNUAL REPORT 2011
  • 47.
    Emilio Botín withShirley M Tilghman, president of Princeton University Delivery of international scholarships at the University of Salamanca, Spain Santander Universities in 2011 The main developments in 2011 were: • New scholarship programmes were launched to facilitate 990 co-operation agreements with graduates finding their first job, foster the international universities in 17 countries on four mobility of young doctoral students and researchers and strengthen the exchange of students between Asia and Latin continents. America. • Launch of the Santander Latin America scholarship 5.4 million intelligent university cards in programmes, presented at the Second Meeting of University 250 universities. Rectors in Guadalajara, Mexico, in June 2010. • Development of a youth employment plan in Spain, through 21,000 scholarships and aid for 5,000 grants for internships in SMEs. study granted in 2011. • The international programme for the incubation of companies was launched, as well as the entrepreneurial indicators and scholarships of the Red Emprendia. 1,232 universities grouped in • The Santander Universities programme in Germany and Universia. Poland was started, and consolidated in the UK and the US. • Reinforcing the social recognition of Santander’s commitment 330,000 first jobs via Universia. to universities and launch of the ONE THOUSAND programme in Argentina, Brazil, Chile, Mexico, the UK, the US, Portugal, Puerto Rico and Uruguay. • The I3C project to disseminate science in Spanish and launch of the financial education and culture programme. In 2012, Santander Universities will strengthen dissemination of its commitment to universities to all society. It will put into effect new Santander scholarship programmes for students studying for a bachelor’s degree and scholarships for young researchers. Moreover, it will launch new scholarship programmes to foster international travel by young postgraduate students and researchers and boost the exchange of students between Asia and Latin America, in accordance with the commitment made at the second meeting of Universia rectors. Growth in co-operation agreements with universities Growth in co-operation projects Number Number 990 4,455 938 4,149 833 3,340 2009 2010 2011 2009 2010 2011 ANNUAL REPORT 2011 45
  • 48.
    Corporate volunteering inChile Olive trees at Grupo Santander City Social actions The environment Banco Santander developed programmes that support local Banco Santander’s management of the environment is a central communities through initiatives in various countries. In order to part of the Group’s sustainability plan. The Bank fosters the put them into effect, Santander operates in co-operation with protection, conservation and recovery of the environment and, NGOs and other non-profit making organisations with whom it particularly, the fight against climate change. has a close and fluid dialogue. The Bank’s actions in this sphere revolve around the following The main lines of action are: lines of work: • Children’s education. Banco Santander supports projects • Measurement, control and monitoring of items consumed and initiatives that promote children’s education in those and emissions from the Bank’s installations worldwide countries where the Group operates. The objective, in line through its environmental footprint. Of note is the launch of with the UN’s Millennium Development Goals, is to contribute the 2011-2013 energy efficient plan with global objectives to to universal education. Volunteers throughout the Group reduce electricity consumption and C02 emissions. participated in various initiatives launched by the human resources division to support the UNICEF project “Todos los • Analysis of the social and environmental risk in loans with a niños a la escuela” in the state of Oaxaca, Mexico. Also of particular focus on project finance operations in accordance note was the Projecto Escola in Brazil, which helps to improve with the Equator principles. the quality of education in state schools and the Bécalos programme in Mexico, which supports students and teachers • The development of financial solutions to protect the in state schools with scholarships. environment and which contribute to the global objective of fighting climate change, and with a leadership position in • Financial inclusion. Another key element of Grupo renewable energy matters at the international level. Santander’s social investment is its support for the socio- labour integration of people at the risk of social exclusion, • Fostering other types of environmental initiatives such as through initiatives that promote financial inclusion and projects to restore degraded natural spaces via the Banco entrepreneurship. Of note in this sphere is Santander Brazil’s Santander Foundation, or various local initiatives in each microcredit programme, a model that strives for maximum country such as cleaning up beaches, recycling programmes, customer proximity. Also noteworthy were the various etc. financial education programmes. The Climate Change Office was created in 2011 as a reference • Culture. Banco Santander is intensely involved in protecting, and knowledge centre for the Group. conserving and disseminating art and culture. In Spain, the Banco Santander Foundation manages the Santander Banco Santander received in 2011 significant recognitions such Collection and organizes and promotes art exhibitions in as the “Greenest bank in the world” from Bloomberg Markets various institutions and museums. The foundation is also very and “the best global green brands” from Interbrand. These involved in music, research, debate and the publishing world. recognitions also reflect the improvement in the score in the Santander Cultural Brazil concentrates on integrating and environmental category of the Dow Jones Sustainability Index. disseminating the diversity of languages and artistic and cultural content. 46 ANNUAL REPORT 2011
  • 49.
    Human Resources Banco Santanderhas 193,349 employees, more than half of Shared knowledge whom work in the Americas, one-third in Continental Total investment in training in 2011 amounted to EUR 112.7 Europe and 14% in the UK. Of the total employees, 54% million and each of the 193,000 employees received on average are women and 49% have university degrees. The average 37.5 hours of training. age of employees is 37 and the average number of years spent working for Santander is 11 for men and 8.5 for Santander Learning, an IT platform that every year is extended women. to more countries with new functions, backs all the Group’s training activities. The year 2011 was also the one when the Santander continued to consolidate a people management School of Internal Trainers was consolidated, at which policy focused on talent, knowledge and commitment as the executives get involved in the transfer of knowledge and key pillars for supporting business. corporate values. In 2011, 2,460 internal and external trainers participated and put in more than 2,294,000 hours. Global management of talent and leadership Santander’s talent and leadership model is one that befits a Santander was a pioneer in the creation of Business Knowledge global group, with a wide geographic diversification and Schools which share knowledge and exchange best practices. different needs for attracting and retaining professionals in each An auditing school joined in 2011 the ones already established country. for risks (2005) and retail banking (2010). The Bank has processes and tools to detect and develop internal Commitment of professionals talent, and to identify the best people for each post. Of note are The Bank promotes the “Santander is you” programme, which those for high potential professionals, such as STEP, or the aims to keep on making Santander one of the best companies development of female talent, such as the Alcanza plan. There to work for. This programme has initiatives such as the are also mobility programmes such as Mundo Santander and “Santander is you” week, during which activities are organized specific plans for certain businesses such as Future Executives in all the countries where the Group operates so that (FUDIS) for the Americas Division, Apolo, for retail banking professionals participate as teams and strengthen the pride in Spain, and those begun in 2011 for the global wholesale belonging; or the “Santander is you” race which has become an banking and technology and operations divisions. example of how to live the corporate values through sports. As for external talent, Santander continued to invest in In the social commitment sphere, Santander launched its consolidating a strong employer brand which, together with the committed volunteers programme. The aim is to create a strategic alliances with more than 1,000 universities and framework for employees to develop solidarity activities. This business schools worldwide, enables us to attract the best initiative was first launched in Spain and has UNICEF as a candidates. strategic partner in order to support the schooling of children and teenagers in Latin America. ANNUAL REPORT 2011 47
  • 50.
  • 51.
    Corporate governance report Equality of shareholders’ rights. • The principle of one share, one vote, one dividend. • No anti-takeover measures in the corporate By-laws. “Banco Santander's corporate • Informed participation of shareholders in meetings. governance contributes decisively Maximum transparency, particularly in remuneration. to the success of its model” Emilio Botín, chairman A corporate governance model recognised by the socially General shareholders’ meeting, 17 June 2011 responsible investment indices. Santander has been in the FTSE4Good and DJSI indices since 2003 and 2000, respectively. 51 Ownership structure 54 Banco Santander’s board of directors 70 Rights of shareholders and general shareholders’ meeting 72 Banco Santander’s senior management 74 Transparency and independence 76 Unified Good Governance Code
  • 52.
    Main activities ofthe board on matters reserved thereto Board’s activities C During 2011, the board held 14 meetings. Two of them were devoted to the Group’s strategy. C As regards dividends, in 2011 the board maintained the same compensation per share as in financial years 2010 and 200 , i.e., 0.60 euro. Control and risk management C During 2011, the chief executive officer submitted to the board eight management reports, and the third vice chairman and head of the risk division submitted eight risk reports. C Each of the heads of internal and external audit reported to the board through their participation in meetings of the audit and compliance committee and of the full board. Changes in the size and composition of the board C Following the death of Mr Luis Ingel Ro2o in May 2011, the resulting vacancy was covered by the appointment of Mr Vittorio Corbo. Subsequently, Mr Antoine Bernheim who represented AssicuraBioni Generali and Mr Francisco LuBHn resigned their seats on the board. On the occasion of the next general shareholders’ meeting, and if the board’s proposal is accepted, Mr Antonio Basagoiti, Mr Antonio EscDmeB and Mr Luis Alberto SalaBar Simpson will cease to hold office as directors and Ms Esther GimFneB Salinas will be appointed to the board. Director remuneration policy C In 2011, the board submitted the report regarding the director remuneration policy to the shareholders at the general shareholders’ meeting held on 17 une, as a separate item on the agenda and as a consultative matter 5 of the votes were in favour of the report. C In addition, following the enactment of the Sustainable Economy Act e de ono a osteni e and the amendment of the Securities Market Act e de er ado de a ores , the shareholders at the aforementioned meeting approved an amendment of the Bylaws in order to expressly provide for the obligation to submit the report regarding director remuneration policy to a vote of the shareholders as a consultative matter and as a separate item on the agenda. Director remuneration C The overall director remuneration with respect to 2011 is lower than that corresponding to 2010 Bylaw-mandated payments C In 2011, the board resolved to reduce the annual allocation to which the board members are entitled for the performance of supervisory and collective decision making duties by 6 vis E vis the amounts paid the prior year, which amounts had remained unchanged since 200 . Remuneration of executive directors C As regards executive directors, the board decided not to vary the fixed remuneration payable in 2012 and reduce by an average of 16 in the variable remuneration paid in 2011. Financial information periodically published by the Bank C The board approved the quarterly financial information, the annual accounts, and the management report for 2010, in addition to other documents such as the annual report, the sustainability report, the prudently significant information Pillar , the annual corporate governance report, and the reports of the audit and compliance committee and the appointments and remuneration committee. 50 ANNUAL REPORT 2011
  • 53.
    1. Ownership structure Numberof shares and Shareholders’ agreements and significant interests other significant agreements Number of shares Section A.6 of the annual corporate governance report, which During financial year 2011, the Bank carried out four capital forms part of the management report, contains a description of increases that became effective on 1 February, 7 October, 2 the shareholders’ agreement (pacto parasocial) executed in November and 30 December, and pursuant to which there were February 2006 by Mr Emilio Botín-Sanz de Sautuola y García de issued 111,152,906, 1,223,457, 125,742,571 and 341,802,171 los Ríos, Ms Ana Patricia Botín-Sanz de Sautuola y O’Shea, new shares, representing 1.248%, 0.014%, 1.411% and Mr Emilio Botín-Sanz de Sautuola y O’Shea, Mr Francisco Javier 3.837%, respectively, of the Bank’s share capital at year-end Botín-Sanz de Sautuola y O’Shea, Simancas, S.A., Puente San 2011. The first and the third increases were carried out within Miguel, S.A., Puentepumar, S.L., Latimer Inversiones, S.L. and the framework of the Santander Election Dividend (Santander Cronje, S.L. Unipersonal providing for the syndication of the Dividendo Elección) programme; the second one, in order to shares of the Bank held by them or in respect of which they accommodate the conversion of 3,458 mandatorily convertible have voting rights. Such agreement was also reported to the bonds (Valores Santander), and the last one, in connection with National Securities Market Commission (Comisión Nacional del the repurchase offer directed to the holders of Series X preferred Mercado de Valores) (CNMV) as a significant event and is interests issued by Santander Finance Capital, who, concurrently described in the public records thereof. with the acceptance thereof, made an irrevocable request for subscription of new shares of the Bank in the amount received under the repurchase. The Bank’s share capital at 31 December 2011 was represented by 8,909,043,203 shares, at such date the market capitalisation, on Spain’s Electronic Trading System (continuous market) of the Spanish stock exchanges, was 50,290 million euros. All shares carry the same economic, voting and related rights. Significant interests No shareholder held significant interests (of more than 3% of the share capital(*) or interests that would permit a significant influence on the Bank) at 31 December 2011. The interests held by State Street Bank & Trust (8.34%), Chase Nominees Limited (7.97%), EC Nominees Ltd. (6.46%), and The Bank of New York Mellon (5.55%), which were the only ones in excess of 3%, were held by them on behalf of their customers. The Bank is not aware of any of them holding individual stakes of 3% or more of its share capital. Bearing in mind the current number of board members (18), the percentage of capital needed to exercise the right to appoint a director in accordance with article 243 of the Spanish Companies Act (Ley de Sociedades de Capital) is 5.56%. (*) Limit set by Royal Decree 1362/2007, of 19 October, for purposes of the annual corporate governance report. ANNUAL REPORT 2011 51
  • 54.
    Treasury shares Authorisation The current authorisation for transactions in treasury shares arises from resolution no. 5 adopted by the shareholders acting Key data at the general shareholders’ meeting held on 11 June 2010, At 31 December 2011, the Bank held 42,192,066 treasury item II) of which reads as follows: shares, representing 0.474% of its share capital; at 31 December 2010, it held 22,291,422 treasury shares, “To grant express authorisation for the Bank and the representing 0.268% of the Bank’s share capital at such date. subsidiaries belonging to the Group to acquire shares representing the share capital of the Bank for valuable The following table sets out the monthly average percentages of consideration in any manner permitted by Law, within the treasury stock in 2011 and 2010. limits of the Law and subject to all legal requirements, up to a maximum number of shares –including the shares they already hold– equal to 10 per cent of the share capital Monthly average percentages of treasury stock(1) existing at any given time or such greater maximum (2) % of the Bank’s share capital percentage as is established by the Law while this 2011 2010 authorisation is in effect. Such shares shall be fully paid-in at a minimum price per share equal to the par value thereof and January 0.289% 0.200% a maximum price of up to 3 per cent over the last listing February 0.126% 0.516% price for transactions in which the Bank does not act on its March 0.324% 0.302% own behalf on the Continuous Market of the Spanish stock exchanges (including the block market) prior to the acquisition April 0.701% 0.305% in question. This authorisation may only be exercised within May 0.630% 0.603% five years of the date of the general shareholders’ meeting. June 0.404% 0.470% The authorisation includes the acquisition of shares, if any, July that must be delivered directly to the employees and 0.271% 0.342% managers of the Company, or that must be delivered as a August 0.253% 0.253% result of the exercise of the options held by them.” September 0.382% 0.285% Treasury stock policy October 0.621% 0.360% At its meeting of 11 June 2010, the board of directors adopted November 0.643% 0.544% the current resolution on treasury share policy, which was December 0.446% 0.525% published on the Group’s website (www.santander.com) and which governs aspects such as the purposes thereof, persons (1) Further information in this regard can be found in section A.8 of the annual corporate governance report, which forms part of the management report, and in the capital and treasury stock section authorised to carry out treasury share transactions, general of this latter report. guidelines, prices, time limits and reporting obligations. (2) Monthly average of daily positions of treasury stock. The aforementioned policy excludes the use of treasury shares as a defensive mechanism. The transactions in treasury stock carried out by companies belonging to the consolidated Group in the interest thereof during financial year 2011 entailed the acquisition of 939,773,957 shares, equal to a nominal amount of 469.9 million euros (actual amount of 6.932.5 million euros), and the sale of 925,256,161 shares in the nominal amount of 462.6 million euros (actual amount of 6,855.9 million euros). The average purchase price of shares of the Bank in financial year 2011 was 7.38 euros per share, and the average sales price of shares of the Bank in such financial year was 7.41 euros per share. The effect on equity (net of taxes) generated by transactions carried out during the financial year with shares issued by the Bank was equal to 31 million euros worth of loss, which was recorded in the Group’s equity section under Shareholders’ equity-Reserves. 52 ANNUAL REPORT 2011
  • 55.
    Resolutions in effectregarding the 2. Delegation to the board of directors of the power to issue debentures, bonds and other fixed-income securities or debt possible issuance of new shares or of instruments of a similar nature in any of the forms allowed by Law and convertible into and/or exchangeable for shares of bonds convertible into shares the Bank. Such delegation also includes warrants or similar securities that may directly or indirectly carry the right to The additional authorised capital amounts to 2,038,901,430.5 subscribe for or acquire shares of the Bank, whether euros, pursuant to the authorisation of the shareholders acting newly-issued or already outstanding, payable by physical at the annual general meeting held on 19 June 2009; of such delivery or through the set-off of differences. amount, 170,901,085.5 euros have been used in the repurchase offer announced by the Bank on 2 December 2011, directed to The issuance or issuances come to the total maximum the holders of Series X preferred interests issued by Santander amount of 8 billion euros or the equivalent thereof in another Finance Capital, who, concurrently with the acceptance thereof, currency, and the period available to the directors of the made an irrevocable request for subscription of new shares of Bank within which to implement this resolution expires on the Bank in the amount received under the repurchase. The 17 June 2016. period available to the directors of the Entity to carry out and make capital increases up to such limit expires on 19 June 2012. 3. Delegation to the board of directors, pursuant to the The resolution adopted by the shareholders at the provisions of article 297.1.a) of the Companies Act, of the aforementioned annual general meeting gives the board the broadest powers such that, within one year of the date on power to exclude pre-emptive rights in whole or in part, which the aforementioned shareholders’ meeting is held, pursuant to the provisions of article 159.2 of the Companies Act it may set the date and the terms and conditions, as to all (Ley de Sociedades Anónimas) (now, article 506 of the new matters not provided for by the shareholders themselves, Companies Act (Ley de Sociedades de Capital)). of a capital increase in the amount of 500 million euros. If the board does not exercise the powers delegated thereto In addition, the shareholders acting at the annual general within the period established by the shareholders for meeting held on 17 June 2011 approved the following implementation of this resolution, such powers shall be resolutions in connection with the content of this section: rescinded. 1. Two share capital increases, each for a maximum number of shares having a market value of one thousand one hundred million euros, within the shareholder compensation scheme (Santander Dividendo Elección) whereby the Bank offers the shareholders the possibility of receiving shares under a scrip issue for an amount equal to the dividends, in one or two of the quarters in which they are customarily paid. For such purposes, the Bank’s executive committee, at its meetings of 2 November 2011 and 31 January 2012, implemented the aforementioned capital increases with a charge to voluntary reserves from undistributed profits. The number of shares having a nominal value of 0.5 euro each which were issued in each case under the two capital increases by means of a scrip issue was 125,742,571 and 167,810,197, accounting for 1.411% of the Bank’s share capital at 31 December 2011 and 1.849% of the current share capital of the Bank, respectively. ANNUAL REPORT 2011 53
  • 56.
    2. Banco Santander’sboard of directors* Mr Emilio Botín-Sanz de Sautuola Mr Alfredo Sáenz Abad y García de los Ríos Chairman Second vice-chairman and chief executive officer Executive director Executive director Born in Santander (Spain) in 1934. Joined the board in 1960. Born in Getxo (Spain) in 1942. Joined the board in 1994. Graduate in Economics and Law. Graduate in Economics and Law. Committees of the board of which he is a member Other significant positions: former chief executive officer and Executive (chairman) first vice-chairman of Banco Bilbao Vizcaya, S.A. and chairman International (chairman) of Banco Español de Crédito, S.A. (Banesto). Technology, productivity and quality (chairman) Committees of the board of which he is a member Executive International Technology, productivity and quality Mr Fernando de Asúa Álvarez Mr Matías Rodríguez Inciarte First vice-chairman Third vice-chairman Non-executive (independent) director Executive director Born in Madrid (Spain) in 1932. Joined the board in 1999. Born in Oviedo (Spain) in 1948. Joined the board in 1988. Graduate in Economics, Information Technology, Business Graduate in Economics and Government Economist. Administration and Mathematics. Other significant positions: former minister of the Presidency of Other significant positions: former chairman of IBM Spain, of the Spanish Government (1981-1982). He is the chairman of the which he is currently honorary chairman. He is a non-executive Príncipe de Asturias Foundation, non-executive chairman of vice-chairman of Técnicas Reunidas, S.A. Banco Santander Totta and a non-executive director of Banesto, of Sanitas, S.A. de Seguros and of Financiera Ponferrada, S.A., Committees of the board of which he is a member SICAV. Executive Risk (vice-chairman) Committees of the board of which he is a member Audit and compliance Executive Appointments and remuneration (chairman) Risk (chairman) Technology, productivity and quality * Unless otherwise specified, the main activity of the members of the board is that carried out at the Bank in their capacity as directors, whether executive or non-executive. 54 ANNUAL REPORT 2011
  • 57.
    Mr Manuel SotoSerrano Mr Guillermo de la Dehesa Romero Fourth vice-chairman Non-executive (independent) director Non-executive (independent) director Born in Madrid (Spain) in 1941. Joined the board in 2002. Born in Madrid (Spain) in 1940. Joined the board in 1999. Government Economist and head of office of Banco de España Graduate in Economics and Business. (on leave of absence). Other significant positions: non-executive director of Cartera Main activity: international advisor to Goldman Sachs Industrial REA, S.A. He was formerly non-executive vice- International. chairman of Indra Sistemas, S.A., chairman of Arthur Andersen’s Global Board and a manager for Europe, Middle East, India and Other significant positions: former state secretary of Economy, Africa (EMEIA) for the same firm. general secretary of Trade and chief executive officer of Banco Pastor, S.A. He is currently non-executive vice-chairman of Committees of the board of which he is a member Amadeus IT Holding, S.A., a non-executive director of Campofrío Audit and compliance (chairman) Food Group, S.A., chairman of the Centre for Economic Policy Appointments and remuneration Research (CEPR) in London, a member of the Group of Thirty in Technology, productivity and quality Washington, chairman of the board of trustees of IE Business School and non-executive chairman of Aviva Grupo Corporativo, S.L. and of Aviva Vida y Pensiones, S.A. de Seguros y Reaseguros. Committees of the board of which he is a member Executive Appointments and remuneration International Mr Antonio Basagoiti García-Tuñón Mr Rodrigo Echenique Gordillo Non-executive director Non-executive (independent) director Born in Madrid (Spain) in 1942. Joined the board in 1999. Born in Madrid (Spain) in 1946. Joined the board in 1988. Graduate in Law. Graduate in Law and Government Attorney. Main activity: non-executive chairman of Banesto. Other significant positions: former chief executive officer of Banco Santander, S.A. (1988-1994). Other significant positions: former chairman of Unión Fenosa and proprietary non-executive vice-chairman of Faes Farma, S.A. Committees of the board of which he is a member He is a non-executive chairman of Pescanova, S.A. Executive Audit and compliance Committees of the board of which he is a member Appointments and remuneration Executive International Risk Technology, productivity and quality Ms Ana Patricia Botín-Sanz de Sautuola Mr Antonio Escámez Torres y O’Shea Executive director Non-executive (independent) director Born in Santander (Spain) in 1960. Joined the board in 1989. Born in Alicante (Spain) in 1951. Joined the board in 1999. Graduate in Economics. Graduate in Law. Main activity: chief executive officer of Santander UK plc. Other significant positions: chairman of Fundación Banco Santander, non-executive chairman of Santander Consumer She joined the Bank after a period at JP Morgan (1981-1988). Finance, S.A., of Open Bank, S.A. and of Arena Media She has been executive vice president of Banco Santander, S.A. Communications España, S.A., and non-executive vice-chairman since 1992, and was executive chairwoman of Banesto from of Attijariwafa Bank. 2002 to 2010. Committees of the board of which he is a member Other significant positions: she is a non-executive director of Executive Alliance & Leicester plc. and a member of the international Risk advisory board of the New York Stock Exchange and of the International board of Georgetown University. Technology, productivity and quality Committees of the board of which he is a member Executive International Technology, productivity and quality ANNUAL REPORT 2011 55
  • 58.
    Mr Javier Botín-Sanzde Sautuola y O’Shea Mr Ángel Jado Becerro de Bengoa Non-executive (proprietary) director Non-executive (independent) director Born in Santander (Spain) in 1973. Joined the board in 2004. Born in Santander (Spain) in 1945. Appointed as director at the Graduate in Law. Bank’s general shareholders’ meeting held on 11 June 2010. Graduate in Law. Main activity: chairman and chief executive officer of JB Capital Markets, Sociedad de Valores, S.A. Other significant positions: director of Banco Santander from 1972 to 1999. He has been a director of Banco Banif, S.A. since 2001. Lord Burns (Terence) Mr Abel Matutes Juan Non-executive director Non-executive (independent) director Born in Durham (United Kingdom) in 1944. Joined the board in Born in Ibiza (Spain) in 1941. Joined the board in 2002. 2004. Graduate in Economics. Graduate in Law and Economics. Main activity: non-executive chairman of Santander UK plc and Main activity: chairman of Grupo de Empresas Matutes. of Alliance & Leicester plc. Other significant positions: former Spanish Foreign Minister and Other significant positions: he is non-executive chairman of European Union Commissioner for Loans and Investment, Channel Four Television Corporation and a non-executive Financial Engineering and Policy for Small and Medium-Sized member of the Office for Budget Responsibility. He has been Enterprises (1989), North-South Relations, Mediterranean Policy permanent secretary of the UK Treasury, chairman of the Financial and Relations with Latin America and Asia (1989), Transport and Services and Markets Bill Joint Committee of the British Energy, and the Euroatom Supply Agency (1993). Parliament, non-executive chairman of Marks and Spencer Group plc and of Glas Cymru Ltd (Welsh Water), and non-executive Committees of the board of which he is a member director of British Land plc, of Legal & General Group plc and of Audit and compliance Pearson Group plc. International Mr Vittorio Corbo Lioi Mr Juan Rodríguez Inciarte Non-executive director Executive director Born in 1943 in Iquique (Chile). Joined the board in July 2011 Born in Oviedo (Spain) in 1952. Member of the board since following his interim appointment by the board of the directors 2008. Graduate in Economics. Joined the Group in 1985 as of the Bank at the proposal of the appointments and director and executive vice president of Banco Santander de remuneration committee. Doctor of Economics. Negocios. In 1989, he was appointed executive vice president of Banco Santander, S.A. From 1991 to 1999 he was a director of Other significant positions: From 2003 to 2007, he served as Banco Santander, S.A. chairman of the Central Bank of Chile. He is currently a senior associate researcher at the Centro de Estudios Públicos in Chile, Other significant positions: he is vice-chairman of Santander UK full professor at Universidad Católica de Chile, professor at plc and a director of Alliance & Leicester plc and of Santander Universidad de Chile, director of Banco Santander Chile, Consumer Finance, S.A. chairman of the board of directors of ING-Seguros de Vida Chile, director of ENDESA-Chile, a member of the advisory Committees of the board of which he is a member council for the World Bank Chief Economist, a member of the Risk consulting group on monetary and exchange policy of the money and capital markets department of the International Monetary Fund, a member of the board for resolutions on parliamentary assignments of the Chilean Congress, and a member of the international advisory board of the Center for Social and Economic Research (CASE) in Warsaw, Poland. 56 ANNUAL REPORT 2011
  • 59.
    Mr Luis AlbertoSalazar-Simpson Bos Mr Ignacio Benjumea Cabeza de Vaca Non-executive (independent) director General secretary and secretary of the board Born in Madrid (Spain) in 1940. Joined the board in 1999. Born in Madrid (Spain) in 1952. Joined the Group in 1987 as Graduate in Law and holder of a Degree in Treasury and Tax general secretary and secretary of the board of Banco Santander Law. de Negocios. He was appointed general secretary and secretary of the board of Banco Santander, S.A. in 1994. Graduate in Law, Main activity: chairman of France Telecom España, S.A. ICADE-E3, and Government Attorney. Committees of the board of which he is a member Other significant positions: he is executive vice president of Audit and compliance Banco Santander, S.A., a non-executive director of Sociedad Technology, productivity and quality Rectora de la Bolsa de Valores de Madrid, S.A., Bolsas y Mercados Españoles, Sociedad Holding de Mercados y Sistemas Financieros, S.A. and La Unión Resinera Española, S.A. Secretary of committees of the board Executive Risk Audit and compliance Ms Isabel Tocino Biscarolasaga Appointments and remuneration International Technology, productivity and quality Non-executive (independent) director Born in Santander (Spain) in 1949. Joined the board in 2007. Doctor of Laws. She has undertaken graduate studies in business administration at IESE and the Harvard Business School. Main activity: full professor at Universidad Complutense de Madrid. Other significant positions: former Spanish Minister for the Environment, former chairwoman of the European Affairs Committee and of the Foreign Affairs Committee of the Spanish Congress and former chairwoman for Spain and Portugal and former vice-chairwoman for Europe of Siebel Systems. She is currently an elected member of the Spanish State Council and a member of the Royal Academy of Doctors. Committees of the board of which he is a member Appointments and remuneration ANNUAL REPORT 2011 57
  • 60.
    Re-election and ratificationof Likewise, the ratification of the appointment and re-election of Mr Vittorio Corbo Lioi, as external, non-propietary and directors at the 2012 annual general non-independent director, will be submitted to the general shareholders’ meeting for approval, as well as the re-election of shareholders’ meeting the directors Mr Juan Rodríguez Inciarte, Mr Emilio Botín-Sanz de Sautuola y García de los Ríos, Mr Matías Rodríguez Inciarte , Pursuant to article 55 of the Bylaws* and article 22 of the Rules and Mr Manuel Soto Serrano. The first three as executive and Regulations of the Board*, directors are appointed to three- directors and Mr Soto as independent external director, the year terms (the maximum term being six years under Spanish professional profiles and activity descriptions appear on law), such that one-third of the board is renewed each year. the preceding pages. At the 2012 ordinary general shareholders’ meeting, planned for The re-elections and the ratification will be submitted separately 29 and 30 March at first and second call, respectively, the to a vote of the shareholders at the general shareholders’ appointment of Ms Esther Giménez-Salinas i Colomer (as an meeting (article 21.2 of the Rules and Regulations for the independent director) will be proposed. General Shareholders’ Meeting). In view of the fact that this election practice has been followed since the 2005 annual general shareholders’ meeting, the election of all of the current directors has been submitted to a separate vote at a general shareholders’ meeting, except for the case of Mr Vittorio Corbo Lioi, whose ratification will be proposed at the 2012 annual general shareholders’ meeting, as set forth above. * The Bylaws and the Rules and Regulations of the Board of Banco Santander are published on the Group’s website, www.santander.com. Composition and structure of the board of directors Board of directors Committees 6. Technology, productivity and 5. International committee remuneration committee 3. Audit and compliance 1. Executive committee quality committee 4. Appointments and 2. Risk committee Non-executive committee Executive Chairman Mr Emilio Botín-Sanz de Sautuola y García de los Ríos (1) C C C First vice-chairman Mr Fernando de Asúa Álvarez I V C Second vice-chairman and chief executive officer Mr Alfredo Sáenz Abad Third vice-chairman Mr Matías Rodríguez Inciarte (2) C Fourth vice-chairman Mr Manuel Soto Serrano I C Members Mr Antonio Basagoiti García-Tuñón (3) N Ms Ana Patricia Botín-Sanz de Sautuola y O’Shea (1) Mr Javier Botín-Sanz de Sautuola y O’Shea (1) (4) P Lord Burns (Terence) N Mr Vittorio Corbo Lioi N Mr Guillermo de la Dehesa Romero I Mr Rodrigo Echenique Gordillo I Mr Antonio Escámez Torres (3) I Mr Ángel Jado Becerro de Bengoa I Mr Francisco Luzón López (5) Mr Abel Matutes Juan I Mr Juan Rodríguez Inciarte Mr Luis Alberto Salazar-Simpson Bos (3) I Ms Isabel Tocino Biscarolasaga I Total General secretary and secretary of the board Mr Ignacio Benjumea Cabeza de Vaca (1) Mr Emilio Botín-Sanz de Sautuola y García de los Ríos has the right to vote, at the general (2) Mr Matías Rodríguez Inciarte has the right to vote 80,095 shares owned by two of his children. shareholders’ meeting, 91,866,035 shares owned by Fundación Marcelino Botín (1.03% of the (3) Upon resolution by the board of directors, at the proposal of the appoinmets and remuneration share capital), 8,096,742 shares owned by Mr Jaime Botín-Sanz de Sautuola y García de los Ríos, committee, the re-election of these three directors will be not submitted to the general shareholders 9,042,777 shares owned by Mr Emilio Botín-Sanz de Sautuola y O’Shea, 9,118,885 shares owned meeting for appoval. by Ms Ana Patricia Botín-Sanz de Sautuola y O’Shea and 9,470,988 shares owned by Mr Javier Botín-Sanz de Sautuola y O’Shea. Accordingly, this table includes the direct and indirect interests of (4) Mr Javier Botín-Sanz de Sautuola y O’Shea is a proprietary non-executive director because on the each of the two last named, who are directors of the Bank, but in the column showing the total board of directors he represents 2.007% of the share capital, representing the aggregate interests percentage of share capital that such interests represent they are computed together with those owned by Fundación Marcelino Botín, Mr Emilio Botín-Sanz de Sautuola y García de los Ríos, owned or also represented by Mr Emilio Botín-Sanz de Sautuola y García de los Ríos. Ms Ana Patricia Botín-Sanz de Sautuola y O’Shea, Mr Emilio Botín-Sanz de Sautuola y O’Shea, Mr Jaime Botín-Sanz de Sautuola y García de los Ríos, Ms Paloma O’Shea Artiñano and his own interest. 58 ANNUAL REPORT 2011
  • 61.
    Powers and duties appointment, remuneration and, if appropriate, removal of the other members of senior management and the determination of The basic responsibility of the board of directors is to supervise the basic terms of their contracts, as well as the creation or the Group, delegating the day-to-day management thereof to the acquisition of interests in special purpose entities or in entities appropriate executive bodies and the various management teams. registered in countries or territories regarded as tax havens. On the matters mentioned in this paragraph, the executive The Rules and Regulations of the Board (article 3) reserve thereto committee may make any appropriate decisions, by delegation the power to approve general policies and strategies and, in of the board and whenever justified by reasons of urgency. particular, strategic plans, management objectives and the annual budget, corporate governance, corporate social responsibility and The Bylaws (article 40) as well as the aforementioned Rules and dividend and treasury stock policies, the general risk policy, and Regulations (article 5) establish the board’s obligation to ensure the policies for the provision of information to and for that the Bank faithfully complies with applicable law, observes communication with the shareholders, the markets and the public usage and good practices of the industries or countries where it opinion, which power cannot be delegated. does business and abides by the social responsibility principles that it has voluntarily accepted. The board also reserves for itself, and likewise cannot delegate, In addition, the board of the Bank plays a special role in the the following matters, among others: decisions regarding the Group’s risk management. 13 of its 18 members are members acquisition and disposition of substantial assets (except when of at least one of the three board committees with the decisions come within the purview of the shareholders at a responsibilities in the area of risks: the executive committee, the general shareholders’ meeting) and major corporate risk committee and the audit and compliance committee. Of transactions; the determination of the remuneration of each these 13 directors, one is the first vice-chairman of the Bank, director and the approval of the contracts governing the who is a member of all three committees, and another 4 performance by the directors of duties other than those of a directors sit on two of the committees with responsibilities in director, including executive duties, as well as the remuneration the area of risks. to which they are entitled for the discharge thereof; the Shareholding at 31 December 2011 Date of last proposal of the appointments and Shares % of share Date of first Date of last remuneration (7) Direct Indirect represented Total capital appointment appointment Expiration date committee 8,259,445 42,916,473 109,005,554 160,181,472 2.007% 04.07.1960 (6) 21.06.2008 First six months of 2012 17.02.2012 66,167 52,469 - 118,636 0.001% 17.04.1999 11.06.2010 First six months of 2014 21.04.2010 1,100,332 1,304,950 - 2,405,282 0.027% 11.07.1994 (6) 11.06.2010 First six months of 2014 21.04.2010 1,035,739 86,594 80,095 1,202,428 0.013% 07.10.1988 (6) 19.06.2009 First six months of 2013 27.04.2009 63,721 454,466 - 518,187 0.006% 17.04.1999 19.06.2009 First six months of 2013 27.04.2009 719,217 - - 719,217 0.008% 26.07.1999 23.06.2007 First six months of 2012 19.03.2007 5,142,749 4,024,136 - 9,166,885 0.000% 04.02.1989 (6) 17.06.2011 First six months of 2014 11.04.2011 4,793,481 4,677,507 - 9,470,988 0.000% 25.07.2004 11.06.2010 First six months of 2013 21.04.2010 30,105 27,001 - 57,106 0.001% 20.12.2004 17.06.2011 First six months of 2014 11.04.2011 1 - - 1 0.000% 22.07.2011 22.07.2011 First six months of 2012 17.02.2012 105 - - 105 0.000% 24.06.2002 19.06.2009 First six months of 2014 27.04.2009 658,758 9,736 - 668,494 0.008% 07.10.1988 17.06.2011 First six months of 2014 11.04.2011 783,261 - - 783,261 0.009% 17.04.1999 23.06.2007 First six months of 2012 19.03.2007 2,000,000 4,950,000 - 6,950,000 0.078% 11.06.2010 11.06.2010 First six months of 2013 21.04.2010 1,611,691 81,685 - 1,693,376 0.019% 22.03.1997 (6) 23.06.2007 First six months of 2012 19.03.2007 129,479 2,357,399 - 2,486,878 0.028% 24.06.2002 19.06.2009 First six months of 2013 27.04.2009 1,400,296 - - 1,400,296 0.016% 28.01.2008 (6) 21.06.2008 First six months of 2012 17.02.2012 253,205 14,082 - 267,287 0.003% 17.04.1999 21.06.2008 First six months of 2012 16.04.2008 40,674 - - 40,674 0.000% 26.03.2007 11.06.2010 First six months of 2014 21.04.2010 28,088,426 60,956,498 109,085,649 198,130,573 2.224% (5) He resigned from his position as a director as of 23 January 2012. (7) However, and pursuant to the provisions of article 55 of the Bylaws, as amended by resolution (6) The date on which they were appointed for the first time as executive directors coincides with their adopted at the annual general shareholders’ meeting of 17 June 2011, one-third of the board will first appointment as a director. be renewed each year, based on length of service and according to the date and order of the respective appointment. C Chairman of the committee I Independent P Proprietary V Vice-chairman of the committee N Non-executive, neither proprietary nor independent ANNUAL REPORT 2011 59
  • 62.
    Commitment of theboard and main areas of experience of its members Board’s interest in the Bank’s capital Main areas of professional experience Data at year-end 2011 of the board members NUMBER OF SHARES OF THE BOARD 198,130,573 equal to 2.224% Audit and of share capital consulting 1 Tourism 1 Banking 12 STOCK EXCHANGE VALUE 1,163 million euros University 2 STOCK LISTING PRICE Technology and 5.87 euros telecommunications 2 Corporate governance in risk management Average attendance rate at meetings of the committees of the board % • Mr Matías Rodríguez Inciarte, third vice-chairman of Banco Santander and chairman of the risk Executive committee committee, reports directly to the Risk committee executive committee and to the Audit and compliance committee board, which guarantees the independence of the risk function. 95.4 • The risk committee held 99 92.7 92.5 meetings in 2011, each of which 92.0 92.2 90.5 90.9 lasted approximately 3 hours. 89.5 90.3 90.7 89.1 89.2 87.5 87.1 • The executive committee held 86.2 59 meetings in 2011 and devoted a significant amount of time to discussions on risks. 2007 2008 2009 2010 2011 Participation in the executive committee, the risk Number of meetings of the executive committee, the risk committee and the audit and compliance committee committee and the audit and compliance committee 4 directors participate in 2 of Committees 2007 2008 2009 2010 2011 the 3 committees Executive 55 59 56 55 59 Risk 98 102 99 99 99 Audit and compliance 13 11 11 11 12 Total meetings 166 172 166 165 170 8 out of the 18 directors participate in 1 of the 3 committees 1 director is a member of all 3 committees 60 ANNUAL REPORT 2011
  • 63.
    Size and compositionof the board Independent non-executive directors Independent non-executive directors account for 50% of the In 2006, the shareholders acting at a general shareholders’ Board. meeting approved a bylaw amendment whereby the maximum The Rules and Regulations of the Board (article 6.2.c)) include number of directors was reduced from 30 to 22, with the the definition of independent director established in the Unified minimum remaining at 14. Code. In the light thereof, taking into account the circumstances The board presently comprises 18 members, following the of each case, and upon a prior report of the appointments and resignation due to pre-retirement on 23 January of Mr Francisco remuneration committee, the board considers the following to Luzón López as a director, executive vice president of Banco be independent non-executive directors: Mr Fernando de Asúa Santander and head of the America division. Álvarez, Mr Manuel Soto Serrano, Mr Guillermo de la Dehesa Romero, Mr Rodrigo Echenique Gordillo, Mr Antonio Escámez Pursuant to article 6.3 of the Rules and Regulations of the Board, Torres, Mr Ángel Jado Becerro de Bengoa, Mr Abel Matutes the appointments and remuneration committee, at its meeting of Juan, Mr Luis Alberto Salazar-Simpson Bos and Ms Isabel Tocino 17 february 2012, verified the status of each director. Its proposal Biscarolasaga. was submitted to the board, which approved it at its meeting of 20 february 2012 and established the composition of the board At 31 December 2011, the average length of service of upon the terms set forth below. independent non-executive directors in the position of board member was 11.1 years. Of the 18 directors currently sitting on the board of directors, 5 are executive and 13 are non-executive. Of the 13 Other non-executive directors non-executive directors, 9 are independent, one is proprietary and Lord Burns is a non-executive, non-proprietary director. Since he three are, in the opinion of the board, neither proprietary nor currently receives remuneration in his capacity as non-executive independent. chairman of the Group’s subsidiaries, Santander UK plc and Alliance & Leicester plc, in the opinion of the board of directors Executive directors and upon a prior report of the appointments and remuneration Pursuant to the Rules and Regulations of the Board (article committee, he cannot be classified as an independent director. 6.2.a)), the following are executive directors: Mr Emilio Botín- Sanz de Sautuola y García de los Ríos, Mr Alfredo Sáenz Abad, The same applies to Mr Antonio Basagoiti García-Tuñón, who, in Mr Matías Rodríguez Inciarte, Ms Ana Patricia Botín-Sanz de his capacity as non-executive chairman of Banesto, receives Sautuola y O’Shea and Mr Juan Rodríguez Inciarte. remuneration in addition to his remuneration as a director of Banco Santander. Non-executive proprietary directors Since 2002, the standard used by the appointments and Mr Vittorio Corbo Lioi is also a non-executive, non-proprietary remuneration committee and the board of directors as a director. As he provides remunerated professional services to the necessary but not sufficient condition to designate or consider a Group other than the collective management and supervision director as a non-executive proprietary director (as expressly set services inherent in his position as director —he receives forth in article 6.2.b) of the Rules and Regulations of the Board remuneration as a director of Banco Santander Chile and as an of Directors) is that he/she hold at least 1% of the share capital advisor of the aforementioned entity—, Mr Corbo, in the of the Bank. This percentage was set by the Bank exercising its opinion of the board of directors and upon a prior report of the powers of self-regulation. appointments and remuneration committee, cannot be classified as independent. Taking into account the circumstances of the case, and upon the prior report of the appointments and remuneration committee, Changes in the size and composition the board believes that Mr Javier Botín-Sanz de Sautuola y of the board O’Shea is a non-executive proprietary director. On the occasion of the next general shareholders’ meeting, and if the board’s proposal is accepted, Mr Antonio Basagoiti, Mr Antonio Escámez and Mr Luis Alberto Salazar-Simpson will cease to hold office as directors and Ms Esther Giménez-Salinas i Colomer will be appointed to the Board. With these changes, the size of the board would be reduced from 20 directors at the beginning of 2011 to 16, of which 5 would be executive and 11, external (1 proprietary, 8 independent and 2 external, neither proprietary nor independent). ANNUAL REPORT 2011 61
  • 64.
    Executive chairman andchief Succession plans for the chairman executive officer and the chief executive officer The Bank has chosen to have an executive chairman because it Succession planning for the main directors is a clear element of believes that it is the position that best suits its circumstances. the good governance of the Bank, tending to assure an orderly leadership transition at all times. Along these lines, article 24 of The chairman of the board is the highest-ranking officer of the the Rules and Regulations of the Board provides that: Bank (article 48.1 of the Bylaws and article 8.1 of the Rules and Regulations of the Board) and accordingly, all the powers that “In the cases of withdrawal, announcement of renunciation or may be delegated under the Law, the Bylaws and the Rules and resignation, legal incapacitation or death of the members of Regulations of the Board have been delegated to him. He is the board of directors or its committees or withdrawal, responsible for directing the Bank’s management team, always announcement of renunciation or resignation of the chairman in accordance with the decisions and standards set by the of the board of directors or of the chief executive officer or shareholders acting at a general shareholders’ meeting and by officers, as well as from other positions on such bodies, at the board within their respective purview. the request of the chairman of the board of directors or, in his absence, at the request of the highest-ranking vice- The chief executive officer, acting by delegation from and chairman, the appointments and remuneration committee will reporting to the board of directors and the chairman, as the be convened in order for such committee to examine and highest-ranking officer of the Bank, is charged with the conduct organise the process of succession or replacement in an of the business and the highest executive duties. orderly manner and to present the corresponding proposal to the board of directors. Such proposal shall be communicated There is a clear separation of duties between the executive to the executive committee and subsequently submitted to chairman, the chief executive officer, the board and the the board of directors on the following meeting scheduled to committees thereof, as well as various checks and balances that be held by the board’s annual calendar of meetings or on assure proper equilibrium in the corporate governance structure another extraordinary meeting which, if deemed necessary, is of the Bank, including the following: called.” • The board and its committees exercise supervisory and control Article 44.2 of the Bylaws sets out interim replacement rules for duties over the actions of both the chairman and the chief the temporary performance (in cases of absence, inability to act executive officer. or indisposition) of the duties of the chairman of the board in • The first vice-chairman, who is an independent non-executive the absence of the vice-chairmen. director, is the chairman of the appointments and remuneration committee and acts as coordinator of non- The board determines the numerical sequence for such purpose executive directors. every year based on the directors’ seniority. In this regard, at its meeting of 17 June 2011, the board unanimously resolved to • The powers delegated to the chief executive officer are the assign the following order of priority for the temporary same as those delegated to the chairman, which powers do performance of the duties of chairman in the absence of the not include, in either case, those reserved by the board for vice-chairmen of the board: itself. 1) Mr Rodrigo Echenique Gordillo 2) Ms Ana Patricia Botín-Sanz de Sautuola y O’Shea 3) Mr Antonio Escámez Torres 4) Mr Luis Alberto Salazar-Simpson Bos 5) Mr Antonio Basagoiti García-Tuñón 6) Mr Guillermo de la Dehesa Romero 7) Mr Abel Matutes Juan 8) Mr Francisco Javier Botín-Sanz de Sautuola y O’Shea 9) Lord Burns 10) Ms Isabel Tocino Biscarolasaga 11) Mr Juan Rodríguez Inciarte 12) Mr Ángel Jado Becerro de Bengoa 62 ANNUAL REPORT 2011
  • 65.
    Secretary of theboard Conduct of meetings The Bylaws (article 45.2) include among the duties of the In 2011, the board was kept continuously and fully informed of secretary those of caring for the formal and substantive legality the running of the various business areas of the Group through of the activities of the board, safeguarding observance of the the 8 management reports and the 8 risks reports presented by good governance recommendations assumed by the Bank, and the chief executive officer and the third vice-chairman in charge ensuring that governance procedures and rules are observed of the risk division, respectively, at the 14 meetings held during and regularly reviewed. the financial year. Furthermore, in addition to reviewing the various units and businesses of the Group, the board analysed The secretary of the board is the general secretary, who also acts the liquidity situation, the self-evaluation of capital and the as secretary of all of the committees of the board. Investor Day held in September, among other matters. Article 17.4.d) of the Rules and Regulations of the Board During the year, the board of directors also addressed other provides that the appointments and remuneration committee matters that come within its area of supervision, as the internal must report on proposals for the appointment or withdrawal of control model and off-shore centres. the secretary of the board prior to submission thereof to the board. Finally, the board was informed of the conclusions of the external and internal audits. The chart below shows a breakdown of the approximate time Proceedings of the board dedicated to each duty at the meetings held by the board in financial year 2011. There were 14 meetings during financial year 2011. The board holds its meetings in accordance with an annual Approximate time devoted to each duty calendar. The Rules and Regulations of the Board provide that the board shall hold not less than nine annual ordinary meetings. The board shall also meet whenever the chairman so Internal and Business decides, acting on his own initiative or at the request of not less external audits 5% management 35% than three directors (article 46.1 of the Bylaws). Review of financial information 5% When directors cannot attend a meeting personally, they may give a proxy to any other director, in writing and specifically for Corporate governance 5% each meeting, to represent them for all purposes at such meeting. Capital and liquidity 10% Any member of the board may request the inclusion of any other item not included in the draft agenda that the chairman proposes to the board (article 46.2 of the Bylaws). General policies Risk management Meetings of the board shall be validly held when more than and strategies15% 25% one-half of its members are present in person or by proxy. Except in instances in which a greater majority is specifically required pursuant to legal provisions, the Bylaws or the Rules and Regulations of the Board, resolutions are adopted by Strategy meetings absolute majority of the directors attending in person or by proxy. In the event of a tie, the chairman has a tie-breaking In addition to the ordinary meetings, the board held specific vote. meetings to discuss Santander’s strategy. In 2011, the directors held two meetings: the first one, on 18 January, and the second one, on 17 and 18 December. Among the matters discussed were: • The macroeconomic environment and the financial sector, with a focus on the Spanish and European cases and Santander´s positioning and challenges facing Santander vis-à-vis the leading European financial institutions. • Objectives of the Investor Day. • Adjustment to the new liquidity and capital environment. • Management of the Group’s business portfolio. ANNUAL REPORT 2011 63
  • 66.
    Training of directorsand Self-evaluation by the board information programme The self-evaluation process (carried out, as in previous years, with the support of the firm Spencer Stuart on the basis of a As a result of the self-evaluation of the board carried out in questionnaire and personal interviews with directors) also 2005, an on-going director training programme was put in place. included a special section for the individual evaluation of the Eight meetings were held in 2011 with the attendance of an chairman, the chief executive officer and the rest of the average of thirteen directors, who devoted approximately one directors. This is in line with the recommendations of the Unified hour and a half to each session. Various issues were reviewed in Code and is included in the Rules and Regulations of the Board. depth at such meetings in connection with trends in human Once again this year, the self-evaluation of the board focused resources management, the Commercial Banking school and on the organisation, operation and content of the meetings of Grupo Santander’s technology . the latter and its committees, comparing them with those of The Rules and Regulations (article 21.7) provide that the board other international banks, and open questions on issues relating shall make available to new directors an information programme to the future (strategy, internal and external factors). providing quick and adequate understanding of the Bank and its As strong features of the Group's corporate governance, Group, including its governance rules. This programme was thus directors highlighted the following: the knowledge of banking made available to the newest directors. business and experience of the directors, the balance between executive and external directors, dedication of members of the board and involvement in risk control. Furthermore, the committee structure enables the board to be more closely involved with the Group's day-to-day operation and activities emphasising the dedication and involvement of directors. In the opinion of the directors, these strengths have made the Group a reference point in the present crisis, thanks to the board's involvement in controlling its credit risk and other risks, including reputational and operational risk. The renewal and internationalisation of the board continues, with the addition of a new director from Latin America. Likewise, with respect to the organisation, working and content of the board meetings, the following aspects were highlighted: the high level of strategic debate with the organisation of a monographic strategy meeting; the knowledge; the training programme and their high level of commitment. Appointment, re-election and ratification of directors The proposals for appointment, re-election and ratification of directors, regardless of the status thereof, that the board of directors submits to the shareholders for consideration at a general shareholders’ meeting, as well as the appointment decisions made by the board itself in the exercise of its powers to make interim appointments as permitted by law, must, in turn, be preceded by the corresponding proposal of the appointments and remuneration committee. Although the proposals of such committee are not binding, the Rules and Regulations of the Board provide that if the board does not follow them, it must give reasons for its decision. Currently, all directors have been appointed or re-elected at the proposal of the appointments and remuneration committee. 64 ANNUAL REPORT 2011
  • 67.
    Remuneration Report on the director remuneration policy As provided in the Bylaws (article 59.1), the board of directors Remuneration system annually approves a report on the director remuneration policy, Article 58 of the Bylaws provides that the directors shall have which sets forth the standards and grounds that determine the the right to receive, in consideration for the performance of remuneration for the last and current financial year, making such their duties as board members and as a share in the profits for report available to the shareholders on occasion of the call to each financial year, remuneration equal to 1% of the Bank’s net the annual general shareholders’ meeting. profits for the respective financial year, although a director may In 2011, such report was submitted to the shareholders at the agree to reduce such percentage. In exercise of its powers, the general shareholders’ meeting held on 17 June, as a separate board set the amount for financial year 2011 at 0.275% of the item on the agenda and as a consultative matter; 95.110% of Bank’s profits for the year. This percentage was calculated by the votes were in favour of the report. including in the numerator not only the annual allocation, but also the attendance fees accrued by the directors during the In addition, following the enactment of the Sustainable Economy financial year, as provided in such article 58. Act (Ley de Economía Sostenible) and the inclusion of a new article 61 ter in the Securities Market Act (Ley del Mercado de The remuneration of directors is approved by the board at the Valores), the shareholders at the aforementioned meeting proposal of the appointments and remuneration committee, approved an amendment of the Bylaws in order to expressly except for such remuneration as consists of the delivery of provide for the obligation to submit the report regarding director shares or options thereon, or that is paid under other remuneration policy to a vote of the shareholders as a remuneration systems established by reference to the value of consultative matter and as a separate item on the agenda, the shares of the Bank, the approval of which, under the law a practice that the Bank already followed since 2010. and the Bylaws, is within the purview of the shareholders acting at a general shareholders’ meeting, at the proposal of the board Transparency made after a report of the appointments and remuneration Pursuant to the Bylaws (article 59.2), the annual report includes committee. itemised information on the remuneration received by each director, with a statement of the amounts for each item of The Group’s policy provides that only executive directors can be remuneration. The report also sets forth, on an individual basis beneficiaries of remuneration systems consisting of the delivery for each item, the remuneration for the executive duties of shares or rights thereon. entrusted to the executive directors of the Bank. Remuneration of the board in 2011 All such information is contained in note 5 to the Group’s legal In 2011, the board agreed to reduce all directors’ remuneration, report. for all items, by 8%. The amount paid to its members for exercising their functions of supervision and collegiate decision-making has been reduced by 6% over 2010. This amount has been unchanged since 2008. As regards executive directors, the board decided to maintain the fixed remunerations for 2012 and reduce by an average of 16% the variable ones for 2011. Full details of director compensation policy in 2011 may be found in the report by the appointments & remuneration committee which forms part of Banco Santander’s corporate documentation. Anticipation and adjustment to the regulatory framework For several years now, the board of directors, at the proposal of the appointments and remuneration committee, has promoted measures based on the need to have a remuneration system in place that encourages a rigorous management of risks. This initiative is implemented together with on-going monitoring of the recommendations issued by the principal national and international bodies with authority in this field. ANNUAL REPORT 2011 65
  • 68.
    Duties of directors,related-party Committees of the board transactions and conflicts of interest General The board has set up, as decision-making committees, an Duties executive committee, to which it has delegated general The duties of the directors are governed by the Rules and decision-making powers, and a risk committee, to which it has Regulations of the Board, which conform both to the provisions delegated powers specifically relating to risks. of current Spanish law and to the recommendations of the Unified Good Governance Code (Código Unificado de Buen The board also has the following committees with supervisory, Gobierno). reporting, advisory and proposal-making powers: the audit and compliance committee, the appointments and remuneration The Rules and Regulations expressly provide for the duties of committee, the international committee, and the technology, diligent management, loyalty, secrecy and inactivity in the event productivity and quality committee. of knowledge of confidential information. Executive committee The duty of diligent management includes the directors’ duty to The executive committee is a basic instrument for the corporate inform themselves adequately of the running of the Bank and to governance of the Bank and its group. Its duties and dedicate to their duties the time and effort needed to carry them composition are established in the Bylaws (article 51) and in the out effectively. The directors must inform the appointments and Rules and Regulations of the Board (article 14). remuneration committee of their other professional obligations, and the maximum number of boards of directors on which they There are currently 9 directors sitting on the committee, may sit is governed by the provisions of Act 31/1968, of 27 July. of whom 4 are executive and 5 are non-executive directors. Of the latter, 4 are independent and 1 is neither proprietary Related-party transactions nor independent. To the best of the Bank’s knowledge, no member of the board of directors, no person represented by a director and no company of The executive committee proposes to the board those decisions which such persons, or persons acting in concert with them or that are within its exclusive purview. It also reports to the board through nominees therein, are directors, members of senior on the matters dealt with and the resolutions adopted by management or significant shareholders, has made any unusual making the minutes of its meetings available to the directors or significant transaction with the Bank during financial year 2011 (article 14.7 of the Rules and Regulations of the Board), among and through the date of publication of this report. other ways of reporting. Control mechanisms Risk committee As provided in the Rules and Regulations of the Board (article It is governed by the Bylaws (article 52) and the Rules and 30), directors must inform the board of any conflict of interest, Regulations of the Board (article 15), which define the whether direct or indirect, that they may have with the interests composition and duties of this committee, including within its of the Bank. If the conflict relates to a transaction, the director powers and duties the responsibilities set forth in the Unified may not carry it out without the approval of the board, following Code regarding risk control and management. a report of the appointments and remuneration committee. The committee is currently made up of five directors, of whom The director involved must refrain from participating in the two are executive and three are non-executive. Of these three discussion and voting on the transaction to which the conflict non-executive directors, two are independent and one is neither refers. proprietary nor independent. Its chairman is a vice-chairman with executive duties pursuant to the Rules and Regulations of In the case of directors, the body in charge of resolving any the Board (article 15.1). disputes is the board of directors itself. Pages 144 to 203 of this annual report contain broad Specific situations of conflict information regarding the risk committee and the Group’s risk In financial year 2011 there were 75 cases in which directors, policies, the responsibility for which (article 3 of the Rules and including those who are members of senior management, Regulations of the Board) is part of the board’s general duty of abstained from participating and voting in the discussions of the supervision. board of directors or of the committees thereof. Audit and compliance committee The breakdown of the 75 cases is as follows: on 49 occasions, the As provided in the Bylaws (article 53) and the Rules and matter under consideration was the approval of terms of Regulations of the Board (article 16), the audit and compliance remuneration and other terms of the contracts with the directors; committee must be made up of non-executive directors, the on 11 occasions, proposals were discussed regarding the majority of whom must be independent. Its chairman shall be financing of companies or entities related to various directors or an independent director. It is currently composed of to those abstaining, and projects were discussed regarding the independent non-executive directors only. provision to such companies of other financial services and regarding sales of interests therein; on 7 occasions, the situation Its duties, listed in the above-mentioned provisions, conform to of conflict was due to proposals for appointment or re-election of the recommendations of the Unified Code for audit committees the directors; on 5 occasions, the situation arose from the annual and the internal audit function. verification of the status of the directors made by the appointments and remuneration committee at its meeting of 16 The audit and compliance committee has prepared a report March 2011 pursuant to article 6.3 of the Rules and Regulations regarding its activities in 2011, which is provided to the of the Board; on 2 occasions, the conflict was related to the non- shareholders as a part of the annual documents. existence of the circumstances set forth in article 23.2 of such Rules and Regulations; and on one occasion, the matter at hand was the approval of a corporate social responsibility activity in favour of a foundation chaired by a director. 66 ANNUAL REPORT 2011
  • 69.
    Appointments and remunerationcommittee International committee The Bylaws (article 54) and the Rules and Regulations of the The international committee (article 13 of the Rules and Board (article 17) provide that this committee is also to be made Regulations of the Board) has the duty to monitor the up exclusively of non-executive directors and that its chairman development of the Group’s strategy and of the activities, shall be an independent director, as is in fact the case. All its markets and countries in which the Group desires to have a current members are independent non-executive directors. presence through direct investments or the conduct of specific transactions. It is kept informed of the initiatives and commercial During financial year 2011, none of the members of the strategies of the various units within the Group and of the new appointments and remuneration committee was an executive projects arising for it. It is also responsible for reviewing the director, member of senior management or employee of the performance of financial investments and of the business, as Bank, and no executive director or member of the senior well as the international economic situation, in order to make, if management of the Bank sat on the board (or on the appropriate, proposals calculated to correct country-risk limits, remuneration committee) of companies that employed the structure and profitability thereof and their allocation by members of the appointments and remuneration committee. business and/or unit. The Rules and Regulations of the Board establish the duties of It is made up of seven directors, of which three are executive this committee, including responsibilities in addition to those and four are independent non-executive. recommended by the Unified Code for appointments and remuneration committees. Since 2004, the appointments and remuneration committee has published an activities report which, since 2006, also includes the report on director remuneration policy. Technology, productivity and quality committee The technology, productivity and quality committee (article 13 of the Rules and Regulations of the Board) has the duty to review and report on plans and activities regarding information systems and programming of applications, investments in computer equipment, design of operating processes in order to increase productivity, and programmes for the improvement of service quality and measuring procedures, as well as those relating to means and costs. It is made up of eight directors, three of whom are executive and five are non-executive; of the five non-executive directors, four are independent and one is neither proprietary nor independent. Main committees of the board Audit and Appointments and Executive Risk compliance remuneration committee committee committee committee Nº of members(*) 10(**) 5 5 5 Executive 5(**) 2 - - Non executive 5 3 5 5 Nº of meetings 59 99 12 11 Hours(***) 295 297 60 33 (*) Data at year-end 2011. (**) At the date of publication of this report, 9 members of which 4 are executive directors. (***) Estimated hours of average dedication per director. ANNUAL REPORT 2011 67
  • 70.
    International advisory board Composition of the international advisory board by nationality Since 1997, the board of directors has an international advisory board, made up of members of various nationalities and from Spain 2 various areas of activity, all of whom come from outside the Bank and none of whom serve as directors; such international advisory board cooperates with the board of directors in the France 2 design, development and, if applicable, implementation of the overall business strategy by contributing ideas and suggesting Portugal 1 business opportunities. During 2011, the international advisory board held 2 meetings, during which the following issues were discussed, among USA 1 others: the euro crisis and the mechanisms for stabilisation of and support for this currency; the situation in Portugal; the Mexico 2 Group’s results in 2010 and its performance in 2011; the United Kingdom 1 acquisition of Bank Zachodni WBK; the oil market situation; the Investor Day and the political and economic situation in the US. It is currently composed of the following 9 members, representing 6 nationalities: Main areas of professional experience of the international advisory board members Chairman Mr Antonino Fernández, former chairman of Grupo Modelo in Financial services 2 Mexico Government 2 Members Mr Bernard de Combret, chairman of Total Trading Geneve Mr Carlos Fernández González, chairman and executive vice president of Grupo Modelo in Mexico Mr Santiago Foncillas, former chairman of Grupo Dragados International (Europe) 3 Mr Richard N. Gardner, former US ambassador to Spain International (Latam) 2 Mr Francisco Pinto Balsemâo, former prime minister of Portugal Sir George Mathewson, former chairman of the Royal Bank of Scotland Mr Antoine Bernheim, honorary chairman of Assicurazioni Generali S.p.A. Mr Fernando Masaveu, chairman of Grupo Masaveu Secretary Mr Ignacio Benjumea Cabeza de Vaca 68 ANNUAL REPORT 2011
  • 71.
    Attendance at meetingsof the board Attendance rate at meetings of the board % of directors and its committees in 2011 97.1 91.5 90.1 91.9 90.2 Pursuant to the Rules and Regulations of the Board (article 20.1), absences from meetings must be limited to unavoidable cases. The average attendance rate at board of directors’ meetings in financial year 2011 was 91.5%. 2007 2008 2009 2010 2011 The attendance rate at meetings of the board has exceeded 90% in each of the last five years. Attendance at meetings of the board of directors and its committees in 2011 % Committees Decision-making Reporting Appointments Technology, Audit and and productivity Board Executive Risk compliance remuneration and quality International Average attendance 91.54% 89.15% 87.47% 95.38% 96.23% 93.75% 87.50% Individual attendance: Mr Emilio Botín-Sanz de Sautuola y García de los Ríos 13/14 52/59 – – – 2/2 1/1 Mr Fernando de Asúa Álvarez 13/14 55/59 91/99 12/12 11/11 2/2 – Mr Alfredo Sáenz Abad 13/14 54/59 – – – 2/2 1/1 Mr Matías Rodríguez Inciarte 14/14 59/59 99/99 – – – – Mr Manuel Soto Serrano 13/14 – – 12/12 11/11 2/2 – Assicurazioni Generali S.p.A. (1) 7/9 – – – – – – Mr Antonio Basagoiti García-Tuñón 14/14 57/59 94/99 – – 2/2 – Ms Ana Patricia Botín-Sanz de Sautuola y O’Shea 12/14 37/59 – – – 1/2 0/1 Mr Javier Botín-Sanz de Sautuola y O’Shea 13/14 – – – – – – Lord Burns (Terence) 10/14 – – – – – – (2) Mr Vittorio Corbo Lioi 4/5 – – – – – – Mr Guillermo de la Dehesa Romero 14/14 54/59 – – 11/11 – 1/1 Mr Rodrigo Echenique Gordillo 14/14 51/59 – 12/12 11/11 – 1/1 Mr Antonio Escámez Torres 14/14 59/59 91/99 – – 2/2 1/1 Mr Ángel Jado Becerro de Bengoa 14/14 – – – – – – Mr Francisco Luzón López 13/14 48/59 – – – – 1/1 Mr Abel Matutes Juan 13/14 – – 12/12 – – 1/1 Mr Juan Rodríguez Inciarte 12/14 – 58/99 – – – – (3) Mr Luis Ángel Rojo Duque 3/6 – – 3/5 3/5 – – Mr Luis Alberto Salazar-Simpson Bos 13/14 – – 11/12 – 2/2 – (4) Ms Isabel Tocino Biscarolasaga 13/14 – – – 4/4 – – Note: the denominator refers to the number of meetings held during the year during which a director served as such or as a member of the respective committee. (1) Withdraws from the board on 24 October 2011. (2) Member of the board since 22 July 2011. (3) Vacates office upon death on 24 May 2011. (4) Member of the appointments and remuneration committee since 21 July 2011. ANNUAL REPORT 2011 69
  • 72.
    3. Shareholder rightsand the general shareholders’ meeting One share, one vote, one dividend. Encouragement of informed No defensive mechanisms participation of shareholders at contemplated in the Bylaws shareholders’ meetings The Bank has eliminated all defensive mechanisms in the Bylaws, The Bank continues to implement measures designed to fully conforming to the one share, one vote, one dividend encourage the informed participation of shareholders at principle. shareholders’ meetings. Thus, at the annual general meeting held in 2011, the shareholders had access to the electronic The Bylaws of Banco Santander provide for only one class of shareholders’ forum, in compliance with the provisions of the shares (ordinary shares), granting all holders thereof the same Companies Act (Ley de Sociedades de Capital). rights. Such forum, which the Bank made available on the corporate There are no non-voting or multiple-voting shares, or preferences website (www.santander.com), enables the shareholders to post in the distribution of dividends, or limitations on the number of proposed supplements to the agenda announced in the call to votes that may be cast by a single shareholder, or quorum meeting, requests for adherence to such proposals, initiatives requirements or qualified majorities other than those established aimed at reaching the percentage required to exercise a minority by law. right contemplated by Law, as well as voluntary proxy offers or solicitations. Any person is eligible for the position of director, subject only to the limitations established by law. Furthermore, the annual accounts and the corporate management of the Bank and its consolidated group, all for financial year 2010, were for the first time put to a vote under separate items on the agenda at the 2011 annual general Quorum at the annual general shareholders’ meeting. shareholders’ meeting held in 2011 The informed participation of shareholders at general shareholders’ meetings is an objective expressly acknowledged by the board (article 31.3 of the Rules and Regulations of the Board). The quorum at the 2011 annual general shareholders’ meeting was 53.710%, above 50% for the fifth consecutive year. Quorum at annual general shareholders’ meetings % of capital present in person and by proxy 56.6 55.9 54.6 54.4 53.7 2007 2008 2009 2010 2011 70 ANNUAL REPORT 2011
  • 73.
    Information provided tothe General shareholders’ meeting held shareholders and communication in 2011 with them Information on the call to meeting, On occasion of the 2011 annual general shareholders’ meeting, the establishment of a quorum, attendance, the chairman once again sent a letter to all shareholders inviting proxy-granting and voting them to suggest the matters they would like to see dealt with, Annual general shareholders’ meeting of 17 June 2011 without prejudice to their rights to receive information and Notice of the call to meeting was published on 9 May, 38 days make proposals. prior to the date of the meeting. A total of 274,517 1,017 letters and e-mails were received, all of which were duly shareholders attended, in person or by proxy, with answered. 4,533,243,123 shares. The quorum was thus 53.710% of the share capital of the Bank. During 2011, the Bank held 598 meetings with investors and maintained an on-going relationship with analysts and rating The average percentage of affirmative votes upon which the agencies, which entailed personal contact with more than 1,350 proposals submitted by the board were approved was 94.027%. investors/analysts. In September it was held in London the The following data are stated as percentages of the Bank’s share Group’s Investor Day. During two days the top management capital: analysed with the investment community the outlook, trends and strategic and financial vision for Santander and its most important business units. More than 300 people attended the Meeting of 17 June 2011 event. For the fourth consecutive year, the department of relations Physically present 0.408% (1) with investors and analysts was chosen by investors (buy side) as By proxy 34.784% (2) the best IR Team in the financial industry in Europe, and this year Remote votes 18.517% (3) it was also so chosen by analysts (sell side), according to the survey conducted by the specialised magazine Institutional Total 53.710% Investor. The department also continued to inform the main (1) Of such percentage (0.408%), 0.002% is the percentage of share capital that attended by remote investors and analysts of the Group’s policies in the area of means through the Internet. (2) The percentage of share capital that granted proxies through the Internet was 0.024%. corporate social responsibility. (3) Of such percentage (18.517%), 18.512% is the percentage of votes cast by postal mail, and the rest is the percentage of electronic votes. Santander has continued to strengthen the channels for shareholder information and service through the seven shareholder’s offices it has in significant markets in which it is Resolutions adopted at the general shareholders’ present (Spain, United Kingdom, United States of America, meeting held in 2011 Brazil, Mexico, Portugal and Chile). The full text of the resolutions adopted at the 2011 annual general shareholders’ meeting is available on the websites of Channels for shareholder information and service both the Group (www.santander.com) and the CNMV (www.cnmv.es). Telephone service lines 232,430 questions Shareholder’s mailbox 51,616 e-mails answered 234,065 subscriptions Forums 19,819 participants 206 held Letters 677,060 letters answered Finally, in compliance with recommendations of the National Securities Market Commission (CNMV) on meetings with analysts and investors, both notices of meetings and the documentation to be used thereat are being published sufficiently in advance. ANNUAL REPORT 2011 71
  • 74.
    4. Banco Santander’ssenior management Composition The Bank is managed at the highest level through the executive vice presidents, under the control of the chairman and the chief executive officer. Accordingly, the chairman, the chief executive officer and the following executive vice presidents make up the Bank’s senior management, regardless of their positions, if any, on the board of directors: Banco Santander´s senior management America Mr Jesús Mª Zabalza Lotina Internal Audit Mr Juan Guitard Marín Retail Banking Spain Mr Enrique García Candelas Global Wholesale Banking Mr Adolfo Lagos Espinosa Mr Jorge Maortua Ruiz-López Global Private Banking, Asset and Insurance Management Mr Javier Marín Romano Banesto Mr José García Cantera(*) Brazil Mr Marcial Portela Álvarez Communication, Corporate Marketing and Research Mr Juan Manuel Cendoya Méndez de Vigo United States Mr Jorge Morán Sánchez Mr Juan Andrés Yanes Luciani Strategy and Asia Mr Juan Rodríguez Inciarte Consumer Finance Ms Magda Salarich Fernández de Valderrama Financial and Investor Relations Mr José Antonio Álvarez Álvarez Financial Accounting and Control Mr José Manuel Tejón Borrajo Human Resources Mr José Luis Gómez Alciturri Risk Mr Matías Rodríguez Inciarte Mr Javier Peralta de las Heras Mr José María Espí Martínez Santander Totta D. Antonio Vieira Monteiro (**) Santander UK Ms Ana Patricia Botín-Sanz de Sautuola y O’Shea Mr José María Nus Badía General Secretariat Mr Ignacio Benjumea Cabeza de Vaca Mr César Ortega Gómez Technology and Operations Mr José María Fuster van Bendegem (*) Chief executive officer of Banesto (not an executive vice president of Banco Santander). (**) Santander’s counntry head in Portugal (not an executive vice president of Banco Santander). In addition, Mr Ramón Tellaeche Bosch, a deputy executive vice president of the Bank, is the head of the Payment Means division, and Mr José Antonio Villasante Cerro, also a deputy executive vice president of the Bank, is the head of the Santander Universidades global division. 72 ANNUAL REPORT 2011
  • 75.
    Remuneration Information on theremuneration of executive vice presidents is provided in note 5 to the Group’s legal report. Related-party transactions and conflicts of interest Related-party transactions To the knowledge of the Bank, no member of senior management who is not a director, no person represented by a member of senior management who is not a director, and no company in which such persons or persons with whom they act in concert or who act through nominees therein are directors, members of senior management or significant shareholders, has made any unusual or significant transaction with the Bank during financial year 2011 and through the date of publication of this report. Conflicts of interest The control mechanisms and the bodies in charge of resolving this type of situation are described in the Code of Conduct in Securities Markets, which is available on the Group’s website (www.santander.com). ANNUAL REPORT 2011 73
  • 76.
    5. Transparency andindependence Financial information and other Relationship with the auditor significant information Independence of the auditor The shareholders acting at the general shareholders’ meeting of Financial information 17 June 2011 approved the re-election of Deloitte, S.L. as Pursuant to the provisions of its Rules and Regulations (article auditor for one year, with the affirmative vote of 97.775% of 34.2), the board has taken the necessary actions to ensure that the capital present in person or by proxy. the quarterly and semi-annual financial information and the other information made available to the markets is prepared The Bank has mechanisms in place to preserve the following the same principles, standards and professional independence of the auditor; worth noting is the obligation of practices as are used to prepare the annual accounts. To such the board to refrain from hiring audit firms in which the fees end, the aforementioned information is reviewed by the audit intended to be paid to them for any and all services are more and compliance committee prior to the release thereof. than two per cent of the total income thereof during the last financial year. As regards the annual accounts, they are reported on by the audit and compliance committee and certified by the head of In addition, the Rules and Regulations of the Board establish financial accounting prior to the preparation thereof by the limits upon hiring the audit firm for the provision of services board. other than audit services that could jeopardise the independence thereof and impose on the board the duty to Other significant information make public the overall fees paid by the Bank to the auditor for Pursuant to the provisions of the Code of Conduct in Securities services other than audit services. The information for financial Markets, the compliance area is responsible for communicating year 2011 is contained in note 48 to the Group’s legal report. to the CNMV the significant information generated in the Group. The Rules and Regulations determine the mechanisms to be used to prepare the accounts such that there is no room for Such communication shall be simultaneous to the release of qualifications in the auditor’s report. Nevertheless, the Bylaws as significant information to the market or the media, as soon as well as the Rules and Regulations also provide that, whenever the decision in question is made or the resolution in question the board believes that its opinion must prevail, it shall provide has been signed or carried out. Significant information shall be an explanation, through the chairman of the audit and disseminated in a true, clear, complete and equitable fashion compliance committee, of the content and scope of the and on a timely basis and, whenever practicable, such discrepancy and shall endeavour to ensure that the auditor issue information shall be quantified. a report in this regard. The annual accounts of the Bank and of the consolidated Group for financial year 2011 are submitted In financial year 2011, the Bank published 124 material fact without qualifications. notices, which are available on the websites of the Group and the CNMV. At its meeting of 13 febrero 2012, the audit and compliance committee received from the auditor a written confirmation of its independence in respect of the Bank and the entities directly or indirectly related thereto, as well as information regarding additional services of any kind provided to such entities by the auditors or by entities related thereto, pursuant to the provisions of Legislative Royal Decree 1/2011, of 1 July, approving the Consolidated Audit Act. At its meeting of 13 febrero 2012, such committee issued a report setting forth a favourable opinion regarding the independence of the auditors and passing, among other matters, upon the provision of the additional services mentioned in the preceding paragraph. The aforementioned report, issued prior to the audit report, has the content provided by the Securities Market Act (Ley del Mercado de Valores). 74 ANNUAL REPORT 2011
  • 77.
    Intra-group transactions Website There were no intra-group transactions in financial year 2011 Since 2004, the Group’s website (www.santander.com) has that were not eliminated in the consolidation process and that disclosed in the Information for Shareholders and Investors are not part of the ordinary course of business of the Bank or of section of the main menu all information required by the the companies of its Group as regards the purpose and Companies Act (Ley de Sociedades de Capital) and under Order conditions thereof. ECO/3722/2003, thus carrying out the resolution adopted by the board at its meeting of 23 January 2004. The website contents are presented with specific sections for institutional investors and shareholders and the information is accessible in Spanish, English and Portuguese. The information available on such website includes: • The Bylaws. • The Rules and Regulations for the General Shareholders’ Meeting. • The Rules and Regulations of the Board. • The professional profiles of and other information regarding the directors, in line with recommendation 28 of the Unified Code. • The annual report. • The annual corporate governance report. • The Code of Conduct in Securities Markets. • The General Code of Conduct. • The sustainability report. • The reports of the audit and compliance committee and the appointments and remuneration committee. • The Santander-Banesto relationship framework established by application of recommendation 2 of the Unified Code. The announcement of the call to the 2012 annual general shareholders’ meeting will be viewable as from the date of publication thereof, together with the information relating thereto, including proposed resolutions and mechanisms for the exercise of the rights to receive information, to grant proxies and to vote, as well as an explanation of the mechanisms for the exercise of such rights by means of data transmission and the rules applicable to the electronic shareholders’ forum that the Bank will make available on its website (www.santander.com). ANNUAL REPORT 2011 75
  • 78.
    6. Unified GoodGovernance Code In 2007, Banco Santander carried out a process of adjustment to the Unified Good Governance Code, approved by the Number of members of the board National Securities Market Commision (CNMV) on 22 May 2006, of directors based on the principle of self-regulation, which was completed in 2008 with the approval of new Bylaws and, in 2009, with Although the current number of directors (18) exceeds the new Rules and Regulations of the Board of Directors. maximum number of 15 proposed by recommendation 9, the board believes that its size is commensurate with the scale, Banco Santander follows practically all of the recommendations complexity and geographical diversification of the Group. In the of the Unified Code, and does not follow (i.e., does not adopt in opinion of the board, the manner in which it operates, sitting full) a small number of them (3 out of 58). Such both as a full body and through committees —with delegated recommendations from which the Bank departs are described in supervisory, advisory, reporting and proposal-making powers—, the following sections, together with the rationale for the guarantees its effectiveness and the participation of its board’s position. members. However, should the board’s proposal regarding the appointment, re-election and ratification of directors is approved by shareholders at the general meeting in March 2012, the number of board members would be reduced to 16, from the 20 existing at the beginning of 2011. 76 ANNUAL REPORT 2011
  • 79.
    Independent directors The board has also not deemed it appropriate to adopt recommendation 29 to the effect that the term of office of In the opinion of the board, no different treatment should be independent directors be limited to a maximum of 12 years, as established for independent directors vis-à-vis other directors. this would lead to having to dispense with the services of directors whose continuation on the board serves the corporate Accordingly, it believes that it would not be in keeping with the interest because of their qualifications, contribution and aforementioned principles to adopt recommendation 31 to the experience, without such continuation affecting their effect that the board of directors should not propose the independence. withdrawal of any independent director prior to the expiration of the term fixed by the bylaws for which he was appointed, except for just cause, determined by the board following a report of the appointments and remuneration committee, with just cause being deemed to exist whenever such director fails to perform the duties inherent in his position or if he becomes subject to any of the circumstances that deprive him of independence. In this case, the decision of the board not to adopt recommendation 31 is also based on the fact that there may be reasons of corporate interest which, in the opinion of the board itself, may lead to a proposal for withdrawal from the board for reasons other than those contemplated in the recommendation. ANNUAL REPORT 2011 77
  • 80.
  • 81.
    80 Consolidated financial report 99 Information by segments 100 1. Principal segments or geographic areas 136 2. Secondary segments or by business 79
  • 82.
    Economic and financial review Generalbackground Mexico showed considerable resistance to the international The global economy continued to slowdown, due to worsening financial turbulence and weakening of the global economy. of European sovereign debt crisis and a fall in confidence, with Based on figures for the first nine months (+4.5% year-on-year new episodes of uncertainty as of the summer which, sparked growth in the third quarter), GDP growth for the whole year tougher funding conditions. This scenario was partly offset by a was around the potential rate of 4%. This was due to industrial general softening of monetary policy: injections of liquidity in the output, investment and the recovery in lending to the private case of the European Central Bank, a prolongation of low interest sector, particularly consumer credit, which is expected to rates in the US and cuts in official interest rates in Latin America. remain solid in coming quarters despite the external uncertainties. The US economy grew 1.7%, after growth of 2.8% annualised in the fourth quarter, which helped to offset part of the drop in The good activity growth, moderate inflation (3.4% average in growth in the first half of 2011. This growth, basically due to 2011), which remained within the Bank of Mexico’s target investment in equipment and the external sector, gradually gave range (2%-4%), and an external position favoured by higher oil way to greater participation of consumption and investment in prices enabled the central bank to hold its key interest rate at non-residential construction, which will remain in coming 4.5%, keeping its leeway. The peso depreciated during the year, quarters and put the growth rate at around its potential. after ending the year at MXN 13.95/$1, the result of international financial tensions in the second half of the year. The impact of oil prices and greater use of installed capacity raised inflation to more than 3% in the middle of the year. The Chilean economy grew 6.3%, partly due to the weakness in However, the underlying rate remained under control at around the beginning of 2010 following the earthquake. Growth was 1.5%, enabling the Federal Reserve to maintain a very on a downward trend, more so in the second half of the year accommodating monetary policy in favour of growth and re- because of international tensions, which is expected to continue establish the interbank market. because of a weaker external environment and flagging private consumption. Latin America kept up good growth rates for the year as a whole, although lower than in 2010. In the second half the Inflation remained under control (3.3% average), enabling the impact of the downturn in the global economy and the drop in central bank to stop raising interest rates in the second half of raw material prices began to be felt. In order to counter the the year (+200 b.p. between January and June to 5.25%). The impact on growth, some central banks began to soften their spurt in inflation in the last part of the year (4.4% in December) monetary policies, which is still going on. This strategy is likely to is considered temporary, which would allow the central bank to be replicated by other central banks during 2012. maintain leeway for softening monetary policy and fostering growth, as reflected in January when it cut the rate by 25 b.p. Brazil’s growth eased to 3.0% from 4.2% year-on-year in the to 5%. The peso, like other main currencies in the region, first quarter and subsequent deceleration, which reached a low depreciated, ending the year at CLP 519/$1. in the third quarter. The downturn led the central bank to begin to gradually cut the Selic rate from 12.50% in September to The euro zone grew 1.6% in 2011. After a robust start, activity 10.50% in January 2012, a trend that will continue in the slowed due to risks appearing that threatened the recovery coming months. (greater than envisaged impact of the rise in raw material prices and Japan’s earthquake), coupled with, in the second half of the A softer monetary policy and buoyant domestic demand, backed year, management of the sovereign debt crisis that did not by a solid labour market (jobless rate at its lowest, less than 5%), convince the markets. Fourth quarter GDP shrank 0.3%, a fall will continue to fuel growth. Inflation remained high (6.5% in expected to carry on into early 2012. December) and in some months above the central bank's target (4.5+2%). As regards the currency, the evolution of interest rates in Inflation remained above the ECB’s target throughout the year the second half of the year and the measures to control an (2.7% vs. 2%) and in December began a downward path (from excessive appreciation of the real produced a depreciation for the 3.0% to 2.8%) that could see inflation moving towards the year as a whole. The real ended 2011 at BRL 1.87/$1 (BRL 1.66/$1 target. in 2010). 80 ANNUAL REPORT 2011
  • 83.
    In this contextof sharp slowdown and uncertainty, the ECB Summary of 2011 for Grupo Santander undid in the fourth quarter the two rises in its rates carried out Grupo Santander registered attributable profit of EUR 5,351 in the first half of the year (from 1.0% to 1.5%) and ended million in 2011, a decline of 34.6% from 2010. Profit would 2011 with a repo rate of 1%. Furthermore, it re-established have been EUR 7,021 million, a decline of 14.2%, if the bank unconventional liquidity facilities and in December made a new had not made pre-tax provisions in the fourth quarter against auction (3 years without a volume limit) which will be repeated property exposure in Spain of EUR 1,812 million and a pre-tax in February 2012. The intensified tensions in the euro zone and amortisation of EUR 601 million from goodwill related to the slower growth caused the euro to gradually weaken against Santander Totta. The bank also applied net capital gains of EUR the dollar and end the year at EUR 1/$1.29 (EUR 1/$1.34 in 1,513 million realised in 2011 to other provisions. 2010). In an environment that was once again complex in many There are significant divergences and prospects in the euro markets where it operates, Santander continued to prove the zone. The worst countries are the so called peripheral ones, robustness of its business model, which is adapted to the which face a greater loss of confidence and high funding costs various markets and environments. Differentiated management combined with the shrinkage effect of fiscal adjustment policies. enables Santander to generate high recurring profits, while Germany, on the other hand, is in a better situation, with GDP improving, at the same time, the Group’s positioning for the growth of 3.0% in 2011 and an unemployment rate of 6.8%, coming years. the lowest rate since 1991. However, like the euro zone, fourth quarter growth shrunk 0.2% which could be corrected in the The pillars of Santander’s model are the focus on the customer short term. and on commercial business, geographic diversification, the continuous striving to improve efficiency, prudence in risk and The Spanish economy expanded 0.7% in 2011, fuelled by discipline in capital and liquidity. All of this enhanced by the exports, which offset the weak domestic demand. Growth Santander brand, which is recognised as one of the world’s slowed and GDP contracted 0.3% in the fourth quarter, due to leading financial brands. anaemic consumption. The continuation of these trends, combined with the impact of the large deficit reduction process, The key points in 2011 were: point to a return to recession, according to all forecasts. In this context, inflation, which remained high (3.2% average), largely 1) Solid generation of recurring profits. In the last few due to higher energy prices, fell significantly in the last part of years Grupo Santander has been able to keep on increasing the year (2.4% in December). its revenues which, as well as setting us apart from the sector, enabled net operating income (pre-provision profit) to The UK showed similar growth levels and profiles: +0.9% for the continue to grow and reach EUR 24,373 million in 2011. whole of 2011 and shrinkage in the fourth quarter (0.8% annualised). This reflected the worsening international financial This figure makes Santander one of the best banks in the and trade situation, and weak domestic demand, which is world in these terms. It also shows an excellent evolution expected to continue in coming quarters, although partly offset during the four years of the crisis, as profits before provisions by a more stable labour market. amounted to EUR 90,000 million. Inflation was high throughout the year (4.5% average) but on a This capacity to generate such results makes the income downward path (4.2% in December as against 5.2% in statement very solid and gives it a substantial cushion for September) which will continue in 2012. The Bank of England, absorbing provisions in the most demanding environments. which held its base rate at 0.5%, increased its programme to The 2011 income statement continues to reflect the buy bonds by £75,000 million in October, which was added to diversification and management focuses adapted to each the £200,000 million already acquired. Sterling appreciated market: against a euro weakened by the sovereign debt crisis to £1/EUR 1.20 (£1/EUR 1.16 in 2010). – By areas, growth in net operating income in emerging markets (Latin America and, in local criteria, Poland). There was also an increase in the units of developed countries where the macroeconomic environment is still weak but the units are benefiting from the business moment (US and consumer business, ahead in the cycle). All of this is in stark contrast to the sharp fall in profits in markets such as Spain and Portugal, hard hit by intense deleveraging, as well as the lower level in the UK which was very affected by the cost of regulatory impacts. – By lines, of note was the growth in revenues (+5.3%). Net interest income and net fees increased at a good pace in a scenario of lower activity in developed markets, very low interest rates and upward pressure of funding costs. On the other hand, the negative impact of gains on financial transactions of the operating areas, especially in Global Banking and Markets. ANNUAL REPORT 2011 81
  • 84.
    – Total operatingcosts increased 9.3%, reflecting a management model, together with the capacity to assign differentiated management on the basis of markets and profits to provisions, make the evolution of the credit quality businesses. Most of the rise was due to capture growth in ratios compare very well with those of other banks in the emerging markets. The efficiency ratio was 44.9%, the main countries where we operate. best among comparable banks. This led to the Group’s NPL ratio stabilising in the last two 2) Effort in provisions to strengthen the balance sheet. quarters. It ended 2011 at 3.89% and coverage was 61%. As well as the recurring profits, Grupo Santander decided to realise provisions net of taxes of EUR 3,183 million, of which 4) Strengthening the capital position. Grupo Santander EUR 1,513 million were drawn from capital gains and EUR once again displayed its financial strength and flexibility by 1,670 million from the fourth quarter profits. anticipating compliance with the European Banking Authority’s capital requirement, which has to be reached by The bank charged EUR 1,812 million pre-tax provisions against June 2012. The Group was able to carry out various the fourth quarter earnings to cover real estate exposure in measures to raise its core capital ratio from 7.53% to 9.01%, Spain and EUR 601 million in pre-tax provisions to amortise in accordance with the EBA’s criteria. goodwill related to the businesses in Santander Totta. At the same time, the increase in the last quarter meant that Moreover, net capital gains of EUR 1,513 million generated in the core capital ratio, in accordance with the BIS II 2011 were also assigned to provisions, including charges international standard, rose by 122 b.p. to 10.02% from against investment portfolios of EUR 620 million, and 8.80% in December 2010. For the fifth year running, the amortisation of intangibles and contributions to pensions and Group improved its solvency. other contingencies of EUR 893 million. 5) Solid funding structure and liquidity ratios. After a year The aforementioned provisions made for real estate risk of tensions in the markets, particularly in the second half, pushed up coverage of foreclosed properties in Spain to Santander managed to maintain a solid liquidity position, 50%, while coverage of doubtful and substandard loans with thanks to its considerable capacity in the retail market via its a real estate purpose was also improved (33% and 16% branches, and its broad and diversified access to wholesale respectively). markets via its model of subsidiaries. Another factor at play in the current context is deleveraging in some markets. These increases in coverage anticipated part of the new requirements outlined in the Royal Decree 2/2012 which The loan-to-deposit ratio ended 2011 at 117% compared to came into force on February 3, to increase provisions for real 150% at the beginning of the crisis in 2008. estate assets in the Spanish financial system. Moreover, the Group maintained in 2011 a very conservative In the case of Grupo Santander, such requirements amount policy in medium- and long-term wholesale issues. The to EUR 6,100 million, and will be entirely met in 2012, as volume issued was higher than the maturities during the follows: year. • EUR 1,800 million already charged against 2011 results. 6) High shareholder return. The total shareholder remuneration was EUR 0.60 per share, including the scrip • EUR 2,000 million are a capital buffer required by the rules dividend, thereby maintaining the remuneration for the last and already covered by the capital surplus held by the two years. Group. 7) Better positioning of the Group. In the last few years, • The remaining EUR 2,300 million will be covered through Santander has continued to combine organic growth capital gains which may be obtained during the year initiatives in key countries with active management of the (including EUR 900 million from the capital gain obtained business portfolio, enabling it to end the year in a more from the sale of Banco Santander Colombia) and through diversified position and with greater future growth potential. ordinary contributions to provisions during 2012. During 2011, some of the pending agreements announced at 3) High level of credit quality. Grupo Santander’s risk Exchange rates: 1 euro / currency parity 2011 2010 Year-end Average Year-end Average $ 1.2939 1.3903 1.3362 1.3228 Pound sterling 0.8353 0.8675 0.8608 0.8570 Brazilian real 2.4159 2.3244 2.2177 2.3262 New Mexican peso 18.0512 17.2523 16.5475 16.6997 Chilean peso 671.3400 672.0923 625.2748 673.9214 Argentine peso 5.5686 5.7445 5.3074 5.1737 Colombian peso 2,509.5191 2,568.6527 2,565.5040 2,507.2221 Uruguayan peso 25.8133 26.7630 26.5904 26.4588 Polish zloty 4.4580 4.1105 3.9750 3.9931 82 ANNUAL REPORT 2011
  • 85.
    the end of2010 materialised and other operations were Rating agencies carried out to increase and restructure the Group’s presence The Group’s access to wholesale finance markets, as well as the in emerging countries and developed with great potential for cost of issues, depend, to some extent, on the ratings given by Santander. rating agencies. As regards the Group’s incorporations, the acquisition of the These agencies regularly review the Group’s ratings. The long- Polish bank BZ WBK was completed (it began to consolidate term debt rating depends on a series of endogenous factors in the Group in the second quarter), as well as of the retail (solvency, business model, capacity to generate profits, ...) and business of Skandinaviska Enskilda Banken (SEB Group) in other exogenous ones related to the general economic Germany, which entered the Group in the first quarter. environment, the sector’s situation and the sovereign risk of the countries in which it does business. The transaction with the insurer Zurich was also completed in order to reorganise bancassurance business in Latin America Since autumn the difficulties in resolving the problems of and new partners entered the capital of Santander Consumer European countries, which have required financial assistance, USA, where the Group holds a 65% stake. together with worsening of the euro zone’s growth expectations, have produced a fall in confidence and a rise in These operations together with the economic cycle in the tensions on European sovereign debt. This situation led to a various geographic areas, increased the contribution of widespread and significant downgrading of the sovereign emerging countries up to 54% of the operating areas ratings of many European countries, which, in turn, resulted in attributable profit. actions on the rating of their banks. Lastly, agreement was reached to sell the subsidiary in Between October 2011 and February 2012, the Kingdom of Colombia, which will probably be completed during the first Spain’s credit rating was cut one notch by DBRS from AA to AA half of 2012. This sale will generate capital gains of around (low), three by Standard & Poor’s (from AA to A) and four in the EUR 615 million, which will also be assigned to strengthening case of Moody’s (from Aa2 to A3) and Fitch (from AA+ to A), the balance sheet. maintaining the negative outlook in all of them. As regards the main segments (geographic), the main These movements led to a review of Banco Santander’s ratings, developments were: which in February 2012 were as follows: • Continental Europe: attributable profit was 15.1% lower at EUR 2,849 million, hard hit by the low growth environment and deleveraging and low interest rates, as well as the Rating Agencies negative impact of gains on financial transactions and fee income. Profits fell at the three commercial networks and at Long Short Stand- wholesale businesses, while Santander Consumer Finance term term alone Outlook performed well (+51.5% in attributable profit) and Poland’s Standard & Poor’s A+ A-1 a Negative BZ WBK was incorporated to the Group in April. Fitch Ratings A F1 a Negative • United Kingdom: attributable profit of EUR 1,145 million Moody’s Aa3 P1 B- Negative (£993 million), 41.0% less than in 2010 in local currency. The DBRS AA (low) R1(medium) Negative income statement was very affected by the environment of low activity, low interest rates, regulatory changes, higher funding costs and the PPI charge. On the other hand, costs were almost flat and fewer provisions were made, reflecting Lastly, after its latest review, Standard & Poor’s put Banco the good evolution of non-performing loans. Santander’s long-term rating one notch above the Spanish sovereign credit rating. Fitch and DBRS give the Bank the same • Latin America: attributable profit of EUR 4,664 million, rating as the Kingdom of Spain, and following the recent similar to 2010 without the impact of exchange rates, thanks downgrading by Moody's of Spanish sovereign debt the Bank’s to the dynamism of net interest income and fee income, rating is three notches above that of the Kingdom of Spain. At which lifted gross income by 9.5%. This offset the higher the date of publication of this report, Moody’s was reviewing costs from investments, the pressure of inflation on salaries Banco Santander’s rating. and higher provisions. • Sovereign: attributable profits of EUR 526 million ($732 million), 30.3% higher in local currency than in 2010. Revenues and provisions performed well and costs rose because of investments in technology and commercial structures. ANNUAL REPORT 2011 83
  • 86.
    Grupo Santander generatedan attributable profit of EUR 5,351 Grupo Santander. Results million, 34.6% less than the EUR 8,181 million posted in 2010. Earnings per share (EPS) were EUR 0.6018 (-36.1%). Solid profit generation: the Group generated over EUR 24,000 million in net operating income for the The following factors need to be taken into account in order to first time ever (pre-provision profit), improving for the interpret the results appropriately. ninth year running. • In the second half of the year, the economic environment Big effort to strengthen the balance sheet: deteriorated considerably, which is leading to lower global extraordinary provisions of EUR 3,183 million net of growth. tax, of which EUR 1,513 were capital gains and EUR 1,670 million fourth quarter profits. • In the fourth quarter the bank made provisions for EUR 3,183 million net of tax, of which EUR 1,513 million came from Recurring profit amounted to EUR 7,021 million, capital gains and EUR 1,670 million from fourth quarter 14.2% less than in 2010: profits (EUR 1,812 million gross) to be assigned to real estate • Gross income rose 5.3% reaching historic highs, provisions in Spain, and EUR 601 million for the amortisation withstanding the cycle in mature markets and of Santander Totta's goodwill. recovering in emerging ones. • In addition, the profit reflects a one-off charge in the second • Differentiated management of costs by unit. quarter of EUR 620 million (£538 million) net of tax from a • Loan-loss provisions increased 3.0% due to the provision made in the second quarter related to Payment lower release of generic ones, as specific provisions Protection Insurance (PPI) remediation in the UK. were 9.8% lower. Income statement Million euros Variation 2011 2010 amount % 2009 Net interest income 30,821 29,224 1,597 5.5 26,299 Dividends 394 362 32 8.9 436 Income from equity-accounted method 57 17 40 235.1 (1) Net fees 10,471 9,734 737 7.6 9,080 Gains (losses) on financial transactions 2,500 2,606 (106) (4.1) 3,423 Other operating income/expenses 18 106 (88) (82.8) 144 Gross income 44,262 42,049 2,213 5.3 39,381 Operating expenses (19,889) (18,196) (1,694) 9.3 (16,421) General administrative expenses (17,781) (16,256) (1,525) 9.4 (14,825) Personnel (10,326) (9,330) (996) 10.7 (8,450) Other general administrative expenses (7,455) (6,926) (528) 7.6 (6,374) Depreciation and amortisation (2,109) (1,940) (169) 8.7 (1,596) Net operating income 24,373 23,853 519 2.2 22,960 Net loan-loss provisions (10,562) (10,258) (304) 3.0 (9,484) Impairment losses on other assets (173) (471) 298 (63.4) (402) Other income (2,822) (1,072) (1,749) 163.1 (1,311) Profit before taxes (w/o capital gains) 10,817 12,052 (1,235) (10.2) 11,764 Tax on profit (2,936) (2,923) (12) 0.4 (2,336) Profit from continuing operations (w/o capital gains) 7,881 9,129 (1,248) (13.7) 9,427 Net profit from discontinued operations (24) (27) 3 (9.3) 31 Consolidated profit (w/o capital gains) 7,857 9,102 (1,245) (13.7) 9,458 Minority interests 836 921 (85) (9.2) 516 Attributable profit to the Group (w/o capital gains) 7,021 8,181 (1,160) (14.2) 8,943 Net extraordinary capital gains and provisions (1) (1,670) — (1,670) — — Attributable profit to the Group 5,351 8,181 (2,830) (34.6) 8,943 EPS (euros) 0.6018 0.9418 (0.3400) (36.1) 1.0454 Diluted EPS (euros) 0.5974 0.9356 (0.3382) (36.1) 1.0382 Pro memoria: Average total assets 1,228,382 1,190,361 38,021 3.2 1,099,018 Average shareholders' equity 74,901 69,334 5,567 8.0 64,335 (1) In 2009 extraordinary capital gains and extraordinary provisions for the same amount are included, and thus the net amount is zero. 84 ANNUAL REPORT 2011
  • 87.
    • The impactof the exchange rates of various currencies against • Net interest income rose 5.5% to EUR 30,821 million. This the euro was not very significant at around one percentage was due to the net impact of several factors. point negative in comparing revenues and costs with 2011. In the UK and Latin America, the impact was one percentage – There was a positive effect from the moderate increase in point negative and in Sovereign five percentage points volumes and the improvement in the spreads on loans for negative. the whole Group (from 3.64% to 3.89%). • Lastly, there is a positive impact of around three or four points – Spreads on deposits which compared negatively in the first in revenues and costs from the change in perimeter. This half of the year, are already at the same levels (0.28% in impact is the net effect of the entry into consolidation of Bank 2010 and 0.29% in 2011). Zachodni WBK, AIG in Poland and SEB in Germany (Santander – Negative impact from the higher cost of wholesale funding Retail) and lower revenues from insurance business, as the and the greater regulatory requirements for liquidity in operation with Zurich Financial Services was closed in the some countries, mainly the UK. fourth quarter. • Net fee income increased 7.6%, with a favourable The performance of the income statement and comparisons performance of those from insurance and services. The latter with 2010 was as follows: showed rises in almost all lines: cards, demand deposits, etc. Basic revenues (net interest income, fee income and insurance On the other hand, income from securities and custody was results) amounted to EUR 41,685 million, 6.0% more than in lower and virtually unchanged from mutual and pension 2010 (+4.8% excluding the perimeter and exchange rate funds. effects). Quarterly Million euros 2010 2011 Q1 Q2 Q3 Q4 Q1 Q2 Q3 Q4 Net interest income 7,122 7,378 7,396 7,329 7,514 7,638 7,700 7,969 Dividends 47 144 60 111 40 193 60 101 Income from equity-accounted method 3 5 5 4 5 5 6 40 Net fees 2,326 2,483 2,481 2,445 2,595 2,729 2,694 2,454 Gains (losses) on financial transactions 724 567 599 715 657 722 639 482 Other operating income/expenses 38 38 22 9 41 (2) 18 (38) Gross income 10,260 10,614 10,563 10,613 10,852 11,285 11,117 11,008 Operating expenses (4,263) (4,548) (4,687) (4,698) (4,824) (4,908) (4,994) (5,164) General administrative expenses (3,812) (4,070) (4,206) (4,168) (4,314) (4,380) (4,456) (4,631) Personnel (2,182) (2,317) (2,408) (2,421) (2,521) (2,550) (2,611) (2,644) Other general administrative expenses (1,629) (1,753) (1,798) (1,746) (1,792) (1,830) (1,845) (1,987) Depreciation and amortisation (451) (478) (481) (531) (510) (528) (538) (534) Net operating income 5,997 6,066 5,876 5,915 6,029 6,377 6,123 5,843 Net loan-loss provisions (2,436) (2,483) (2,935) (2,404) (2,188) (2,684) (2,906) (2,785) Impairment losses on other assets (57) (63) (41) (310) (48) (52) (84) 11 Other income (331) (362) (364) (16) (550) (1,379) (361) (531) Profit before taxes (w/o capital gains) 3,173 3,158 2,535 3,186 3,243 2,262 2,773 2,538 Tax on profit (734) (680) (634) (874) (888) (636) (778) (634) Profit from continuing operations (w/o capital gains) 2,439 2,477 1,901 2,311 2,355 1,627 1,995 1,904 Net profit from discontinued operations (12) (1) (4) (10) (6) (0) (15) (3) Consolidated profit (w/o capital gains) 2,427 2,476 1,897 2,301 2,349 1,626 1,980 1,901 Minority interests 212 246 262 201 241 234 177 184 Attributable profit to the Group (w/o capital gains) 2,215 2,230 1,635 2,101 2,108 1,393 1,803 1,717 Net extraordinary capital gains and provisions — — — — — — — (1,670) Attributable profit to the Group 2,215 2,230 1,635 2,101 2,108 1,393 1,803 47 EPS (euros) 0.2553 0.2574 0.1884 0.2408 0.2382 0.1569 0.2030 0.0037 Diluted EPS (euros) 0.2537 0.2558 0.1854 0.2406 0.2364 0.1558 0.2007 0.0045 ANNUAL REPORT 2011 85
  • 88.
    Net interest income As regards the rest of revenues, dividends collected amounted Million euros to EUR 394 million (EUR 362 million in 2010), while income accounted for by the equity method was EUR 57 million, up + 5.5% 2011-2010 from EUR 17 million in 2010. This increase benefited from the recording in the fourth quarter of insurance business in Latin America. 30,821 29,224 Total gross income was EUR 44,262 million (EUR 42,049 26,299 million in 2010), 5.3% more than in 2010 (+4.0% excluding the perimeter and exchange rate effects). Operating expenses rose 9.3% and 6.8% excluding the perimeter and exchange rate effects. The year-on-year performance varied throughout the Group, depending on the environment and strategy followed in each unit. 2009 2010 2011 In Europe, both the large retail units (Santander Branch Network, Banesto and Portugal) as well as the UK recorded falls in expenses in real terms. Of note were the reductions of 2.5% at Banesto, Net fees 2.1% in Portugal and 1.2% in the Santander Branch Network. Million euros The global units (GBM and Asset Management and Insurance) + 7.6% 2011-2010 registered higher growth in expenses (+4.1%) because of investments in equipment and technology with the double purpose of strengthening the positions attained in key markets 10,471 and businesses in previous years, and developing new initiatives. 9,734 Moreover, there is also an increase in expenses resulting from 9,080 the incorporation of new entities, mainly Bank Zachodni WBK in Poland and SEB in Germany. In Latin America, costs also rose due to the drive in new commercial projects, the increase in installed capacity, the restructuring of points of attention, particularly in Brazil, and the 2009 2010 2011 revision of collective bargaining agreements in an environment of higher inflation. Sovereign also registered single digit growth in costs. Net operating income (pre-provision profit) was EUR 24,373 • Results from insurance activity were 3.9% higher at EUR million, 2.2% more than the EUR 23,853 million registered in 393 million (EUR 378 million in 2010) and were affected by 2010. the completion of the operation with Zurich Financial Services, which meant reduced revenues in the fourth quarter. Net operating income was particularly noteworthy as it set a new record. It rose for the ninth year running and exceeded EUR Gains on financial transactions dropped 4.1%, due to the 24,000 million for the first time, placing Santander among the net impact of two factors. On the one hand, the reduced best banks in the world for its profit generation capacity. revenues from the operating areas, mostly GBM (Global Banking and Markets), which were weak in the last three quarters of The efficiency ratio was 44.9% with amortisations and 40.2% 2011, very affected by the environment, compared to strong without amortisations (43.3% and 38.7%, respectively, in 2010). results in 2010, mainly in the first half of the year. On the other hand, Corporate Activities registered profits in hedging of exchange rates in 2011 as against losses in 2010. Gains on financial transactions as a proportion of total revenues dropped from 6.2% in 2010 to 5.6% in 2011. Net fees Million euros Variation 2011 2010 amount % 2009 Fees from services 6,171 5,632 538 9.6 5,267 Mutual & pension funds 1,236 1,267 (31) (2.4) 1,178 Securities and custody 668 784 (117) (14.9) 774 Insurance 2,397 2,051 346 16.9 1,861 Net fee income 10,471 9,734 737 7.6 9,080 86 ANNUAL REPORT 2011
  • 89.
    This performance showedthe Group’s capacity to continue to Gross income and expenses generate revenues in a difficult context and comfortably absorb Billion euros the provisions made for loan losses, which at EUR 10,562 million were 3.0% more than in 2010. This increase was due to Gross income the reduced release of generic provisions, as based on just Expenses specific ones there was a decline of 9.8%. 44.3 Similar comments can be made for Spain, where total provisions 42.1 rose 13.6% and specific ones dropped 32.0%. There were 39.4 significant reductions in provisions in the UK, Sovereign and Santander Consumer Finance (even with the incorporation of 19.9 new units). Provisions in Latin America excluding Brazil also 18.2 dropped. However, they rose strongly in Portugal, reflecting the 16.4 economic difficulties, and in Brazil because of the greater growth in lending of around 20% and an increase in the sector’s NPLs in previous quarters. 2009 2010 2011 Net operating income after provisions was EUR 13,811 million, 1.6% more than in 2010 (+1.1% excluding the perimeter and exchange-rate impacts). Net operating income Billion euros There were notable rises in these results in Santander Consumer Finance (+46.8%), Sovereign (+33.6%) and almost + 2.2% 2011-2010 all Latin American units such as Brazil (+2.9%), Mexico (+12.4%), Argentina (+8.2%), Puerto Rico (+42.4%) and Colombia (+43.1%). On the other hand there were declines in 24.4 23.9 the UK (-8.4%), after absorbing the significant effects of the 23.0 regulatory changes, as commented on in greater detail in the relevant section. There were larger falls in Spain (-30.4%) and Portugal (-56.2%). Asset impairment losses and other results were EUR 2,995 million negative compared to EUR 1,543 million, also negative, in 2010, largely due to the charge made in the second quarter for EUR 842 million gross for payment protection insurance (PPI) 2009 2010 2011 remediation in the UK. Profit before tax was 10.2% lower at EUR 10,817 million After deducting the tax charge profit from continued (excluding the perimeter and exchange rate effects: -10.6% ). operations was EUR 7,881 million (-13.7%). Recurring The tax charge of EUR 2,936 million was almost the same as in attributable profit, after incorporating discontinued operations 2010, mainly due to a higher rate in Brazil, Sovereign and and minority interests, was EUR 7,021 million (-14.2%). Corporate Activities. Operating expenses Million euros Variation 2011 2010 amount % 2009 Personnel expenses 10,326 9,330 996 10.7 8,450 General expenses 7,455 6,926 528 7.6 6,374 Information technology 875 798 77 9.7 786 Communications 659 670 (12) (1.7) 632 Advertising 695 634 62 9.7 594 Buildings and premises 1,667 1,553 114 7.4 1,405 Printed and office material 178 178 (0) (0.2) 209 Taxes (other than profit tax) 401 376 25 6.5 313 Other expenses 2,980 2,718 263 9.7 2,436 Personnel and general expenses 17,781 16,256 1,525 9.4 14,825 Depreciation and amortisation 2,109 1,940 169 8.7 1,596 Total operating expenses 19,889 18,196 1,694 9.3 16,421 ANNUAL REPORT 2011 87
  • 90.
    Net loan-loss provisions Millioneuros Variation 2011 2010 amount % 2009 Non performing loans 12,368 11,457 911 7.9 10,516 Country-risk (7) 2 (9) — (117) Recovery of written-off assets (1,800) (1,201) (598) 49.8 (915) Total 10,562 10,258 304 3.0 9,484 Moreover, and as it was already commented on, the bank made Profit before tax Million euros provisions for EUR 3,183 million net of tax, of which EUR 1,513 million came from capital gains and EUR 1,670 million from -10.2% 2011-2010 fourth quarter profits. After these impacts, attributable profit was EUR 5,351 million. Earnings per share were EUR 0.6018, 36.1% less than in 2010 and slightly affected by the capital increases in 2011 to 12,052 11,764 convert Valores Santander (convertible bonds) and tend to the 10,817 remuneration in shares for those shareholders that chose this option, as no adjustment was made retroactively to the number of shares of previous periods. The Group's ROE was 7.14% and ROTE (measured as attributable profit / shareholders equity less goodwill) was 2009 2010 2011 10.81% (9.37% and 14.18%, respectively, on the basis of recurring attributable profit). Attributable profit to the Group Million euros -34.6% 2011-2010 8,943 8,181 5,351 2009 2010 2011 Extraordinary capital gains and provisions (net of tax) Million euros -3,183 Impact on Funds established attributable profit: before tax -1,670 million -1,670 Not required Spain real estate 1,812 1,513 Portugal goodwill 601 Sale of Insurance Holding Latam 641 Amortisation of intangibles, -893 pensions and other SCF USA 872 -620 Portfolio writedowns transaction capital gains* provisions (*) Not including capital gains from agreement to sell the bank in Colombia, which are to be registered in 2012 88 ANNUAL REPORT 2011
  • 91.
    Balance sheet Million euros Variation 2011 2010 amount % 2009 Assets Cash on hand and deposits at central banks 96,524 77,785 18,739 24.1 34,889 Trading portfolio 172,637 156,762 15,875 10.1 135,054 Debt securities 52,704 57,871 (5,168) (8.9) 49,921 Customer loans 8,056 755 7,301 966.7 10,076 Equities 4,744 8,850 (4,107) (46.4) 9,248 Trading derivatives 102,498 73,069 29,429 40.3 59,856 Deposits from credit institutions 4,636 16,216 (11,581) (71.4) 5,953 Other financial assets at fair value 19,563 39,480 (19,917) (50.4) 37,814 Customer loans 11,748 7,777 3,971 51.1 8,329 Other (deposits at credit institutions, debt securities and equities) 7,815 31,703 (23,888) (75.4) 29,485 Available-for-sale financial assets 86,612 86,235 378 0.4 86,621 Debt securities 81,589 79,689 1,900 2.4 79,289 Equities 5,024 6,546 (1,522) (23.3) 7,331 Loans 779,525 768,858 10,667 1.4 736,746 Deposits at credit institutions 42,389 44,808 (2,419) (5.4) 57,641 Customer loans 730,296 715,621 14,675 2.1 664,146 Debt securities 6,840 8,429 (1,589) (18.9) 14,959 Investments 4,154 273 3,881 — 164 Intangible assets and property and equipment 16,840 14,584 2,257 15.5 11,774 Goodwill 25,089 24,622 466 1.9 22,865 Other 50,580 48,901 1,679 3.4 44,602 Total assets 1,251,525 1,217,501 34,024 2.8 1,110,529 Liabilities and shareholders' equity Trading portfolio 146,949 136,772 10,177 7.4 115,516 Customer deposits 16,574 7,849 8,725 111.2 4,658 Marketable debt securities 77 365 (288) (78.8) 586 Trading derivatives 103,083 75,279 27,804 36.9 58,713 Other 27,214 53,279 (26,064) (48.9) 51,559 Other financial liabilities at fair value 44,908 51,020 (6,111) (12.0) 42,371 Customer deposits 26,982 27,142 (160) (0.6) 14,636 Marketable debt securities 8,185 4,278 3,907 91.3 4,887 Due to central banks and credit institutions 9,741 19,600 (9,859) (50.3) 22,848 Financial liabilities at amortized cost 935,669 898,969 36,700 4.1 823,403 Due to central banks and credit institutions 116,368 79,537 36,832 46.3 73,126 Customer deposits 588,977 581,385 7,593 1.3 487,681 Marketable debt securities 189,110 188,229 880 0.5 206,490 Subordinated debt 22,992 30,475 (7,482) (24.6) 36,805 Other financial liabilities 18,221 19,343 (1,122) (5.8) 19,300 Insurance liabilities 517 10,449 (9,932) (95.1) 16,916 Provisions 15,571 15,660 (89) (0.6) 17,533 Other liability accounts 25,052 23,717 1,335 5.6 20,919 Total liabilities 1,168,666 1,136,586 32,080 2.8 1,036,659 Shareholders' equity 80,895 77,334 3,562 4.6 71,832 Capital stock 4,455 4,165 290 7.0 4,114 Reserves 72,660 66,258 6,402 9.7 61,071 Attributable profit to the Group 5,351 8,181 (2,830) (34.6) 8,943 Less: dividends (1,570) (1,270) (300) 23.6 (2,297) Equity adjustments by valuation (4,482) (2,315) (2,166) 93.6 (3,165) Minority interests 6,445 5,896 549 9.3 5,204 Total equity 82,859 80,914 1,944 2.4 73,871 Total liabilities and equity 1,251,525 1,217,501 34,024 2.8 1,110,529 ANNUAL REPORT 2011 89
  • 92.
    Total managed fundsat the end of 2011 amounted to EUR Grupo Santander. Balance sheet 1,382,980 million, of which 90%, EUR 1,251,525 million, were on-balance sheet and the rest off-balance sheet mutual and Activity continued to reflect the market context: pension funds and managed portfolios. • Lower demand for loans in Europe, especially in Two factors need to be taken into account in the year-on-year Spain and Portugal, and double-digit growth in comparisons: Latin America. • A slightly positive perimeter impact from the net effect of the • In funds, preference for deposits and conservative following changes in the Group’s composition: policy in issues. – Positive impact from the consolidation of Banco Zachodni • Loan-to-deposit ratio of 117% (150% at the start WBK in Poland, the incorporation to the Group in 2011 of of the crisis). SEB’s retail banking business in Germany (Santander Retail) Core capital ratio (BIS II) of 10.02%, after rising for into Santander Consumer Finance and the acquisition of GE the fifth year running. Capital Corporation's mortgage portfolio in Mexico and of Creditel in Uruguay. The European Banking Authority’s target has – Negative impact from Santander Consumer USA, which in already been reached: core capital ratio of 9.01%. December stopped consolidating by global integration and moved to consolidation by the equity accounted method, Shareholders’ equity per share increased again to and Latinoamerica’s bancassurance business. EUR 8.62. • The second effect came from the appreciation/depreciation of various currencies against the euro (end of period rates). Both the dollar and sterling appreciated by 3%, while the main Distribution of total assets by geographic segment Latin American currencies depreciated: Brazilian real and December 2011 Mexican peso (8%); Chilean peso (7%) and the Argentine peso (5%). The net impact of both is virtually zero. Sovereign 5% Other 5% The joint impact of the two effects on changes in customer Other Latin America 3% balances was minimal (less than one percentage point positive), Chile 3% Spain 27% both on lending as well as managed customer funds. Mexico 3% Lending The Group’s customer loans amounted to EUR 769,036 million, Brazil 13% 3.4% higher than in 2010. Eliminating the exchange rate and perimeter effects it was 3.0% higher. Portugal 4% Germany 3% The geographic distribution (principal segments) was also very Retail Poland 1% different by markets. Other Europe 5% United Kingdom 28% Customer loans Million euros Variation 2011 2010 amount % 2009 Public sector 12,147 12,137 10 0.1 9,803 Other residents 202,411 217,497 (15,086) (6.9) 222,355 Commercial bills 9,679 11,146 (1,466) (13.2) 11,134 Secured loans 117,946 127,472 (9,526) (7.5) 125,397 Other loans 74,785 78,879 (4,094) (5.2) 85,824 Non-resident sector 554,478 514,217 40,262 7.8 468,267 Secured loans 342,676 311,048 31,627 10.2 286,381 Other loans 211,802 203,168 8,634 4.2 181,886 Gross customer loans 769,036 743,851 25,185 3.4 700,424 Loan-loss allowances 18,936 19,697 (761) (3.9) 17,873 Net customer loans 750,100 724,154 25,946 3.6 682,551 Pro memoria: Doubtful loans 31,287 27,908 3,379 12.1 24,027 Public sector 102 42 60 142.0 18 Other residents 14,745 12,106 2,639 21.8 9,898 Non-resident sector 16,439 15,759 680 4.3 14,111 90 ANNUAL REPORT 2011
  • 93.
    In Continental Europe,Spain and Portugal’s lending fell by Gross customer loans 4.6% and 5.6%, respectively, due to deleveraging. Santander Billion euros Consumer Finance’s lending dropped 4.8%, due to the impact of the consolidation by the equity accounted method of + 3.4%* 2011-2010 Santander Consumer USA in December 2011 (+16.1% before * Excluding exchange rate impact: +3.8% this impact). The incorporation of Bank Zachodni WBK increased 769 the Group’s net lending by EUR 8,479 million. 744 Gross customer loans in Spain amounted to EUR 225,288 700 million, with the following structure: • Loans to the public sector amounted to EUR 12,147 million, (+0.1%). • Lending to individuals amounted to EUR 84,816 million, of which EUR 58,535 million were mortgages for homes. These 2009 2010 2011 are the healthiest part and with the least risk of further deterioration of the portfolio in Spain because of the different features of this product compared to similar ones in other countries. For example, the principle is amortised as of the Gross customer loans first day, the borrowers' responsibility extends to all their % o/ operating areas. December 2011 assets and almost all loans are for residences in ownership, with a very low expected loss. Sovereign 5% Other Latin America 2% In the specific case of Grupo Santander, the portfolio is mostly Chile 3% Mexico 3% composed of mortgages that are for the first residence, with large concentration of loans in the lowest tranches of loan-to- Spain 29% Brazil 11% value (88% with an LTV lower than 80%) and the NPL ratio is very low (2.7%). • Loans to SMEs and companies without real estate purpose, the most relevant part of the lending portfolio, amounted to Portugal 4% EUR 104,883 million and accounted for 47% of the total. Of Germany 4% note was the stability shown during the year (-0.4%) within Retail Poland 1% an environment of widespread reduction of lending in the United Kingdom 34% Other whole system. Europe 4% • Loans for real estate purposes (with the greatest risk) stood at EUR 23,442 million, after falling in every quarter of 2011. The total reduction for the year was EUR 3,892 million (-14.2%). Loan portfolio in Spain Billion euros The Group maintained in the year the strategy of previous years to reduce exposure to this segment of greater risk. The 245 total reduction in the last three years amounts to EUR 14,246 Total 236 225 million (-37.8%). Public Sector 10 12 In Portugal, the fall in lending (5.6%) came from all segments: Household mortgages 64 12 -11.8% to SMEs, -13.9% to companies and -3.1% to 61 59 individuals. In addition, balances in construction and real Other loans to individuals 31 30 estate, which represent only 3.6% of lending in the country, 26 declined 12.1% in 2011. Companies without real Santander Consumer Finance’s lending, after the operation at estate purpose 108 105 105 Santander Consumer USA, dropped 4.8%. Excluding this impact, growth was 16.1% due to organic growth plus SEB’s integration in Germany. New lending rose 11.1%. Real estate purpose 31 27 23 2009 2010 2011 ANNUAL REPORT 2011 91
  • 94.
    Credit risk management* Million euros Variation 2011 2010 amount % 2009 Non-performing loans 32,036 28,522 3,514 12.3 24,554 NPL ratio (%) 3.89 3.55 0.34 p. 3.24 Loan-loss allowances 19,661 20,748 (1,087) (5.2) 18,497 Specific 15,474 14,901 572 3.8 11,770 Generic 4,187 5,846 (1,659) (28.4) 6,727 NPL coverage (%) 61 73 (11 p.) 75 Credit cost (%) ** 1.41 1.56 (0.15 p.) 1.57 Ordinary non-performing and doubtful loans *** 18,318 18,061 257 1.4 17,641 NPL ratio (%) *** 2.26 2.28 (0.02 p.) 2.35 NPL coverage (%) *** 107 115 (8 p.) 105 * Excluding country-risk ** Net specific allowance / computable assets *** Excluding mortgage guarantees Note: NPL ratio: Non-performing loans / computable assets In the United Kingdom, the balance of customer loans was Bad and doubtful loans amounted to EUR 32,036 million, 4.6% higher. In local criteria, the stock of residential mortgages, 12.3% more than in 2010. in a still depressed market, were very stable, while loans to SMEs increased 25.4%, gaining further market share. Personal loans, The Group’s NPL ratio was 3.89% at the end of 2011 (+34 b.p.), reflecting the policy in the last few years of reducing them, but it only rose by 11 b.p. in the second half of the year (+3 b.p. declined 12.7%. in the fourth quarter). Lending in Latin America increased 17.9% excluding the In order to cover these loans, total loan-loss provisions exchange rate impact, due to organic growth and the amounted to EUR 19,661 million, of which 21% (EUR 4,187 incorporation of GE Capital Corporation's mortgage portfolio in million) were generic provisions. Mexico and of Creditel in Uruguay. Loans in local currency rose Since the end of 2008, total loan-loss provisions have increased 20.3% in Brazil, 7.3% in Chile and 30.9% in Mexico (+22.4% by EUR 6,800 million (+53%), reflecting the efforts made in the excluding the perimeter impact). last three years. The Group’s NPL coverage is 61%, negatively Sovereign’s loans rose 6.0% in dollars, due to the 4.5% affected by some 3 percentage points because of the operation increase in the most attractive mortgage segments (residential at Santander Consumer USA. and multifamily), and the acquisition of a consumer credit The NPL ratios by units and countries are set out below: portfolio from GE. Both effects comfortably offset the exit from higher risk segments and from those not considered strategic • The NPL ratio in Spain is 5.49%, well below the sector’s for the Group. average, and coverage 45% (4.24% and 58%, respectively, in 2010). Continental Europe accounted for 42% of the Group’s total lending (29% Spain), the UK 34%, Latin America 19% (11% Brazil) and Sovereign 5%. These percentages in 2010 were 45% for Continental Europe (32% Spain), 32% the UK, 18% Latin Loan-loss allowances America (10% Brazil) and 5% (Sovereign). Million euros Risks -5.2% 2011-2010 20,748 The still weak scenario in some markets continued to push up 19,661 18,497 non-performing loans, linked both to the rise in bad and doubtful loans (the numerator) as well as the slower growth in lending (denominator), which in some cases were declines. 5,846 4,187 Generic 6,727 Despite this, the active management of risk is reflected in a slower pace of growth in the Group’s NPLs in the last few 15,474 14,901 quarters. Specific 11,770 The Group's annual risk premium was 1.67% at December 2011, well below the maximum of 2.47% reached in the third 2009 2010 2011 quarter of 2009. 92 ANNUAL REPORT 2011
  • 95.
    Around 90% ofthe portfolio (including mortgages and Non-performing loans companies) has an NPL ratio of 3.3%. The ratio for mortgages Million euros to buy homes is 2.7% and 3.5% for the rest of the portfolio (public sector, individual customers and companies without 2011 2010 2009 real estate purposes). In both cases, NPLs increased moderately. Balance at beginning of period 28,522 24,554 14,191 Net additions 15,381 13,478 18,234 The rise in the total ratio was thus due to loans with a real Increase in scope of consolidation 925 257 1,033 estate purpose (ratio of 28.6%). This ratio reflects, on the one Exchange differences (362) 1,147 890 hand, the greater NPLs in this segment and, on the other, the Write-offs (12,430) (10,913) (9,795) Group’s anticipative policy to sharply reduce balances in this Balance at period-end 32,036 28,522 24,554 segment. Doubtful loans with a real estate purpose amounted to EUR 6,772 million. Their coverage rose by 4.p.p. to 33%. Another EUR 3,916 million was recorded as substandard, all NPL ratio of which is up-to-date with payments. These balances are % 16% covered (+ 4 p.p.). The gross balance of foreclosed properties at the end of 2011 was EUR 8,552 million, and after the provisions made in the fourth quarter of the year coverage rose to 50% from 31% in 2010. 3.89 3.86 3.78 These coverage levels signify that Santander has already 3.55 3.61 anticipated a significant part of the new requirements outlined in the Royal Decree 2/2012, which came into force on February 3, 2012 and will be entirely met during the year, through the existing capital buffer, ordinary contributions to provisions and applying the capital gains which may be Dec’10 Mar’11 Jun’11 Sep’11 Dec’11 obtained during the year (including EUR 900 million from the capital gain obtained from the sale of Banco Santander Colombia). • Portugal’s NPL ratio rose 116 b.p. to 4.06%, using the Group’s criteria, while coverage was 55%, 5 p.p. less than in NPL ratio in Spain 2010. In local criteria, Santander Totta has a lower NPL ratio % than its competitors. • Santander Consumer Finance reduced its NPL ratio for the 28.6 Real estate purpose sixth quarter running to 3.77%, with coverage of 113%. The 17.0 evolution during the year was determined by the consolidation in December of Santander Consumer USA by 11.1 the equity accounted method as, without this effect, coverage was 9 p.p. higher. • In the UK the NPL ratio was 1.86%, slightly higher than in 4.2 5.5 Total portfolio Spain 2010 (+10 b.p.), while coverage was 38% (46% in 2010). 3.4 3.1 3.5 Other portfolio Because of its importance in the Group’s overall lending, the 2.5 2.7 Household mortgages 2.2 NPL ratio of mortgages was 1.46% (1.41% in 2010), while 2.4 the average loan-to-value was 53%. 2009 2010 2011 Another indicator of this portfolio’s good performance is the small volume of foreclosed homes (EUR 160 million, or only 0.07% of total mortgage lending portfolio). Efficient management of these cases and a dynamic market for this kind of housing enable sales to be made in a short period, contributing to the good results. ANNUAL REPORT 2011 93
  • 96.
    • Brazil’s NPLratio was 5.38% (+47 b.p.). This increase was due Customer funds under management to the small rise in the sector and to higher growth in lending Total managed funds amounted to EUR 984,353 million, to individuals, basically consumer credit and cards. Santander almost the same as in 2010 (-0.1%). After deducting the Brazil’s performance was better than that of the country’s perimeter and forex effects, which had a marginal impact, the other private sector banks, the most comparable collective. reduction was 0.8%. Coverage was 95%. Customer deposits rose 2.6% and 4.5% including retail • The NPL ratio of Latin America ex-Brazil was 2.89% and commercial paper in Spain and Brazil’s letras financeiras. coverage an excellent 102%. Its comparison is affected by the Mutual and pension funds declined 9.8%, affected by the incorporation in the second quarter of GE Capital greater focus on capturing on-balance sheet funds. Corporation's mortgage portfolio in Mexico. Excluding it, the ratio improved in every quarter of 2011 (-25 b.p. for the Deposits in Continental Europe were very similar to 2010 at whole year), while coverage was 104% (-6 p.p.). EUR 49,400 million (-0.1%) and 25.0% higher than at the end of 2009. This reflected the strong campaign in 2010, a large • Sovereign’s NPL ratio, after declining in the last eight quarters, part of which was retained in 2011. To this is added the was 2.85%, much better than the 4.61% in 2010 (-176 b.p.). favourable impact of the entities incorporated to the Group. Coverage was 96% (+21 p.p.). • In Spain, the strategy followed in the renewal of funds Lastly, specific loan-loss provisions for the whole Group, after captured in the 2010 campaign was to give priority to deducting write-offs recovered, amounted to EUR 11,137 improved costs over volumes. As a result, deposits fell 7.2%. million (1.41% of average credit risk in the last 12 months), However, if one compares the balances at the start of the down from EUR 12,342 million in 2010 (1.56%). campaign with those at the end of 2011, growth was more than EUR 18,800 million (+12.1%). To this is added, the retail Net provisions represented 1.4% of loans, well below the 3.3% commercial paper sold during the year, which made the represented by net operating income/lending. changes -4.0% for 2011 and +16.0% for the last two years. This policy of emphasis on balance sheet funds was reflected Further information on the evolution of credit risk, particularly in a fall in mutual funds. real estate risk in Spain, control and monitoring systems and internal risk models to calculate provisions is included in the section on Risk Management in this annual report. Customer funds under management Million euros Variation 2011 2010 amount % 2009 Public sector 6,528 9,655 (3,127) (32.4) 13,293 Other residents 165,095 161,096 3,999 2.5 126,189 Demand deposits 68,389 67,077 1,312 2.0 61,000 Time deposits 61,185 81,145 (19,960) (24.6) 49,177 REPOs 35,520 12,873 22,647 175.9 16,012 Non-resident sector 460,911 445,625 15,286 3.4 367,495 Demand deposits 220,299 210,490 9,808 4.7 195,823 Time deposits 197,249 197,590 (341) (0.2) 148,485 REPOs 33,275 30,623 2,652 8.7 18,403 Public Sector 10,089 6,922 3,167 45.7 4,784 Customer deposits 632,533 616,376 16,158 2.6 506,976 Debt securities 197,372 192,872 4,499 2.3 211,963 Subordinated debt 22,992 30,475 (7,482) (24.6) 36,805 On-balance-sheet customer funds 852,898 839,723 13,175 1.6 755,744 Mutual funds 102,611 113,510 (10,898) (9.6) 105,216 Pension funds 9,645 10,965 (1,320) (12.0) 11,310 Managed portfolios 19,199 20,314 (1,115) (5.5) 18,364 Savings-insurance policies — 758 (758) (100.0) 9,422 Other customer funds under management 131,456 145,547 (14,091) (9.7) 144,313 Customer funds under management 984,353 985,269 (916) (0.1) 900,057 94 ANNUAL REPORT 2011
  • 97.
    • Santander ConsumerFinance’s deposits increased 27.9% due Customer funds under management to organic growth and the entry of Santander Retail in Billion euros Germany which, with its welcome campaign, increased its balances by EUR 2,500 million. -0.1%* 2011-2010 * Excluding exchange rate impact: +0.5% • Portugal increased its customer deposits by 8.0% and significantly improved its liquidity position for the second year 985 984 running and surpassed its commercial gap reduction target for 900 the year. Other 146 131 -9.7% 144 220 223 -1.3% Other • The incorporation of Bank Zachodni WBK contributed EUR on-balance 249 12,383 million of customer funds to the Group, of which EUR sheet sheet 10,359 million were deposits. 633 +2.6% In the UK, customer deposits increased 2.2% in sterling and Deposits 507 616 mutual funds rose 6.3% in 2011. In Latin America (excluding the balances in the New York branch, which are more volatile), deposits without repos 2009 2010 2011 increased 9.1% excluding the exchange rate impact. Good evolution of the three main countries: Brazil (+16.4%, including the letras financeiras), Mexico (+10.4%) and Chile (+18.5%), with increases in both time and demand deposits except for Brazil in demand deposits. Mutual funds dropped 2.3% in Brazil, Customer funds under management 10.4% in Chile and rose 2.8% in Mexico. The overall reduction % o/ operating areas. December 2011 for the whole region was 1.7%. Sovereign 5% Lastly, Sovereign’s deposits increased 11.6% in dollars. Other Latin America 3% Chile 4% Continental Europe accounted at the end of 2011 for 37% of Mexico 4% Spain 28% managed customer funds (28% Spain), the UK 32%, Latin America 26% (Brazil 15%) and Sovereign 5%. These percentages in 2010 were 39% for Continental Europe (30% Brazil 15% Spain), 31% for the UK, 26% for Latin America (15% Brazil) and 4% for Sovereign. Portugal 3% Germany 4% As well as capturing large volumes of funds in the last two years, Retail Poland 1% the Group, for strategic reasons, maintained an active policy of Other Europe 1% issuing securities in the international fixed income markets. United Kingdom 32% The Group issued in 2011 EUR 40,390 million of medium- and long-term issues, as follows: EUR 26,464 million of senior debt; EUR 13,664 million of covered and territorial bonds and EUR 262 million of subordinated debt. Mutual funds Million euros Variation 2011 2010 amount % 2009 Spain 27,425 34,310 (6,885) (20.1) 40,616 Portugal 1,866 3,209 (1,343) (41.8) 3,982 Poland 1,747 1,747 United Kingdom 15,744 14,369 1,375 9.6 10,937 Latin America 55,829 61,621 (5,792) (9.4) 49,681 Total 102,611 113,510 (10,898) (9.6) 105,216 ANNUAL REPORT 2011 95
  • 98.
    Pension funds Millioneuros Variation 2011 2010 amount % 2009 Spain 8,884 9,650 (765) (7.9) 9,912 Individuals 7,670 8,161 (491) (6.0) 8,429 Collective plans 249 262 (13) (5.0) 266 Group employee plans 965 1,227 (262) (21.4) 1,217 Portugal 760 1,315 (555) (42.2) 1,398 Total 9,645 10,965 (1,320) (12.0) 11,310 This issuing activity underscores the Group’s capacity to access More information on the management of financing in the the different institutional markets via its more than ten units markets, the framework for managing liquidity and the with issuing capacity, including the parent bank, Banco structural position of the Group’s liquidity can be found in the Santander, and its main subsidiaries in the countries where it Risk Management section of this annual report (“Management operates: Banesto, Santander Totta, Santander of funding and liquidity risk”). UK/Chile/Brazil/Mexico, Sovereign and the units of Santander Consumer Finance. These issues were made at higher prices Other items of the balance sheet than in 2010 because of the greater tensions and volatility in Total goodwill was EUR 25,089 million, EUR 466 million more markets. than in 2010, due to the net impact between the increase from the incorporations of BZ WBK, Santander Retail in Germany, GE As regards securitisations, the Group’s subsidiaries placed in the Capital Corporation's mortgage portfolio in Mexico and Creditel market in 2011 a total of EUR 24,831 million, mainly in the UK. in Uruguay and the reductions resulting from the amortisation of EUR 601 million of goodwill in Santander Totta, the Maturities of medium and long-term debt amounted to EUR Santander Consumer USA consolidation by the equity 32,497 million, of which EUR 18,006 million was senior debt, accounted method and exchange rates. EUR 7,439 million covered bonds, EUR 5,109 million subordinated debt and EUR 1,943 million preferred shares. Trading derivatives rose strongly, both in assets and liabilities (+EUR 29,429 million and +EUR 27,804 million, respectively), This capturing of stable funds, via deposits, retail commercial due to the evolution of the market value, mainly interest rate paper and issues, combined with the trend of moderate growth swaps. The balance at the end of 2011 was EUR 102,498 in lending, kept the loan-to-deposit ratio at 117% (the same as million in assets and EUR 103,083 million in liabilities. in 2010), and put the ratio of deposits plus medium and long- term funding to the Group’s loans at 113%, underscoring the Equity stakes increased from EUR 273 million to EUR 4,154 appropriate structure of funding the Group’s lending. million, largely due to consolidation by the equity accounted method at Santander Consumer USA and the insurance operation in Latin America. Loans / deposits*. Total Group Balances with central banks have increased for both deposits % and assets, after the liquidity injections by central banks in the countries where we operate, mainly the euro zone. The * Including retail commercial paper European Central Bank adopted extraordinary measures on monetary policies, including the expansion of collateral and liquidity auctions at three years. 135 The Group continued to go to these auctions and deposit in the 117 117 ECB most of the funds captured, significantly increasing the liquidity buffer and improving its structure by replacing short- term maturities by longer term funding. The only Group entity that has a net structural borrowing position from the ECB is Santander Totta (close to EUR 4 billion). The balance of financial assets available for sale rose 0.4% from 2009 2010 2011 EUR 86,235 in 2010 to EUR 86,612 million in 2011. 96 ANNUAL REPORT 2011
  • 99.
    Total equity andcapital with the nature of financial liabilities Million euros Variation 2011 2010 amount % 2009 Capital stock 4,455 4,165 290 7.0 4,114 Additional paid-in surplus 31,223 29,457 1,765 6.0 29,305 Reserves 41,688 36,993 4,695 12.7 31,796 Treasury stock (251) (192) (58) 30.3 (30) Shareholders' equity (before profit and dividends) 77,115 70,423 6,692 9.5 65,186 Attributable profit 5,351 8,181 (2,830) (34.6) 8,943 Interim dividend distributed (1,429) (1,270) (159) 12.5 (1,285) Interim dividend not distributed (1) (408) (2,060) 1,652 (80.2) (2,837) Shareholders' equity (after retained profit) 80,629 75,273 5,356 7.1 70,006 Valuation adjustments (4,482) (2,315) (2,166) 93.6 (3,165) Minority interests 6,445 5,896 549 9.3 5,204 Total equity (after retained profit) 82,592 78,854 3,738 4.7 72,045 Preferred shares and securities in subordinated debt 5,896 7,352 (1,456) (19.8) 7,745 Total equity and capital with the nature of financial liabilities 88,488 86,207 2,282 2.6 79,791 (1) In 2011, estimated data of May 2012 scrip dividend. Shareholders’ equity and solvency ratios Capital ratios (BIS II) Total shareholders’ equity, after retained profits, increased EUR % 5,356 million (+7.1%) to EUR 80,629 million, due to reserves. Shareholders’ equity per share at the end of 2011 stood at EUR 14.19 8.62 (+EUR 0.04). This was the fifth year of increase. 13.56 13.11 A total of 579,921,105 shares were issued in 2011, as follows: 11.01 BIS II Ratio • In February, 111,152,906 shares were issued for the scrip 110.08 10.02 dividend that month when 86.7% of capital opted to receive 10.02 Tier I the amount equivalent to the third interim dividend charged 8.61 8.80 to 2010’s earnings in shares. Core capital • In October, 1,223,457 shares were issued to meet the exchange of 3,458 Valores Santander. 2009 2010 2011 • In November, 125,742,571 shares for that month’s scrip dividend were issued when 73.0% of capital opted to receive the amount equivalent to the second interim dividend charged to 2011’s earnings in shares. Computable capital and BIS II ratio • In December, 341,802,171 shares were issued to tend to the Million euros repurchase of 77,743,969 preferred shares. 2011 2010 2009 Shareholders’ equity and capital with the nature of financial liabilities amounted to EUR 88,488 million at the end of 2011 Core capital 56,694 53,205 48,366 (+EUR 2,282 million), after incorporating minority interests, Basic capital 62,294 60,617 56,615 preferred shares and valuation adjustments. Of note in the fall in Supplementary capital 15,568 20,670 24,309 valuation adjustments (EUR 2,166 million) was the negative Deductions (1,090) (2,011) (1,221) impact on the value of stakes in foreign subsidiaries of exchange Computable capital 76,772 79,276 79,704 rates (partly covered by hedging). Risk-weighted assets 565,958 604,885 561,684 In addition, it includes the negative impact of exchange rates on BIS II ratio 13.56 13.11 14.19 goodwill, neutral for the purposes of the capital ratios, as it Tier I (before deductions) 11.01 10.02 10.08 occurred in the same way in their recording in assets. Core capital 10.02 8.80 8.61 Shareholders' equity surplus (BIS II) 31,495 30,885 34,769 ANNUAL REPORT 2011 97
  • 100.
    Grupo Santander’s equityeligible for applying the BIS II criteria The EBA's estimated additional capital needs for Grupo amounted to EUR 76,772 million, EUR 31,495 million above the Santander amounted to EUR 15,302 million. This amount has minimum requirement (+70%). been obtained as follows: The core capital ratio was 10.02% (+60 b.p. in the fourth • EUR 6,829 million through Valores Santander, which have to quarter) and 122 b.p. higher during the year after absorbing the compulsorily be converted into shares before the end of impact of the incorporation of BZ WBK and the charge in the October 2012. UK for PPI, registered in the second quarter. This was the fifth consecutive annual improvement in the Group’s solvency. • EUR 1,943 million through the exchange of preferred shares for ordinary new shares. The core capital is of very high quality, very solid and adjusted to the business model, the balance sheet structure and the Group’s • EUR 1,660 million through the application of the Santander risk profile. Dividendo Elección programme (scrip dividend) at the time of the final dividend corresponding to fiscal year 2011. The Tier 1 ratio was 11.01% and the BIS ratio 13.56%. • EUR 4,890 million through organic capital generation, This improvement in the ratios benefited from the strengthening provisions and the transfer of minority stakes, mainly in Chile of capital, in accordance with the new requirements of the and Brazil. European Banking Authority (EBA). They form part of a series of measures adopted by the European Council in the second half Regarding the latter, Santander reached in December 2011 an of 2011, which aim to restore stability and confidence to the agreement (closed during the first week of 2012) to transfer European markets. These capital requirements are expected to 4.41% of Santander Brazil to a major international financial be exceptional and temporary. institution, which will deliver such shares to holders of convertible bonds issued in October 2010 by Banco Santander, The selected banks must have by June 30, 2012 a core capital when these mature, pursuant to the terms of said convertible Tier 1 ratio of at least 9%, in accordance with the EBA’s rules. bonds. Each bank was required to present by January 20, 2012 their capitalisation plan to reach the requirement at June 30, 2012. This means that Santander met the EBA’s core capital requirement of 9% six months in advance, underscoring the In this regard, Grupo Santander has carried out a series of Group’s financial strength and high degree of flexibility. measures in the latter part of 2011 regarding capital, allowing it to achieve a core capital ratio of 9% ahead of the deadline set by the EBA. Core capital evolution EBA criteria +0.28% 9.01% * Including Valores Santander (compulsorily convertible bonds) +0.20% ** Including 7.82% stake of Santander Chile +0.25% +0.29% +0.34% +0.12% 7.53% September 2011 Q4 Exchange 4th scrip Brazil Disposals** Provisions Current with adjusted generation preferred dividend (4.41%) and other EBA criteria to EBA criteria shares (*) (*) 98 ANNUAL REPORT 2011
  • 101.
    Description of thesegments Grupo Santander maintained in 2011 the general criteria used in • United Kingdom. This includes retail and wholesale banking, asset 2010, with the following exceptions: management and insurance conducted by the various units and branches of the Group in the country. • The system for calculating the internal transfer rate (ITR) was changed. Until now Grupo Santander’s management model applied • Latin America. This embraces all the Group’s financial activities an ITR to each operation on the basis of its maturity and regardless conducted via its subsidiary banks and subsidiaries. It also includes of whether it was an operation for assets or liabilities. After three the specialised units of Santander Private Banking, as an years of financial and liquidity crisis, the real cost of the liquidity of independent and globally managed unit, and New York’s business. institutions has been shown to differ from the reference yield curve Because of their specific importance, the financial statements of significantly and constantly. Brazil, Mexico and Chile are also provided. As a result, the Group decided to revise the system for measuring In addition, Sovereign’s figures are recorded on their own. the spread by changing the ITR applied by the corporate centre to the units. The new ITR consists of the depo/swap curve (the same Secondary level (or business). This segments the activity of the as the previous system) plus the “liquidity spread” relative to the operating units by the type of business. The reported segments are: period of “duration” of each operation. In other words, it reflects the average cost of Santander’s financing corresponding to the • Retail Banking. This covers all customer banking businesses (except “duration” of each operation. those of Corporate Banking, managed through the Global Customer Relationship Model). Because of their relative importance This change makes the model more in line with the requirements details are provided by the main geographic areas (Continental of regulators, ensures a better pricing of operations and enables Europe, United Kingdom and Latin America) and Sovereign, as well the market to better assess the profitability of businesses. as by the main countries. The results of the hedging positions in each country are also included, conducted within the sphere of • Change of perimeter in the UK. For the past few years, the Group each one’s Assets and Liabilities Committee. has been developing a cards platform for the UK, which once operational was integrated into the juridical structure of this unit • Global Wholesale Banking (GBM). This business reflects the (with counterparty in the rest of Europe). revenues from global corporate banking, investment banking and markets worldwide including all treasuries managed globally, both • The annual adjustment was made to the Global Customer Relation trading and distribution to customers (always after the appropriate Model and resulted in a net increase of 94 new clients. This does distribution with Retail Banking customers), as well as equities not mean any changes in the principal (geographic) segments, but business. it does affect the figures for Retail Banking and Global Wholesale Banking. • Asset Management and Insurance. This includes the contribution of the various units to the Group in the design and management None of these changes was significant for the Group and do not alter of mutual and pension funds and insurance. The Group uses, and its figures. The figures for 2010 were restated and include the changes remunerates through agreements, the retail networks that place in the affected areas. these products. This means that the result recorded in this business is net (i.e. deducting the distribution cost from gross income). The financial statements of each business segment are drawn up by aggregating the Group’s basic operating units. The information relates As well as these operating units, which cover everything by to both the accounting data of the companies in each area as well as geographic area and by businesses, the Group continues to maintain that provided by the management information systems. In all cases, the area of Corporate Activities. This area incorporates the centralised the same general principles as those used in the Group are applied. activities relating to equity stakes in industrial and financial companies, financial management of the structural exchange rate position and In accordance with the IFRS, the business areas are structured into of the parent bank’s structural interest rate risk, as well as two levels: management of liquidity and of shareholders’ equity through issues and securitisations. Principal level (or geographic). The activity of the Group’s operating units is segmented by geographic areas. This coincides with the As the Group’s holding entity, this area manages all capital and Group’s first level of management and reflects our positioning in the reserves and allocations of capital and liquidity. It also incorporates world’s three main currency areas (euro, dollar and sterling). The amortisation of goodwill but not the costs related to the Group’s segments reported on are: central services except for corporate and institutional expenses related to the Group’s functioning. • Continental Europe. This covers all retail banking business (including Banif, the specialised private bank), wholesale banking and asset management and insurance conducted in Europe with the exception of the United Kingdom. Given the importance of some of these units, the financial information of the Santander The figures of the various units of the Group listed below have Branch Network, Banesto, Santander Consumer Finance and been prepared in accordance with these criteria and therefore Portugal are set out and from the second quarter Bank Zachodni do not match those published by each institution individually. WBK after its incorporation to the Group. ANNUAL REPORT 2011 99
  • 102.
    1. Principal segmentsor geographic Income statement Million euros Net operating income Attributable profit to the Group 2011 2010 Amount % 2011 2010 Amount % Continental Europe 8,735 8,875 (141) (1.6) 2,849 3,355 (506) (15.1) o/w: Santander Branch Network 2,353 2,227 126 5.7 660 847 (187) (22.1) Banesto 1,112 1,376 (264) (19.2) 130 419 (289) (68.9) Santander Consumer Finance 3,604 3,361 243 7.2 1,228 811 418 51.5 Portugal 443 650 (207) (31.9) 174 456 (282) (61.8) Retail Poland (BZ WBK) 366 366 232 232 United Kingdom 3,123 3,735 (612) (16.4) 1,145 1,965 (820) (41.7) Latin America 13,533 12,705 828 6.5 4,664 4,728 (64) (1.4) o/w: Brazil 9,963 9,007 956 10.6 2,610 2,814 (204) (7.2) Mexico 1,387 1,434 (47) (3.3) 936 664 272 40.9 Chile 1,264 1,296 (32) (2.5) 611 671 (61) (9.0) Sovereign 1,212 1,169 43 3.7 526 424 102 24.0 Operating areas 26,603 26,485 118 0.4 9,184 10,472 (1,289) (12.3) Corporate Activities* (2,230) (2,632) 401 (15.2) (2,163) (2,291) 128 (5.6) Total Group* 24,373 23,853 519 2.2 7,021 8,181 (1,160) (14.2) Net extraordinary capital gains and provisions (1,670) — (1,670) — Total Group 24,373 23,853 519 2.2 5,351 8,181 (2,830) (34.6) (*).- Excluding net extraordinary capital gains and provisions Ratios % Efficiency ratio(1) ROE NPL ratio* NPL coverage* 2011 2010 2011 2010 2011 2010 2011 2010 Continental Europe 43.1 40.0 9.34 12.45 5.20 4.34 55 71 o/w: Santander Branch Network * 46.5 48.2 9.63 11.85 8.47 5.52 40 52 Banesto 47.4 42.8 2.78 9.43 5.01 4.11 53 54 Santander Consumer Finance 31.8 27.5 12.34 10.31 3.77 4.95 113 128 Portugal 54.4 45.4 7.00 20.34 4.06 2.90 55 60 Retail Poland (BZ WBK) 47.0 17.93 4.89 65 United Kingdom 45.0 40.6 9.15 21.25 1.86 1.76 38 46 Latin America 39.7 38.6 21.78 22.30 4.32 4.11 97 104 o/w: Brazil 37.5 37.1 23.26 22.93 5.38 4.91 95 101 Mexico 41.8 39.1 21.16 19.00 1.82 1.84 176 215 Chile 39.2 36.2 25.43 30.01 3.85 3.74 73 89 Sovereign 44.6 44.5 12.96 14.87 2.85 4.61 96 75 Operating areas 41.7 39.6 13.41 17.38 3.87 3.53 63 75 Total Group 44.9 43.3 7.14 11.80 3.89 3.55 61 73 (1) With amortisations * Santander Branch Network is the retail banking unit of Banco Santander S.A. The NPL ratio of Banco Santander S.A. at the end of December 2011 stood at 5.99% (4.24% in December 2010) and NPL coverage was 39% (54% in December 2010) Operating means Million euros Employees Branches 2011 2010 2011 2010 Continental Europe 63,866 54,518 6,608 6,063 o/w: Santander Branch Network 18,704 18,893 2,915 2,931 Banesto 9,548 9,742 1,714 1,762 Santander Consumer Finance 15,610 13,852 647 519 Portugal 6,091 6,214 716 759 Retail Poland (BZ WBK) 9,383 526 United Kingdom 26,295 23,649 1,379 1,416 Latin America 91,887 89,526 6,046 5,882 o/w: Brazil 54,265 53,900 3,775 3,702 Mexico 13,162 12,500 1,125 1,100 Chile 12,089 11,595 499 504 Sovereign 8,968 8,647 723 721 Operating areas 191,016 176,340 14,756 14,082 Corporate Activities 2,333 2,529 Total Group 193,349 178,869 14,756 14,082 100 ANNUAL REPORT 2011
  • 103.
    Continental Europe Million euros Variation 2011 2010 amount % Income statement Net interest income 10,666 9,872 794 8.0 Net fees 4,050 3,679 371 10.1 Gains (losses) on financial transactions 233 846 (612) (72.4) Other operating income (1) 397 396 1 0.3 Gross income 15,347 14,793 554 3.7 Operating expenses (6,612) (5,917) (695) 11.7 General administrative expenses (5,998) (5,301) (697) 13.1 Personnel (3,725) (3,343) (382) 11.4 Other general administrative expenses (2,273) (1,958) (315) 16.1 Depreciation and amortisation (614) (616) 2 (0.3) Net operating income 8,735 8,875 (141) (1.6) Net loan-loss provisions (4,192) (4,019) (173) 4.3 Other income (503) (172) (331) 193.0 Profit before taxes 4,039 4,684 (645) (13.8) Tax on profit (1,049) (1,220) 170 (14.0) Profit from continuing operations 2,990 3,465 (475) (13.7) Net profit from discontinued operations (24) (14) (11) 77.7 Consolidated profit 2,966 3,451 (486) (14.1) Minority interests 117 96 21 21.7 Attributable profit to the Group 2,849 3,355 (506) (15.1) Balance sheet Customer loans (2) 315,081 323,660 (8,579) (2.7) Trading portfolio (w/o loans) 78,802 57,690 21,112 36.6 Available-for-sale financial assets 24,640 23,843 797 3.3 Due from credit institutions (2) 51,638 66,925 (15,287) (22.8) Intangible assets and property and equipment 5,045 4,965 80 1.6 Other assets 28,586 22,160 6,427 29.0 Total assets/liabilities & shareholders' equity 503,793 499,243 4,549 0.9 Customer deposits (2) 247,582 247,715 (133) (0.1) Marketable debt securities (2) 39,708 48,413 (8,705) (18.0) Subordinated debt (2) 965 1,740 (774) (44.5) Insurance liabilities 517 933 (416) (44.6) Due to credit institutions (2) 88,143 77,059 11,084 14.4 Other liabilities 96,088 95,963 126 0.1 Shareholders' equity (3) 30,789 27,420 3,369 12.3 Other customer funds under management 45,809 53,968 (8,159) (15.1) Mutual funds 31,038 37,519 (6,481) (17.3) Pension funds 9,645 10,965 (1,320) (12.0) Managed portfolios 5,126 5,484 (358) (6.5) Savings-insurance policies — — — — Customer funds under management 334,064 351,836 (17,772) (5.1) (1).- Including dividends, income from equity-accounted method and other operating income/expenses (2).- Including all on-balance sheet sheet balance sheets for this item (3).- Not including profit of the year Loans Deposits* Loans / deposits* % annual variation % annual variation % (*) Including retail commercial paper (*) Including retail commercial paper +31.1 163 +0.5 131 124 -2.7 +2.4 2010 2011 2010 2011 2009 2010 2011 ANNUAL REPORT 2011 101
  • 104.
    Activity Continental Europe Lending dropped 3% due to lower demand in Spain and Portugal, and the consolidation by the equity accounted Basic revenues increased 8.4% due to the method of Santander Consumer USA, which was partly offset by improvement in net interest income and fee income the incorporation of Bank Zachodni WBK. in the commercial units and consolidation of Bank Zachodni WBK. Deposits remained virtually unchanged because of the incorporation of new institutions and Portugal’s evolution, Controlled expenses: flat on a like-for-like basis offsetting the lower balances in Spain, which were affected by (+0.6%). the strategy in renewing maturities of deposits captured in the 2010 campaign. The increase including the commercial paper Attributable profit hit by lower gains on financial placed by the retail networks in Spain was 2% The rise since transactions and reduced release of generic December 2009, before the launch of the campaign, was EUR provisions. 49,400 million (+25%). Growth strategy: preference for liquidity against a Growth in mutual funds and pension funds was affected by the background of low demand for loans. strategy of greater preference for deposits Best bank in Western Europe prize from The Banker. Results Basic revenues grew 8.4%, driven by Santander Consumer Finance (partially favoured by the SEB incorporation in Germany), the entry of BZ WBK and the recovery in net interest income at the Santander Branch Network and Banesto. Continental Europe includes all activities carried out in this geographic area: retail banking, global wholesale banking, asset Net interest income rose 8.0% and fee income 10.1%. management and insurance. Deducting the perimeter impact, net interest income and fee income increased 1.1%. Attributable profit was EUR 2,849 million, 15.1% lower than in 2010. Operating expenses increased 11.7%, due to the perimeter effect as on a like-for-like basis they were flat (+ 0.6%). The The results reflect the perimeter effect of incorporating Bank Santander Branch Network, Banesto and Portugal reduced their Zachodni WBK and SEB’s branches in Germany. Overall, the costs. positive impact was around 6 percentage points in the profit. Provisions for loan losses were 4.3% higher (+1.8% deducting Strategy the perimeter impact). This was due to various factors: In a still weak environment and with low interest rates, the Group maintained the same strategic lines, aimed at: • On the one hand, it reflected the effort being made in risk management, which led to lower specific provisions. • defending spreads on loans (those on new ones continued to improve) and on deposits, which reflect a lower cost thanks to • On the other, the ending of the regulating effect from the the strategy of renewing the balances captured in the 2010 release of generic provisions in the commercial units in Spain. campaign, where priority was given to costs over volumes; Releases amounted to EUR 379 million, down from EUR 1,949 million in 2010. • control of expenses Attributable profit, after the rest of results and provisions, • and risk management very centred on recoveries. particularly for real estate, and taxes was EUR 2,849 million. Preference was given in volumes to liquidity and deposits in a context of low demand for loans. Net operating income Attributable profit NPL ratio NPL coverage Million euros Million euros % % -1.6% 2011-2010 -15.1% 2011-2010 8,875 5.20 8,735 3,355 4.34 71 55 2,849 2010 2011 2010 2011 2010 2011 2010 2011 102 ANNUAL REPORT 2011
  • 105.
    Continental Europe. Mainunits Million euros Santander Santander BZ Branch Network Banesto Consumer Finance Portugal WBK 2011 Var (%) 2011 Var (%) 2011* Var (%) 2011 Var (%) 2011 Income statement Net interest income 3,235 3.0 1,351 (11.1) 4,162 13.6 592 (18.2) 371 Net fees 1,099 1.7 616 (0.2) 1,128 18.0 345 (3.5) 248 Gains (losses) on financial transactions 108 (1.6) 98 (49.9) (12) 84.6 14 (78.8) 58 Other operating income (1) (41) 32.4 47 (31.3) 3 (86.4) 21 (49.8) 13 Gross income 4,400 2.4 2,113 (12.1) 5,282 14.0 972 (18.3) 690 Operating expenses (2,047) (1.2) (1,001) (2.5) (1,678) 31.8 (529) (2.1) (324) General administrative expenses (1,895) (0.8) (878) (2.8) (1,542) 33.3 (460) (1.6) (298) Personnel (1,233) (0.2) (636) (4.6) (783) 31.6 (317) (1.4) (179) Other general administrative expenses (662) (2.1) (242) 2.0 (758) 35.2 (143) (2.1) (119) Depreciation and amortisation (153) (5.3) (123) (0.5) (136) 16.6 (69) (4.8) (26) Net operating income 2,353 5.7 1,112 (19.2) 3,604 7.2 443 (31.9) 366 Net loan-loss provisions (1,437) 31.7 (661) (6.8) (1,632) (19.1) (206) 87.7 (60) Other income (11) — (251) 756.5 (135) (5.8) (50) — (3) Profit before taxes 905 (22.0) 200 (68.6) 1,837 53.1 187 (66.7) 303 Tax on profit (244) (22.0) (46) (71.4) (506) 49.0 (13) (87.8) (63) Profit from continuing operations 660 (22.0) 154 (67.6) 1,332 54.6 174 (61.9) 240 Net profit from discontinued operations — — — — (24) 77.7 — — — Consolidated profit 660 (22.0) 154 (67.6) 1,307 54.3 174 (61.9) 240 Minority interests 1 80.6 24 (58.0) 79 115.0 0 (99.3) 8 Attributable profit to the Group 660 (22.1) 130 (68.9) 1,228 51.5 174 (61.8) 232 Balance sheet Customer loans (2) 102,643 (7.8) 68,850 (9.0) 60,276 (4.8) 28,403 (5.6) 8,479 Trading portfolio (w/o loans) — — 7,869 19.7 1,335 16.4 1,617 (7.1) 1,304 Available-for-sale financial assets — — 8,333 (7.7) 205 (63.3) 4,496 (30.4) 2,617 Due from credit institutions (2) 104 (51.2) 9,637 (43.7) 11,011 37.4 2,467 (27.4) 309 Intangible assets and property and equipment 1,201 — 1,328 (3.3) 799 (10.1) 452 (5.8) 183 Other assets 1,829 279.8 10,215 35.8 4,984 72.3 7,120 0.4 645 Total assets/liabilities & shareholders' equity 105,776 (6.6) 106,232 (9.4) 78,610 2.3 44,555 (9.6) 13,536 Customer deposits (2) 78,864 (7.9) 50,755 (15.0) 33,198 27.9 23,465 8.0 10,359 Marketable debt securities (2) 4,965 — 22,531 (18.6) 5,729 (51.1) 5,037 (33.2) — Subordinated debt (2) — — 784 (39.9) 75 (82.4) — — 99 Insurance liabilities — — — — — — 70 (11.1) — Due to credit institutions (2) 543 18.9 16,591 23.6 23,565 (8.9) 13,395 (20.4) 1,163 Other liabilities 14,780 (26.4) 10,870 2.4 6,023 40.9 31 (97.4) 703 Shareholders' equity (3) 6,625 (6.1) 4,702 5.0 10,020 16.4 2,557 32.3 1,213 Other customer funds under management 23,640 (12.0) 8,375 (12.9) 6 (73.6) 2,686 (42.3) 1,926 Mutual funds 16,158 (20.6) 4,440 (22.3) 2 (88.3) 1,866 (41.8) 1,747 Pension funds 5,918 (3.5) 1,237 (7.5) 4 (15.8) 760 (42.2) — Managed portfolios — — 109 (6.6) — — 59 (54.9) 179 Savings-insurance policies 1,564 306.4 2,588 5.6 — — — — — Customer funds under management 107,469 (4.5) 82,444 (16.2) 39,008 2.3 31,188 (8.1) 12,383 (1).- Including dividends, income from equity-accounted method and other operating income/expenses (2).- Including all on-balance sheet sheet balance sheets for this item (3).- Not including profit of the year (*).- In December SC USA began to consolidate by the equity accounted method. Without impact on profits ANNUAL REPORT 2011 103
  • 106.
    The bank wasparticularly active with SMEs. Of note was the Santander Branch Network agreement with Google to support the digitisation of SMEs and businesses. We worked on different lines: Improved underlying results: – EUR 100 gift for first time publicity in the leading search • Positive growth in gross income (+2.4%). engine. Some 215,000 SMEs and self-employed people, who began to work with Santander or who increased their linkage, • Operating expenses declined 1.2% by the second were rewarded. straight year. – Incorporation to Conecta tu Negocio (creation of a web page • Specific provisions declined 29.3%. and domain free for a year). In just nine months, 18,000 SMEs and self-employed created their web pages with this The lower attributable profit was due to fewer programme and the bank enabled them to have a 24-hour releases of generic provisions. window throughout the world via Internet. Activity reflected the scant demand for loans and a Also important in the sphere of companies were activities strategy in funding which combines cost reduction related to international business, in particular the Plan Exporta and volume retention. which aims to capture and link new customers whose commercial and industrial activity is related to exports. In 2011, Best bank in Spain according to The Banker and 6,689 customers were captured. Euromoney. There were also new multi channel projects, notably a new application for iPad and participation along with the Ministry of Industry, Tourism and Commerce in an initiative to foster the use of electronic DNIs. The Santander Network posted an attributable profit of EUR 660 Lastly, many customers continued to be captured under the We million, 22.1% less than in 2010. This was mainly due to the want to be your Bank plan. Close to 500,000 customers were smaller release of generic provisions, as net operating income captured during 2011, a similar number to 2010 after rose 5.7%, after gradually improving during the year due to the discounting the impact of the campaign to capture deposits. better quarterly trend in gross income than in 2010 and control of costs. Activity There were two different periods for deposits. In the first half, These results were obtained in a still difficult environment, with Santander managed the maturity of the deposits captured in the insufficient signs of an economic recovery, strong competition 2010 campaign when priority was given to reducing the cost, for liquidity and low demand for loans. reflecting a decline of 0.56 p.p. in that of time deposits. Strategy This policy was combined with a high retention level of more The Santander Branch Network maintained its strategic than 60%. A key factor here were the funds captured by various priorities: management of prices, control of costs and products with different periods of renewal: the Depósito strengthening the balance sheet, with particular emphasis on Avanzado (time), the Cuenta Inversión (demand), structured capturing funds and control and early management of NPLs. We products (medium term) and Seguros de Rentas (for a more also continued to take advantage of opportunities to keep on specialised segment of customers). capturing funds and boost customer linkage. The second half of the year was characterised by the capturing Santander remained very active in selling products and services, of retail savings via commercial paper, as an alternative to tailored to customers’ needs and differentiated by segments. traditional deposits. EUR 5,000 million was captured in the last three months. Activity Loans / deposits* Return / cost Net interest inc. / ATAs Annual variation in billion euros % % % (*) Including retail commercial paper (*) Including retail commercial paper 3.65 Loans Deposits* 2.95 159 3.26 +13.2 2.92 Loans return 2.70 130 122 -1.8 Deposits cost -3.9 -8.7 1.43 1.36 1.15 2010 2011 2010 2011 2009 2010 2011 Q4’10 Q2’11 Q4’11 2010 2011 104 ANNUAL REPORT 2011
  • 107.
    All in all,total funds on the balance sheet declined by EUR Gains on financial transactions, in an unfavourable market, 1,800 million (-2%), but were EUR 11,400 million (+16%) more remained virtually stable. than at the end of 2009 (i.e. before the start of the campaign). As a result, there was a gain of more than 100 b.p. in market Operating expenses continued the downward trend begun in share. 2010 (-1.2% in 2011), which is particularly significant as inflation was around 3% and the branch network’s commercial Lending in a weak market declined 8%. In this context, 227,000 capacity remained virtually unchanged. There were no loans were granted for a total of EUR 25,000 million. significant closures of branches unlike the general trend in the sector. We continued to be the leader in facilities credit lines, among which are the ICO lines. Some 50,000 loans were granted for a The efficiency ratio improved 1.7 p.p. to 46.5% (43% excluding total of EUR 3,640 million, with a market share of around 20%, amortisations) and net operating income rose 5.7% to EUR 6 p.p. more than the following competitor. 2,353 million. As regards liquidity, there was a sharp fall of EUR 24,000 million Credit risk and NPL management continued to be given since the end of 2009 in the commercial gap (EUR 3,000 in maximum priority. The NPL ratio was 8.47% in the retail 2011). This improved the loan-to-deposit ratio from 159% in network (excluding wholesale activities) and 5.99% at the December 2009 to 122% at the end of 2011. parent bank. The latter ratio is more comparable with the rest of institutions, which are banks, and was well below the average Results of them. NPL coverage ratios were 40% for the network and The main pillars of the income statement were the recovery in 39% for the parent bank. gross income, control of costs and reduced needs for specific provisions. They did not feed through to profits, however, In August, the bank launched the campaign Moratoria because of the lower release of generic provisions. hipotecaria, which aims to help those customers going through temporary difficulties as a result of the economic crisis in Spain. Gross income was EUR 4,400 million, 2.4% more and reversing Almost 6,000 customers for EUR 1,000 million have benefited the trend of the last two years of lower revenues. from this campaign. Growth was mainly due to net interest income (+3.0%) as the Net loan-loss provisions made in 2011 were EUR 1,437 million, strategy to improve spreads, particularly on deposits, enabled 31.7% more than in 2010 due to the net impact from the the customer spread (the yield on lending less the cost of funds) regulatory effect of generic provisions (EUR 298 million to increase by almost one p.p. (from 1.49% in the fourth released, all in the first half of the year, compared to EUR 1,364 quarter of 2010 to 2.29% a year later). million in 2010) and specific provisions that were EUR 720 million less (-29.3%) than in 2010. Net fee income rose 1.7% and was higher in each quarter of 2011 than in the same periods of 2010. The fall in income from Net operating income after provisions was EUR 916 million, mutual and pension funds were offset by the rise in that from 19.4% less than in 2010 while attributable profit was EUR 660 selling and buying securities, means of payment and, mainly, million. insurance. In the latter, both from protection (accidents, household and life), the most traditional insurance products, as well as new ones (cars and legal security). Of note in protection insurance was Open Market (not linked to finance operations), with 170,000 policies (+38%). In car insurance, the Súper Buscador Santander gained more than 12,000 policies in just three months. The branches received more than 60,000 price requests. Net operating income Attributable profit Banco Santander Banco Santander Million euros Million euros NPL ratio % NPL coverage % + 5.7% 2011-2010 -22.1% 2011-2010 5,99 54 2,353 4,24 39 2,227 847 660 2010 2011 2010 2011 2010 2011 2010 2011 ANNUAL REPORT 2011 105
  • 108.
    In business activity,the priorities were to capture and link Banesto corporate and individual customers and become their reference bank. The balance sheet, the capital and liquidity were strengthened. Quality of service has become the driver behind improving and consolidating the value offer for customers. The main Management of spreads, the balance sheet and indicators of quality put Banesto among the reference banks in greater customer linkage limited the impact on Spain. revenues from reduced business and higher funding costs. In 2011, for the fourth year running, Banesto was chosen by the magazine Euromoney as the best bank in Spain, and it was Very disciplined costs, which continued to decline. recently included by Global Finance among the world’s 50 most solvent banks. Provisions increased because of lower release of generic provisions. Specific provisions fell sharply. Activity The bank’s liquidity situation and its large number of Good relative evolution of risk quality, better than customers facilitated profitable and efficient management of our competitors. funds. Euromoney prize for the best bank in Spain, and Total customer funds amounted to EUR 82,444 million, of among the world’s 50 most solvent banks, which EUR 51,220 million (-14%) were on-balance sheet according to Global Finance. including the commercial paper issued in the fourth quarter. This reduction was due to the bank’s policy of renewing part of the deposits captured in the special campaign launched in the second quarter of 2010. Excluding this operation, the decline was 2%. Banesto generated an attributable profit to the Group of EUR Lending continued to decline because of the weak demand 130 million, 68.9% lower than in 2010, after assigning more and the environment of greater credit and liquidity risks. The than EUR 900 million to strengthening provisions. volume stood at EUR 68,850 million at the end of 2011, 9% Strategy less than a year ago. The year 2011 was a complicated one for banks, because as The weak environment and the fall in lending pushed up the well as the still weak economic growth there were strong NPL ratio to 5.01%. The increase in non-performing loans was tensions and high volatility in the markets in the second part of EUR 402 million, which compares well with the average of the year. The sector’s non-performing loans continued to rise around EUR 1,000 million in 2010 and 2009. Moreover, the and interest rates were unstable. Liquidity tensions in the ratio compares very favourably with the sector’s average. financial system triggered a rise in wholesale funding costs. NPL coverage was 53%. In this context, Banesto prioritised its objectives and focused on improving the quality of assets, strengthening the financial Liquidity management, one of the year’s priorities, improved position and optimising liquidity. It also continued to improve the commercial gap and enabled wholesale funding to be its competitive position, thanks to exploiting its technology reduced by almost EUR 5,600 million. This, in turn, enabled and innovation capacities. This produced further gains in the EUR 2,200 million of debt issues during the year to give efficiency, either by improving procedures and already existing priority to cost optimisation over volume. products or by launching new initiatives, such as expanding the range of foreign trade services. Activity Loans / deposits* Return / cost Net interest inc. / ATAs* Annual variation in billion euros % % % (*) W/o REPOs. Including retail commercial paper (*) Including retail commercial paper (*) Retail Banking (*) Retail Banking 3.61 Loans Deposits* 3.21 2.44 +7.1 136 2.92 Loans return 134 2.22 127 +0.2 Deposits cost 1.94 1.66 1.70 -6.2 -6.8 2010 2011 2010 2011 2009 2010 2011 Q4’10 Q2’11 Q4’11 2010 2011 106 ANNUAL REPORT 2011
  • 109.
    The level ofavailable liquid assets means that Banesto can The tensions in markets in the second half of the year comfortably meet the wholesale funding maturities of EUR impacted gains on financial transactions, due, on the one 4,700 million in 2012, even in a scenario of not issuing any hand, to losses on assets valuation and, on the other, reduced debt. customer activity in these products. Gains were 49.9% less at EUR 98 million. Results The three pillars of the income statement were defending Gross income was EUR 2,113 million, 12.1% less than in 2010. revenues, controlling costs and rigorous risk management. The non-renounceable goal of controlling efficiency is the key Net interest income was EUR 1,351 million, 11.1% less than in to the present situation. Thanks to this, operating expenses of 2010. The reduction was due to the impact of lower activity EUR 1,001 million were 2.5% less than in 2010. The efficiency on business and the rise in finance costs which, however, was ratio was 47.4% at the end of 2011. limited by management of prices and of the balance sheet. Net operating income declined 19.2% to EUR 1,112 million. The credit spread of the front book increased from around 3% at the beginning of 2010 to close to 5% in the fourth quarter Net loan-loss provisions were EUR 661 million, 6.8% lower of 2011. Although this increase is already reflected in the than the EUR 709 million in 2010. This evolution is the net stock, it still has not fully fed through. In customer deposits, between lower specific provisions (-38.8%) and lower use of the cost has been falling from the highs in the second half of generic provisions (EUR 445 million less than in 2010). 2010. Furthermore, Banesto made additional provisions of EUR 251 Management and linkage of customers produced a rise in million to strengthen its financial position, basically for transactions and use of value-added services, which resulted in foreclosed properties and loans, and for early retirements a 2.6% rise in revenues from services. Net fee income from made in the first half. mutual and pension funds was 16.4% lower, due to the drop Profit before tax was EUR 200 million. Attributable profit after in the average commission and customer preference for other taxes and minority interests was EUR 130 million (-68.9%). types of savings. Total net fee income was EUR 616 million, almost the same as in 2010. Net operating income Attributable profit NPL ratio NPL coverage Million euros Million euros % % -19.2% 2011-2010 -68.9% 2011-2010 5.01 54 53 1,376 4.11 419 1,112 130 2010 2011 2010 2011 2010 2011 2010 2011 ANNUAL REPORT 2011 107
  • 110.
    Car financing market SantanderConsumer Finance Market share new business - new and used car Successful business model during the crisis (2008- 0% 10% 20% 30% 2011); attributable profit increased 76% and the return on assets was double that of the average of Norway our competitors. Finland Spain Profit surged 51.5%, fuelled by gross income Leading (+14.0%), efficiency ratio of 31.8% and a 19.1% Denmark positions and drop in loan-loss provisions. Poland critical mass in Solid contribution from all core countries, which Portugal 10 core car registered double-digit growth in profits. Germany financing Sharp improvement in credit quality (lower NPL ratio UK markets at 3.77% and high coverage at 113%). Sweden Italy Better liquidity position via deposit capturing and greater diversification of wholesale funding sources. Source: Local Consumer Finance Associations or internal estimates based on the publics statistics Santander Consumer Finance’s attributable profit was EUR In Europe, the focus was on organic growth and cross-selling, 1,228 million, 51.5% more than in 2010. backed by brand agreements (37 with 9 manufacturers), which increased the recurrence of profits and boosted new car Strategy business, particularly in Germany and the UK. The results in 2011 joined the unit’s differentiating performance in the two prior years, the most demanding of the international Increased penetration of the second hand car sector and in new financial and economic crisis. SCF performed better than car sales in central European and Nordic countries. The first comparable business units. steps were also taken in Germany by Santander Retail (former SEB) focusing in mortgages and in capturing customer funds. Since the end of 2008, the area has almost doubled its quarterly generation of attributable profit, while also offering a rising In the US, high growth in new loans and the capacity to extract return on assets consistently higher than that of the large value from a greater presence in the market doubled profits. European competitors. After the strong growth in 2011, the return is double that of those. This attractive performance made it possible for new partners to enter SC USA, formalised in the fourth quarter, and inject The SCF business model is based on portfolio diversification, $1,150 million of capital. This operation strengthes business and leadership in core markets, efficiency, control of risks and increases its future growth capacity. recoveries and a single pan-European platform. Diversified by products Net operating income Attributable profit % Million euros Million euros + 7.2% 2011-2010 + 51.5% 2011-2010 Car stock finance 5% Durables 5% 3,604 1,228 Auto-new 3,361 25% Mortgages 17% 811 Credit cards and other 9% Auto-used 22% 2010 2011 2010 2011 Direct 17% 108 ANNUAL REPORT 2011
  • 111.
    Activity Results Gross lending amounted to EUR 62,959 million, 7% less than in Gross income increased 14.0%, backed by the most basic 2010 because of the consolidation of SC USA by the equity revenues: net interest income (+13.6%), due to the rise in the accounted method in December. Excluding this impact, gross average portfolio and better spreads; fee income (+18.0%), lending was 16% higher, due to organic growth and the basically due to servicing in the US, and greater penetration in integration of businesses in Germany. key European countries (Germany, Poland and Norway). New lending amounted to EUR 27,396 million (+11%), spurred Higher expenses (+31.8%) due to the new incorporations. The by auto finance for used cars (+13%) and direct lending (+16%), new units brought the efficiency ratio to 31.8%, with clear particularly in Germany. Weaker activity in durable goods (-1%). opportunities for improvement once they are integrated. New cars increased 5.0%, well above the whole of the European market (-1%). Sharp fall in loan-loss provisions (-19.1%), causing net operating income after provisions to increase 46.8%. The lower provisions This growth, plus that in 2010, was achieved with strict reflect the improvement in the quality of the portfolio, even management of spreads and risk (admission policies), which after absorbing the incorporations. improved net interest margins and the risk performance (risk premiums at a minimum). The NPL ratio dropped from 4.95% in 2010 to 3.77% and coverage remained high at 113%, as both ratios were well In local currency terms, lending rose in Germany (+15%), the supported by recoveries (+38%). The exit of SC USA because of Nordic countries (+8%), the US (+51%), Spain (+11%) and its integration by the equity accounted method hardly affected Poland (+28% backed by the integration of AIG in 2010). On the NPL ratio, but it has a greater impact on coverage, given its the other hand, declines in Italy (-12%) and the UK (-4%), high coverage ratio, above 200%. On a like-for-like basis, the although in line with these markets. coverage ratio stood at 113%, up from 104% in 2010. Customer deposits increased 28% to EUR 33,198 million, fuelled These trends in revenues, costs and provisions produced the by SC Germany and the entry of Santander Retail. The latter unit 51.5% jump in attributable profit, with positive contributions took advantage of its “welcome” campaigns to grow in from all the core units. balances and customers (+EUR 2,500 million). Santander Consumer USA doubled its profits (+99.2% in The wholesale market increased the diversification of its funding dollars), due to its basic drivers: larger average volumes, higher sources with new issuance units. Of note was Norway where revenues from servicing and the lower cost of credit. Germany’s SCF made its first securitisation of car loans in the country. In profits grew 10.0%, driven by growth in lending and the risk Europe, the area placed EUR 5,000 million in securitisations and improvement. structured financing in the markets at competitive costs, clearly reflecting the attractiveness of our portfolios for investors in key The performance was very positive in the rest of the units, European markets. particularly the Nordic countries (attributable profit: +14.5% in local currency), the UK (+38.1% in sterling) and in Spain, which All of this enhanced SCF’s liquidity position (customer deposits returned to profit thanks to lower provisions. and medium- and long-term funding cover 66% of loans, 7 p.p. more than in 2010) and continued to reduce recourse to the Lastly, the unit in Poland more than doubled its profit because parent bank (already below 10% of loans). of the incorporation of AIG. Gross customer loans NPL ratio NPL coverage Billion euros % % Variation Dec’11/Dec’10 Germany 30 +39% 4.95 Italy 8 -4% 128 3.77 113 Spain 7 -11% Nordic countries 7 Total portfolio: +10% Other Eurozone 4 63 billion euros +1% UK 4 +16%* o/Dec’10 +9% Poland 3 -10% Nota: In December SC USA began to consolidate by the equity accounted method 2010 2011 2010 2011 (*) Before impact from consolidated by the equity accounted method from SC USA. Considering impact: -7% ANNUAL REPORT 2011 109
  • 112.
    In this difficultenvironment, the government continued to take Portugal measures to meet the budget deficit target of 5.9% of GDP in 2011. Pensions funds were transferred from the banking sector Activity affected by the adjustment plan and the to social security to cover part of the extraordinary overshoot in restructuring measures of Portuguese banks agreed spending. The IMF, in its second assessment of the adjustment with international institutions. programme, said “notable progress was made (…) and the Priority given to strengthening the balance sheet: specific measures included in the budgets should enable the 2012 fiscal challenges to be attained.” • Solvency and credit quality ratios were better than those of competitors. Meanwhile, under the Special Inspection Programme of the • The deleveraging goal set for the year was met troika assessments of risk and solvency for the eight largest after reducing lending by 6% and increasing Portuguese banking groups at June 2011 were made in their deposits 8%. workstreams one and two. The analysis of credit figures • Good result in the inspection programme revealed a provisions deficit of EUR 838 million (0.3% of total conducted by the Troika. lending), with a part already covered. Santander Totta’s provisions were considered adequate, and so it has no deficit, • The highest rating among banks in Portugal and the assessment of its solvency levels led to an increase of 10 (equal to the sovereign). basic points in its Tier 1 ratio. In results: • Profits plunged 61.8%, due to the 18.3% fall in Strategy gross income and the 87.7% rise in provisions. Following the country's request for aid at the beginning of • Costs (-2.1%) fell for the second year running. 2011, the financial sector had to refocus its strategy in order to meet the targets on capital, deleveraging and liquidity Best Bank in Portugal prize from The Banker and necessary to comply with the Financial Plan agreed with Euromoney European Authorities. Santander Totta has adopted measures that enable it to advance in the plan's financial targets, while strengthening the relationship with its customers by offering products adequate to the customers' savings needs (Depósito Vencedor, Seguros Santander Totta’s attributable profit was EUR 174 million, Financieros, Cuentas Poupança) which would offer them 61.8% less than in 2010. This was due to the 18.3% reduction liquidity and profitability at various maturities. in gross income, as a result of deleveraging and higher funding cost, and the rise of 87.7% in provisions. This strategy, coupled with increased transactions with customers, enabled the bank to significantly increase its Environment deposit base. Economic conditions worsened, particularly in the fourth quarter, which intensified the recession, especially domestic Selective growth in lending, while tending to the corporations demand. The unemployment rate rose to around 13%, financial needs mainly through products such as disposable income dropped because of higher taxes and factoring/confirming and international factoring, reaching conditions in the financial markets deteriorated with higher market shares of 19% and 23% respectively. Moreover, the spreads on Portuguese loans. support of SMEs via the program with government's guarantee (PME Investe), gave Santander Totta an 18% participation in these operations. Total assets Activity Reduction commercial GAP Loans / deposits Billion euros % variation 2011 / 2010 Billion euros % -9.6% 2011-2010 +8.0 216 3.4 49 45 139 2.0 121 -5.6 2010 2011 Loans Deposits 2011 Achieved in 2009 2010 2011 Plan the year 110 ANNUAL REPORT 2011
  • 113.
    In addition, SantanderTotta started an innovative project in Net fee income dropped 3.5% to EUR 345 million, reflecting the country to support exporting companies (Solução the net difference between the drop in lending, mutual funds Exportacão), through the offer of products suitable for this and financial insurance and the better performance of fee segment and advice by specialists of the bank. For this purpose income from GBM. Santander Totta can count on the support of the Group's international network, incorporating the companies to the The rest of income amounted to EUR 35 million, less than in International Desk model, providing them with a rapid route 2010 because of reduced gains on financial transactions and of contacts abroad as well as integrated solutions. This lower results from insurance activity. Income from the equity operation directly supports not only the sector's companies, accounted method increased 37.7%. but also the country's growth. Gross income declined 18.3% to EUR 972 million. Additionally, Santander Totta has three main finanial strategic Operating expenses declined in all lines (personnel, other lines: administrative costs and amortisations) for the second straight – Large deleveraging, reflected in the improvement in the year and were 2.1% lower. commercial gap and in the loan-to-deposit ratio, which Loan-loss provisions were 87.7% higher at EUR 206 million. improved from 216% at the end of 2009 to 139% in 2010 This increase reflects a prudent policy of adapting to the and 121% in 2011. difficulties of the economic cycle, which are strongly increasing – Strengthening of the balance sheet, with a big rise in NPLs. At the end of 2011 the NPL ratio stood at 4.06% and provisions. coverage at 55%. – Strict control of costs (-2.1% in nominal terms). In this environment Santander Totta's credit quality indicators continue to be clearly above the sector's average. Activity Deposits kept its dynamic evolution and amounted to EUR Profit before tax was EUR 187 million, 66.7% lower than in 23,465 million, 8% more than in 2010. Lending, on the other 2010. Attributable profit after taxes and minority interests was hand, reflected the deterioration of economic conditions and EUR 174 million. dropped 6% to EUR 28,403 million in all segments (SMEs: -12%, In short, in a extremely complex year in the country to carry companies: -14% and individuals -3%). out banking business, Santander Totta was the only large bank The evolution of deposits and lending, the result of to produce profits, it has the most solid balance sheet of the deleveraging, improved the structure of the balance sheet and Portuguese banking sector. Its NPL ratio is well below that of reduced the commercial gap by EUR 3,436 million (initially competitors, it has higher coverage ratios and a better capital goal of EUR 2,000 million for the whole year). ratio. Mutual funds declined 42%, and reflected the greater aversion to risk and the greater focus on on-balance sheet products. Results Santander Totta’s results compared to 2010 were as follows. Gross income was determined by the performance of net interest income, which was 18.2% lower than in 2010 at EUR 592 million. This evolution was due to lower lending and the higher cost of wholesale and retail funding due to the tougher competition in capturing deposits. These effects could not be offset by an improvement in credit spreads. Net operating income Attributable profit NPL ratio NPL coverage Million euros Million euros % % -31.9% 2011-2010 -61.8% 2011-2010 4.06 650 60 55 443 456 2.90 174 2010 2011 2010 2011 2010 2011 2010 2011 ANNUAL REPORT 2011 111
  • 114.
    Banking business grewat rates of close to 10%. Retail Poland (BZ WBK) Poland needs to complete its infrastructure and it has a low level Consolidated as of April 1, 2011. of “bankarisation” (loans only represent around 50% of GDP). Attributable profit of EUR 232 million in the three All of this raises good expectations for banking business. quarters. On a local pro forma basis, profit was Strategy 21.6% higher for the whole year. On April 1, Banco Santander completed the acquisition of 96% Both lending and deposits increased 14% since the of BZ WBK after the takeover launched in the first quarter for 100% and the 50% of BZ WBK Asset Management still in the bank’s incorporation to the Group. hands of AIB. The BZ WBK Group is now integrated into Grupo Solid funding structure: loan-to-deposits ratio of Santander, consolidating its results and business as of the 82%. second quarter. High growth potential due to the favourable BZ WBK has the third largest branch network in Poland (622 including 96 agencies), 9,382 employees, 2.4 million retail macroeconomic environment, solid presence in the customers and close to EUR 20,000 million of loans and market, management capacity and generation of customer funds (mostly deposits). synergies. Its business model is commercial banking, focusing on retail and company clients (SMEs and corporations), complemented by a notable presence in asset management, brokerage of securities and leasing. All of this fits well with Santander’s retail BZ WBK, in the nine months of its consolidation, posted an business model and provides a significant growth potential in attributable profit of EUR 232 million. For comparison results in the next few years, both via business as well as from purposes, the profit for the whole year in local criteria was EUR synergies. 288 million (+21.6%). As part of the bank’s integration into Grupo Santander, in the Environment first nine months under Santander management, and in BZ WBK enables Grupo Santander to develop its activity in cooperation with the local management team, the first steps Poland, a country with considerable potential: 38.5 million were taken to ensure the improvements in operational and citizens and an economy whose size is more than 40% of that commercial efficiency announced to the market. Of note of the other new EU members. were: Its economy is stable (it is the only EU country not to have • Measures to control costs in technology and operations were suffered a recession in the last decade), growing (4% forecast made, as well as the global integrator of Group purchases, for 2011) and supported by domestic demand (acceleration of with short-term goals. consumption and pick up in investment). Inflation rose during the first 10 months of the year to 4.3% and made the country’s • The financial and risk areas adjusted their structures, central bank raise its interest rates to 4.5% (+100 b.p. since the processes and information systems in order to ensure control end of 2010). The zloty remained stable against the euro until and homogeneity. Of note was the progress made in August when uncertainty in the markets weakened the currency implementing the corporate risk model. (PLN 4.46 at the end of 2011). Loans (Local criteria) Deposits (Local criteria) Net operating income Attributable profit Constant million euros Constant million euros (Local criteria) Million euros (Local criteria) Million euros + 14.5% 2011-2010 + 13.8% 2011-2010 + 4.3%* 2011-2010 + 18.1%* 2011-2010 (*) Excluding exchange rate impact: +7.4% (*) Excluding exchange rate impact: +21.6% 10,505 465 288 8,845 445 9,227 7,726 244 Mar’11 Dic’11 Mar’11 Dic’11 2010 2011 2010 2011 112 ANNUAL REPORT 2011
  • 115.
    • The launchof global business units which garner local Other Continental Europe knowledge and the Group’s experience. Tangible progress was made in Global Banking and Markets on the basis of the Attributable profit was EUR 424 million, 48.5% less than in clients of the Global Relationship Model in the country. 2010. The performance of the various businesses (GBM, asset management, insurance and Banif) varied. • Analysis and identification of the best practices in commercial banking, based on the long experience of both banks. Global Wholesale Banking, which provided 69% of gross income and 90% of profits, posted a 51.7% fall in attributable Activity profit (EUR 382 million), hit by market weakness and tensions BZ WBK registered as of September EUR 8,479 million of net in the last few quarters, as well as by the Group’s strategy to loans and EUR 10,359 million of deposits (1.1% and 1.6% of give priority to reducing risk and releasing capital and liquidity. the Group’s total lending and deposits, respectively). Gross income was 24.5% lower, due to gains on financial In the first nine months under Santander management, loans transactions, as in 2010 they amounted to EUR 452 million and deposits increased 14%, with a double-digit rise in the (loss of EUR 57 million in 2011, affected by the negative balances of companies and high single digit with individual performance of the last few quarters). Net interest income rose customers. 12.6%. Results Costs rose 8.0%, due to the investments in equipment and Attributable profit (nine months) was EUR 232 million, backed technology, while provisions increased due to the environment by solid gross income of EUR 690 million. Of this amount, EUR and the lower use of generic provisions. 371 million came from net interest income, which improved its return on assets after the rise in interest rates, and EUR 248 Better performance of insurance business. Attributable profit million from fee income, due to the importance of asset was 29.5% higher at EUR 35 million, fuelled by revenues management business and brokerage of securities. (+9.1%) and management of costs (-19.2%). Loan-loss provisions (EUR 60 million) absorbed only 16% of net Banif’s net interest income and fee income increased 7.8%, operating income. In line with the macroeconomic situation, the which coupled with a fall in loan-loss provisions and NPL ratio was 4.89%, lower than when the bank was integrated writedowns pushed up attributable profit by 39.7% to EUR 22 into Grupo Santander, and coverage 65%. million. In local criteria, these results compared very well with those of Attributable profit from asset management was EUR 10 million 2010, as basic revenues increased 8.2%, provisions were 12.8% (EUR 11 million in 2010). The main developments were in lower and attributable profit 21.6% higher. gross income, which remained virtually unchanged, lower costs and an unfavourable impact in taxes. Net operating income was better, spurred by mutual funds that did not feed through to profits because of the impact of higher taxes. ANNUAL REPORT 2011 113
  • 116.
    United Kingdom Million euros Variation 2011 2010 amount % Income statement Net interest income 4,176 4,766 (590) (12.4) Net fees 1,070 1,027 44 4.3 Gains (losses) on financial transactions 405 462 (57) (12.4) Other operating income (1) 26 30 (4) (12.8) Gross income 5,678 6,285 (607) (9.7) Operating expenses (2,554) (2,549) (5) 0.2 General administrative expenses (2,203) (2,241) 37 (1.7) Personnel (1,391) (1,295) (96) 7.4 Other general administrative expenses (812) (946) 134 (14.1) Depreciation and amortisation (351) (309) (42) 13.6 Net operating income 3,123 3,735 (612) (16.4) Net loan-loss provisions (585) (930) 345 (37.1) Other income (972) (105) (866) 822.7 Profit before taxes 1,567 2,700 (1,133) (42.0) Tax on profit (422) (734) 313 (42.6) Profit from continuing operations 1,145 1,965 (820) (41.7) Net profit from discontinued operations — — — — Consolidated profit 1,145 1,965 (820) (41.7) Minority interests 0 0 (0) (99.5) Attributable profit to the Group 1,145 1,965 (820) (41.7) Balance sheet Customer loans (2) 252,154 233,856 18,298 7.8 Trading portfolio (w/o loans) 41,440 45,187 (3,747) (8.3) Available-for-sale financial assets 55 204 (149) (73.0) Due from credit institutions (2) 19,672 29,137 (9,465) (32.5) Intangible assets and property and equipment 2,288 2,323 (35) (1.5) Other assets 39,833 42,063 (2,230) (5.3) Total assets/liabilities & shareholders' equity 355,443 352,769 2,673 0.8 Customer deposits (2) 194,318 184,548 9,770 5.3 Marketable debt securities (2) 70,504 64,326 6,179 9.6 Subordinated debt (2) 8,260 8,143 116 1.4 Insurance liabilities — 1 (1) (100.0) Due to credit institutions (2) 31,178 54,179 (23,000) (42.5) Other liabilities 38,330 29,811 8,519 28.6 Shareholders' equity (3) 12,852 11,762 1,090 9.3 Other customer funds under management 15,744 14,369 1,375 9.6 Mutual funds 15,744 14,369 1,375 9.6 Pension funds — — — — Managed portfolios — — — — Savings-insurance policies — — — — Customer funds under management 288,826 271,386 17,440 6.4 (1).- Including dividends, income from equity-accounted method and other operating income/expenses (2).- Including all on-balance sheet amounts for this item (3).- Not including profit of the year 114 ANNUAL REPORT 2011
  • 117.
    Strategy United Kingdom Santander UK maintained market shares of 14% in residential mortgages and 10% in retail deposits. It also continued to Attributable profit of £993 million: widen its range of products and services, while growth in • Lower revenues (-8.6%) impacted by increased lending to SMEs remained one of its main priorities. liquidity requirements, higher funding costs and lower trading gains. Santander UK’s goal is to become a full service, diversified, customer-centred commercial banking franchise. The strategy • Provisions 36.3% lower, with arrears performing has three basic principles: focus on the customer more than on better than envisaged. the product, business diversification toward a more balanced • Provision of £538 million net of tax in June for mix and continued operational efficiency compatible with a payment protection insurance (PPI) remediation. good level of customer service. Moderate increase in lending (+4.6%) and in Our proprietary market-leading IT platform is integral to deposits (+2.2%). meeting these goals. We will invest £490 million over the next Better funding structure: £25,000 million of three years to further improve its functionality and capabilities, medium-term funding issuances, with management at which point the ability to differentiate and grow the seeking to reduce short-term funding and businesses faster will be in place. unprofitable retail deposits. Activity Awarded ‘UK Bank of the Year’ by The Banker for Santander UK is focused on the United Kingdom (85% of its the third year in succession. balance sheet). More than 80% of customer loans are mortgages for homes in the UK. The portfolio of mortgages is of a high quality, with no exposure to self-certified or subprime mortgages and less than 1% of buy-to-let loans. Santander UK posted an attributable profit of £993 million, 41.0% less than in 2010. The loan-to-deposit ratio was 130% at the end of 2011, a slight deterioration compared to 2010, largely due to the This included the impact net of tax of a provision of £538 managed outflow of rate-sensitive deposits in the second half million in the second quarter, related to payment protection of 2011. insurance (PPI) remediation, in line with what has been done by other British banks. In addition, there were higher costs derived The following information on activity is in local criteria. from regulatory changes affecting increased liquidity Customer loans amounted to £203,261 million, 2% more than requirements and higher wholesale funding costs. All of this in 2010 and driven by the strong increase in loans to SMEs was in the context of a weak growth and low interest rates (+25%), offsetting the reduction in unsecured personal loans. environment. The stock of residential mortgages was largely unchanged. Environment Gross mortgage lending amounted to £23,705 million, £477 GDP growth continued to grow weakly, with an increase of million less than in 2010. Despite this decline, our gross lending 0.9% for 2011, but with gradually worsening growth rates market share in the fourth quarter increased to 19.5%, well which resulted in a negative fourth quarter (-0.8%) annualised. above our stock share. The fourth quarter results followed the Inflation (4.5% on average for the year) increased at a faster improved position of the third quarter, following a sluggish start pace than the average growth of wages and this reduction in to the year. Spreads improved, while the new business loan-to- real terms is impacting consumers and eroding confidence value (LTV) was 65% and the indexed stock LTV was 53%. indices. Loans to SMEs via the network of regional business centres In this environment of uncertainty, the Bank of England held kept up their strong pace of growth and amounted to base rates at 0.5% and boosted its quantitative easing £10,748 million at the end of 2011, 25% higher than in programme by £75,000 million to £275,000 million, despite 2010. The market share was 4.3%, 0.7 p.p. greater than in the increased rate of inflation in 2011. December 2010. Mortgages Companies’ loans Activity Loans / deposits Billion sterling (local criteria) Billion sterling (local criteria) % variation 2011 / 2010 in sterling % 0% 2011-2010 +16% 2011-2010 166 166 130 31 127 +4.6 27 +2.2 2010 2011 2010 2011 Loans Deposits 2010 2011 ANNUAL REPORT 2011 115
  • 118.
    In line withthe policy of restricting personal loans (UPLs), the Net interest income was 11.3% lower, reflecting the higher balance was 13% lower than in 2010 (£2,883 million). During cost of liquid assets. The total commercial spread was lower at 2011, this product began to be selectively marketed at better 1.85%, with higher spreads on loans more than offset by the risk-adjusted spreads to low risk customers. Gross lending greater cost of liquidity and funding. Increases in the increased 14% relative to 2010. proportion of customers on standard variable rate mortgages helped to partly mitigate the impact of low interest rates. Santander UK continued to dispose of non-core assets. The Higher net interest income in SMEs and corporations reflected portfolio ended the year at £5,889, 38% lower than at end growth in deposits and loans, with spreads on new loans 2010 and 73% below December 2008. continuing to increase. Retail deposits (£149,192 million) were 3% lower than in 2010. Net fee income was 5.5% higher, due to a new pricing The acquisition of deposits slowed in what was a smaller structure for current accounts where overdraft interest charges market of flow and where increased competition led to have been replaced with a flat fee. negative pricing and margins. A managed outflow of these more rate-sensitive and shorter term deposits was more than Gains on financial transactions declined 11.3%, due to the offset through the additional issuance of medium-term impact of lower market activity. funding. Operating expenses were 1.4% higher, (3% lower in real terms) This strategy enabled the bank’s funding position to improve due to the recruitment of 1,100 people to improve customer with medium-to long-term funding issuances of £25,000 service, completed in the first half of 2011, which enabled million and a substantial reduction in short-term financing. The Santander UK to repatriate to the UK call centres that were issuances cover a wide range of products at attractive rates abroad, as well as continued investments in Corporate Banking within the market environment. and Global Banking & Markets. The efficiency ratio was 45.0%. The opening of some 836,000 current accounts in 2011 Loan-loss provisions were 36.3% lower, due to the improved continued to reflect the effort and success in attracting quality evolution of retail products and to a better than expected customers. arrears performance in the current environment. A marketing campaign was launched in September to promote The NPL ratio was 1.86%, 0.10 p.p. higher than that of 2010. new current accounts and credit cards, as part of a new There was a better performance in all retail products, strategy to develop better and more lasting relations with particularly mortgages and unsecured personal loans, and a customers. The new current account offers better incentives to slight deterioration in the fourth quarter in corporate loans, existing customers, who change their primary account to including real estate. The stock of properties in possession Santander, and the 123 Cashback credit card offer remained very low (0.06% of the total portfolio compared to (reimbursements / rebates on purchases) has helped to increase 0.05% at the end of 2010). In general, the trends were better openings of credit cards (total: 543,000; +25%). than the sector’s, according to the data from the Council of Mortgage Lenders (CML). Results Gross income declined from £5,386 million in 2010 to £4,925 As a result, attributable profit for the year was £993 million. million, largely due to increased regulatory liquidity requirements and the higher costs of funding. Net operating income Attributable profit NPL ratio NPL coverage Million euros Million euros % % -16.4%* 2011-2010 -41.7%* 2011-2010 (*) In sterling: -15.4% (*) In sterling: -41.0% 1.86 3,735 1.76 3,123 1,965 46 38 1,145 2010 2011 2010 2011 2010 2011 2010 2011 116 ANNUAL REPORT 2011
  • 119.
    Latin America Million euros Variation 2011 2010 amount % Income statement Net interest income 16,473 14,678 1,795 12.2 Net fees 4,992 4,661 331 7.1 Gains (losses) on financial transactions 1,067 1,410 (344) (24.4) Other operating income (1) (90) (74) (16) 22.0 Gross income 22,442 20,676 1,766 8.5 Operating expenses (8,909) (7,971) (938) 11.8 General administrative expenses (7,984) (7,193) (790) 11.0 Personnel (4,456) (3,955) (501) 12.7 Other general administrative expenses (3,528) (3,238) (290) 9.0 Depreciation and amortisation (925) (778) (148) 19.0 Net operating income 13,533 12,705 828 6.5 Net loan-loss provisions (5,447) (4,687) (760) 16.2 Other income (1,029) (747) (282) 37.7 Profit before taxes 7,057 7,271 (214) (2.9) Tax on profit (1,654) (1,693) 39 (2.3) Profit from continuing operations 5,402 5,578 (175) (3.1) Net profit from discontinued operations — — — — Consolidated profit 5,402 5,578 (175) (3.1) Minority interests 738 850 (111) (13.1) Attributable profit to the Group 4,664 4,728 (64) (1.4) Balance sheet Customer loans (2) 139,867 127,268 12,599 9.9 Trading portfolio (w/o loans) 31,705 31,580 125 0.4 Available-for-sale financial assets 26,186 30,697 (4,511) (14.7) Due from credit institutions (2) 19,181 21,632 (2,450) (11.3) Intangible assets and property and equipment 4,312 4,880 (568) (11.6) Other assets 53,594 57,186 (3,592) (6.3) Total assets/liabilities & shareholders' equity 274,845 273,243 1,603 0.6 Customer deposits (2) 134,078 137,848 (3,770) (2.7) Marketable debt securities (2) 23,253 15,376 7,877 51.2 Subordinated debt (2) 6,015 5,683 332 5.8 Insurance liabilities — 9,515 (9,515) (100.0) Due to credit institutions (2) 46,813 38,103 8,710 22.9 Other liabilities 45,170 45,913 (743) (1.6) Shareholders' equity (3) 19,516 20,805 (1,289) (6.2) Other customer funds under management 69,902 77,180 (7,278) (9.4) Mutual funds 55,829 61,621 (5,792) (9.4) Pension funds — — — — Managed portfolios 14,073 14,800 (728) (4.9) Savings-insurance policies — 758 (758) (100.0) Customer funds under management 233,248 236,087 (2,838) (1.2) (1).- Including dividends, income from equity-accounted method and other operating income/expenses (2).- Including all on-balance sheet sheet balance sheets for this item (3).- Not including profit of the year ANNUAL REPORT 2011 117
  • 120.
    The emergence ofan increasingly more adverse external Latin America scenario as the year progressed, particularly in the second Basic revenues from business increased 12.1% and quarter, led central banks to change the bias of their monetary policies. After raising interest rates until July, they began to were the main driver in profit growth. show their readiness to lower them. Only Brazil’s central bank Costs were 13.0% higher due to installed capacity decided to begin to cut interest rates, leaving the Selic at 11% and some pressure from inflation and the signing of at the end of the year (-150 b.p. since July). The central banks of collective agreements. Colombia and Uruguay were the only ones to break with this trend and in the last months of 2011 lifted their key rates by 25 Loan-loss provisions were 16.7% higher, below b.p. in Colombia to 4.75% and by 75 b.p. in Uruguay to 8.75%. lending growth. Budget deficits continued the reduction begun in 2010, Net operating income after provisions increased although at a more moderate pace, thanks to higher tax 1.9%. receipts and the end of public investment programmes begun in Strong business activity, reflected in a faster pace of 2008-2009. The fiscal deficit was around 2.3% of GDP for the lending (+18%) and deposits (+9%) in all countries. region, slightly better than in 2010 (2.4%), but a very healthy level. The region thus has a good starting point if the situation Best bank in Latin America according to worsens and makes it necessary to implement a more expansive Euromoney. policy. The public debt to GDP ratio is very moderate at close to 30% on the average for the region. The evolution of external accounts was also good, with a larger trade surplus than in 2010, as a result of lower growth in imports than in exports, although both continued to expand at Santander generated attributable profit of EUR 4,664 million in double-digit rates in most countries. Thanks to this, the current 2011, 1.4% less than in 2010 (+0.1% in constant currency). account deficit for the region remained below 2% of GDP, in line with 2010. This presents no funding problems given the The main developments were the notable rise in basic revenues high level of international reserves (close to $680,000, or 14% (+12.1%), which did not feed through to profits as it was offset of the region’s GDP). by the fall in gains on financial transactions due to the market situation, the commercial investments and the rise in loan-loss The main impact of the international financial turbulence on provisions (+16.7%, but less than the 18% increase in lending). Latin America was felt in its currency and stock markets. Latin American currencies depreciated 10.6% on average in 2011 Economic environment against the dollar and the main stock market indices fell 14.7% Following the solid recovery in 2010, overcoming the crisis of in local currency. 2008-2009, Latin America’s economic growth eased in 2011 to more sustainable rates (around 4%), and some countries are On the basis of the countries where Santander operates (Brazil, beginning to be affected by the deterioration of the Mexico, Chile, Argentina, Colombia, Uruguay, Peru and Puerto International environment. Rico), banking business recovered its growth rates and increased 17%. Lending accelerated to 20%, excluding the exchange rate Domestic demand remained buoyant, although on a downward impact. Loans to individual customers grew 21% (cards: +23%; trend during 2011. The contribution of external demand was consumer: +17% and mortgages: +27%), while credit to less negative than in 2010, due to a sharper fall in imports than companies and institutions increased 19%. in exports. Savings growth eased a little, but remained double-digit (+15%). Inflation began to rise and reached an average of 5.7% in Demand deposits rose 13%. Generally speaking, and on the September, to end the year at 5.6%, slightly above the 5.5% of basis of the main financial systems, Brazil’s growth was the most 2010. dynamic, while that of Chile (together with Mexico) was more moderate. Loans Savings Net interest income / Net operating income % y-o-y variation w/o forex impact % y-o-y variation w/o forex impact provisions % o/ ATAs Million euros + 6.5%* 2011-2010 6.10 (*) Excluding exchange rate impact: +7.3% 6.04 Net interest +17.9 income 13,533 12,705 +14.7 4.15 +8.1 4.04 Provisions +2.0 1.95 2.00 2010 2011 2010 2011 2010 2011 2010 2011 118 ANNUAL REPORT 2011
  • 121.
    Because of theirimpact on business and on converting figures into euros, the evolution of interest rates and exchange rates is Main focuses of management in 2011 commented on: 1. Permanent watch on capital, liquidity and business • Average short-term interest rates, based on the region’s risks average weighted rate, rose between 2010 and 2011. 2. Focus on generating revenues, with strong business, • The evolution of results in euros is affected by average management of spreads and activities that generate exchange rates. In global terms, Latin American currencies fee income. appreciated against the dollar (except the Argentine peso), while the dollar, the reference currency in Latin America, 3. Selective growth in lending centred on net risk depreciated 5% against the euro. In average terms, the premiums. Brazilian real and the Chilean peso appreciated a little (from 4. Management of customers, focused on linkage, 2.33 to 2.32 and from 674 to 672, respectively), while the transactions and credit quality improvement. Mexican peso depreciated from 16.70 to 17.25. 5. Investment in installed capacity in all countries under Strategy in 2011 the principle of austerity and efficiency. The financial systems maintained high levels of solvency, liquidity and credit quality. The strong growth in lending and savings is beginning to slacken due to the international scenario. • In July, a global agreement was reached with Zurich for it to In these circumstances, the Bank continued to keep watch on its acquire 51% of the holding which groups the insurers in levels of capital, liquidity and exposure to business risks. This Argentina, Brazil, Chile, Mexico and Uruguay, as well as a resulted in harmonious growth in the balance sheet, but with a product distribution agreement in those countries. During the clear emphasis on customer deposits and safeguarding the third and fourth quarters, the 51% stake was sold to Zurich liquidity position. and it incorporated the insurers in the countries, after The Bank also continued to focus on selective growth in obtaining authorisations from local supervisors and from the lending, managing spreads, optimising the mix of products and European Union. segments and handling appropriately the risk/return relation. • In the fourth quarter, the Group completed the sale in the In a less dynamic context, the bank weighed up all the new secondary market of 7.82% of Banco Santander Chile for commercial projects from the standpoint of future profitability, $950 million. This left Grupo Santander with 67% of this within the principles of austerity and efficiency which create bank. shareholder value. • Also in the fourth quarter, the Group announced an The Group also kept the emphasis on customer management, agreement to sell its business units in Colombia to the Chilean focusing on linkage, transactions and better quality service. group CorpBanca for $1,225 million (estimated capital gains of EUR 615 million). This operation is due to be completed In 2011, Grupo Santander carried out the following operations during 2012 and it is subject to obtaining the authorisations in Latin America: from the regulatory bodies and a takeover bid delisting Banco Santander Colombia shares aimed to minority shareholders • Santander Mexico acquired in the second quarter a portfolio who have 2.15% of Santander Colombia. The 2011 results do of mortgages from GE Capital Corporation for $1,870 not yet incorporate these capital gains. million. Net operating income Attributable profit NPL ratio NPL coverage after LLPs Million euros Million euros % % + 0.8%* 2011-2010 -1.4%* 2011-2010 (*) Excluding exchange rate impact: +1.9% (*) Excluding exchange rate impact: +0.1% 4.32 104 8,086 97 4.11 8,018 4,728 4,664 2010 2011 2010 2011 2010 2011 2010 2011 ANNUAL REPORT 2011 119
  • 122.
    At the endof 2011, Grupo Santander had 6,046 points of Results attention in Latin America including traditional branches and Net interest income rose 13.1%, due to larger volumes and other points of attention and 27,975 ATMs. management of spreads in a context of higher interest rates than in 2010. The number of customers reached 41.7 million, an increase of 1.4 million. The Group’s strategic in 2011 was focused more on Net fee income increased 8.7%, with that from insurance up customer linkage than on capturing new customers. Grupo 31.7% and cards 23.7%, while those from managing accounts Santander is the leading franchise in the region, with business fell 16.6%. Income from insurance business grew 16.9%, volumes almost double those of the next competitor. Taking affected by the impact of the agreement with Zurich (excluding advantage of the synergies of Santander's differential position in this impact: +34.8%). the region, the bank launched International Desk, a project designed to support SMEs in their internationalisation process, As a result, basic revenues were 12.1% higher than in 2010, exploiting the competitive advantage of having the largest and the fourth quarter was a record one. branch network in Latin America. Gains on financial transactions dropped 23.5%, due to the The main developments in business 2011 are set out below. All volatility of markets in the third and fourth quarters. This fall percentage changes exclude the exchange-rate impact. was more than offset by the rise in basic revenues and gross income increased 9.5%. Activity In Latin America (excluding the balances in the New York Operating expenses were up 13.0%, higher than the inflation branch, which are more volatile), lending increased 18% (cards: rate, due to various factors: growth in staff in the networks, +25%; commercial credits – companies and institutions – +18%: renegotiation of fees and collective agreements, new business mortgages: 25% and consumer loans +14%). projects, increased installed capacity and redesigning points of attention. The efficiency ratio remained at around 40%. Also excluding the New York branch, savings rose 5%. Deposits excluding repos increased 9%, with good performance of time Loan-loss provisions rose 16.7%, partly due to greater generic deposits: +22%, while mutual funds dropped 2%. provisions. The risk premium went from 3.63% in 2010 to 3.81% in 2011. The NPL ratio was 4.32% and coverage 97%, The average market shares in the countries where the Group (4.11% and 104% respectively in 2010). operates are 11.2% in loans; 8.3% in savings and 9.4% in total banking business. The Group's attributable profit in the region was EUR 4,664 million. Retail Banking’s attributable profit rose 0.8%, while Global Wholesale Banking and Asset Management and Insurance's dropped 1.5% and 1.4% respectively. Latin America. Income statement Million euros Gross Net operating Attributable income income profit to the Group 2011 Var (%) 2011 Var (%) 2011 Var (%) Brazil 15,940 11.3 9,963 10.6 2,610 (7.2) Mexico 2,383 1.1 1,387 (3.3) 936 40.9 Chile 2,077 2.2 1,264 (2.5) 611 (9.0) Argentina 926 12.3 472 4.7 287 (2.7) Uruguay 172 1.6 40 (46.8) 20 (70.3) Colombia 207 11.0 91 21.8 58 43.0 Puerto Rico 344 (5.3) 169 (9.3) 34 (10.1) Rest 105 (24.3) (15) — (24) — Subtotal 22,153 8.6 13,371 6.6 4,531 (1.2) Santander Private Banking 289 2.2 162 (0.4) 133 (4.8) Total 22,442 8.5 13,533 6.5 4,664 (1.4) 120 ANNUAL REPORT 2011
  • 123.
    Latin America. Mainunits Million euros Brazil Mexico Chile 2011 Var (%) 2011 Var (%) 2011 Var (%) Income statement Net interest income 12,061 15.3 1,680 4.1 1,543 2.9 Net fees 3,253 8.4 603 6.3 422 2.7 Gains (losses) on financial transactions 757 (22.4) 98 (44.3) 77 (14.3) Other operating income (1) (131) 15.2 1 — 36 8.1 Gross income 15,940 11.3 2,383 1.1 2,077 2.2 Operating expenses (5,976) 12.4 (996) 8.0 (814) 10.4 General administrative expenses (5,326) 10.8 (887) 8.9 (724) 11.2 Personnel (2,927) 12.9 (466) 8.4 (459) 12.2 Other general administrative expenses (2,399) 8.3 (422) 9.5 (265) 9.4 Depreciation and amortisation (651) 27.9 (108) 1.2 (89) 4.5 Net operating income 9,963 10.6 1,387 (3.3) 1,264 (2.5) Net loan-loss provisions (4,508) 21.5 (337) (28.0) (380) 17.6 Other income (1,102) 47.6 33 — 40 31.8 Profit before taxes 4,354 (4.3) 1,083 15.7 924 (7.9) Tax on profit (1,198) (0.1) (145) 2.2 (126) (18.9) Profit from continuing operations 3,156 (5.9) 938 18.1 798 (5.9) Net profit from discontinued operations — — — — — — Consolidated profit 3,156 (5.9) 938 18.1 798 (5.9) Minority interests 546 1.3 2 (98.7) 187 5.9 Attributable profit to the Group 2,610 (7.2) 936 40.9 611 (9.0) Balance sheet Customer loans (2) 78,408 10.4 18,185 20.0 25,709 (0.1) Trading portfolio (w/o loans) 12,994 12.7 12,171 (6.4) 3,019 (14.5) Available-for-sale financial assets 18,422 (13.3) 3,410 (8.2) 2,572 (9.0) Due from credit institutions (2) 8,490 (21.8) 4,463 (0.3) 2,049 (12.8) Intangible assets and property and equipment 3,228 (15.3) 369 (7.8) 350 (6.5) Other assets 36,612 (12.4) 4,253 (3.2) 5,208 30.6 Total assets/liabilities & shareholders' equity 158,157 (1.3) 42,852 4.1 38,906 0.3 Customer deposits (2) 72,405 (4.3) 21,459 1.5 20,175 11.4 Marketable debt securities (2) 16,154 76.3 1,324 264.4 5,601 0.2 Subordinated debt (2) 4,515 3.3 — — 1,285 16.9 Insurance liabilities — (100.0) — (100.0) — (100.0) Due to credit institutions (2) 28,847 19.0 7,591 1.1 4,851 (12.9) Other liabilities 25,795 (2.2) 8,715 11.2 5,112 (13.6) Shareholders' equity (3) 10,440 (10.1) 3,763 (5.7) 1,882 (13.9) Other customer funds under management 42,785 (12.2) 9,432 (6.8) 4,846 (17.5) Mutual funds 39,414 (10.3) 9,432 (5.7) 4,846 (16.5) Pension funds — — — — — — Managed portfolios 3,371 (19.8) — — — — Savings-insurance policies — (100.0) — (100.0) — (100.0) Customer funds under management 135,859 (1.5) 32,214 1.9 31,908 4.0 (1).- Including dividends, income from equity-accounted method and other operating income/expenses (2).- Including all on-balance sheet amounts for this item (3).- Not including profit of the year ANNUAL REPORT 2011 121
  • 124.
    Employment rates continuedtheir positive trend, where the Brazil jobless rate reached a record low of 4.7%. In twelve months, 1.9 million new jobs were created and real income increased 7%. Greater activity and management of spreads fuelled basic revenues growth (+13.7%). Inflation ended the year at 6.5%, the upper ceiling established by the central bank. Higher operating expenses (+12.3%) reflected the commercial investment (opening 154 branches) and In this context, the central bank, given the international the collective agreement. scenario, started to ease the interest rates (Selic) ending the year at 11%, after reaching 12.5% in the first half of the year. Higher provisions (+21.4%) due to increased business and moderate rise in the sector’s NPLs. With the latest available data, the banking system’s total lending grew 18% and savings 16%. Net operating income after provisions increased 2.9%. Strategy Santander Brazil is the third largest private sector bank in terms Lending and savings grew 20% and 16%, of assets, and the leading foreign bank, with a market share of respectively. 10.5% in loans. It operates in the main regions, with 3,775 branches and points of banking attention, 18,419 ATMs and The main three rating agencies upgraded Santander 25.3 million customers, of which 19.3 million hold current Brazil's ratings giving it the highest rating of any accounts. Brazilian institution (long-term debt in foreign currency). The bank's strategy is based on the following goals: • be the best in quality of service, backed by the strength of the IT platform; • intensify relations with customers improving service quality Santander Brazil generated attributable profit of EUR 2,610 and infrastructure (it aims to open around 100 - 120 branches million, 7.2% lower than in 2010 (-7.3% in local currency). each year, in 2011-2013); The top part of the income statement is very solid. Gross income • business strengthening in key segments such as SMEs, rose 11.2% in local currency, spurred by net interest income and acquiring business, cards, real estate loans and consumer fee income, which coupled with a slight improvement in the credit; and boost cross-selling; efficiency ratio, produced a 10.5% increase in net operating income. This increase enabled the larger provisions to be • better recognition of the Santander brand; absorbed, maintaining net operating income after provisions in positive growth rates (+2.9%). This, however, did feed through • all of this accompanied by prudent risk management. to profits mainly because of labour disputes, higher tax rate and minority interests. Technology integration was completed in the first half of 2011, adding to unification of the brand carried out in 2010. Functions Economic environment were improved in the new unified platform, which is more agile The latest figures continue to show a favourable picture, with and has a wider range of products and services, enabling the GDP growing at 3% in 2011, fuelled by domestic demand and bank to develop activity more productively. an outlook of sustained growth in the coming years of around 3-4%. In products and collectives, an alliance was reached with Telefónica and with the owners of the Esso, Shell and Mobil According to IMF estimates, Brazil is the world’s sixth largest brands in Brazil to launch the new Santander Esso and economy. Santander Shell cards. Another key segment in the Group’s strategy is real estate credit, where specific products were developed for high income customers, such as personalised advice, discounts in home insurance and special conditions for investments in time deposits and pension funds. Loans Savings* Net interest income / Net operating income % y-o-y variation w/o forex impact % y-o-y variation w/o forex impact provisions % o/ ATAs Million euros (*) Including “letras financeiras” + 10.6%* 2011-2010 7.53 (*) Excluding exchange rate impact: +10.5% 7.47 Net interest +20.3 income 9,963 +8.2 9,007 +16.3 4.86 4.68 +6.5 Provisions 2.67 2.79 2010 2011 2010 2011 2010 2011 2010 2011 122 ANNUAL REPORT 2011
  • 125.
    In the acquiringbusiness, Santander Brazil maintained its good The good trend in fee income, (+8.3%) backed by cards and results and attained a base five times higher than in 2010. It was insurance, which increased by more than 30%. The recurrence the first bank to unite acquiring services with banking services, ratio was 61.1%. which is very attractive for SMEs. Gains on financial transactions were EUR 757 million, 22.5% As part of its strategy to become the best and most efficient lower due to the lesser contribution from activities linked to the universal bank in the country, Santander Brazil launched the markets. They only accounted for 5% of total revenues reducing Piloto del Modelo de Atención in order to increase customer their share. satisfaction. In short, gross income continued to grow, as the net interest Also, in order to improve quality and provide a better capacity of income has increased in all quarters during the last four years response, improvements were made to the telephone attention and fee income has done so in four of the last seven quarters. centres for individuals and companies. Total basic revenues grew 13.7% in 2011 against 5.9% in 2010. Lastly, and in order to be more agile in risks, the system has a Operating expenses grew 12.3%, due to: new tool which will enable operations to be approved more quickly, minimise errors and enhance analysis of results. • the investment made to increase the distribution capacity (opening of 154 traditional branches in 12 months) Activity Lending kept up the growing trend started in 2010. It rose 20%, • the new IT platform and with growth across all segments. • collective agreements • Loans to individuals (+23%), particularly mortgages (+40%) Net operating income rose 10.5% to EUR 9,963 million and the and cards (+31%) efficiency ratio was 37%, similar to that of 2010. • SMEs and companies (+26% combined). Provisions for loan losses were 21.4% higher than in 2010, due • Large companies (+12%). to the increase of close to 20% in lending balances and a moderate rise in the NPLs of individual borrowers, mainly in Deposits excluding repos rose 6%, with a good performance in consumer credit and cards. The NPL ratio was 5.38% (4.91% in time deposits: +30%, coupled with strong capturing in letras December 2010) and coverage 95%. financeiras, an instrument that provides greater stability and which started to be marketed in 2010. Including them, Net operating income after provisions increased 2.9%, driven by customer deposits rose 16%. the strength of the most basic revenues, which absorbed the investments in installed capacity and provisions. The market share in lending was 10.5% (11.7% in unrestricted lending) and 7.9% in deposits. Including the higher provisions for labour disputes, the higher tax rate and larger minority interests from the partial placement Results of shares in 2010, attributable profit was 7.3% lower at EUR In results (always in local currency), gross income kept up the 2,610 million. growing trend started in 2010. It amounted to EUR 15,940 million, 11.2% higher. Retail Banking and Asset Management and Insurance's attributable profit was 12.2% and 8.1% lower respectively, The main component of growth was net interest income while that of GBM rose 4.2%. (+15.2%), spurred by the larger volumes and management of spreads. Net operating income Attributable profit NPL ratio NPL coverage after LLPs Million euros Million euros % % + 3.0%* 2011-2010 -7.2%* 2011-2010 (*) Excluding exchange rate impact: +2.9% (*) Excluding exchange rate impact: -7.3% 5.38 5,456 5,299 101 4.91 95 2,814 2,610 2010 2011 2010 2011 2010 2011 2010 2011 ANNUAL REPORT 2011 123
  • 126.
    The 11.2% depreciationof the Mexican peso against the dollar Mexico was one of the main effects of turbulence in the international markets. In order to limit exchange-rate volatility and inject Stronger franchise reflected in business and profits dollar liquidity into the Mexican market, the Bank of Mexico performance. decided at the end of November to auction daily $400 million provided the exchange rate varied in the day by more than 2% Basic revenues continued to accelerate (+8.6%) against the dollar. At the same time, it suspended the monthly fuelled by increased activity and spreads auctions of dollars. This measure produced very good results in management. the 2008-2009 crisis and, judging by the high level of international reserves of more than $140,000 million, it will do Costs rose 11.6% because of increased commercial so again. capacity and perimeter. Business picked up. Lending increased 16% (consumer credit Lower NPLs produced a 25.7% fall in loan-loss and cards: +23%) and savings 11%. provisions. Strategy Net operating income after provisions increased The Mexican financial system remains solid and liquid and has 12.4% and profit before minority interests 22.0%. good risk quality indicators. The international environment has not hit banking activity and growth in both lending and Strong rise in business: lending rose 22% on a like- savings remains strong. for-like basis and deposits 10%. In this context, Santander is the third largest banking group by business volume, with market shares of 16.0% in lending and 14.7% in savings. The Group has 1,125 branches and 9.3 million customers. Attributable profit was 40.9% higher at EUR 936 million (+45.6% in local currency), partly benefiting from lower In 2011, Santander Mexico continued to consolidate its minority interests. franchise by increasing its customer base and linkage and improving the quality of its services. Integral risk management Results showed a good trend, with growth in net interest and efficiency in costs continue to complement a strategy income and fee income and lower provisions. aimed at creating value for customers and shareholders. Economic environment The bank offered its customers innovative products and of GDP growth slowed in 2011 (to 3.8% from 5.4% in 2010, high value added, tailored to each segment. according to the latest estimates), with more moderate domestic demand, due to an easing of both private and public The strategy in mortgages is aimed at medium and residential consumption, while investment grew strongly and recovered housing segments (market share of close to 19%, 7 p.p. more the pre-crisis levels. The contribution of net external demand than in 2010). This sharp rise was due to organic growth, with was similar to that of 2010, but with a significant moderation the launch of products such as Hipoteca Light and the in exports and imports. acquisition of GE Capital Corporation's mortgage portfolio in Mexico. Job creation continued but at a slower pace (610,000 in 2011). The strategy in credit cards focused on placing new accounts mainly with current customers, paying particular attention to the Inflation was around 3.5% in 2011, closing the year at 3.8%. quality of the portfolio. In consumer credit, the use of alternative Medium- and long-term expectations continued at these rates channels is key for increasing balances (more than 30%), which (3.5%), despite the peso’s depreciation. In this context, the was achieved with an improvement in the index of the past-due Bank of Mexico held its key rate at 4.5%. portfolio. Other campaigns for customers were Vive la magia, Ganas o ganas and Auto compara in car insurance. Loans* Savings Net interest income / Net operating income % y-o-y variation w/o forex impact % y-o-y variation w/o forex impact provisions % sobre ATAs Million euros -3.3%* 2011-2010 (*) Without perimeter: +22.4% 3.98 (*) Excluding exchange rate impact: -0.1% 3.81 +30.9 Net interest income 1,434 2.82 1,387 3.04 +13.9 +15.4 1.16 +7.6 Provisions 0.77 2010 2011 2010 2011 2010 2011 2010 2011 124 ANNUAL REPORT 2011
  • 127.
    In SMEs, oneof the strategic segments, programmes were Results strengthened with NAFIN (Nacional Financiera) to support Gross income increased 4.5%. Net interest income grew 7.5% entrepreneurs, constructors and travel agencies. The market due to greater activity and active management of spreads share rose by more than two points in 2011 to more than (record fourth quarter). Fee income rose 9.8%, with a positive 21%. In corporate finance and companies, strategies were performance in insurance and transactional banking and a implemented to increase the number of customers and decline from cards and mutual funds. products were designed for agricultural business, confirming and foreign trade, which help to boost volumes. The magazine Gains on financial transactions dropped 42.5%, as a result of Trade Finance awarded the bank its “Deal of the year” prize for the market's instability and volatility of interest rates. financing Volkswagen. Operating expenses were 11.6% higher, reflecting the larger Other recognitions came from the magazine América Economía perimeter and greater installed capacity. Provisions confirmed as the best bank in Mexico in its ranking of 25 banks in Latin the trend of previous quarters, falling 25.7%, in line with the America, and from Global Finance, which recognised Santander improvement in risk premiums. as the safest bank in Mexico in its Latin American ranking. Net operating income after provisions increased 12.4%. Activity Attributable profit jumped 40.9% to EUR 936 million, mainly As a result of this activity, the Group ‘s growth in lending due to lower minority interests (+45.6% in local currency). accelerated (+31%), with all products performing well and spurred by the acquisition of GE Capital Corporation's Retail banking’s profit was up 69.7% due to lower provisions mortgage portfolio. and revenues recovery. Asset Management and Insurance’s rose 46.9% and Global Wholesale Banking’s dropped 22.8%, Lending rose 22% on a like-for-like basis (excluding GE). due to reduced results from markets and the worsening global Mortgages increased 81% (+30% on a like-for-like basis), economic environment. commercial credit 22% and consumer loans 33%, while loans via cards increased 14%. The efficiency ratio was 41.8%, the recurrence ratio 68.0% and ROE 21.2%. The NPL ratio (1.82%) and coverage (176%) were Savings increased 8%, with demand deposits up 14%, time still of high quality and evolved favourably during the year. 6% and mutual funds 3%. Net operating income Attributable profit NPL ratio NPL coverage after LLPs Million euros Million euros % % + 8.8%* 2011-2010 + 40.9%* 2011-2010 (*) Excluding exchange rate impact: +12.4% 215 (*) Excluding exchange rate impact: +45.6% 1,050 176 936 965 1.84 1.82 664 2010 2011 2010 2011 2010 2011 2010 2011 ANNUAL REPORT 2011 125
  • 128.
    Strategy Chile Santander Chile's strategy in 2011 was focused on strengthening its retail banking and improving customer Basic revenues rose 2.7%. Net interest income management by combining commercial assertiveness with accelerated in the fourth quarter (+13.8% over the prudence in risks. same period of 2010). Moreover, the strategy was aimed at obtaining the highest Operating expenses rose 10.1% because of the return from the various businesses, particularly via loans and signing of the collective agreement and greater savings with individual customers and SMEs, with special focus business. on deposits to boost the liquidity position. 2011 was the “Year of Service” for Santander Chile through a Loan-loss provisions were 17.3% higher. customer plan focused on retention, improving service and working on key factors that impact on customer relations. The Net operating income after provisions dropped 9.4%. central idea was to foster changes in attitude toward the customer and the quality of attention, using parameters of Focus on strengthening liquidity: deposits increased quality and transparency. 19% and loans 7%. Grupo Santander sold 7.82% of Banco Santander Chile for $950 million, leaving it with 67%. The UK magazine The Banker chose Banco Santander as “Bank of the Year” in Chile and the fourth safest bank in emerging Attributable profit was EUR 611 million, 9.0% less than in 2010 markets (the safest in Latin America), according to the magazine (-9.3% in local currency). Global Finance. Santander is the largest financial group in Chile in terms of Activity assets and profits. It has 499 branches and more than 3.5 Lending accelerated thanks to the higher economic growth million customers and market shares of 19.7% in loans and and the positive impact of reconstruction following the 2010 17.3% in savings. earthquake. Loans rose 7%, with cards up 15%, mortgages Economic environment 10% and consumer credit 8%. Commercial credit grew 4%. The pace of growth during 2011 returned to a more “normal” Savings grew 11%. Time deposits increased 29% and mutual rate as the impact of the post-earthquake recovery wore off. funds declined 10%. Domestic demand, however, continued to grow a brisk pace (close to 10% for the whole year). External demand’s Results contribution to GDP growth was negative, due to imports rising In results (and always in local currency), gross income rose a faster than exports. modest 1.9%, although the quarterly trend has been good. Net interest income increased 2.6%, affected by higher interest rates Inflation gradually rose to 4.4%, higher than initial expectations. and pressure on lending spreads. In this context, the central bank raised its key rate by 200 b.p. to 5.25% during the first half of the year and then introduced a downward bias in its monetary policy as a result of the worsening of the international context. It cut its key rate to 5.0% in January 2012. The peso depreciated 9.8% against the dollar, but the central bank continued to buy dollars in order to fulfil its goal of increasing the stock of reserves. Lending rose 17% (+18% in consumer credit and cards and +19% in commercial credit). Savings rose 14%. Loans Savings Net interest income / Net operating income % y-o-y variation w/o forex impact % y-o-y variation w/o forex impact provisions % sobre ATAs Million euros -2.5%* 2011-2010 4.35 (*) Excluding exchange rate impact: -2.7% 3.99 +13.6 Net interest +11.4 income 1,296 1,264 3.41 +7.3 3.01 Provisions +2.0 0.94 0.98 2010 2011 2010 2011 2010 2011 2010 2011 126 ANNUAL REPORT 2011
  • 129.
    Fee income, onthe other hand, rose 2.4%, with a good Argentina performance in that from cash management (+12.0%) and cards (+7.7%), while that from administration of accounts and mutual Activity Attributable profit funds dropped 20.7% and 5.2% respectively. Fee income from % y-o-y variation w/o forex impact Million euros insurance remained virtually flat (-0.5%). -2.7%* 2011-2010 (*) Excluding exchange rate impact: +8.0% Gains on financial transactions were 14.5% lower. +28.3 +27.4 295 Operating expenses rose 10.1%, higher than inflation, due to 287 the collective agreement, the increase in the rent for branches following their transfer in the second half of 2010 and strengthening business activity. Net loan-loss provisions rose 17.3% and attributable profit was 2010 2011 9.0% lower at EUR 611 million (-9.3% in local currency). Loans Savings Retail Banking’s profit dropped 14.8%, Asset Management and Insurance’s was 3.3% lower and Global Wholesale Banking’s Attributable profit was EUR 287 million, 2.7% lower (8.0% increased 16.1%. higher in local currency). The efficiency ratio was 39.2%, the recurrence ratio 58.2% and Santander Río is one of the country’s leading banks, with ROE 25.4%. The NPL ratio was 3.85% and coverage 73%. market shares of 8.9% in lending and 10.1% in savings. It has 358 branches and 2.5 million customers. Santander Río was chosen as the best bank in Argentina in Net operating income Attributable profit 2011 by The Banker, Euromoney and Global Finance. after LLPs Million euros Million euros Economic environment -9.2%* 2011-2010 -9.0%* 2011-2010 The economy grew briskly, although with some slowing down (*) Excluding exchange rate impact: -9.4% (*) Excluding exchange rate impact: -9.3% (estimated 7% for the year). Domestic demand eased and the net contribution of external demand to GDP growth was more negative. 973 884 671 Export growth in real terms dropped sharply from 14% in 2010 611 to 4%, while imports continued to grow at double-digit rates. Inflation was 9.5% in December, while interest rates rose significantly in the last months of 2011. The Badlar rate for private sector banks rose above 21% before ending the year at 2010 2011 2010 2011 around 19% (+750 b.p. over 2010). The peso depreciated 7.7% against the dollar and international reserves dropped by $5,600 to $46,000 million (10.6% of NPL ratio NPL coverage GDP). % % Growth in the financial system’s savings and lending was 28% and 50%, respectively, maintaining high levels of liquidity and a capitalisation ratio of close to 16%. The NPL ratio was 1.4% and coverage 172%. 3.85 89 3.74 73 Strategy The Group focused its strategy in 2011 on maximising the strengths of the franchise, sustained by a successful transactional banking model resting on low funding costs (demand deposits accounted for 68% of total deposits) and high levels of revenues from services (recurrence ratio of 88%). 2010 2011 2010 2011 The bank increased its retail network by 10%, mainly in the interior of the country and within what it calls its “strategic corridor” (high income regions, with strong growth prospects and trade links with Brazil). The strategy rested on balance sheet strength (liquid and well capitalised) and focused on business and management of NPLs, coupled with a differentiated customer attention model, a multichannel distribution network and an offer of products tailored to needs. ANNUAL REPORT 2011 127
  • 130.
    Santander Río launchedin 2011 the Super Préstamo Inversión Uruguay pyme which offers long-term financing to SMEs. Emphasis was also placed on customer satisfaction, with Activity Attributable profit improvements in quality and service levels. % y-o-y variation w/o forex impact Million euros Activity and Results -70.3%* 2011-2010 (*) Excluding exchange rate impact: -69.9% During the year lending continued to grow strongly (+28%) +39.2 and also savings (+27%). Demand deposits rose 20%, time 67 42% and mutual funds 35%. Gross income rose 24.7%, fuelled by basic revenues (+26.1%). 20 +8.1 Operating expenses rose 34.8%, due to inflation and growth in installed capacity (net opening of 34 branches between 2010 and 2011, from 324 to 358). In addition, the number of Loans Savings 2010 2011 contact-centre positions increased and the number of employees from 6,466 to 6,777. Net operating income increased 16.3%. Provisions were Attributable profit was EUR 20 million, 70.3% lower (-69.9% in 121.6% higher, mainly due to the increase in generic local currency), due to the 50.8% fall in gains on financial provisions. This produced an 8.2% increase in net operating transactions (capital gains in 2010 in the portfolio of securities), income after provisions and attributable profit rose 8.0%. costs (+42.5%) resulting from the new collective agreement and the new IT platform. The efficiency ratio was 49.0%, the recurrence ratio 88.4% and ROE 52.1%. The NPL ratio was 1.15% and coverage Good performance of basic revenues which rose 27.9% in the 207%. year. Santander is the largest private sector bank in the country in terms of the number of branches (78) and business (market share of 18.6% in lending and 16.0% in deposits). It has 247,000 customers. The economy grew 6.4%, according to the most recent estimates, down from 8.5% in 2010. Domestic demand growth remained very high at close to 9%, with strong private consumption and investment. However, due to the sharp slowdown in exports in real terms, the contribution of net external demand was more negative (reducing GDP growth by three points). As a result of inflation rising continuously, the central bank raised its key rate by 225 b.p. to 8.75%. The exchange rate remained stable against the dollar (19.95 pesos/$). International reserves ended the year at $10,300 million (over 20% of GDP) and $2,600 million more than in 2010. In local currency, the financial system's lending rose at a slower pace (+22%) and deposits grew 13%. The Group focused on retail business, creating a more massive model with new products and channels. Since 2010, it has conducted insurance business, making Santander the only bank in the country to be involved in this market. Under the framework of this strategy of increasing the number of customers to be offered this type of product, a finance company, Creditel, was acquired which has a strong position in medium and low sectors, enabling it to not only expand business but also incorporate the know how to get closer to customers. Lending rose 39% with the incorporation of Creditel and 30% on a like-for-like basis. Savings rose 8%. The efficiency ratio is 76.5%, the recurrence ratio 29.8%, the NPL ratio is only 0.64% and coverage remains very high. 128 ANNUAL REPORT 2011
  • 131.
    Colombia Puerto Rico Activity Attributable profit Activity Attributable profit % y-o-y variation w/o forex impact Million euros % y-o-y variation w/o forex impact Million euros + 43.0%* 2011-2010 -10.1%* 2011-2010 (*) Excluding exchange rate impact: +46.5% (*) Excluding exchange rate impact: -5.6% +21.4 +17.2 58 38 34 41 +11.9 +3.3 Loans Savings 2010 2011 Loans Savings 2010 2011 Attributable profit was 43.0% higher at EUR 58 million (+46.5% Attributable profit was EUR 34 million, 10.1% lower (-5.6% in in local currency), due to gross income (+13.7%), controlled dollars), because of higher taxes, as net operating income after costs (+6.3%, a little above inflation) and provisions for loan provisions increased 42.4% thanks to lower provisions. losses (-5.0%). Santander has 121 branches, 508,000 customers and market The Group has 80 branches, 297,000 customers and a market shares of 10.2% in loans, 11.8% in deposits and 21.6% in share of 2.7% in banking business. mutual funds. The economy showed no signs of slowing down, and grew by In a context of recession, the bank remained one of the three more than 5%, Domestic demand was buoyant, while the main banks by volume of loans, deposits and mutual funds, and contribution of net external demand to GDP growth, was it continued to strengthen recovery management of loans in an negative. irregular situation and grow selectively in business with individuals and companies. Inflation rose to 3.7% from 3.2% at the end of 2010, leading the central bank to raise its key rate, despite the deterioration of the For the fifth year running the magazine Global Finance external scenario in the second half, to 4.75% (+175 b.p. during recognised Santander Puerto Rico as the best bank in Puerto the year). Rico and The Banker for the sixth year. The peso depreciated 8% against the dollar in the second half, The bank improved the diversification of its revenues toward but compared to the end of 2010 the weakening was very other stable and recurrent sources. A great effort was made to moderate (only 1.0%). International reserves increased by $3,800 maximise linkage of customers right from the start of their million to $32,300 million. relation with the bank, while using the channels available for reducing the costs of acquisition boosted commercial In 2011, the strategy focused on selective growth in business, productivity. preserving appropriate levels of customer linkage of high and medium income customers and boosting transaction and The efficiency ratio was 50.9%, the recurrence ratio 39.2%, the insurance business. Management of NPLs is based on anticipation NPL ratio 8.64% and coverage 51%. and knowledge of the customer. Lending increased 12% and savings 21%. The efficiency ratio is 56.2% and the recurrence ratio 49.0%. The NPL ratio is 1.01% Perú and coverage 299%. As already mentioned, the Group announced agreement to sell its Activity Attributable profit % y-o-y variation w/o forex impact Million euros business in Colombia to the Chilean group CorpBanca. The operation is expected to be completed in the first quarter of + 56.4%* 2011-2010 (*) Excluding exchange rate impact: +60.3% 2012, once the regulatory authorisations have been obtained. +34.5 11 7 +19.0 Savings 2010 2011 Loans Activity is focused on companies and to the Group’s global customers. Attributable profit was EUR 11 million (EUR 7 million in 2010), due to the good evolution of net interest income (+56.0%). ANNUAL REPORT 2011 129
  • 132.
    Sovereign Million euros Variation 2011 2010 amount % Income statement Net interest income 1,678 1,736 (57) (3.3) Net fees 374 408 (33) (8.2) Gains (losses) on financial transactions 190 29 161 560.8 Other operating income (1) (55) (66) 11 (17.3) Gross income 2,188 2,106 82 3.9 Operating expenses (976) (937) (39) 4.2 General administrative expenses (863) (832) (31) 3.7 Personnel (469) (468) (1) 0.3 Other general administrative expenses (394) (364) (30) 8.1 Depreciation and amortisation (113) (105) (8) 8.0 Net operating income 1,212 1,169 43 3.7 Net loan-loss provisions (374) (510) 136 (26.6) Other income (61) (92) 30 (33.1) Profit before taxes 776 567 209 36.9 Tax on profit (250) (143) (107) 75.0 Profit from continuing operations 526 424 102 24.0 Net profit from discontinued operations — — — — Consolidated profit 526 424 102 24.0 Minority interests — — — — Attributable profit to the Group 526 424 102 24.0 Balance sheet Customer loans (2) 40,194 36,724 3,470 9.4 Trading portfolio (w/o loans) 271 211 60 28.5 Available-for-sale financial assets 12,435 10,203 2,232 21.9 Due from credit institutions (2) 677 722 (45) (6.3) Intangible assets and property and equipment 480 507 (27) (5.3) Other assets 3,643 3,430 213 6.2 Total assets/liabilities & shareholders' equity 57,700 51,797 5,903 11.4 Customer deposits (2) 36,884 32,007 4,877 15.2 Marketable debt securities (2) 1,653 1,945 (292) (15.0) Subordinated debt (2) 2,275 2,781 (506) (18.2) Insurance liabilities — — — — Due to credit institutions (2) 9,934 9,567 368 3.8 Other liabilities 2,412 2,297 115 5.0 Shareholders' equity (3) 4,542 3,200 1,341 41.9 Other customer funds under management 1 30 (29) (98.0) Mutual funds — — — — Pension funds — — — — Managed portfolios 1 30 (29) (98.0) Savings-insurance policies — — — — Customer funds under management 40,812 36,763 4,049 11.0 (1).- Including dividends, income from equity-accounted method and other operating income/expenses (2).- Including all on-balance sheet sheet balance sheets for this item (3).- Not including profit of the year Loans Deposits Net interest income / Net operating income % y-o-y variation w/o forex impact % y-o-y variation w/o forex impact provisions % o/ ATAs Million euros + 3.7%* 2011-2010 3.30 3.21 +11.6 Net interest (*) Excluding exchange rate impact: +9.0% income +6.0 1,212 2.33 1,169 2.50 0.97 -3.9 Provisions -1.6 0.71 2010 2011 2010 2011 2010 2011 2010 2011 130 ANNUAL REPORT 2011
  • 133.
    Strategy Sovereign Sovereign, with 723 branches, 2,303 ATMs and more than 1.7 million customers, is developing a business model focused on Higher gross income (+9.2%) and lower provisions retail customers and companies. It operates in the northeast of (-22.9%). the US, one of the country’s most prosperous areas, where it has significant market shares. Net operating income after provisions up 33.6%. The transformation phase in 2010, which put the franchise on Improved trend in loans over previous years (+6%) the path to profits, continued in 2011 with a phase of and deposits (+12%). stabilisation and laying the foundations for the creation of a stronger retail and commercial bank in the northeast of the US. Non-performing loans and coverage improved for the eighth quarter running. In a year marked by low demand for loans, Sovereign focused on profitability. Sovereign was granted the licence to become a In funds, the number of current accounts continued to grow, federal bank, which will enable a wider range of breaking the negative trend of previous years. This resulted in an products to be offered to a lager number of increase in the volume of customer deposits, enabling the bank customers. to finance growth in lending as well as reduce the volume of wholesale funding and improve the diversification and stability of the sources of financing. The commercial drive also offset the negative impact on fee Sovereign posted an attributable profit of $732 million (EUR 526 income of the new US regulatory framework. million), 30.3% more than in 2010. Of note in liquidity was the positive impact of growth in Economic environment deposits and the capacity to tap the US debt markets, Sovereign conducted its activity in an environment of slower underscored by the bank’s issue during 2011. GDP growth than in 2010, with a weak housing sector, a jobless rate close to historic highs and interest rates at minimums. Costs centred on creating the pillars to guarantee future growth. Particularly noteworthy were investments in human Lending by banks increased in the second and third quarters capital (teams in commercial and control functions) and in IT (+0.9% and 0.3%, respectively) for the first time since June platforms (Partenon will be running during the second half of 2008, although it is too early yet to speak of a change of trend. 2012). Growth was due to the increase in commercial loans (+1.8% in the second quarter and +0.3% in the third) and less in consumer Risk admission and renewal of loans remained rigorous together credit (flat in the second quarter and +0.3% in the third). with their proactive management, reflected in a continuous Deposits continued to flow toward those of the greatest improvement in NPL ratios, the lower need for provisions and availability (+4.9% over the second quarter) from time deposits higher coverage. (-2.4% vs. the second quarter). Net operating income Attributable profit NPL ratio NPL coverage after LLPs Million euros Million euros % % + 27.1%* 2011-2010 + 24.0%* 2011-2010 (*) Excluding exchange rate impact: +33.6% (*) Excluding exchange rate impact: +30.3% 96 4.61 838 526 75 659 2.85 424 2010 2011 2010 2011 2010 2011 2010 2011 ANNUAL REPORT 2011 131
  • 134.
    Lastly, an effortwas made to adjust organisational and The increase in lending was financed by the rise in customer management structures in response to the increasing regulatory deposits (+12%), which improved the diversification and stability requirements. This process culminated with approval by the of the funding sources. This, coupled with the reduction in the regulators of the change in the banking licence of Sovereign, volume of wholesale financing, reduced the cost of deposits by which turned it into a National Bank Association in 2012. 21 b.p. The conversion of Sovereign into a National Bank is an The focus on expanding the customer base is beginning to bear important milestone which, coupled with the unification and the fruit. The number of current accounts continuously rose in improvement process in the IT platform already begun, will 2011, breaking the negative trend of 2010. The monthly record convert a mainly single product bank into a retail franchise with for opening new accounts was repeatedly broken. a full range of products, improving both the offer capacity as well as the penetration of customers. Results Gross income was $3,042 million (+9.2%). Net interest income The strong generation of recurring results in 2011, high levels of (+1.6%) reflected management of volumes and prices that efficiency, enhanced credit quality, solid capital ratios, offset the impact of the sharp decline in interest rates. In fee comfortable levels of liquidity and the improved capacity to offer income (-3.5%), the negative impact of the new US regulatory products, put Sovereign in a privileged position to bolster and framework was offset partly by a greater business drive. Lastly, expand the franchise and make it one of the reference banks in another contributor was the growth in capital gains generated the north east of the US. in the ALCO portfolio. Activity The 9.5% growth in operating costs reflects the impact of Balance sheet management remained characterised by an investments in technology and the increase in commercial increase in profitability and a better mix of lending and funding structures begun in the second half of 2010. The efficiency ratio products, enabling spreads to improve on new and renewed was 44.6%, virtually the same as in 2010, and net operating operations over those of 2010. income increased 9.0%. In lending, the portfolio continued to be repositioned, with a Net loan-loss provisions were 22.9% lower, thanks to gradual exit from higher risk segments into more attractive ones. containment of NPLs and the recovery capacity throughout the Although the bank continued to deepen business in residential credit cycle. This is reflected in a better than expected evolution segments, the asset mix benefited from growth in loans to in credit quality. companies and GBM. Sovereign continued to prepare its commercial and regulatory structure in order to take advantage Net operating income after provisions was 33.6% higher at of the incipient recovery in these segments. $1,165 million and profit before tax was $1,080 million (43.8%). Total lending grew 6% and 8% excluding the non-strategic portfolio. The improvement in the composition of the portfolio In short, the results show a solid income statement backed by combined with risk management produced a further fall in the the generation of recurring revenues, a reduction in the cost of NPL ratio to 2.85% (4.61% in 2010) and a rise in coverage to deposits and an improvement in the levels of provisions. All of 96% (75% in 2010). Both improved for the eighth quarter this was the result of the improvement in the balance sheet running. structure, which, together with the recovery in volumes of basic loans and control of spending, provide a solid base for 2012. Pro forma US results Grupo Santander’s total attributable profit from the US Million $ (Sovereign Bank, Santander Consumer USA, Santander Private Banking USA, Puerto Rico and the New York branch) amounted to $1,472 million, 44.3% more than in 2010. 2011 2010 Var (%) The main reasons for this were strong growth by Sovereign Gross income 6,479 5,694 13.8 and the consumer finance unit. Net operating income 4,189 3,671 14.1 Attributable profit to the Group 1,472 1,020 44.3 132 ANNUAL REPORT 2011
  • 135.
    Corporate Activities Millioneuros Variation 2011 2010 amount % Income statement Net interest income (2,172) (1,828) (344) 18.8 Net fees (16) (40) 24 (60.3) Gains (losses) on financial transactions 605 (142) 746 — Dividends 57 64 (7) (11.1) Income from equity-accounted method 5 (2) 7 — Other operating income/expenses (net) 129 137 (8) (6.1) Gross income (1,392) (1,810) 418 (23.1) Operating expenses (838) (822) (16) 2.0 General administrative expenses (733) (689) (44) 6.4 Personnel (285) (268) (16) 6.1 Other general administrative expenses (448) (420) (28) 6.6 Depreciation and amortisation (105) (133) 28 (20.9) Net operating income (2,230) (2,632) 401 (15.2) Net loan-loss provisions 37 (111) 149 — Other income (429) (428) (2) 0.4 Profit before taxes (w/o capital gains) (2,623) (3,171) 548 (17.3) Tax on profit 440 867 (427) (49.3) Profit from continuing operations (w/o capital gains) (2,183) (2,304) 121 (5.3) Net profit from discontinued operations — (13) 13 (100.0) Consolidated profit (w/o capital gains) (2,183) (2,317) 134 (5.8) Minority interests (20) (25) 6 (22.6) Attributable profit to the Group (w/o capital gains) (2,163) (2,291) 128 (5.6) Net extraordinary capital gains and provisions (1,670) — (1,670) — Attributable profit to the Group (3,833) (2,291) (1,542) 67.3 Balance sheet Trading portfolio (w/o loans) 7,727 5,123 2,605 50.8 Available-for-sale financial assets 23,297 21,288 2,009 9.4 Investments 908 38 870 — Goodwill 25,089 24,622 466 1.9 Liquidity lent to the Group 10,440 28,265 (17,825) (63.1) Capital assigned to Group areas 67,699 63,187 4,512 7.1 Other assets 101,749 64,806 36,943 57.0 Total assets/liabilities & shareholders' equity 236,908 207,329 29,579 14.3 Customer deposits (1) 19,672 14,258 5,415 38.0 Marketable debt securities (1) 62,253 62,812 (559) (0.9) Subordinated debt (1) 5,477 12,128 (6,651) (54.8) Other liabilities 72,391 47,709 24,682 51.7 Group capital and reserves (2) 77,115 70,423 6,692 9.5 Other customer funds under management — — — — Mutual funds — — — — Pension funds — — — — Managed portfolios — — — — Savings-insurance policies — — — — Customer funds under management 87,402 89,198 (1,796) (2.0) (1).- Including all on-balance sheet amounts for this item (2).- Not including profit of the year ANNUAL REPORT 2011 133
  • 136.
    The Group considersit necessary to immunise the impact which, Corporate Activities in situations of high volatility in the markets, sharp movements in exchange rates would have on these exposures of a This area’s results recorded extraordinary provisions permanent nature. The investments which are currently covered net of tax of EUR 3,183 million, of which EUR 1,513 are those of the UK, Poland, Brazil, Mexico and Chile, and the were drawn from capital gains and EUR 1,670 instruments used are spot contracts, FX forwards or tunnel million from the fourth quarter profit. options. Excluding this impact, the area’s results were The objective of the hedging is set as part of the shareholders’ almost the same as in 2010: equity of the unit equivalent to a percentage of risk-weighted assets, which can be changed. • Higher cost of funding and reduced recovery of taxes increased the losses. Meanwhile, exposures of a temporary nature (i.e. those regarding the results which the Group’s units will contribute • This impact was offset by greater gains on over the next 12 months), when they are in currencies other financial transactions, mainly hedging of exchange than the euro, are also covered on centralised basis. These rates. results, generated in the local currencies of the units, are hedged with exchange-rate derivatives. The objective is to establish the euros resulting from the exchange rate at the beginning of the year. These policies immunise both the investment in the shareholders’ equity as well as the Corporate Activities covers, on the one hand, a series of contribution to results of the various units. centralised activities to manage the structural risks of the Group and of the parent bank. It coordinates and/or executes the The impact of the hedging is in gains/losses on financial necessary activities for managing interest rates, exposure to transactions, and the hedging of results compensates, in the exchange-rate movements and measures to obtain the required opposite way, the greater or lesser value in euros from the levels of liquidity in the Group. On the other, it acts as the contribution of businesses. Group’s holding, managing global capital as well as that of each of the units. Management of structural liquidity aims to finance the Group’s recurrent activity in optimum conditions of maturity and cost. As regards interest rate management, this activity is conducted The decisions regarding whether to go to the wholesale markets on a coordinated basis by all the units, but this business only to capture funds and cover stable and permanent liquidity registers the part relative to the balance sheet of the parent needs, the type of instrument used, the structure by maturity bank, via the ALCO portfolios (at the volume levels and duration dates, as well as management of the associated risks of interest considered optimum at each moment). rates and exchange rates of the various financing sources, are also conducted on a centralised basis. These portfolios, which normally take the form of sovereign bonds of European countries, aim to mitigate the impact of interest rate The overriding objective of this activity is to maintain an movements on the balance sheet of retail banking, structurally appropriate liquidity profile by diversifying the sources of sensitive by maturities to these movements and managing to financing and controlling short-term financing (diversity in maintain recurrent results reflected as net interest income. maturities, currencies and markets) and medium-and long- term. In order to achieve these goals, and in so far as market interest rate movements are envisaged, the Group’s financial Logically, the objectives that the Group as such wants to cover management area can decide to immunise the net interest may or may not coincide with the financing provided to the income of these portfolios from possible adverse movements in units and which is based more on their individual needs. The results by hedging interest rates. mismatch in maturities, currencies or instruments is a corporate decision and is reflected in this unit in a centralised way. Management of the exposure to exchange-rate movements, both from investments in the shareholders’ equity of units in The financial cost of the various financing sources recorded in currencies other than the euro, as well as that regarding the the books of the parent bank (although part of them reflects the results generated for the Group by each of the units, also in Group’s needs as such) are registered in Corporate Activities and various currencies, is also conducted on a centralised basis. can be issues of commercial paper, senior debt, covered bonds, subordinated debt, preference shares and securitisation of This management (dynamic) is carried out by exchange-rate assets. derivative instruments, optimising at each moment the financial cost of hedging. The Financial Management unit usually covers in new issues the interest rate and exchange rate risks from the start of the In this sense, hedging of net investments in the shareholders’ operation. It uses financial derivatives for this. The net impact of equity of businesses abroad aims to neutralise the impact on this hedging is recorded in the gains/loss on financial them of converting to euros the balances of the main transactions in Corporate Activities. consolidated entities whose functional currency is not the euro. 134 ANNUAL REPORT 2011
  • 137.
    The Financial Managementarea also analyses the strategies for This higher cost also impacted on financing the goodwill of structural management of credit risk where the aim is to reduce the Group’s investments, which by definition have a negative concentrations by sectors, which naturally occur as a result of nature, and which increased the cost of their financing commercial activity. Derivative operations here achieve an effect proportionately. similar to that of the sale of assets and their compensation through the acquisition of other assets enables us to diversify The net interest income of the ALCO portfolios registered here the credit portfolio as a whole. was higher in 2011, while maintaining a similar volume of portfolios than in 2010 thanks to the greater return on them. Lastly, and separately from the financial management described here, Corporate Activities acts as the Group’s holding. It manages • Gains on financial transaction, which are mainly those from all capital and reserves and allocations of capital to each of the the centralised management of interest rate and currency units as well as providing the liquidity that some of the business risk of the parent bank and, to a lesser extent, from equities, units might need (mainly the Santander Branch Network and were EUR 605 million positive compared to losses of EUR corporate in Spain). The price at which these operations are 142 million in 2010. The difference was mainly due to carried out is the market rate (euribor or swap) for each of the hedging. maturities of repricing operations, increased by a liquidity In 2011, the impact of hedging the results of subsidiaries was premium that varies on the basis of the duration of operations. positive (offsetting the lower value in euros of the results of Finally, and more marginally, the equity stakes that the Group the business units) and more than EUR 500 million above takes within its policy of optimising investments is reflected in 2010. Corporate Activities. In 2010, there were higher losses from the hedging of the In 2011 the area made a loss of EUR 3,833 million compared to results of subsidiaries and writedowns of financial a loss of EUR 2,291 million in 2010. investments in the portfolio of equity stakes, both of which were partly offset by positive returns from the hedging of This was mainly due to the following: interest rates. Grupo Santander decided to realise extraordinary provisions net • Operating costs were almost flat (+2%). The growth in of taxes of EUR 3,183 million, of which EUR 1,513 million were general costs from the increase in rents was offset by lower drawn from capital gains and EUR 1,670 million from the fourth amortisations. quarter profits. • Net loan-loss provisions include a release of EUR 37 million The bank charged EUR 1,812 million pre-tax provisions against compared to an allowance of EUR 111 million in 2010 to the fourth quarter earnings to cover real estate exposure in strengthen the balance sheet. Spain and EUR 601 million in pre-tax provisions to amortise goodwill related to Santander Totta. Other small movements were recorded in this item from normal allocations and releases from portfolios that configure Moreover, net capital gains of EUR 1,513 million generated in the ALCO strategies, and from others that constitute positions 2011 (EUR 872 million arising from the entry of new partners in of centralised management. the capital of Consumer Finance USA and EUR 641 million from the sale of the insurance holding in Latin America) were • Other income, which includes various provisions and assigned to the portfolios provisions for EUR 620 million and to provisions, was EUR 429 million negative compared to EUR the amortisation of intangibles, pensions and other 428 million negative in 2010. contingencies (EUR 893 million). This item includes provisions derived from the management Second, and after eliminating the effects already commented and sale of foreclosed properties. These were higher in 2011 on, the losses from the area’s ordinary activity were EUR 128 because of more entries than in 2010. Other types of million less than in 2010. provisions are included such as derivatives of goodwill and losses in the value of equity stakes. The main developments were: • Lastly, the tax line reflects a lower rate arising from the • Net interest income was EUR 2,172 million negative recovery of losses as a result of the different impact that compared to EUR 1,828 million also negative in 2010. The certain one-off items had in both years. increase was largely due to the greater cost of wholesale funding. The reasons for this were concentrated in the higher level of market reference interest rates and the rise in the credit spreads of issues, as well as the cost of maintaining in the balance sheet a prudent liquidity position. ANNUAL REPORT 2011 135
  • 138.
    2. Secondary segmentsor by business Attributable profit was EUR 6,893 million, 9.1% less than 2010 Retail Banking and affected by the provision of EUR 620 million in the second quarter for customer remediation in the UK. Net interest income grew 6.3% and net fee income 10.8%. Results were also slightly impacted by the perimeter effect (mainly the incorporation of Poland’s Bank Zachodni WBK). The Costs rose 9.9% because of new projects and an impact was three/four percentage points positive on revenues increase in installed capacity. and costs. The evolution of exchange rates during the period had a negative impact of one/two points. Risk management reflected in lower specific provisions, offset by the reduced availability of Gross income increased 6.0% to EUR 39,892 million, due to the generic provisions. 6.3% rise in net interest income, the main component, and strongly backed by fee income (+10.8%). Profit hit by the PPI remediation in the UK in the second quarter to cover possible customer Operating expenses rose 9.9% (+6.8% without the perimeter remediation. and exchange rate effects). As a result, the efficiency ratio was 42.8% and net operating income was 3.3% higher at EUR Net operating income Attributable profit 22,817 million. Million euros Million euros Net loan-loss provisions were only 3.1% higher, reflecting the + 3.3% 2011-2010 -9.1% 2011-2010 efforts made in previous years to improve risk management in the Group’s units which led to lower specific provisions. This, together with the one-off impact of the provision made in 2010 in Spain because of the change in rules, offset the lower release 22,817 7,579 of generic provisions. Net operating income after provisions 22,088 6,893 increased 3.5% Both lending and customer deposits increased a little (+2% and +4%, respectively). 2010 2011 2010 2011 Income statement and business volumes secondary segments Million euros Operating Retail Global Asset Management business areas Banking Wholesale Banking and Insurance 2011 Var (%) 2011 Var (%) 2011 Var (%) 2011 Var (%) Income statement Net interest income 32,993 6.3 30,273 6.3 2,458 5.2 263 13.2 Net fees 10,487 7.3 8,933 10.8 1,174 (8.8) 380 (10.5) Gains (losses) on financial transactions 1,895 (31.0) 1,106 (17.3) 785 (42.3) 4 (91.3) Other operating income (1) 278 (2.6) (420) 64.0 258 55.0 440 17.3 Gross income 45,655 4.1 39,892 6.0 4,675 (9.2) 1,088 0.6 Operating expenses (19,052) 9.7 (17,076) 9.9 (1,643) 10.1 (333) (2.8) General administrative expenses (17,048) 9.5 (15,243) 9.5 (1,507) 11.9 (298) 0.8 Personnel (10,041) 10.8 (8,874) 10.8 (998) 11.6 (169) 5.1 Other general administrative expenses (7,007) 7.7 (6,369) 7.6 (509) 12.5 (129) (4.3) Depreciation and amortisation (2,004) 10.9 (1,832) 13.5 (136) (6.5) (35) (25.5) Net operating income 26,603 0.4 22,817 3.3 3,032 (17.1) 754 2.2 Net loan-loss provisions (10,599) 4.5 (10,459) 3.1 (141) — 0 — Other income (2,565) 129.9 (2,476) 127.6 (32) 192.1 (57) 230.8 Profit before taxes 13,439 (11.7) 9,882 (9.0) 2,859 (21.5) 698 (3.3) Tax on profit (3,376) (10.9) (2,382) (9.0) (766) (21.2) (227) 13.2 Profit from continuing operations 10,064 (12.0) 7,500 (9.0) 2,093 (21.7) 471 (9.6) Net profit from discontinued operations (24) 77.7 (24) 77.7 — — — — Consolidated profit 10,039 (12.1) 7,475 (9.1) 2,093 (21.7) 471 (9.6) Minority interests 855 (9.6) 583 (9.8) 221 (8.2) 52 (13.0) Attributable profit to the Group 9,184 (12.3) 6,893 (9.1) 1,872 (23.0) 419 (9.2) Business volumes Total assets 1,191,780 1.3 888,242 3.3 277,723 (2.2) 25,814 (21.9) Customer loans 747,297 3.6 665,875 2.4 81,000 14.8 421 (8.2) Customer deposits 612,861 1.8 532,029 3.6 75,134 (11.2) 5,699 39.0 (1).- Including dividends, income from equity-accounted method and other operating income/expenses 136 ANNUAL REPORT 2011
  • 139.
    Retail Banking. Incomestatement Million euros Gross Net operating Attributable income income profit to the Group 2011 Var (%) 2011 Var (%) 2011 Var (%) Continental Europe 13,531 7.9 7,772 4.3 2,302 (3.0) o/w: Spain 7,143 (2.3) 3,745 (3.0) 737 (36.3) Portugal 785 (20.8) 292 (40.4) 95 (72.5) United Kingdom 5,118 (8.6) 2,812 (13.9) 889 (43.2) Latin America 19,134 9.8 11,087 8.3 3,209 (0.9) o/w: Brazil 13,660 11.9 8,147 11.5 1,588 (12.1) Mexico 2,023 7.0 1,145 5.3 762 64.3 Chile 1,758 2.3 1,032 (3.2) 438 (14.5) Sovereign 2,109 2.2 1,145 0.5 493 21.2 Total Retail Banking 39,892 6.0 22,817 3.3 6,893 (9.1) Retail banking in continental Europe, despite the recovery in All the stock markets in the countries where we operate fell in revenues and the positive impact of incorporations to the 2011 (double-digit falls, close to and even higher than 20% in Group, was conditioned by the higher amount assigned to some markets except for the US). provisions and writedowns (from the fall in the amount released from generic provisions). Attributable profit declined 3.0%. Despite this difficult environment, the total volume of managed assets rose, the fruit of commercial efforts. Of note was the Retail banking in the UK was 42.5% lower in sterling as it was capturing of new business by the Latin American units, hit by the PPI charge. Excluding this impact, attributable profit especially Brazil. Business grew in Italy because of own activity was almost the same as in 2010. Gross income declined, as well as the acquisition of Banca Privada MeliorBanca. affected by regulatory changes, but this was offset by flat costs and reduced needs for provisions. The volume of managed customer funds was EUR 101,000 million at the end of 2011 (+4%). Retail banking revenues in Latin America continued to grow and also costs, compatible with business development. Net Profit before tax was 2.0% higher (+4.7% excluding exchange operating income was 9.2% higher, excluding the exchange rate rate impact) at EUR 370 million, due to the rise in net interest impact. income (+9.2%) and reduced needs for provisions and writedowns, which offset the lower gains on financial Attributable profit, after loan-loss provisions and writedowns, transactions and higher operating expenses (+9.1%). was 0.8% higher than in 2010 in constant currency. The higher tax charge absorbed almost four points of growth in Global Private Banking includes institutions that specialise in attributable profit which at EUR 279 million was 1.5% lower financial advice and asset management for high-income clients than in 2010 (+1.4% excluding the exchange rate impact). (Banco Banif in Spain and Santander Private Banking in the UK, Latin America and Italy), as well as the units of domestic private In Europe, the profit generated by Banco Banif grew notably banking in Portugal and Latin America, jointly managed with and dropped in the UK and Portugal. Of note in Latin America local retail banks. was the strong growth in Brazil and the higher contribution of Chile. International Private Banking’s contribution was lower, The division continued to install and adapt its common business due to higher taxes. model, the commercial processes of advice, differentiated management of customers, personnel training, standardisation Banco Banif in Spain and the private banking unit in Latin of investment strategies and discretional management and America were chosen by the magazine Euromoney as the best unification of products. private banks in Spain and Latin America. IT platforms for management of clients continued to be adapted so that they will be the same for all units. This platform is currently operating in Spain, Italy and Mexico, and is being installed in Brazil. ANNUAL REPORT 2011 137
  • 140.
    The division alsocontinued to invest in resources to strengthen Global Banking & Market its operational capacities and distribution of basic treasury products, with a special focus on forex and fixed-income businesses. The generation of recurring revenues and strict Businesses and results were affected by the management of the cost base is enabling Santander Global economic weakness and tensions in markets, Banking to absorb these investments and improve its efficiency particularly in Europe. ratio to 35.1%, among the best of its peers. Attributable profit was 23.0% lower. Meanwhile, and with a medium-term view in response to the market’s new conditions and the new regulatory framework, Customer revenues accounted for 87% of total Santander Global Banking & Markets took the first steps to revenues. develop its business model in order to raise its market share in products that consume little capital and liquidity. Impact on costs of the investment effort, although This meant further efforts to improve the area’s transactional the efficiency ratio remained very good. capacity in a process that will last several years and which, already in 2011, showed signs of its potential: revenues Rigorous management of risk, liquidity and capital. generated by transactional activities continued to increase compared to the decline in wholesale activities. The same idea is behind the measures taken in Poland and in the north east of the United States to accompany the Group in Santander Global Banking & Markets posted an attributable its international development. The objective is to exploit the profit of EUR 1,872 million, 23.0% lower than in 2010. revenue synergies and management of clients’ current and potential commercial flows in the two countries where the Markets were very unstable, beginning in the spring and Group has strong business units. intensified in the second half of the year due to the euro zone’s sovereign debt crisis. This environment had a significant impact Results and activity on revenues, particularly those derived from equities and those Profits declined because of the fall in gross income from the not related to customers, whose falls explain the larger sharp reduction in gains on financial transactions and in fee reduction in profits. income, coupled with higher costs and provisions. This area contributed 10% of gross income and 20% of Gross income declined 9.2%, following the 42.3% drop in attributable profit of the operating areas. trading gains and after three quarters at their lowest levels since 2007. Basic revenues were virtually unchanged, with net interest Strategy income up 5.2% due to adjustments to spreads and larger Santander Global Banking & Markets continued to maintain the volumes, while fee income was 8.8% lower due to reduced key drivers of its business model: centred on clients, the activity in the markets. division’s global scope and inter connection with local units. Costs (+10.1%) reflected the investment in equipment and At the strategic level, and in a very complex year, the division technology. Net operating income was 17.1% lower at EUR focused on maintaining the results of its franchise and on 3,032 million. Provisions were higher, partly because of the reducing exposure to risk (for example, cutting the risk of lower release of generic provisions, as specific ones declined trading activity), which helped to improve the Group’s capital significantly. As a result, attributable profit fell 23.0%. and liquidity positions, particularly in those countries with the greatest tensions. The results were supported by strong and diversified client revenues, accounting for 87% of total gross income and showing greater stability, although somewhat shaken in the last two quarters of very high stress. Net operating income Attributable profit Million euros Million euros Client revenues were 8.1% lower than in 2010, when they were particularly high because of certain operations and the positive -17.1% 2011-2010 -23.0% 2011-2010 impact on the books of high volatility in some markets. All countries client revenues fell except Sovereign in the US, which almost doubled them, within a sustained trend to reach 3,658 its natural share in corporate business. Among the big areas, 3,032 2,432 Latin America only dropped 4%, affected by Mexico (-14%) as 1,872 Brazil and Chile were more stable. Greater weakness in Europe, particularly Spain (-17%) and the UK (-18%), hit by tensions and falls in markets in the last few months. 2010 2011 2010 2011 The revenues generated by clients in the Global Relation Model, which give the area great stability, were stronger. They were only 4% lower and already account for 70% of total client revenues. The performance of the business areas was as follows: 138 ANNUAL REPORT 2011
  • 141.
    Global Transaction Banking Credit Markets This area, which includes Cash Management, Trade Finance, Credit Markets, which include origination and distribution of Basic Financing and Custody, increased its client revenues 4%. corporate loans or structured finance, bond origination and securitisation teams and asset and capital structuring, reduced Cash Management revenues grew 18%, with rises in all client revenues by 3%. The growth in Latin America, strongly countries. Of note were the four large units in Spain, Brazil, backed by Mexico, and in the US was offset by the sharp decline Mexico and Chile, particularly the last two which grew higher in Europe, particularly in the UK after the exceptional operations than the average. in 2010. Custody and Settlement registered solid growth (+7%), backed In loans, Santander maintained its reference position in Europe by the positive contribution of Spain and strong rises in Mexico and Latin America. Of note was the participation in the $12,500 and Chile. million loan for Sab Miller to finance the takeover of the Australian beer company Fosters. Santander was the book Moderate growth in Basic Financing (+3%) in a context of runner and mandated lead arranger. Of note in Latin America greater disintermediation and containment of risk assets which was the loan for Grupo Suramericana to acquire ING’s assets in was offset by active management of spreads. the region. Trade Finance dropped 7% after the high levels reached in 2010 In project finance, Santander consolidated itself as one of the in Latin America, particularly in Brazil. Good evolution in Spain, world’s leading banks. Of note was its presence in the the UK and Sovereign. operations of Meerwind Offshore Wind Project (a 400 MW Corporate Finance wind farm in the German North Sea) and participation in the In a sluggish market, this area (mergers and acquisitions) largest high speed train concession in France (Tours-Bordeaux) reduced its client revenues 29%, but this did not hinder notable amounting to EUR 7,800 million. In Latin America, Santander participation in important transactions. capitalised on its experience in financing renewable energy and infrastructure and structured projects in Brazil, Mexico and Of note was the advice provided for several of the most Chile. significant operations in the Group’s reference markets, including the acquisition by a consortium led by Iberdrola of In bonds, the area continued to consolidate business. In electricity and gas distributors from AEI Energy (Ashmore Energy Europe, Santander maintained an important presence in capital International) in seven Latin American countries; the integration markets throughout the year, despite the sharp fall in the of Vivo and Telesp in Brazil; the entry of Qatar Holding into volume issued in the second half. Latin America fared better. Iberdrola and the purchase by the French Schneider of Telvent, Of note was the role in the $6,000 million bond issue of listed on Nasdaq. Petrobras, the largest issue ever in Latin America, and the placement of bonds for the Republic of Brazil, with the lowest Participation in these operations enabled Santander to maintain yield in history and the lowest spread against US Treasuries. leading positions in the advisory rankings (according to Also noteworthy was the second project bond of a Brazilian Bloomberg and Thomson): second in Spain and Portugal and company, and the second loan structured by Santander ($700 fourth in Latin America by volumes brokered ($19,947 million million) for Queiroz Galvão. and $15,559 million, respectively). Asset and Capital Structuring continued to increase its portfolio of clients in Europe, Latin America and the US, which Gross income breakdown produced strong growth in revenues and a positive Million euros contribution from all countries. Of note were the structured lease operations in Europe for Veolia (electric trains) and Total 5,150 -9% 4,675 Hochtief (ship to install wind turbines offshore) and the Proprietary trading & structuring and sale of a solar plant to Munich Re in Latin portfolios -16% 619 America. A significant structured leasing operation was Equity -44% 356 completed with TAM Linhas Aéreas and two renewable energy operations were structured in Mexico for Grupo Renovalia and Rates -7% 1,293 Sowitec. Customers Credit -3% 769 -8% Corporate Finance -29% 56 Global Transaction Banking +4% 1,582 2010 2011 ANNUAL REPORT 2011 139
  • 142.
    Rates Equities This area, which restructured its businesses into three activities, The fall in revenues from Global Equities (those related to the (Fixed Income sales, Fixed Income Flow and FX) registered a 7% equity markets) was 44% in 2011. This was due to the weak fall in its client revenues. Improved sales were offset by the generation in the second half of the year as against high weakness of the sovereign debt markets and its impact on revenues in 2010. management of books. In addition, the lower volumes and high levels of volatility in the Fixed Income sales (sale and distribution of derivatives) increased markets in the second half reduced the revenues from equities its revenue 6%, backed by the UK and Brazil. Of note by client brokerage, derivatives and structure products revenues, as well type was the good performance of corporates (+21%). The retail as the contribution to the income statement from management segment repeated the results of 2010 while the focus on the of books. institutional segment produced 9% growth. The uncertainty over the economic recovery hit the primary Revenues from Fixed Income Flow activity (distribution of market hard, delaying some key operations in Europe and Latin corporate and government bonds, interest rate, credit and America. inflation derivatives) was sharply down (-23%) due to the impact on the markets of the European Union’s sovereign debt crisis Lastly, there was a noteworthy increase in Santander’s activity in which countered the solid rise in sales. exchange traded derivative markets as access provider to main markets worldwide, boosting revenues. Lastly, FX (trading activities and hedging of exchange rates and short-term money markets for the Group’s wholesale and retail clients) maintained sustained growth (+9%) firmly backed by the UK and Latin America, particularly Brazil. Good contribution from all client segments (retail, corporate and institutional), as well as a solid performance from activity in the short-term money markets in Europe, in an environment of high volatility. Ranking in 2011 Activity Area Country / Region Source Award Best International Trade Bank GTB Brazil/Chile Trade Finance Magazine Award Best Overall Trade Bank GTB Latin America Trade Finance Magazine Award World's Best Sub-Custodian Banks GTB Spain Revista Global Finance Award M&A Latin American deal of the year: Amapola CIB Latin America Euromoney Award Germany: Meerwind. European Offshore Wind Deal of the Year CM Europe Euromoney Award Best Quasi-Sovereign Bond - Petrobras $6bn CM Latin America / Brazil Latin Finance Award Best Infrastructure Bank CM Latin America Latin Finance Award Best Foreign Exchange Provider RT Spain/Chile/Portugal/Uruguay Global Finance N1.* Mejor Banco en Derivados de Foreign Exchange RT Spain Risk,net N1.* Mejor Banco en Derivados de Tipos RT Spain Risk,net N1.* Equities Research en Iberia EQ Iberia Institutional Investors N1.** Equity Capital Markets en Iberia EQ Iberia Dealogic N2.** Equity Capital Markets de Latin America EQ Latin America Bloomberg (*).- Ranking depending on the criterion (**).- Ranking by volume GTB: Global Transaction Banking CIB: Corporate and Investment Banking CM: Credits and Markets RT: Rates EQ: Equity 140 ANNUAL REPORT 2011
  • 143.
    In Latin America,Santander signed a global agreement in July Asset Management and Insurance with the insurer Zurich to bolster business in the region. Under the agreement, which came into effect in the fourth quarter, Zurich has 51% of the holding company which groups Strong growth (+9%) in total revenues, (9.5% of Santander’s insurers in Argentina, Brazil, Chile, Mexico and the operating areas’ total). Uruguay, as well as a product distribution agreement in these countries. Mutual and pension funds: lower volumes partly offset by the better mix of products. Results Gross income flat at 0.6%, while net operating income rose Insurance: faster pace in revenues in Brazil and the 2.2% after the 2.8% fall in operating expenses. The other rest of Latin America and sustained recovery in negative results and a higher tax charge caused attributable Spain and in consumer business. profit to be 9.2% lower. These results include a negative impact of EUR 64 million in gross income and EUR 53 million in The strategic alliance with Zurich was completed net operating income from the global agreement with Zurich in and will boost the insurance offer in Latin America. the fourth quarter. Excluding this impact, gross income increased 6.6% and net operating income 9.2%. The area’s total revenues contributed to the Group including those recorded by the distribution networks amounted to EUR 4,334 million, 9.3% more than in 2010. The total contribution (profit before tax plus fees paid to the networks) was EUR Total revenues generated by asset management and insurance 3,944 million (+9.4%). rose 9.3% to EUR 4,334 million and accounted for 9.5% of the Group’s total revenues from its operating areas. Asset Management Attributable profit, after deducting distribution and The global area of Santander Asset Management posted an transformation costs, dropped 9.2% to EUR 419 million, largely attributable profit of EUR 53 million. The total contribution affected by lower revenues from insurance in the fourth quarter (profit before tax and fees paid to the networks was EUR after the global agreement with Zurich materialised. 1,062 million, 4.7% less than in 2010 and due to flat total revenues (-2.1%). Strategy Santander Asset Management advanced in developing a global The revenue reduction was the result of a fall in managed business model based on the Group’s management capacities volumes, accelerated in the second half, which was partly and the market knowledge of local fund managers. The push offset by a better mix of products and, in consequence, in given to the multimanager team to manage funds of funds, as average revenues. well as the creation of global teams to manage Latin American and European mandates, underlined the progress. Total mutual and pension funds under management amounted to EUR 112,000 million, 10% less than in December 2010. The Santander Insurance also continued to build its global business preference for liquidity and on-balance sheet funds, together model by launching units and businesses to respond to the with more unstable markets in the second half of the year and needs of local networks and customers, while preserving a low the impact on prices, explain the fall in volumes. risk profile model and one very efficient in its operations. The main developments by units and countries were as follows: • In traditional management of assets, mutual fund Net operating income Attributable profit business remained resilient in a very demanding environment. Million euros Million euros In this segment, the Group manages EUR 110,000 million in + 2.2% 2011-2010 -9.2% 2011-2010 funds, investment companies and pension plans (-8%), of which 90% comes from four large markets (Brazil, the UK, Spain and Mexico). 754 Business in Brazil, the main market for the Group by volume 739 (EUR 39,400 million), slowed down in the fourth quarter and 462 ended the year 2% lower in local currency. In this market, 419 where there is pressure for liquidity in certain segments and good capturing of funds that enable the treasury surpluses of companies to be maximised, Santander has a share of around 14%. This is above its natural share in the retail segment, the 2010 2011 2010 2011 most profitable one. ANNUAL REPORT 2011 141
  • 144.
    The UK continuedto increase its retail balances under • In non-traditional management (real estate, alternative management (+6% in sterling to EUR 15,700 million), backed management and private equity funds), Santander Asset by growth in multimanager funds of funds. Our fund Management continued to adjust its activity to the scant management entity achieved the largest net capturing in this demand for these products. type of product according to the Fundscape Pridham Report. In the first quarter, Grupo Santander decided, for solely This performance was recognised by the market. The commercial reasons, to provide funds to Santander Banif multimanager team in the UK received the award for Best Inmobiliario, by subscribing to new units and granting a two- Manager of the Year by Investment Week in the category of year liquidity guarantee in order to meet any outstanding funds of funds. redemption claims. This measure ended the suspension of reimbursements and returned the fund to normal. In Spain, large net reimbursements continued throughout the sector, reflecting the preference of banks for liquidity. In this Greater stability in alternative funds after the restructuring in environment, Santander Asset Management focused previous years, and in the private equity segment, which is successfully on mixed and guaranteed funds. Of note was the aimed at institutional clients who invest long term in unlisted more than EUR 1,000 million captured by the range of Select companies. funds. Also notable was the awarding to Santander of the first institutional mandate for private fixed income securities outside of Spain (Germany). Total Group revenues All of this helped to consolidate the Group as the market Million euros leader in mutual funds (16.6% market share, according to Inverco), and maintain assets under traditional management in Spain, including pension plans, at EUR 34,000 million (-13%). +9% 4,334 Total 3,966 Mexico benefited from the launch of new mixed and guaranteed funds and increased its volume 3% in pesos to EUR 9,400 million and improved the mix of products. Insurance 3,083 +15% In the rest of markets, Chile’s volume dropped 10% in pesos, because of the push into deposits. In Portugal, the shift into deposits and the impact of markets accelerated the fall in Asset Management -2% 1,251 mutual and pension funds (-42%). 2010 2011 142 ANNUAL REPORT 2011
  • 145.
    Insurance Insurance (breakdown PBT + Fees) % The global area of Santander Insurance posted an attributable profit of EUR 366 million, 3.8% more than in 2010. This result was affected by the sale of 51% of the insurance companies in Latin America completed in the fourth quarter as, without it, Other Latin America Spain 14% 16% growth would have been 4.0%. Insurance business generated for the Group total revenues (including fee income paid to the commercial networks) of EUR Germany 13% 3,083 million (+14.7%). The total contribution to profits (income before taxes of insurers and brokers plus fee income received by the networks) increased 15.7% to EUR 2,882 million, and 17.9% higher excluding the impact of the sale of Other the insurance companies. Brazil 37% Europe 12% The total volume of premium income increased 9% due to the United Kingdom 7% good evolution of protection insurance premiums (+13%) as Sovereign 1% well as the recovery in the distribution of savings insurance whose premium income rose 7% after falling in 2010. Continental Europe‘s contribution increased 7%, backed by the solid performance of Santander Consumer Finance and the Latin America increased its contribution 26%, excluding the recovery in Spain. exchange rate impact (+31% without the impact of the sale of the insurance companies). This clearly reflected the region’s Excluding consumer business, Spain increased its contribution high potential. The greater efficiency in selling via banking by 8% due basically to the relaunch of savings-investment networks and other channels, together with the development products and the competitiveness of protection products. of simple products independent of loans, pushed up the Portugal’s contribution continued to decline (-19%) because of region’s activity and results. the greater pressure from deposits, while the contribution of Poland (BZ WBK) is still small. Of note was Brazil, which contributed more than two-thirds of the region’s total (+28%), and Mexico (+46%), while Chile only Santander Consumer Finance maintained its strong pace of grew 2%. On a like-for-like basis, Brazil’s growth would have selling, adjusted to each market, which enabled it to increase been 33%, Mexico 49% and Chile 5%, all in local currency. its total contribution by 11%. The acceleration of the German market and the contribution of new entities offset the decline Sovereign, still installing its insurance model, continued to in some peripheral markets. increase its total contribution (+15% in dollars). The UK’s total contribution rose 4% in sterling. The quarterly evolution was better. Asset Management and Insurance. Income statement Million euros Gross Net operating Attributable income income profit to the Group 2011 Var (%) 2011 Var (%) 2011 Var (%) Mutual funds 266 (0.3) 111 (1.9) 43 (38.9) Pension funds 23 (8.1) 15 (5.7) 10 (4.8) Insurance 799 1.1 629 3.1 366 (3.8) Total Asset Management and Insurance 1,088 0.6 754 2.2 419 (9.2) ANNUAL REPORT 2011 143
  • 146.
    Informe_Gestion Riesgos 2011_ENG_V17:esp28/02/12 11:17 Página 144 Risk management report
  • 147.
    Informe_Gestion Riesgos 2011_ENG_V17:esp28/02/12 11:17 Página 145 14 Executive summary 148 Corporate principles of risk management 152 Corporate governance of the risks function 154 Integral control of risk 15 Credit risk 166 Credit exposure in Spain 178 Market risk 188 Management of financing and liquidity risk 1 3 Operational risk 1 Reputational risk 1 8 Adjustment to the new regulatory framework 200 Economic capital 203 Risk training activities
  • 148.
    Informe_Gestion Riesgos 2011_ENG_V17:esp28/02/12 11:17 Página 146 Executive summary Banco Santander’s risk management principles pages 148 to 151 Independence of the risk function. Involvement of senior management in decision-taking. Collegiate decisions that ensure the contrast of opinions. Clear definition of attributions. Control and management of risk integrated via a corporate structure with all risk, all businesses and all countries scope. Credit risk pages 156 to 177 Credit to clients (gross) % of operating areas 225 Total Spain (Billion euros) Chile Rest of Latin America 12 Public administrations Mexico 3% 3% 2% Sovereign 5% Brazil 11% 59 Residential mortgages 26 Other loans to individuals Spain 29% 105 Companies excluding real estate purpose United Kingdom 34% 23.4 With real estate purpose Portugal 4% 32.0 Germany 4% 8.6 Foreclosed properties Rest of Europe 4% Commercial Poland 1% Exposure to real estate sector in Spain pages 168 to 170 It accounts for 4% of the Group's gross loans plus foreclosed properties in Spain. Exposure to the construction sector and Impact on Grupo Santander of the financial real estate promotion Billion euros reform in Spain Million euros Total: 32.0 Amount of provisions Foreclosed properties 8.6 (27%) Additional provisions under new rules at 31.12.2011 6,100 Against results 2011 -1,800 Buffer covered with surplus of existing capital -2,000 Doubtful loans 6.7 (21%) Provisions pending = 2,300 Financing of new provisions in 2012 2,300 Charged to capital gains from the sale of Santander Colombia 900 Charged to other capital gains and ordinary 1,400 Normal portfolio 12.8 (40%) Sub standard 3.9 (12%) allowances 2012 146 ANNUAL REPORT 2011
  • 149.
    Informe_Gestion Riesgos 2011_ENG_V17:esp28/02/12 11:17 Página 147 Economic capital pages 200 to 202 Analysis of the global risk profile • The Group’s economic capital at the end of 2011 By type of risk was EUR 45,838 million. • By business units, continental Europe accounts for 39%, Latin America 34%, the UK 10%, Credit 64% Sovereign 6% and financial management and equity stakes 11%. • The Group’s diversification generates economic capital savings. Non-trading equity 4% Material assets 2% FX structural 5% Business 7% Trading 1% ALM 8% Operational 9% Management of funding and liquidity risk pages 188 to 192 • Santander’s subsidiaries are autonomous and self- Monitoring metrics sufficient in capital and liquidity and are subject to coordination and the Group’s corporate policies. Metrics 2011 2010 2009 • The portfolio of loans (77% of net assets) is wholly Loans/Net assets 77% 75% 79% financed by customer deposits and medium- and long- Customer deposits, insurance 113% 115% 106% term funding. and medium and long-term • In 2011, EUR 40,000 million of debt was issued, funding/Lending covering 124% of the year’s maturities and Customer deposits, insurance and 114% 117% 110% amortisations. medium and long-term financing, shareholders’ funds and other liabilities/ • Santander has a total discounting capacity in central Loans+fixed assets banks of around EUR 100,000 million. Short-term funding/Net liabilities 2% 3% 5% Loan-to-deposit ratio 117% 117% 135% VaR evolution in 2011 Market risk Million euros. VaR at 99%. Time frame of one day pages 178 to 192 34 Max. (33.2) • Santander maintains a moderate exposure to 30 market risk. 26 • Despite high volatility in financial markets, the average exposure in trading activity was lower 22 than in 2010. 18 • In 2011, the Group continued to reduce, from an already low level, its exposure related to complex 14 structured assets. 10 Min. (12.0) 03 Jan. 22 Jan. 10 Feb. 20 Mar. 08 Apr. 27 Apr. 16 May. 04 Jun. 23 Jun. 12 Jul. 31 Jul. 19 Aug. 07 Sep. 26 Sep. 15 Oct. 03 Nov. 22 Nov. 11 Dec. 30 Dec. ANNUAL REPORT 2011 147
  • 150.
    Informe_Gestion Riesgos 2011_ENG_V17:esp28/02/12 11:17 Página 148 Corporate principles of risk management, control and appetite The importance of Grupo Santander’s risk policy was Management and control of risk is developed in the following underscored again in 2011. The policy is focused on maintaining way: a medium-low and predictive profile in all risks, which, together • Formulate the risk appetite. The purpose is to delimit, with the Group’s high degree of diversification, was again the synthetically and explicitly, the levels and types of risk that the differential element that enabled Santander to maintain a bank is ready to assume in the development of its business. leading position in the market. • Establish risk policies and procedures. They constitute the For Grupo Santander, quality management of risk is one of its basic framework for regulating risk activities and processes. At hallmarks and thus a priority in its activity. Throughout its 150 the local level, the risk units incorporate the corporate rules to years, Santander has combined prudence in risk management their internal policies. with use of advanced risk management techniques, which have proven to be decisive in generating recurrent and balanced • Building, independent validation and approval of the risk earnings and creating shareholder value. models developed in accordance with the corporate methodological guidelines. These models systemise the risk The risks model is based on the following principles: origination processes as well as their monitoring and recovery • Independent working from the business areas. Mr. Matías processes, calculate the expected loss, the capital needed and Rodríguez Inciarte, the Group’s third vice-chairman and evaluate the products in the trading portfolio. chairman of the board’s risk committee, reports directly to the • Execute a system to monitor and control risks, which verifies executive committee and to the board. The establishment of every day and with the corresponding reports the extent to separate functions between the business areas (risk takers) which Santander’s risks profile is in line with the risk policies and the risk areas responsible for measurement, analysis, approved and the limits established. control and information provides sufficient independence and autonomy to control risks appropriately. Santander’s risk management is fully identified with the Basel • Involvement of senior management in all decisions taken. principles as it recognises and supports the industry’s most advanced practices which the Group has been anticipating and, • Collegiate decision-making (including at the branch level), as a result, it has been using for many years various tools and which ensures a variety of opinions and does not make results techniques which will be referred to later in this section. They dependent on decisions solely taken by individuals. Joint include: responsibility for decisions on credit operations between risk and business areas, with the former having the last word in • Internal rating and scoring models which, by assessing the the event of disagreement. various qualitative and quantitative components by client and operation, enable the probability of failure to be estimated • Defining functions. Each risk taker unit and, where first and then, on the basis of estimates of loss given default, appropriate, risk manager has clearly defined the types of the expected loss. activities, segments, risks in which they could incur and decisions they might make in the sphere of risks, in • Economic capital, as the homogeneous metric of the risk accordance with delegated powers. How risk is contracted, assumed and the basis for measuring management, using managed and where operations are recorded is also defined. RORAC, for pricing operations (bottom up), and for analysis of portfolios and units (top down), and VaR, as the element of • Centralised control. Risk control and management is control and setting the market risk limits of the various trading conducted on an integrated basis through a corporate portfolios. structure, with global scope responsibilities (all risk, all businesses, all countries). • Analysis of scenarios and stress tests to complement the analysis of market and credit risk, in order to assess the impact of alternative scenarios, including on provisions and on the capital. 148 ANNUAL REPORT 2011
  • 151.
    Informe_Gestion Riesgos 2011_ENG_V17:esp28/02/12 11:17 Página 149 Grupo Santander calculates the minimum regulatory capital in Risk appetite framework accordance with Bank of Spain circular 3/2008 and subsequent Santander’s risk appetite framework has quantitative as well as changes on determining and controlling the minimum equity of qualitative elements that are integrated into a series of basic credit institutions. This regulation completed the transfer to metrics (applicable to both the whole of the Group as well as its Spanish banking legislation of various EU directives. main business units) and another series of transversal metrics which because of their nature are directly applied for the whole As a result of the new elements introduced into the regulatory of the Group’s units. framework, commonly known as BIS III, Grupo Santander took steps to apply with sufficient prevision the future requirements Qualitative elements of the risk appetite: indicated in BIS III. This entails a greater requirement for high The qualitative elements of the risk appetite framework define, quality capital, sufficiency of capital conservation and counter both generally and for the main risk factors, the positioning that cyclical. Santander’s senior management wises to adopt or maintain in the development of its business model. Generally, Grupo Santander’s risk appetite framework is based on maintaining the following qualitative objectives: Grupo Santander’s risk appetite • A general medium-low and predictable risk profile based on a The risk appetite is defined in Santander as the amount and type diversified business model, focused on retail banking and with of risks considered reasonable to assume for implementing its an internationally diversified presence and with significant business strategy, so that the Group can maintain its ordinary market shares. Develop a wholesale banking model which activity in the event of unexpected events that could have a attaches importance to the relationship with clients in the negative impact on its level of capital, levels of profitability Group’s core markets. and/or its share price. • Maintain a rating in a range between AA- and A- on the basis The board is responsible for establishing the risk appetite and of the environment at both Group level as well as in the local monitoring the risk profile and ensuring the consistency units (in local scale), and the evolution of sovereign risk. between both of them. Senior management is responsible for • Maintain a stable and recurring policy of profit generation and achieving the desired risk profile as well managing risks on a shareholder remuneration on the foundations of a strong daily basis. The establishment of the risk appetite covers both capital base and liquidity and an efficient diversification the risks whose assumption constitutes the strategic objective strategy by sources and maturities. and for which maximum exposure criteria are set —minimum objectives of return/risk— as well as those whose assumption is • Maintain an organisational structure based on autonomous not desired but which cannot be avoided in an integral way. The and self-sufficient subsidiaries in terms of capital and liquidity, board will ensure that the amount and type of risks relevant for minimising the use of non-operational or investment the bank have been taken into account. These derive from the companies, and ensuring that no subsidiary has a risk profile annual budget approved as well as the medium-term strategic that could jeopardise the Group’s solvency. plan. It also ensures that sufficient resources have been assigned • Maintain an independent risk function and intense to manage and control these risks, at both the global and local involvement by senior management that guarantees a strong levels. risk culture centred on protecting and ensuring an adequate return on capital. The board will regularly revise, at least once a year, the Group’s risk appetite and its management framework, analysing the • Maintain a management model that ensure a global vision impact of unlikely but plausible tension scenarios and adopting and one inter-related with all risks, through an environment the pertinent measures to ensure the policies set are met. of control and robust corporate monitoring of risks, with global scope responsibilities: all risk, all businesses, all The risk appetite is formulated for the whole Group as well as countries. for each of its main business units. The boards of the subsidiaries must approve the respective risk appetite proposals • Focus the business model on those products which the Group adapted to the corporate framework. has sufficient knowledge of and the management capacity (systems, processes and resources). • The confidence of customers, shareholders, employees and professional counterparts, guaranteeing the development of their activity within its social and reputational commitment, in accordance with the Group’s strategic objectives. • Maintain adequate and sufficient availability of the necessary human resources, systems and tools that guarantee the continuation of a risk profile compatible with the risk appetite established, both at the global and local levels. • Implement a remuneration policy that contains the necessary incentives to ensure that the individual interests of employees and executives are aligned with the corporate framework of risk appetite and these are consistent with the evolution of the institution’s results over the long term. ANNUAL REPORT 2011 149
  • 152.
    Informe_Gestion Riesgos 2011_ENG_V17:esp28/02/12 11:17 Página 150 Quantitative elements of risk appetite Liquidity position The quantitative elements that comprise the risk appetite The Group’s liquidity management model is based on the framework are specified in the following basic metrics: following principles: • The maximum losses that the bank has to assume, • Decentralised liquidity model: autonomy of the subsidiaries within management coordinated at the Group level. • The minimum capital position that the bank wants to maintain, and • Comfortable structural liquidity position supported by stable • The minimum liquidity position that the bank wishes to have funding: mainly customer deposits (principally in the retail segment) and medium- and long-term wholesale funding in the event of unlikely but plausible tension scenarios. (with an objective of an average maturity of more than three The Group also has a series of transversal metrics to limit the years). excessive concentration of the Group’s risk profile, both by risk • Ample access to wholesale markets and diversification by factors as well as from the standpoint of customers, businesses, markets, instruments and maturities. countries and products. • High discounting capacity in central banks. The risk appetite framework distinguishes between: Bearing in mind the Group’s wish to be structured on the basis a) Risk capacity: the maximum level of risk that the Group can of autonomous subsidiaries, liquidity management is executed technically assume in the development of its business plans by each of our subsidiaries. All of them, thus, must be self- without compromising its commercial viability; sufficient as regards the availability of liquidity. b) Risk appetite: the level, type of risk and geographic distribution that the Group is ready to accept in order to Transversal metrics of risk appetite: attain the strategic objectives in its business plan; concentration Santander wants to maintain a well diversified risk portfolio from c) Objective risk: the level and type of risk the Group the standpoint of its exposure to large risks, certain markets and incorporates into its budgets. specific products. In the first instance, this is achieved by virtue of Risk tolerance is defined as the difference between risk Santander’s focus on retail banking business with a high degree appetite and objective risk. The risk appetite framework includes of international diversification. setting a series of triggers as the risk tolerance is consumed. Concentration risk: this is measured via three focuses, which Once these levels are reached and the board is informed the include limits set as signs of alert or control: necessary management measures are adopted so that the risk profile can be reconducted. • Customer: individual and aggregate exposure to the 20 largest clients as a proportion of shareholders’ funds. Losses One of the three basic metrics used to formulate Santander’s • Product: maximum exposure of clients to derivatives. risk appetite is expressed in terms of the maximum losses it is prepared to assume in the event of unfavourable • Sector: maximum percentage of exposure of the portfolio of scenarios —internal and external— whose probability of companies to an economic sector. occurrence is considered low but plausible. Specific objectives by type of risk We regularly conduct analysis of the impact, in terms of losses, In addition, Grupo Santander’s risk appetite framework includes of submitting the portfolios and other elements that make up specific objectives for the following types of risk: the bank’s risk profile to stress scenarios that take into account various degrees of the probability of occurring. Credit risk • Complete management of the credit risk cycle with a The time frame for materialisation of the negative impact for all corporate model based on establishing budgets, structure of risks considered will normally be 12 months, except for credit limits and management plans for them and on monitoring risk where an additional impact analysis is conducted with a and control integrated with global reach responsibilities. three year time frame. • Global and inter-related vision of the credit exposure, with Capital position portfolio vision, including, for example, lines committed, Santander wants to operate with a large capital base that guarantees, off-balance sheet, etc. enables it not only to comply with the regulatory requirements • Involvement of the risk function in all credit risk admissions, but also have a reasonable surplus of capital. Its core capital avoiding the taking of discretionary decisions at the personal target is 10%, which is one percentage point above the 9% level, combined with a strict structure of delegation of required by the European Banking Authority (EBA). powers. The capital target extends to a period of three years, within the • Systematic use of scoring and rating models. capital planning process implemented in the Group. • Centralised control and in real time of the counterparty risk. 150 ANNUAL REPORT 2011
  • 153.
    Informe_Gestion Riesgos 2011_ENG_V17:esp28/02/12 11:17 Página 151 Market risk Compliance and reputational risk • Moderate market risk appetite. • Compliance with all the regulatory requirements, ensuring qualifications and substantial recommendations are avoided • Business model focused on the customer with scant exposure in audits and supervisors’ reviews. to own account business activities. • Independent calculation of the results of market activities by • Maintain the confidence of customers, shareholders and the risk function. employees, as well as society in general, regarding solvency and reputation. • Daily centralised control of the market risk of trading activity (VaR). • Maintain a zero appetite in compliance and reputational risk through corporate policies, with local implementation, backed • Strict control ex ante of products, underlying assets, by risk indicators and the functioning of corporate and local currencies, etc, for which operations are authorised as well as committees that enable risk to be identified, monitored and of the corresponding valuation models. mitigated in matters of: Structural risks • – Prevention of money laundering: (Analysis and resolution • Conservative management of balance sheet and of liquidity Committee); risk on the basis of the what is stated in the previous sections. • Active management of exchange rates in relation to the • – Compliance (committee of compliance with regulations): hedging of capital and the results in subsidiaries. codes of conduct in the securities market; suspicious operations; abuse of market; institutional relations; Markets • Reduced sensitivity of margins and capital to changes in in Financial Instruments Directive (MiFid); customers’ interest rates in stress situations. complaints to supervisors; data protection regulations and • Limited assumption of credit risk in managing the Group’s code of conduct of employees; balance sheet. • – Commercialisation of products: reputational risk • Limited assumption of cross-border risk. management office and committees of approval, marketing and monitoring of products, observing operational, conduct Technology and operational risk and reputational risk criteria. • Supervision of technology and operational risk management through approval of the management framework and of the • Registry and monitoring of disciplinary procedures, total cost structure of the corresponding limits. by losses including fines and sanctions. • Management focus centred on risk mitigation, based on • Continuous monitoring of audits and revisions of the monitoring and controlling gross losses/gross income, self- supervisors and of their corresponding recommendations in assessment questionnaires/risk maps and management the sphere of compliance and reputational risk. indicators. Risk appetite and living will • Operational and technology integration model via corporate The Group has an organisational structure based on platforms and tools. autonomous and self-sufficient subsidiaries in terms of capital • Systems’ architecture with adequate redundancies and and liquidity, minimising the use of non-operating or investment controls in order to guarantee a minimum probability of companies, and ensuring that no subsidiary has a risk profile occurrence of high impact events and which, in their case, that could jeopardise the Group’s solvency. limit their severity. Grupo Santander was the first of the international financial • Business Continuity Master Plan with local developments; institutions considered globally systemic by the Financial Stability local plans of contingency coordinated with the corporate Board to present (in 2010) to its consolidated supervisor (the area of technology and operational risk. Bank of Spain) its corporate living will including, as required, a viability plan and all the information needed to plan a possible liquidation (resolution plan). Furthermore, and even though not required, in 2010 more summarised individual plans were drawn up for the main geographic units, including Brazil, Mexico, Chile, Portugal and the UK. The second version of the corporate living will was presented in 2011 and also the second version of the main summarised local and voluntary plans, and progress was made in drawing up the local obligatory plans for the Group’s entities which must be eventually presented. Also noteworthy was the significant contribution that the living will exercise made to the conceptual delimitation of the Group’s risk appetite and risk profile. ANNUAL REPORT 2011 151
  • 154.
    Informe_Gestion Riesgos 2011_ENG_V17:esp28/02/12 11:17 Página 152 1. Corporate governance of the risks function The risk committee is responsible for proposing to the board the The main responsibilities of the board’s risk committee are: Group’s risk policy, approval of which corresponds to the board • Propose to the board the risk policy for the Group, which under its powers of administration and supervision. The must, in particular, identify: committee also ensures that the Group’s activities are consistent with its risk tolerance level and establishes the global limits for • – The different types of risk (operational, technological, the main risk exposures, reviewing them systematically and financial, legal and reputational, among others) facing the resolving those operations that exceed the powers delegated in Group. bodies lower down the hierarchy. • – The information and internal control systems used to The committee is of an executive nature and takes decisions in control and manage these risks. the sphere of the powers delegated in it by the board. It is • – Set the level of risk considered acceptable. chaired by the third vice-chairman of Grupo Santander and four other board members are also members of the committee. • – The measures envisaged to mitigate the impact of identified risks, in the event that they materialise. The committee met 99 times during 2011, underscoring the • Systematically review exposures with the main customers, importance that Grupo Santander attaches to appropriate economic sectors, geographic areas and types of risk. management of its risks. • Authorise the management tools and risk models and be familiar with the results of the internal validation. • Ensure that the Group’s actions are consistent with the previously decided risk appetite level. • Know, assess and monitor the observations and recommendations periodically formulated by the supervisory authorities in the exercise of their function. • Resolve operations beyond the powers delegated to bodies lower down the hierarchy, as well as the global limits of pre- classification of economic groups or in relation to exposures by classes of risk. 152 ANNUAL REPORT 2011
  • 155.
    Informe_Gestion Riesgos 2011_ENG_V17:esp28/02/12 11:17 Página 153 The board’s risk committee delegates some of its powers in risk • – These functions have a global action sphere, i.e. they committees which are structured by geographic area, business intervene in all the units where the risk division acts and and types of risk, all of them defined in the corporate there is a reflection of the same structure in the local units. governance risk model. The main elements through which the global functions are replicated in each of the units are corporate frameworks. In addition, both the executive committee and the Bank’s board These are central elements to communicate and transfer pay particular attention to management of the Group’s risks. global practices, reflect the criteria and policies for each of the areas and set the Group’s compliance standards to be The Group’s third vice-president is the maximum executive in applied in all local units. risk management. He is a member of the board and chairman of the risk committee. Two directorates-general of risks, which are • – Generally speaking it is possible to distinguish the main independent of the business areas, both from the hierarchical functions developed respectively by the GDR’s global areas and functional standpoint, report to the third vice-president. and by the units: The organisational and functional framework is as follows: • – – The general directorate of risks establishes risk policies and • The general directorate of risk (GDR) is responsible for the criteria, the global limits and the decision-making and executive functions of credit and financial risk management control processes; it generates management frameworks, and is adapted to the business structure, both by customer systems and tools; and adapts the best practices, both the type as well as by activity and country (global/local vision). The banking industry's as well as those of the different local GDR is structured around two fundamental functions, which units, for their implementation in the Group. are replicated locally and globally. • – – The local units apply the policies and systems to the local • The GDR is configured in two blocks: market: they adapt the organisation and the management frameworks to the corporate frameworks; they contribute • – A corporate structure, with global scope responsibilities critical and best practices and lead the local sphere (“all risk, all countries”), entrusted with establishing the projects. policies, methodologies and control. In this block, also denominated “intelligence”, and Global Control, are the • General directorate of integral control and internal areas/functions of solvency risks, market risk and validation of risks, with global reach responsibilities and of methodology. corporate nature and support for the Group’s governance bodies, which are: • – A structure of businesses, focused on executing and integrating management of the risk functions in the Group’s • – Internal validation of credit, market and economic capital local and global commercial businesses. In this block, also risk models in order to assess their suitability for denominated execution and integration in management, management and regulatory purposes. Validation involves the following areas/functions are grouped: management of reviewing the model’s theoretical foundations, the quality of standardised risks, management of segmented company the data used to build and calibrate it, the use to which it is risks, global recoveries, management of wholesale banking put and the process of governance associated. risk, management of Santander Consumer Finance risks and • – Integral control of risks, whose mission is to supervise the management of global business risks. quality of the Group’s risk management, guaranteeing that • – Complementing the three corporate structure areas and the the management and control systems of the various risks six business areas is a seventh area of global and systemic inherent in its activity comply with the most demanding governance, which supports and advises the GDR, and is criteria and best practices observed in the banking industry responsible for implementing the organisational model, and/or are required by regulators, and verifying that the overseeing effective execution of internal control and the profile of effective risk assumed is adjusted to what senior systems model. management has established. ANNUAL REPORT 2011 153
  • 156.
    Informe_Gestion Riesgos 2011_ENG_V17:esp28/02/12 11:17 Página 154 2. Integral control of risk Grupo Santander launched in 2008 the function of integral Internal control of risk supports the work of the risk committee, control of risks, anticipating the new regulatory requirements, providing it with the best practices in risk management. then being discussed in the main organisations and forums — Basel Committee, CEBS, FSF, etc,— as well as the The main features of this function are: recommendations on best risk management practices • Global and corporate scope: all risks, all businesses, all formulated by various public and private bodies. countries; Organisation, mission and features • It is configured as a third layer of control, following the one of the function by the person responsible for managing and controlling each The organisation of this function is part of the directorate risk in the sphere of each business or functional unit (first general of integral control and internal validation of risk. This layer of control) and the corporate control of each risk function supports the Group’s governance bodies in risk (second layer). This ensures the vision and thus integral management and control. control of all risks incurred during the year in Santander’s activity. Particular attention is paid to credit risk (including the risks of • Special attention is paid to the development of best practices concentration and counterparty); market risk (including liquidity in the sphere of the financial industry, in order to be able to risk as well as structural risks of interest rates and exchange incorporate within Santander and at once any advances rates); operational and technology risks and risk of compliance deemed opportune. and reputational risk. • Both the information available as well as the resources that Integral control of risks is based on three complementary Grupo Santander assigns to controlling the various risks are activities: optimised, avoiding overlapping. 1) Ensure that the management and control systems of the various risks inherent in Grupo Santander’s activity meet the most demanding criteria and the best practices observed in the industry and/or required by regulators. 2) Ensure that senior management has at its disposal an integral vision of the profile of the various risks assumed and that these risks are in line with the previously agreed appetite for risks; and 3) Supervise appropriate compliance in time and form with the recommendations drawn up for risk management matters following inspections by internal auditing and by the supervisors to whom Santander is subject. 154 ANNUAL REPORT 2011
  • 157.
    Informe_Gestion Riesgos 2011_ENG_V17:esp28/02/12 11:17 Página 155 Methodology and tools Module 3 This function is backed by an internally developed methodology In order to monitor proactively the recommendations made by and a series of tools that support it, in order to systemise the internal auditing and by the supervisors regarding risk control exercise of it and adjust it to Santander’s specific needs. This and management, there is the SEGRE. This also enables the enables application of the methodology to be formalised and recommendations arising from integral control to be registered. traceable. The methodology and the tools of the three activities are articulated through the following modules: The Bank of Spain can access these tools if it so wishes and thus also the work papers used to develop the function of integral Module 1 control of risks. A guide of tests or reviews exists for each risk, divided in spheres of control (for example, corporate governance, organisational During 2011 structure, management systems, integration in management, (a) The third cycle of reviewing the various risks was completed technology environment, contingency plans and business in close contact with the corporate areas of control, continuity, etc). contrasting and assessing the control and management systems of these risks. Improvements were identified and Applying the tests and obtaining the relevant evidence, which is made into recommendations —with their corresponding assessed and enables the parameters of control of the various schedule for implementation agreed with the risk areas—, risks to be homogenised, is done every 12 months. New tests along with half yearly monitoring of the progress achieved in are incorporated where needed. The tests were fully reviewed the recommendations made in 2010. during 2011, using as a reference the most recent best practices observed in the banking industry and/or required by the (b) The board and the executive committee were regularly regulators, and also taking into account the experience garnered informed and given an integral vision of all risks, and the risk in previous years in this sphere. committee and the audit and compliance committee were also informed of the function. The support tool is the risk control monitor (RCM), which is a (c) Work continued on extending the integral control of risks repository of the results of each test and its work papers. A model to the Group’s main units, also coordinating the review of the situation of each risk is also conducted every six initiatives in this sphere in the various countries; and months, with monitoring of the recommendations that emanate from the annual report of integral control. (d) There was also participation, in coordination with the public policy and other areas, in representing the Group in forums Module 2 such as the Financial Stability Board (FSB) and Eurofi in Senior management is able to monitor the integral vision of the matters such as transparency in information on risks. various risks assumed and their adjustment to the previously formulated risk appetites. *** We will now look at the Group’s main risks: credit, market, operational and reputational. ANNUAL REPORT 2011 155
  • 158.
    Informe_Gestion Riesgos 2011_ENG_V17:esp28/02/12 11:17 Página 156 3. Credit Risk 3.1 Introduction to the treatment • Those under individualised management are assigned, mainly because of the risk assumed, a risk analyst. This category of credit risk includes the companies of wholesale banking, financial institutions and some of the companies of retail banking. Risk Credit risk is the possibility of losses stemming from the failure management is conducted through expert analysis backed up of clients or counterparties to meet their financial obligations by tools to support decision-making based on internal models with the Group. of risk assessment. • Standardised: a customer who has not been specifically The Group’s risks function is organised on the basis of the type assigned a risk analyst. This category generally includes of customer in order to distinguish during the risk management individuals, individual businessmen and retail banking process companies under individualised management from companies that are not segmented. Management of these standardised customers. risks is based on internal models of assessment and automatic decisions, complemented where the model does not go far enough or is not sufficiently precise by teams of analysts specialised in this type of risk. 156 ANNUAL REPORT 2011
  • 159.
    Informe_Gestion Riesgos 2011_ENG_V17:esp28/02/12 11:17 Página 157 3.2 Main magnitudes Excluding the exchange rate impact during 2011 of the main currencies against the euro, and the change in the and evolution aforementioned consolidation method, the increase in the exposure would be 2.8%. The Group’s credit risk profile is characterised by diversified geographic distribution and predominantly retail banking Spain was still the main unit as regards exposure to credit risk, activity. although 1.4% less than at the end of 2010. Of note in the rest of Europe, which accounts for more than one-third of the credit A. Global map of credit risk, 2011 exposure, is the presence in the UK. Overall, Europe, including The table below sets out the global credit risk exposure in Spain, accounted for 71% of the total exposure. nominal amounts (except for derivatives and repos exposure In Latin America, which accounted for 22% of the exposure, which is expressed in equivalent credit) at December 31, 2011. 97% of the exposure to credit risk is classified as investment- The year 2011 was characterised by small growth of 0.8% in the grade. credit risk exposure due, on the one hand, to a change in the The US accounted for 6.1% of the Group’s total credit exposure method for consolidating a Group companies in the US, which at the end of 2011. mainly reflects a drop in the effective credit amount by customer and, on the other, the combination of two factors: reduction in disbursements by customer (-0.2%), as a result of the lower volume of committed lines in an economic environment of weaker demand for loans in the main units; and growth in the effective amount with credit institutions (13.6%). Grupo Santander - Gross exposure to credit risk classified in accordance with legal company criteria Million euros. Data at December 31, 2011. Sovereign fixed Private fixed Outstanding Commitments Derivatives Outstanding Commitments income income to credit to credit and Repos to customers to customers (excluding trading) (excluding trading) entities entities (REC) Total Spain 252,165 55,526 32,318 8,040 33,092 3,465 36,535 421,142 Parent bank 151,644 42,075 21,025 5,356 25,094 3,236 30,232 278,663 Banesto 73,184 7,674 7,223 1,129 6,178 218 5,658 101,264 Others 27,337 5,777 4,070 1,555 1,820 10 646 41,215 Rest of Europe 341,350 50,232 6,292 4,664 33,374 0 11,840 447,754 Germany 30,413 536 0 93 2,492 0 8 33,541 Portugal 25,858 6,036 3,734 1,744 1,698 0 2,171 41,241 UK 248,425 39,500 0 2,679 27,757 0 8,961 327,321 Others 36,655 4,161 2,558 148 1,428 0 700 45,651 Latin America 148,579 56,992 20,079 5,879 30,849 0 9,919 272,297 Brazil 88,398 40,804 13,194 4,857 23,760 0 5,305 176,317 Chile 27,888 7,103 1,948 527 3,527 0 2,414 43,406 Mexico 18,101 7,501 3,376 324 1,600 0 1,874 32,777 Others 14,192 1,584 1,562 171 1,961 0 327 19,797 United States 43,107 15,271 1,437 10,577 2,766 0 559 73,717 Rest of world 774 72 2 1 115 0 0 964 Total group 785,975 178,094 60,129 29,160 100,196 3,465 58,854 1,215,874 % of total 64.6% 14.6% 4.9% 2.4% 8.2% 0.3% 4.8% 100.0% % change. s/Dec. 10 -0.2% -0.2% -0.2% -1.3% 13.6% 132.4% -2.8% 0.8% ECR (equivalent credit risk: net value of replacement plus the maximum potential value. Includes mitigants) Balances with customers include contingent risks and exclude repos (EUR 8,467 million) and other customer financial assets (EUR 20,137 million) The total fixed income excludes the portfolio of trading and investments of third party takers of insurance. Sovereign fixed income refers to securities issued by public administrations in general, including the state, regional and local administrations and institutions that operate with the guarantee of the state. Balances with credit entities and central banks include contingent risks and exclude repos, the trading portfolio and other financial assets. Of the total, EUR 81,611 million are deposits in central banks. ANNUAL REPORT 2011 157
  • 160.
    Informe_Gestion Riesgos 2011_ENG_V17:esp28/02/12 11:17 Página 158 B. Evolution of the magnitudes in 2011 countries most affected by the crisis (Spain and Portugal) and, to The evolution of non-performing loans reflect the impact of the a lesser extent, in those with a better situation in the economic deterioration of the economic environment, while the reduction cycle, such as the UK. In the whole of Latin America, the rise in in the cost of credit during 2011 underscores the prudent and the NPL ratio went hand in hand with the growth in lending anticipative management of risk, enabling Santander, in while maintaining a stable cost of credit. NPL coverage was general, to maintain both figures lower than those of its 61.4% compared to 72.7% at the end of 2010. competitors. As a result, the Group maintains a significant level of coverage and available generic provisions. Specific provisions for loan losses, net of bad debt recoveries, amounted to EUR 11,137 million, 1.41% of the average credit The NPL ratio was 3.89% at the end of 2011 (+34 b.p). Growth exposure with customers (the year’s average lending plus in this ratio slowed down in the last few quarters. NPLs declined financial guarantees), down from 1.56% in 2010. in Santander Consumer Finance and Sovereign and rose in the Grupo Santander - Risk, NPLs, coverage, provisions and cost of credit Million euros Credit risk with Spec. prov net of Credit cost customers(*) NPL ratio Coverage recovered write-offs (**) of risk(3) (million euros) % % (million euros) % 2011 2010 2011 2010 2011 2010 2011 2010 2011(2) 2010 (1) Continental Europe 364,622 370,673 5.20 4.34 55.5 71.4 4,569 6,190 1.10 1.62 Santander Branch Network 118,060 126,705 8.47 5.52 39.9 51.8 1,735 2,454 1.42 1.89 Banesto 78,860 86,213 5.01 4.11 53.1 54.4 778 1,272 0.96 1.52 Santander Consumer Finance 63,093 67,820 3.77 4.95 113.0 128.4 1,503 1,884 1.43 2.85 Portugal 30,607 32,265 4.06 2.90 54.9 60.0 283 105 0.90 0.30 United Kingdom 255,735 244,707 1.86 1.76 38.1 45.8 779 826 0.32 0.34 Latin America 159,445 149,333 4.32 4.11 97.0 103.6 5,379 4,758 3.57 3.53 Brazil 91,035 84,440 5.38 4.91 95.2 100.5 4,554 3,703 5.28 4.93 Mexico 19,446 16,432 1.82 1.84 175.7 214.9 293 469 1.63 3.12 Chile 28,462 28,858 3.85 3.74 73.4 88.7 395 390 1.40 1.57 Puerto Rico 4,559 4,360 8.64 10.59 51.4 57.5 95 143 2.25 3.22 Colombia 2,568 2,275 1.01 1.56 299.1 199.6 14 15 0.59 0.68 Argentina 4,957 4,097 1.15 1.69 206.9 149.1 29 26 0.67 0.72 Sovereign 43,052 40,604 2.85 4.61 96.2 75.4 416 479 1.04 1.16 Total Group 822,657 804,036 3.89 3.55 61.4 72.7 11,137 12,342 1.41 1.56 Memo item Spain 271,180 283,424 5.49 4.24 45.5 57.9 2,821 4,352 1.04 1.53 (*) Includes gross loans to customers, guarantees and documentary credits (ECR EUR 8,339 million) (**) Bad debts recovered. (1) Excludes the incorporation of AIG in Santander Consumer Finance Poland. (2) Excludes the incorporation of Bank Zachodni WBK. (3) (Specific provisions-bad debts recovered)/Total average credit risk. 158 ANNUAL REPORT 2011
  • 161.
    Informe_Gestion Riesgos 2011_ENG_V17:esp28/02/12 11:18 Página 159 C. Distribution of credit risk The charts below show the diversification of Santander’s loans by countries and customer segments. The Group is geographically diversified and focused on its main markets. Grupo Santander’s profile is essentially retail (85.6% retail banking), and most portfolios are products with a real guarantee (e.g. mortgages). Customer loans (gross) Distribution of credit risk by type of risk % of operating areas % BY GEOGRAPHIC AREA BY SEGMENT Spain 29% Sovereign 5% Others Portugal 4% 1% Rest of Individuals 57% Latin America 2% Germany 4% Public sector Commercial 3% Chile 3% Poland 1% Mexico 3% Rest of Europe 4% Global wholesale 14% Brazil 11% UK 34% Companies and SMEs 25% The distribution by geographic area and product of lending in the segment of standardised risks is set out below. Standardised risks % BY GEOGRAPHIC AREA BY PRODUCT UK 44% Mortgages 65% Poland 1% Santander SMEs and others 9% Consumer Finance 16% Cards 3% United States 3% Spain 16% Consumer 23% Latin America 16% Portugal 4% ANNUAL REPORT 2011 159
  • 162.
    Informe_Gestion Riesgos 2011_ENG_V17:esp28/02/12 11:18 Página 160 3.3 Metrics and measurement B. Paramenters of credit risk The assessment of a customer or operation, through ratings or toools scorings, constitutes a judgement of the credit quality, which is quantified via probability of default (PD in the terminology of A. Rating tools Basel). The Group has been using since 1993 its own models for assigning solvency and internal ratings (known as internal As well as the probability of default, quantifying credit risk ratings or scoring), which measure the degree of risk of a client requires other parameters to be estimated such as exposure at or transaction. Each rating or scoring corresponds to a certain default (EaD) and the percentage of EaD that might not be probability of default or non-payment, determined on the basis recovered (loss given default or LGD). Other aspects are also of the entity’s past experience, except for some termed low included such as quantifying off-balance sheet exposures, which default portfolios, where the probability is assigned using depend on the type of product, or analysis of expected external sources. More than 200 internal rating models used in recoveries, related to the guarantees existing and other features the admission process and risk monitoring existed in the Group. of the operation: type of product, maturity, etc. Global rating tools are used for the segments of sovereign risk, These factors comprise the main credit risk parameters. Their financial institutions and global wholesale banking. Their combination enables the probable or expected loss (EL) to be management is centralised in the Group, both for determining calculated. This loss is considered as one more cost of the their rating as well monitoring the risk. These tools assign a activity as it reflects the risk premium and should be rating for each customer resulting from a quantitative or incorporated into the price of operations. automatic module, based on balance sheet ratios or The following charts show the distribution of failed consumer macroeconomic variables, and supplemented by the expert view loans and mortgages since 2001 on the basis of the percentage of an analyst. recovered after discounting all the costs —including the In the case of companies and institutions under individualised financial —of the recovery process. management, the parent company of Grupo Santander has defined a single methodology for formulating a rating in each Spain-parent bank. Mortgages Distribution of operations by the percentage recovered country. The rating is determined by an automatic model which reflects a first intervention by the analyst and which can or not 70% be later complemented. The automatic model determines the rating in two phases, one quantitative and the other qualitative 60% based on a corrective questionnaire which enables the analyst to 50% modify the automatic scoring by a maximum of ±2 points of % operations rating. The quantitative rating is determined by analysing the 40% credit performance of a sample of customers and the correlation with their financial statements. The corrective questionnaire has 30% 24 questions divided into six areas of assessment. The automatic 20% rating (quantitative +corrective questionnaire) can be changed by an analyst by writing over it or by using a manual assessment 10% model. 0% >10%& >20%& >30%& >40%& >50%& >60%& >70%& >80%& <=10% <=20% <=30% <=40% <=50% <=60% <=70% <=80% <=90% The ratings accorded to customers are regularly reviewed, >90% incorporating new financial information available and the experience in the development of the banking relation. The % recovered regularity of the reviews increases in the case of clients who reach certain levels in the automatic warning systems and in those classified as special watch. The rating tools are also Spain- parent bank. Consumer-retail. reviewed so that their accuracy can be fine-tuned. Distribution of operations by the percentage recovered In the case of standardised risks, both for companies as well as 60% individuals, there are scoring tools which automatically assess 50% the operations. % operations 40% These admission systems are complemented by performance assessment models which enable the risk assumed to be better 30% predicted. They are used for both preventative activities as well 20% as sales and assigning limits 10% 0% >10%& >20%& >30%& >40%& >50%& >60%& >70%& >80%& <=10% <=20% <=30% <=40% <=50% <=60% <=70% <=80% <=90% >90% % recovered 160 ANNUAL REPORT 2011
  • 163.
    Informe_Gestion Riesgos 2011_ENG_V17:esp28/02/12 11:18 Página 161 The risk parameters also calculate the regulatory capital in C. Master scale of global ratings accordance with the rules derived from Circular 3/2008 of the The following tables are used to calculate regulatory capital. Bank of Spain on determining and control of minimum equity They assign a PD on the basis of the internal rating, with a and subsequent changes. The regulatory capital is the difference minimum value of 0.03%. between the unexpected and the expected loss. Probability of default The unexpected loss is the basis for calculating the capital and makes reference to a very high level of loss, but not very probable, not considered recurrent and which must be met with Wholesale Banking Banks equity. Internal Internal In portfolios where the internal experience of defaults is scant, rating PD rating PD such as banks, sovereigns or global wholesale banking, 8.5 to 9.3 0.030% 8.5 to 9.3 0.030% estimates of the parameters come from alternative sources: 8.0 to 8.5 0.033% 8.0 to 8.5 0.039% market prices or studies by external agencies which draw on the 7.5 to 8.0 0.056% 7.5 to 8.0 0.066% shared experience of a sufficient number of institutions. These 7.0 to 7.5 0.095% 7.0 to 7.5 0.111% portfolios are called low default portfolios. 6.5 to 7.0 0.161% 6.5 to 7.0 0.186% 6.0 to 6.5 0,271% 6.0 to 6.5 0.311% For the rest of portfolios, estimates are based on the institution’s internal experience. The PD is calculated by observing NPL 5.5 to 6.0 0.458% 5.5 to 6.0 0.521% entries and putting them in relation to the final rating assigned 5.0 to 5.5 1.104% 5.0 to 5.5 0.874% to the customer or with the scoring assigned to the operations. 4.5 to 5.0 2.126% 4.5 to 5.0 1.465% 4.0 to 4.5 3.407% 4.0 to 4.5 2.456% The LGD calculation is based on observing the recovery process 3.5 to 4.0 5.462% 3.5 to 4.0 4.117% of operations not fulfilled, taking into account not only the 3.0 to 3.5 8.757% 3.0 to 3.5 6.901% revenues and costs associated with this process, but also the 2.5 to 3.0 14.038% 2.5 to 3.0 11.569% moment when they are produced and the indirect costs incurred in recovery activity. 2.0 to 2.5 22.504% 2.0 to 2.5 19.393% 1.5 to 2.0 36.077% 1.5 to 2.0 32.509% The estimation of the EaD comes from comparing the use of the < 1.5 57.834% < 1.5 54.496% lines committed at the moment of default and a normal situation. These PDs are applied uniformly throughout the group in The parameters estimated for global portfolios are the same for accordance with the global management of these portfolios. As all the Group’s units. A financial institution with a rating of 8.5 can be seen, the PD assigned to the internal rating is not exactly will have the same PD regardless of the unit in which its equal for a same rating in both portfolios, although it is very similar exposure is recorded. On the other hand, retail portfolios have in the tranches where most of the exposure is concentrated (i.e. in specific scoring systems in each unit of the group. This requires tranches of rating of more than six). separate estimates and specific assignment in each case. D. Distribution of EaD and expected loss The parameters are then assigned to the operations present in (EL) associated the balance sheet of units in order to calculate the expected The table below sets out the distribution by segments of the losses and the capital requirements associated with their outstanding credit exposure to customers in terms of EaD. PD, exposure. LGD and EL. Approximately 78% of total risk with clients (excluding sovereign, counterparty risks and other assets) corresponds to companies, SMEs and loans to individuals, underlining the retail focus of business and of Santander’s risks. The expected loss from customer exposure is 1.30% (1.05% for the Group’s total credit exposure), which can be considered as a medium-to-low risk profile. Segmentation of credit risk exposure Million euros % PD. LGD EaD(1) % Average Average EL Sovereign debt 159,775 15.2% 0.14% 13.9% 0.02% Counterparty 51,574 4.9% 0.27% 59.6% 0.16% Public sector 14,654 1.4% 1.44% 14.8% 0.21% Corporate 155,702 14.8% 0.94% 39.9% 0.37% SMEs 163,005 15.5% 5.44% 30.5% 1.66% Mortgages (individuals) 330,435 31.5% 3.10% 8.9% 0.28% Consumer loans 124,913 11.9% 7.94% 55.1% 4.38% Credit cards of individuals 32,374 3.1% 4.74% 64.8% 3.07% Other assets 17,465 1.7% 3.73% 27.5% 1.02% Memorandom item 821,083 78.2% 3.93% 33.1% 1.30% customers(2) Total 1,049,897 100% 3.17% 33.0% 1.05% Data at December 2011. (1) Excluding doubtful loans. (2) Excluding sovereign debt, banks and other financial entities and other assets. ANNUAL REPORT 2011 161
  • 164.
    Informe_Gestion Riesgos 2011_ENG_V17:esp28/02/12 11:18 Página 162 3.4. Loss observed: measurements of The three approaches measure the same reality and, consequently, converge in the long term although they credit cost represent successive moments in credit cost measurement: flows of non-performing loans (non-performing loans management As well as using these advanced models, other usual measures variation, NPLMV), coverage of doubtful loans (net loan-loss are employed which provide prudent and effective management provisions, NLLPs) and becoming write offs (net write-offs), of credit risk on the basis of the loss observed. respectively. And this without detriment that in the long term and within the same economic cycle, the three show differences Grupo Santander’s cost of credit is measured by various means: at certain times, particularly significant at the start of a change change in net entries (final doubtful loans —initial doubtful of cycle. These differences are due to the various moments at loans + write offs —recovered write offs), net loan-loss which the losses are calculated, which are basically determined provisions (net specific provisions – recovered write-offs) and net by accounting rules. In addition, the analysis can be complicated write-offs (write offs – recovered write-offs). by changes in the policy of coverage and entry into write offs, composition of the portfolio, doubtful loans of entities acquired, changes in accounting rules, sale of portfolios, etc. Grupo Santander´s total cost of credit % of average portfolio Average 2002-2011 Change in net enties: 0.98% Net LLPs: 0.82% Net write-offs: 0.66% 2.5% 2.2% 1.9% 1.6% 1.3% 1.0% 0.7% 0.4% 0.1% DEC. 02 DEC. 03 DEC. 04 DEC. 05 DEC. 06 DEC. 07 DEC. 08 DEC. 09 DEC. 10 DEC. 11 Note: The data for 2009 reflects the incorporation of A&L and in 2010 Sovereign. December 2011 does not include the incorporation of Bank Zachodni WBK. 162 ANNUAL REPORT 2011
  • 165.
    Informe_Gestion Riesgos 2011_ENG_V17:esp28/02/12 11:18 Página 163 The following charts reflect the cost of Grupo Santander’s credit risk in its main areas of activity in 2011 and the comparison with prior years, measured in various ways: Net write-offs Change in doubtful loans plus net write-offs (% of average balances) 6.25 2007 2008 2009 2010 2011 4.67 3.80 2.61 2.85 2.35 1.96 1.73 1.80 1.62 1.67 1.93 1.49 1.34 1.17 1.37 1.36 1.41 1.36 0.70 0.53 0.54 0.34 0.23 0.37 Group Spain UK Rest of Europe Latin America (incl. Brazil) Net loan-loss provisions Net specific provisions less recovered write offs (% of average balances) 4.91 2007 2008 2009 2010 2011 3.86 3.81 3.70 2.28 1.57 1.56 1.51 1.26 1.41 1.18 1.18 1.16 1.16 0.73 0.65 0.95 0.50 0.55 0.44 0.33 0.46 0.15 0.23 0.25 Group Spain UK Rest of Europe Latin America (incl. Brazil) Net entries Write-offs less recovery of write-offs (% of average balances) 2007 2008 2009 2010 2011 4.56 3.68 3.28 2.44 1.67 1.32 1.17 1.23 0.94 1.10 0.72 0.73 0.91 0.43 0.55 0.52 0.47 0.36 0.64 0.16 0.20 0.20 0.17 0.43 0.36 Group Spain UK Rest of Europe Latin America (incl. Brazil) Note: Data drawn up in accordance with legal company criteria. 2011 does not include Bank Zachodni WBK, and in the case of net provisions also does not include Santander Consumer USA. The figures for 2010 reflect the incorporation of Sovereign. 2008 excludes A&L and 2009 excludes Sovereign and Venezuela. The general trend over the past few years has been to maintain the cost of Santander’s credit at low levels. In 2011, the decline of 15 b.p. in the cost of credit was due to the still significant deterioration of the economic environment and of the mix of retail portfolios which, although with a higher expected loss, have higher levels of direct and indirect profitability and a more predictable nature of risk. ANNUAL REPORT 2011 163
  • 166.
    Informe_Gestion Riesgos 2011_ENG_V17:esp28/02/12 11:18 Página 164 3.5 Credit risk cycle B. Risk study and process of credit rating Risk management consists of identifying, measuring, analysing, The study of risk is obviously a prior requirement for authorising controlling, negotiating and deciding the risks incurred by the customer operations by the Group. Group’s operations. The process involves risk takers and senior management, as well as the risk areas. This study consists of analysing the capacity of the customer to meet their contractual obligations with the bank. This entails The process emanates from senior management, via the board analysing the customer’s credit quality, risk operations, solvency of directors and the risk committee; they set the risk policies and and return in accordance with the risk assumed. procedures, the limits and delegating of powers, and approve and supervise the framework of the risks function. The risk study is carried out every time there is a new customer or operation or with a pre-established regularity, depending on The risk cycle has three phases: pre-sale, sale and after sale: the segment. In addition, the rating is studied and reviewed every time there is an alert or something that affects the • Pre-sale: this includes the planning and setting of objectives, customer/operation. determining the appetite for risk, approving new products, studying the risk and rating loans, and establishing limits. C. Decisions on operations • Sale: this covers the phase of decision-making both for The purpose of the decision-making process is to analyse and operations under pre-classification as well as one-off resolve operations, taking into consideration both the risk transactions. appetite as well as those elements of the operation that are relevant in the search for the balance between risk and return. • After sale: monitoring, measurement, control and recovery management. The Group has been using RORAC methodology (return on risk adjusted capital) since 1993 to analyse and set prices for A. Planning and setting limits operations and businesses. Setting limits is a dynamic process which identifies the Group’s risk appetite by discussing business proposals and the opinion of D. Monitoring risks. As well as the tasks carried out by the internal auditing division, the directorate general of risks, through local and global teams, The global plan of limits, the document drawn up on the basis controls credit quality by monitoring the risks and has the of consensus which provides complete management of the resources and specific people to do it. balance sheet and of the inherent risks, establishes the risk appetite in the various factors. The monitoring is based on a continuous process of permanent observation, which enables incidents to be detected in advance The limits are based on two structures: customers/segments and in the evolution of risk, operations, customers, and their products. environment in order to take steps to mitigate them. The monitoring is conducted on the basis of customer The most basic level in individualised management is the segmentation. customer and when certain features are present —generally of relative importance— an individual limit (pre-classification) is set. The Group has a system called companies in special watch (FEVE) which identifies four levels on the basis of the degree of A pre-classification model based on a system for measuring and concern arising from the circumstances observed (extinguish, monitoring economic capital is used for large corporate groups. secure, reduce, monitor). The inclusion of a company in FEVE A more simplified version is used for those companies who meet does not mean there have been defaults, but rather the certain requirements (high knowledge, rating, etc). advisability of adopting a specific policy toward that company In the sphere of standardised risk, the planning and setting of and establishing the person and time frame for it. Clients in limits is done through credit management programmes (CMPs), FEVE are reviewed at least every six months, and every quarter a document reached by consensus between the business and for the most serious cases. A company can end up in special risk areas and approved by the risk committee or committees watch as a result of monitoring, a review conducted by internal delegated by it. The CMPs set out the expected results of auditing, a decision of the person responsible for the company business in terms of risk and return, as well as the limits to or the entry into functioning of the system established for which activity is subject and management of the associated automatic warnings. risks. 164 ANNUAL REPORT 2011
  • 167.
    Informe_Gestion Riesgos 2011_ENG_V17:esp28/02/12 11:18 Página 165 Ratings of risk balances according to the FEVE monitoring Grupo Santander restricts these operations, with rigorous and system selective criteria, to: Million euros at December 2011 • viable operations, which in origin do not have a very severe Extinguish Secure Reduce Monitor Total deterioration; Retail banking Spain 4,760 485 11,250 12,649 29,143 • where the customer wishes to pay; Banesto 7,467 151 2,018 11,154 20,790 • that improve the bank’s position in terms of expected loss; Portugal 394 247 987 2,221 3,848 1,112 N.A.(*) N.A.(*) 417 1,529 • and where restructuring does not discourage additional Poland efforts by the customer. United Kingdom 235 60 844 1,923 3,062 Sovereign 1,678 46 1,167 2,002 4,894 In standardised customers, the general principles stated below are applied rigorously, tending to exceptional circumstances Latin America 1,339 437 1,876 7,248 10,901 when necessary. In the case of segmented customers, these Total 16,984 1,426 18,142 37,614 74,166 principles can be used as an element of reference, but particularly important is individualised analysis of each case. Note: 2011 shows the application of the FEVE tool in Poland. The classification of risk in FEVE is independent in each institution and responds to the various criteria for classification of these risks and management of them on the basis of the category in which they are classified. • The customer’s overall risk is assessed. (*) Not applicable. • The risk with the customer does not increase. Ratings are reviewed at least every year, but if weaknesses are • All the refinancing alternatives are assessed and their impact, detected, or on the basis of the rating, it is done more regularly. ensuring that their results would be better than those likely to be obtained if this process was not carried out. As regards the risks of standardised clients, the main indicators are monitored in order to detect shifts in the performance of the • Particular attention is paid to guarantees and the possible loan portfolio with respect to the forecasts made in the credit future evolution of their value. management programmes. • Their use is restricted, rewarding the restructuring of risks with additional efforts by customers and avoiding actions that Payment restructurings and agreements only postpone the problem. The restructuring of debts is part of the continuous management of risks with customers although it is during • Monitoring of these operations is carried out in a special way, periods of economic downturn when this practice assumes and maintained until the total extinction of the debt. greater importance. It arises when the customer is not in a • For segmented customers, a very detailed analysis is carried condition to comply with the payment obligations contracted out, case by case, where the expert opinion enables with the bank and so the possibility of adjusting the debt to the adjustment of the most appropriate conditions. customer’s new payment capacity and/or improve the guarantees is contemplated. As well as close monitoring of these portfolios by the Group’s risk management teams, both the various supervisory authorities The use of debt restructuring by Grupo Santander’s banks to which Grupo Santander is subject and the internal audit of makes it necessary to establish common practices, which enable the Group pay particular attention to control and appropriate these risks to be overseen. With this in mind, the corporate assessment of the restructured portfolios. policy for restructuring the debts of customers was created, approved by the risk committee, which incorporates a series of Depending on the management situation in which operations definitions, general principles and policies that must be applied under restructuring find themselves in, we distinguish two types by all the Group. of operation: Within the activity of continuous monitoring, the risk • Those for customers under normal classification (without non- departments and the business area of recoveries, in coordination performing loans) who, due to a change in their economic with the business areas, carry out centralised actions to identify situation, could suffer an eventual deterioration in their those customers who might need to restructure their debts. The payment capacity. This contingency can be resolved by payment capacity is the central factor of analysis, given that the adapting the debt conditions to the customer’s new capacity, purpose of restructuring is that the customer continue to pay thereby facilitating compliance with the payment obligation. back their loans. The factors taken into consideration are These operations are not the subject of concern, but a one-off indicative of the changes in the economic situation and, thus, circumstance to tackle within the normal customer signify a deterioration in the customer’s payment capacity. relationship. Moreover, as there was no need to anticipate possible losses, it is not necessary to make loan-loss provisions The risk departments, in coordination with the business area of to cover these operations. Once the conditions have changed, recoveries, are entrusted with approving the restructuring there is a certainty that the customer will comply with the operation, modifying the terms of the loan and improving payment periods with no problems and continuously. guarantees, if possible, as well as analysing the risks assumed. • Loans classified as non-performing, due to delays in payment or other situations, are known as refinancing. ANNUAL REPORT 2011 165
  • 168.
    Informe_Gestion Riesgos 2011_ENG_V17:esp28/02/12 13:58 Página 166 Refinancings do not signify release of provisions. The Payment agreements classification of the risk as non-performing is maintained unless: These criteria are mainly aimed at situations of low impact on the customer’s payment capacity. For situations of serious • The criteria envisaged in the regulations based on Bank of deterioration, the restructuring of the loan is not considered an Spain circulars (payment of ordinary interest pending and, in option and agreements are sought with the customer to recover any case, contribution of new effective guarantees or a all or part of the loan, minimising the losses and assuming reasonable certainty of payment capacity) are met; sometimes, one or several of the following circumstances: • The cautions under a criterion of prudence in the Group’s • There is not a reasonable certainty of payment; delays of 180 corporate policy (sustained payment during a period of days or debts classified as bad. between 3 and 12 months, on the basis of the features of the operation and the type of guarantees existing) are met. • Contractual conditions were agreed that do not meet the general principles set out in the corporate policy of As for loan-loss provisions, the restructuring must not carry restructuring mentioned in the previous section: condonation weight in assigning provisions for a particular operation. The of the principle and/of interest payments, a quota that does fact that the entry into irregularity of a restructured operation is not cover the ordinary interest or there is an increase in the considered substandard entails an increase in provisions for the risk. Group. In restructured operations that return to being non- performing, the applicable coverage percentage will be The logic of normalisation of these operations is based on using calculated on the basis of the date when the operation first as a rule the experience with the customer, setting a graduation became non-performing. in the level of requirement of the observation periods considering both the customer’s initial situation before The amount of the portfolio refinanced at the end of 2011 was renegotiation, as well as the concessions made by the bank to barely 1% of the Group’s total lending and its structure was as reach the agreement. The greater the deterioration, the greater follows: the degree of prudence, establishing a longer observation period. When estimating the length of a possible real recovery Amount of the refinanced portfolio. Main countries of the payment capacity a period of between 18 and 24 months Million euros is considered for an agreement without a haircut, and between Spain 4,172 24 and 36 months for an agreement with a haircut. Portugal 914 Credit exposure in Spain UK 1,007 a. General view of the portfolio Brazil 2,844 At the end of 2011, Santander’s total credit exposure (including Latin America 496 guarantees and documentary credits) in Spain amounted to EUR 271,180 million, with an appropriate level of diversification, Sovereign 338 both by product as well as customer segment. The structure by segments of the total refinanced portfolio at The credit risk of commercial networks of the main businesses in the end of 2011 was as follows: Spain (Santander Branch Network, Banesto, Banif and Santander Consumer) accounted for 23% of the Group’s total, distributed as Structure by segment of the total refinanced portfolio follows: Million euros Segmentation of the commercial networks in Spain Mortgages 2,037 % Consumer 2,617 Companies 4,497 Comps. indiv. Corporate 1,016 man. 42% Other segments 6% Institutions 6% Standardised companies 4% Other (individuals) 2% Consumer 6% Mortgages 34% Includes the commercial networks of the main businesses in Spain (Santander Retail Banking, Banesto, Banif and Santander Consumer). 166 ANNUAL REPORT 2011
  • 169.
    Informe_Gestion Riesgos 2011_ENG_V17:esp28/02/12 13:58 Página 167 In accordance with Bank of Spain rules, the Group regards as b. Analysis of the mortgage portfolio of individual doubtful loans those which have not been serviced for more customers than 90 days and includes the total debt of the customer when In line with the Bank of Spain’s guidelines for greater the unpaid part represents more than 25% of it or when pre- transparency in information for the market regarding property, judicial actions are taken. Also considered as doubtful loans are the table below sets out the loans granted to households to buy those which, without entering into non-compliance, have homes by the main businesses in Spain. This portfolio, one of reasonable doubts of being fully repaid. These criteria are not the main ones in Spain, stood at EUR 59,453 million at the end limited to just credit risk in Spain, but also to all units, where of 2011 (22% of total credit risk in Spain). Of this, 98% of the these are combined with the regulations that each local loans have mortgage guarantees. regulator has established. The NPL ratio in Spain in 2011 was 5.49%, concentrated in Lending to households to acquire homes those sectors which were most affected by the economic Million euros downturn. Although this figure is higher than in 2010, its Gross amount Of which: doubtful increase was below the aggregate rise of banks in Spain (according to the regular information published by the Bank of Loans to acquire property 59,453 1,607 Spain). This underscored the Group’s traditionally prudent risk Without mortgage guarantee 918 28 management criteria as well as the fact that the NPL ratios of a With mortgage guarantee 58,535 1,579 large percentage of the credit portfolios in Spain registered lower growth during the year. Santander’s positive differential with banking system widened in 2011 by 67 b.p. The NPL ratio of the portfolio with mortgage guarantee, which Total provisions for covering the possible loss of these risks reflects the evolution of the economic environment during represent coverage of 45.5%. 2011, was 2.7% at the end of the year, 50 b.p. more than in 2010 and well below that of other businesses in Spain. In line with the Bank of Spain’s rules and indications, loans classified as substandard are those which, while being up to The portfolio of mortgages for property in Spain has features date on payments and with no reason to be classified as that maintained its medium-low risk profile and had limited doubtful, show some weakness which could lead to non- expectations of further deterioration: payments and losses, as they involve the weakest customers • All mortgages pay principal from the very first day of the from certain collectives or sectors affected by extraordinary operation. circumstances of greater risk. • The usual practice is to repay it ahead of time and so the average life of the operation is well below that of the contract. Evolution of non-performing loans 2008-2011 % • The borrower responds with all assets and not just the property. Deposit taking institutions Grupo Santander total Spain • Most mortgages have variable interest rates with spreads over Euribor. 8.00 7.50 7.67 • High quality of collateral, almost entirely in mortgages for the first residence. 7.00 6.68 6.50 • 88% of the portfolio has a LTV of less than 80%, calculated as 6.00 the total risk against the amount of the latest available 5.75 valuation. 5.50 5.26 5.00 4.97 5.49 • The average affordability rate remained at close to 29%. 4.50 4.49 4.81 4.00 LTV ranges. Total 3.50 3.29 4.24 Million euros 3.71 80% < LTV < 100% 3.00 40% < LTV < 60% 60% < LTV < 80% 2.50 3.41 LTV > 100% LTV < 40% 2.00 2.72 1.50 1.95 1.00 0.50 Gross amount 13,020 16,503 21,940 6,474 597 Dec. 08 Jun. 09 Dec. 09 Jun. 10 Dec. 10 Jun. 11 Dec. 11 Of which: doubtful 177 271 598 425 107 ANNUAL REPORT 2011 167
  • 170.
    Informe_Gestion Riesgos 2011_ENG_V17:esp28/02/12 13:58 Página 168 Loan to value the maturity of their loan, in order to compensate the grace period, without having to change the loan’s financial conditions, neither during the period of grace nor at the end of it. 38% LTV < 40% This measure helped to mitigate the social impact of the 40% - 60% 1% economic crisis, while preserving the good culture of payment, 60% - 80% one of the differential elements of the Spanish mortgage 80% - 100% 11% market. At the end of 2011, 6,000 customers of the Santander Branch Network in Spain had taken advantage of this > 100% moratorium for a total amount of close to EUR 1,000 million. c. Financing provided for construction and real estate 28% promotion with real estate purpose 22% Lending to these sectors, in line with the Bank of Spain’s guidelines regarding classification by purpose, amounted in Spain to EUR 23,442 million, 25% lower than in 2009 and 14% Affordability rate below 2010 using like-for-like criteria. This represents a market Average 29% share of around 10% on the basis of the latest information published for June 2011, substantially lower than that of the 52% Group’s total businesses in Spain. Including EUR 8,552 million of foreclosed properties, the total amount is EUR 31,994 million TE < 30% (4% of the Group’s total lending). 30% < TE < 40% TE > 40% The reduction in risk was largely due to a strict policy in admitting new loans with the consequent amortisation of the 24% credit operations of the portfolio outstanding and proactive management of existing risks. The non-performing loan ratio of this portfolio at the end of 2011 was 28.6%, underscoring the deterioration in this sector. Of the 24% EUR 10,638 million classified as doubtful and sub-standard loans, Note: The affordability rates at Santander and Banesto. 58% were up-to-date with payments, which underscored the Loan to Value: relation between the amount of the loan and the appraised value of the mortgaged property. On the basis of management criteria, the average LTV of the portfolio of mortgages for Group’s conservative policy in anticipating the bad loan individuals to buy homes was 51.6% classification. Coverage with specific provisions was 32.8%, in Affordability rate: relation between the annual payments and the customer’s net income. accordance with the regulations at the end of the year. Despite the economy’s situation and its gradual deterioration Financing for construction and real estate development: during the last three years, the measures taken in admission doubtful and substandard loans produced a good evolution of vintages. For new loans between Million euros 2008 and 2011 in the Santander network in Spain, the maturity of vintages is shown below. Risk Coverage Amount Amount % Evolution of the default rate by the number of operations Doubtful loans 6,722 2,211 33 by vintages Substandard 3,916 613 16 3% Coverage with generic provisions 327 2.5% Total 10,638 3,151 30 2% 2008 2.49% A large part of the exposure to the construction and real estate NPL ratio 1.5% activity sectors are loans with mortgage guarantee (EUR 18,705 million, 80% of the portfolio compared to 78% in 2010). Their 1% distribution is shown below: 2009 0.85% 0.5% Credit exposure to the construction and real estate 0 2011 2010 0.22% development sector 0.15% Million euros 0 5 10 15 20 25 30 35 40 45 50 55 Total: 23,442 million. Finished buildings Months (11,805) 50% Note: mortgage vintages of the Santander Branch Network in Spain. Banco Santander’s branch network in Spain offered as of Without mortgage August 1, 2011 a three year moratorium in capital in order to guarantee ease the situation of individual customers and the self- (4,737) 20% employed, with objective causes of economic problems, such as being unemployed or having suffered a fall of more than 25% in Other land (244) 1% their income, and who were having temporary problems in Buildings under construction (1,985) 9% repaying their mortgages on their normal residence. Customers Land that can be developed who adhere to this measure have the possibility of extending (1,553) 7% Land developed (3,118) 13% 168 ANNUAL REPORT 2011
  • 171.
    Informe_Gestion Riesgos 2011_ENG_V17:esp28/02/12 11:18 Página 169 A particularly important product in the real estate promotion The admission processes are managed by specialised teams who portfolio is mortgage loans to real estate developers. At the end coordinate directly with commercial teams, and have well of 2011, this amounted to EUR 7,467 million and represented defined policies and criteria: around 0.9% of Grupo Santander’s total credit portfolio. The reduction in the exposure to this product accelerated during 2011 • Promoters with an ample solvency profile and with proven (24% compared to 20% in 2010 and 9.3% in 2009). experience in the market. • Strict criteria of parameters inherent in operations. Exclusive At the end of 2011, this portfolio of loans had a low degree of financing for the cost of building, high percentages of sales concentration and an appropriate level of guarantees and accredited, financing of the first residence, etc. coverage. • Support for the financing of social housing with accredited The situation was as follows: percentages of sale. • Developments completed and with the final certificate of • Restricted financing of land, reduced to the re-establishment work: 79.2% of outstanding risk. of the appropriate level of coverage in already existing financings or an increase in the guarantees. • Developments more than 80% completed: 6.4% of outstanding risk. As well as the permanent control by teams of monitoring the Group’s risks, there is a technical team specialised in monitoring • Developments between 50% and 80% completed: 5.2% of and controlling this portfolio in relation to progress in building, outstanding risk. compliance with plans and control of sales, as well as with the • Developments less than 50% completed: 9.2%. validation and control of disbursements through certifications. Santander has specific tools created for this purpose. All the Furthermore, close to 86% of this financing of real estate mortgage distributions, disbursements for any type of concept, developments is totally completed or close to it, having changes to the grace periods, etc, are authorised on a overcome the risk of construction. centralised basis. Policies and strategies established for management of In the case of projects under construction with some kind of these risks problems, the criterion to be followed is to guarantee The policies in force for managing this portfolio, regularly completion in order to have buildings that can be sold. In order reviewed and approved by the Group’s senior management, are to achieve this, each project is analysed individually so that the currently focused on reducing and securing the exposure, most effective series of measures can be adopted for each case without overlooking new business identified as viable. (payment structures to suppliers that guarantee completion of the work, setting schedules of specific disbursements, etc). In order to manage this credit exposure, Grupo Santander has specialised equipment that not only fits within the risk areas, but In those cases that require as a result of the analysis some kind also complements its management and covers the whole life of restructuring of the exposure, the restructuring is carried out cycle of these operations: their commercial management, jointly between risks and the business area of recoveries, juridical treatment, eventuality of recovery management, etc. anticipating non-payment situations, with criteria centred on providing the projects with a payments structure that produces As already commented on in this same point, anticipative a good result. These authorisations are conducted on a management of these risks enabled the Group to reduce its centralised basis and by expert teams ensuring strict criteria are exposure significantly (-45% in mortgage loans for promoters applied in line with the Group’s principles of prudence in risk between 2008 and 2011) and attain a granular portfolio and management. Recognition of the possible losses materialises diversified by territories where the volume of loans for second when they are identified, classifying the positions without homes is very low. waiting for non-payment in accordance with the rules set by the Bank of Spain, with the corresponding provision giving coverage Mortgages for land not developed account for only 6% of the to the expected loss in these positions. mortgage exposure, with the rest already classified as developed land or land that can be developed. Companies specialised in selling properties (Altamira Santander Real Estate and Promodomus) manage real estate assets, backed In the event of loans for homes not yet completed, the significant up by the commercial network structure. Sales are made with reduction in the exposure of 24% in 2011 was due to various price reduction levels reflecting the market’s situation and with actions. As well as the already existing specialised channels, the levels of provisions of this portfolio. campaigns were conducted supported by teams of specific managers for this function which, in the case of the Santander Branch Network, were directly supervised by the business area of recoveries, where direct management of them with promoters and buyers applying criteria of sale price reductions and adapting to the financing conditions to the needs of buyers, enabled subrogations of already existing loans to be made. These subrogations diversify risk in a business segment that has a clearly lower NPL ratio. ANNUAL REPORT 2011 169
  • 172.
    Informe_Gestion Riesgos 2011_ENG_V17:esp28/02/12 11:18 Página 170 d. Real estate foreclosed These additional needs will be entirely met in 2012 as follows: In the last instance, one of the mechanisms used in Spain to manage risk efficiently is the purchase and foreclosure of real • EUR 1,800 million was charged against the Group's fourth estate assets. The net balance of these assets at the end of 2011 quarter 2011 earnings, of which EUR 1,517 million was was EUR 4,274 million, the result of a gross amount of EUR assigned to an additional fund to the one already existing for 8,552 million and provisions of EUR 4,278 million. coverage of foreclosed properties and which lifted coverage of these assets to 50%. In accordance with the Group's usual criteria of prudence and • EUR 2,000 million are a capital buffer required by the rules anticipating future regulatory changes regarding coverage of and which are covered by capital already held by the Group. these properties, at the end of 2011 EUR 1,800 million was set aside for real estate risk, of which EUR 1,517 million was used • The remaining EUR 2,300 million will be covered through to constitute an additional fund, which raised coverage of all capital gains which may be obtained during the year— these assets to 50%. including EUR 900 million from the capital gain on the sale of Banco Santander Colombia— and through ordinary The following table shows the structure at the end of 2011 of contributions to provisions during 2012. properties foreclosed by the main businesses in Spain: Impact on Grupo Santander of the financial reform in Spain Spain: Foreclosed properties Million euros Million euros Gross amount Coverage Net amount Amount of provisions Finished buildings 3,753 39% 2,272 Additional provisions under new rules at 31.12.2011 6,100 Buildings under construction 521 51% 256 Against results 2011 -1,800 Developed land 2,661 58% 1,120 Buffer covered with surplus of existing capital -2,000 Land that can be developed 1,339 61% 521 Provisions pending = 2,300 Other land 279 62% 105 Total 8,552 50% 4,274 Financing of new provisions in 2012 2,300 Charged to capital gains from the sale of Santander Colombia 900 Of the total amount, 45% corresponds to completed buildings Charged to other capital gains and ordinary allowances 2012 1,400 available for sale and of the total land 94% is developed or can be developed. Foreclosed properties In the last few years, the Group regarded acquisition/foreclosure Billion euros as an efficient tool for resolving unpaid loans as against going Coverage 8.6 through systems of legal processes. In both 2010 and 2011, net Net volume 7.5 entries of foreclosed and acquired properties continued to fall, due to a faster pace of sales (+12%) than entries (+8%). In the 6.5 fourth quarter of 2011, the balance of these assets was slightly 2.3 4.3 lower and this trend was expected to continue in the coming 2.0 4.8 years. 0.5 4.3 4.5 5.2 4.3 Spain: Foreclosed properties Billion euros 2011 2010 Gross entries 2.3 2.1 8% Sales 1.3 1.1 12% 2008 2009 2010 2011 Difference 1.0 1.0 Foreclosed properties: e. New regulatory requirements Coverage ratio 50% After approval of Royal Decree Law 2/2012, which establishes the new requirements for provisions for real estate assets in the Spanish financial system, the Bank announced that the amount that Grupo Santander needed to cover to meet the 31% 31% requirements was EUR 6,100 million. 10% 2008 2009 2010 2011 170 ANNUAL REPORT 2011
  • 173.
    Informe_Gestion Riesgos 2011_ENG_V17:esp28/02/12 11:18 Página 171 Analysis of the mortgage portfolio in the UK The following table shows the distribution by type of loan: As well as the risk portfolio in Spain, of note in standardised risks and because of its importance in Grupo Santander’s total Portfolio of residential mortagages lending is the UK mortgage portfolio. Million euros This portfolio consists of first home mortgages distributed in UK December 2011 territory, as there are no operations that entail second or % of total UK successive charges on mortgaged properties. Portfolio portfolio Residential mortgages 198,789 82.1 Most of the mortgages are in Greater London, where housing prices are more stable even during a period of economic First Time Buyer 33,010 13.6 slowdown. Mover 71,295 29.4 All the properties are assessed by authorised valuers before each Remortgage 94,484 39.0 operation is approved, in accordance with the principles First time buyer:customers who buy a home for the first time. established by the Group for risk management and in line with Mover: customers who change home with or without changing the bank that granted the mortgage. the methodology defined by the Royal Institution of Chartered Remortgage: customers who transfer their mortgage from another bank. Surveyors. An additional indicator of the portfolio’s good performance is The portfolio performed favourably during 2011. Its NPL ratio was the small volume of foreclosed homes (EUR 160 million at the 1.46% (1.41% in 2010), the result of both the constant end of 2011, only 0.07% of the total mortgage exposure). monitoring and control as well as the strict credit policies which Efficient management of these cases and the existence of a include, among other measures, maximum loan-to-value criteria dynamic market for this type of property which enables sales to in relation to properties in guarantee. On the basis of these take place in a short period contributed to the good results. policies, since 2009 no mortgages have been granted with LTVs of more than 100%. The average LTV is 53%. E. Control function The management process is also aided during the various There is no risk appetite for loans considered as high risk phases of the risk cycle by the function of control. This provides (subprime mortgages). The credit risk policies explicitly forbid a global vision of the Group’s portfolio of loans with the this type of loan, establishing tough requirements for credit sufficient level of detail, enabling the current risk position and its quality, both the operations as well as customers. Buy-to-let evolution to be assessed. mortgages with a higher risk profile account for a small percentage of the total volume of the portfolio (barely 1%). The objective of the control model is to assess the risk of solvency assumed in order to detect focuses of attention and The following charts give the structure in LTV terms of and the propose measures that tend to correct eventual deterioration. It distribution in terms of the income multiple: is therefore vital that to the control activity in the proper sense of the word is added an analysis component that facilitates proactivity regarding early detection of problems and the Loan to value (1) Average: 52.6% subsequent recommendation of action plans. < 75% 61.4% The evolution of risk with regard to budgets, limits and 75% - 90% standards of reference is constantly and systematically controlled > 90% and the impact in future situations evaluated, both exogenous as well as those arising from strategic decisions, in order to 12.8% establish measures that put the profile and volume of the portfolio of risks within the parameters set by the Group. 25.7% The control function is conducted by assessing risks from various perspectives and establishing as the main elements control by countries, business areas, management models, products and processes. This facilitates the detection of focuses of specific attention for decision-making. The control processes, which ensure compliance with the Income multiple Average: 3.1 Group’s corporate criteria in credit risk management, were < 3.0 strengthened in 2011. Meanwhile, the homogeneous nature of 3.0 - 3.99 34.5% the control model enabled standards in the flow of information > 4.0 to be established, their analysis by portfolios and monitoring of the main management metrics, in an exercise of coordination between the global area and the various units in which programmes were created with specific targets that enable the situation of each of the units to converge with the global 30.6% 34.9% model. In 2006, under the corporate framework established in the Group for complying with the Sarbanes-Oxley Act, a tool was (1) Indexed created in the Group’s intranet to document and certify all sub (*) Loan to value: Relation between the amount of the loan and the appraised value of the mortgaged processes, operational risks and controls that mitigate them. The property. Income multiple (opposite of affordability rate): Relation between the total original amount of the mortgage and the borrower’s gross annual income. The figures are only for the loans granted Risks Division, as part of the Group, evaluates every year the in the year. efficiency of internal control of its activities. ANNUAL REPORT 2011 171
  • 174.
    Informe_Gestion Riesgos 2011_ENG_V17:esp28/02/12 11:18 Página 172 Analysis of scenarios The EBA’s stress test analysed the level of capital that banks would As part of its management of monitoring and continuous reach in 2012 and their evolution since the end of 2010 (the control, the Group conducts simulations of its portfolio using starting point) in two types of scenario: a benchmark scenario and adverse scenarios and stress tests in order to assess the Group’s an adverse one. The exercise assumed that the balance sheet solvency in the face of certain situations in the future. These remained without changes over its starting position, the business simulations cover all the Group’s most relevant portfolios and model remained constant by countries and product strategies, and are done systematically using a corporate methodology which: there are no acquisitions or disposals. It therefore does not reflect the estimate that the bank’s management could have of the • Determines the sensitivity of risk factors (PD, LGD) to certain development of the Group’s results over the next two years. The macroeconomic variables. banks submitted to the test had to have, initially, a Tier 1 core ratio • Defines reference scenarios (at the global level as well as for of at least 5% in the most adverse scenario. each of the Group’s units). In the case of Santander, the stress tests showed the strength and • Identifies rupture scenarios (levels as of which the sensitivity validity of its business model. The results published on July 15, of risk factors to macroeconomic variables is more 2011 show that even in the most adverse scenario, the Group is accentuated) and the distance of these scenarios from the able to generate profits, distribute dividends and continue to current situation and the reference scenarios. generate capital. Santander will end 2012 with a Tier 1 capital of • Estimates the expected loss of each scenario and the 8.4% in the most adverse scenario and 8.9% including generic evolution of the risk profile of each portfolio in the face of provisions. movements in certain macroeconomic variables. The simulation models use the data of a complete economic These results compare very well with those of our competitors. cycle to measure the performance of risk factors in the face of Santander will be the bank that will post the most profits in the changes in macroeconomic variables. most adverse scenario (EUR 8,092 million in 2011 and 2012). The scenarios take into account the vision of each unit as well as F. Recovery activity the global vision. The macroeconomic variables include: Recovery management is a strategic element in the bank’s risk management. • The unemployment rate • Property prices In order to carry out this function, which is essentially a business activity, the bank has a corporate model of management which • GDP sets the guidelines and general rules to be applied in the • Interest rates countries where it operates, with the necessary adjustments on • Inflation the basis of local business models and the economic situation of The analysis of scenarios enables senior management to better the respective environments. understand the foreseeable evolution of the portfolio in the face of This corporate model basically establishes procedures and market conditions and changing situations, and it is a key tool for management circuits on the basis of customers’ features, assessing the sufficiency of the provisions established for stress making a distinction between massive level management with scenarios. the use of multiple channels and a more personalised or The analysis of the baseline and acid scenarios for the whole segmented management with specific managers assigned. Group and for each unit, with a time frame of three years, shows As a result, with this segmentation in management, various the strength of the balance sheet to different market and mechanisms were established to ensure recovery management macroeconomic situations. of customers in non-payment situations from the earliest phases EU Stress test exercises to the writing off of the debt. The sphere of action of the In order to assess the solvency and resistance of banks to an recovery function begins the very first day of non-payment of adverse scenario, the European Banking Authority (EBA), in the loan and ends when it has been paid or reclassified. cooperation with the Bank of Spain, the European Central Bank, Preventative management is conducted in some segments the European Commission and the European Systemic Risk before a non-payment situation arises. Board, conducted in 2011 a stress test on 91 banks representing 65% of the total assets of the European banking system. Stress test results. Grupo Santander Baseline scenario Adverse scenario Sufficiency of capital (million euros) 2011 2012 2011 2012 Risk weighted assets (constant balance sheet assumption) 613,279 622,571 626,921 650,979 Common equity according to EBA definition 47,002 59,374 45,053 54,364 Of which ordinary shares subscribed by the government 0 0 0 0 Other existing subscribed government capital (before December 31, 2010) 0 0 0 0 Core Tier 1 capital (constant balance sheet assumption) 47,002 59,374 45,053 54,364 Tier 1 ratio (%) 7.7% 9.5% 7.2% 8.4% Results (million euros) Net interest income 27,918 29,005 27,919 27,168 Trading income 895 895 352 352 Other operating income 1,530 1,128 2,323 2,355 Operating profit before impairments 21,954 22,639 22,207 21,487 Operating profit after impairments and other losses from the stress test 11,192 14,280 7,205 6,716 Other income -1,838 -1,797 -2,114 -1,708 Net profit after tax 7,246 9,545 4,088 4,004 Source: European Banking Authority (EBA). 172 ANNUAL REPORT 2011
  • 175.
    Informe_Gestion Riesgos 2011_ENG_V17:esp28/02/12 11:18 Página 173 Recovery activity, understood as an integral business, is 3.6 Other standpoints supported by constant reviewing of the management processes and methodology. It is backed by all the Group’s capacities and of credit risk with the participation and cooperation of other areas (commercial, resources, technology, human resources) as well as There are spheres and/or specific points in credit risk that the development of technology solutions to improve deserve specialised attention and which complement global effectiveness and efficiency. management. In recoveries we have a practical and hands on training plan A. Risk of concentration which deepens knowledge, facilitates the exchange of ideas and Control of risk concentration is a vital part of management. The best practices and professionally develops teams, while always Group continuously tracks the degree of concentration of its striving to integrate recovery activity into the Group’s ordinary credit risk portfolios using various criteria: geographic areas and and commercial activity. countries, economic sectors, products and groups of clients. During 2011, the indicators for management of loan recoveries underscored the difficult economic situation of some countries The board’s risk committee establishes the policies and reviews where the Group operates, with a change in net entries that the appropriate exposure limits for appropriate management of was higher than in 2010, mainly due to the local economic the degree of concentration of credit risk portfolios. conditions and, consequently, greater difficulty in obtaining The Group is subject to the Bank of Spain regulation on large recovery results in these units. The management capacity has risks. In accordance with Circular 3/2008 (on determining and been ensured and new strategies implemented to increase the control of minimum equity) and subsequent changes, the value recovery of non-performing loans. of all the risks that a credit institution contracts with the same Nevertheless, the results for the recovery of written-off assets person, entity or economic group, including that in the part were very good. Action plans were put in place in countries which is non-consolidatable, cannot exceed 25% of its equity. designed to improve this line of activity, with proactive strategies The risks maintained with the same person, whether an defined at the level of each customer and type of portfolio. This individual or a company or an economic group, are considered made possible a greater degree of recovery in this line of activity large risks when their values exceeds 10% of the equity of the than in previous years, and in relation to the evolution in the credit institution. The exception from this treatment are declaration of write offs. exposures to OECD governments and central banks. As a way of early recognition and rigorous management of At December 31, 2011, there were several financial groups that problematic loans in the portfolio, Grupo Santander takes into exceeded 10% of shareholders’ funds: three EU financial consideration portfolio sales as a possible alternative solution to institutions, two US financial entities and an EU central be assessed. This activity, via a process of evaluation and counterparty entity. After applying risk mitigation techniques commercialisation, enables the recovery results with recurrence and the rules for large risks, all of them were below 3.5% of vocation to be accelerated. eligible equity. In addition, portfolio sales provide the following advantages: At December 31, 2011, the 20 largest economic and financial • Avoid possible future deteriorations from changes in the groups, excluding AAA governments and sovereign securities macroeconomic environment. denominated in local currency, represented 5.0% of the • Avoid costs with low return. outstanding credit risk of the Group’s clients (lending plus • Reduce or adjust structures. guarantees), which compares favourably with the 6% in 2010. • Improve liquidity for other businesses. The distribution of the portfolio of companies by sectors is • Ensure revenue recurrence in case of sales flows. adequately diversified. The chart below shows the distribution of the credit exposure in the Group’s main units. The Bank has specialised teams in this activity. They are responsible for relations with investors, identification of the portfolio, valuation (and subsequent back testing), management of the back office, as well as evaluating the legal and fiscal contingencies. In 2010, the creation of units specialised in this management was strengthened in the Group, particularly in Spain. ANNUAL REPORT 2011 173
  • 176.
    Informe_Gestion Riesgos 2011_ENG_V17:esp28/02/12 11:18 Página 174 Distribution of risk by sector Grupo Santander The Group’s risks division works closely with the financial % division to actively manage credit portfolios. Its activities include reducing the concentration of exposures through various techniques such as using credit derivatives and securitisation to optimise the risk-return relation of the whole portfolio. Individuals 56% Real estate activity 8% Commerce and repairs 5% Transport and communications 4% Construction and public works 4% Elect. Gas and water prod. and distr. 3% Other business Rest 17% services 3% *Rest includes sectors with concentration below 2%. OTC derivatives: distribution by equivalent credit risk and market value including mitigation impact Million euros at December 31, 2011 Total market value Total ECR including mitigation impact(*) Trading Hedging Total Trading Hedging Total CDS Protection Acquired 397 117 515 1,627 79 1,706 CDS Protection Sold 34 0 34 -1,735 -68 -1,803 TRS Total Return Swap 0 0 0 0 0 0 CDS Options 0 0 0 0 0 0 Total credit derivatives 431 118 549 -107 10 -97 Equity Forwards 1 118 119 0 -8 -8 Equity Options 512 778 1,290 -107 -245 -352 Equity Swaps 0 643 643 0 340 340 Equity Spot 0 0 0 0 0 0 Total equity derivatives 513 1,539 2,052 -107 88 -19 Fixed-income Forwards 30 99 130 0 75 75 Fixed-income Options 0 0 0 0 0 0 Fixed-income Spot 0 0 0 0 0 0 Total fixed income derivatives 30 99 130 0 75 75 Asset Swaps 1,312 2,360 3,672 -22 311 289 Exchange-rate Options 302 264 566 -168 -24 -192 Exchange-rate Swaps 4,346 11,655 16,001 437 1,256 1,693 Other Exchange-rate Derivatives 2 2 4 -1 0 -1 Total exchange rates 5,962 14,281 20,243 246 1,543 1,789 Asset Swaps 0 412 412 0 134 134 Call Money Swaps 349 52 401 -187 14 -173 IRS 20,432 16,596 37,028 562 5,186 5,748 Forward Interest Rates 16 21 37 -25 -19 -43 Other Interest-rate Derivatives 1,215 1,574 2,789 871 -848 23 Interest Rate Structures 229 599 828 135 -434 -298 Total interest-rate derivatives 22,240 19,254 41,494 1,357 4,034 5,391 Commodities 287 111 398 235 8 243 Total commodity derivatives 287 111 398 235 8 243 Total otc derivatives 29,464 35,402 64,866 1,623 5,759 7,381 Collateral 0 -11,508 -11,508 Total 29,464 23,894 53,358 (*) Market value used to take into account the impact of mitigating agreements in order to calculate the exposure by counterparty risk. 174 ANNUAL REPORT 2011
  • 177.
    Informe_Gestion Riesgos 2011_ENG_V17:esp28/02/12 11:18 Página 175 B. Credit risk by activities which, once the expected loss is subtracted, constitutes the in financial markets economic capital, net of guarantees and recovery). This section covers credit risk generated in treasury activities The total exposure to credit risk from activities in the financial with clients, mainly with credit institutions. This is developed markets was 59.6% with credit institutions. By product type, the through financing products in the money market with different exposure to derivatives was 59.4%, mainly products without financial institutions, as well as derivatives to provide service to options, and 40.6% to liquidity products and traditional the Group’s clients. financing. Risk is controlled through an integrated system and in real time Derivative operations are concentrated in high credit quality which enables us to know at any moment the exposure limit counterparties; 56.6% of risk with counterparties has a rating available with any counterparty, in any product and maturity equal to or more than A. The total exposure in 2011 in terms of and in all of the Group’s units. equivalent credit risk amounted to EUR 53,358 million. Risk is measured by its prevailing market as well as potential value (value of risk positions taking into account the future variation of underlying market factors in contracts). The equivalent credit risk (ECR) is the net replacement value plus the maximum potential value of these contracts in the future. The capital at risk or unexpected loss is also calculated (i.e. the loss Notional OTC derivative products by maturity Million euros at December 31, 2011 1 year 1-5 years 5-10 years Over 10 years Total REC T H Total T H Total T H Total T H Total T H Total CDS Protection Acquired 19 9 28 226 11 237 27 58 85 126 39 166 397 117 515 CDS Protection Sold 8 0 8 17 0 17 9 0 9 0 0 0 34 0 34 TRS Total Return Swap 0 0 0 0 0 0 0 0 0 0 0 0 0 0 0 CDS Options 0 0 0 0 0 0 0 0 0 0 0 0 0 0 0 Total credit derivatives 26 9 35 243 11 254 36 58 94 126 40 166 431 118 549 Equity Forwards 1 118 119 0 0 0 0 0 0 0 0 0 1 118 119 Equity Options 314 319 633 196 392 588 3 58 61 0 9 9 512 778 1,290 Equity Swaps 0 296 296 0 344 344 0 3 3 0 0 0 0 643 643 Equity Spot 0 0 0 0 0 0 0 0 0 0 0 0 0 0 0 Total equity derivatives 315 733 1,048 196 736 931 3 61 64 0 9 9 513 1,539 2,052 Fixed-income Forwards 30 99 129 0 0 0 0 0 0 0 0 0 30 99 130 Fixed-income Options 0 0 0 0 0 0 0 0 0 0 0 0 0 0 0 Fixed-income Spot 0 0 0 0 0 0 0 0 0 0 0 0 0 0 0 Total fixed income derivatives 30 99 129 0 0 0 0 0 0 0 0 0 30 99 130 Asset Swaps 985 1,902 2,887 323 442 765 4 16 20 0 0 0 1,312 2,360 3,672 Exchange-rate Options 211 254 465 90 11 101 0 0 0 0 0 0 302 264 566 Exchange-rate Swaps 1,549 1,782 3,331 1,666 5,821 7,487 1,132 2,045 3,536 0 1,647 1,647 4,346 11,655 16,001 Other exchange-rate Derivatives 2 2 4 0 0 0 0 0 0 0 0 0 2 2 4 Total exchange rates 2,747 3,941 6,688 2,079 6,274 8,353 1,136 2,421 3,556 0 1,647 1,647 5,962 14,281 20,243 Asset Swaps 0 2 2 0 36 36 0 77 77 0 297 297 0 412 412 Call Money Swaps 167 27 195 156 12 168 12 12 24 14 0 14 349 52 401 IRS 353 636 989 4,169 5,120 9,289 5,201 3,871 9,072 10,079 6,970 17,678 20,432 16,596 37,028 Forward Interest Rates 16 21 37 0 0 0 0 0 0 0 0 0 16 21 37 Other Interest-rate Derivatives 1 107 108 21 468 488 117 468 584 1,076 531 1,608 1,215 1,574 2.789 Interest Rate Structures 35 57 92 83 106 189 25 31 56 85 405 490 229 599 828 Total interest-rate derivatives 573 850 1,422 4,429 5,742 10,171 5,354 4,460 9,814 11,884 8,202 20,087 22,240 19,254 41,494 Commodities 122 45 166 146 66 212 20 0 20 0 0 0 287 111 398 Total Commodity derivatives 122 45 166 146 66 212 20 0 20 0 0 0 287 111 398 Total OTC derivatives 3,813 5,676 9,489 7,092 12,829 19,921 6,548 7,000 13,549 12,011 9,897 21,908 29,464 35,402 64,866 Collateral 0 -11,508 -11,508 Total 29,464 23,894 53,358 H = Hedging T = Trading ANNUAL REPORT 2011 175
  • 178.
    Informe_Gestion Riesgos 2011_ENG_V17:esp28/02/12 11:18 Página 176 Distribution of risk in OTC derivatives The distribution of risk in derivatives by type of counterparty was by rating of counterparty 46% with banks, 33% with large companies and 9% with SMEs. Rating % As regards the geographic distribution of risk, 13% is with AAA 11.7 Spanish counterparties, 18% with UK counterparties (mainly Santander UK’s operations), 30% the rest of Europe, 10% the AA 9.8 US and 14% Latin America. A 35.1 Actividad in credit derivatives BBB 19.4 Grupo Santander uses credit derivatives to cover loans, BB 21.0 customer business in financial markets and, to a lesser extent, B 2.3 within trading operations. The volume of this activity is small Rest 0.7 compared to that of our peers and, moreover, is subject to a solid environment of internal controls and minimising operational risk. Distribution of risk in OTC derivatives The risk of these activities is controlled via a broad series of by type of counterparty limits such as VaR, nominal by rating, sensitivity to the spread by rating and name, sensitivity to the rate of recovery and to Banks 46% correlation. Jump-to-default limits are also set by individual Pub. & priv. inst. name, geographic area, sector and liquidity. 2% In notional terms, the CDS position incorporates EUR 57,220 Companies 9% million of acquired protection and EUR 51,212 million of sold protection. Securitisation 4% At December 31, 2011, for the Group’s trading activity, the Sovereign 6% sensitivity of lending to increases in spreads of one basis point was minus EUR 0.3 million, and the average VaR during the year Corporate 33% was EUR 10.6 million. Both were significantly lower than in 2010 (sensitivity of –EUR 1.5 million and average VaR of EUR 17.2 million). Distribution of risk in OTC derivatives by geographic areas C. Country risk Country risk is a credit risk component in all cross-border credit Rest of Europe 30% operations for circumstances different to the usual commercial risk. Its main elements are sovereign risk, the risk of transfer and other risks which could affect international financial activity (wars, natural disasters, balance of payments crisis, etc). UK 18% The exposure susceptible to country-risk provisions at the end of Spain 13% 2011 was EUR 380 million, of which EUR 19 million corresponded to intragroup operations. At the end of 2010, the total country risk in need of provisions was EUR 435 million. Total provisions in 2011 stood at EUR 55 million compared with Others 15% Latin American EUR 69 million in 2010. 14% The country risk management principles continued to follow US10% maximum prudence criteria, assuming country risk in a very selective way in operations clearly profitable for the Group, and which strengthen the global relationship with customers. Evolution of country-risk subject to provisions and provisions assigned Million euros 5,422 1,437 977 971 916 810 710 444 435 380 DEC 02 DEC 03 DEC 04 DEC 05 DEC 06 DEC 07 DEC 08 DEC 09 DEC 10 DEC 11 176 ANNUAL REPORT 2011
  • 179.
    Informe_Gestion Riesgos 2011_ENG_V17:esp28/02/12 11:18 Página 177 D. Sovereign risk E. Environmental risk As a general criterion, sovereign risk is that contracted in Analysis of the environmental risk of credit operations is one of transactions with a central bank (including the regulatory cash the main aspects of the strategic plan of corporate social reserve requirement), the issuer risk of the Treasury or the responsibility. It revolves around the following two large points: Republic (portfolio of state debt) and that arising from • Equator principles: this is an initiative of the World Bank’s operations with public institutions with the following features: International Financial Corporation. It is an international their funds only come from institutions directly integrated into standard for analysing the social and environmental impact of the state sector; and their activities are of a non-commercial project finance operations. The assumption of these principles nature. represents a commitment to evaluating, on the basis of At December 31, 2011, according to Santander’s criteria, sequential methodology, the social and environmental risks of Europe accounted for 56.3% of total risk, Latin America 35.4%, the projects financed: the US 7.3% and others 1.0%. Of note in Europe were Spain • – For operations with an amount equal to or more than $10 (29.8%), the UK (16.1%) and in Latin America Brazil (24.3%) million, an initial questionnaire is filled out, of a generic and Mexico (6.6%). Total risk was higher than in 2010 largely nature, designed to establish the project’s risk in the socio- because of the increase in sovereign risk positions with Spain, environmental sphere (according to categories A, B and C or Germany, the US and Mexico, and the incorporation of the greater to lower risk, respectively) and the operation’s positions of Banco Zachodni (concentrated in Poland) to the degree of compliance with the Equator Principles. perimeter of consolidation, which were partly offset by a reduction of positions with the UK and Switzerland. • – For those projects classified within the categories of greater risk (categories A and B), a more detailed questionnaire has As regards the European peripheral countries, their share of the to be filled out, adapted according to the sector of activity. total portfolio is low: Portugal (2.0%), Italy (0.4%), Ireland • – According to the category and location of the projects a (0.02%) and Greece (0.04%). social and environmental audit is carried out (by Latin America’s exposure to sovereign risk mainly comes from independent external auditors). Specific questionnaires have the obligations to which our subsidiary banks are subject for been developed for those sectors where the bank is most constituting certain deposits in the corresponding central banks active. The bank also gives training courses in social and as well as from fixed-income portfolios maintained as part of the environmental matters to risk teams as well as to those structural interest rate risk management strategy. These responsible for business. exposures are in local currency and are financed by locally • VIDA tool: used since 2004, its main purpose is to assess the captured customer deposits, also denominated in local currency. environmental risk of corporate clients, both current and The exposures to sovereign risk of Latin American issuers potential, through a system that classifies in seven categories denominated in currencies other than the official one of the each of the companies on the basis of the environmental risk country of issue amounted to EUR 2,462 million (3.5% of total contracted. In 2011, 39,575 companies were assessed by this sovereign risk with Latin American issuers). tool in Spain (total risk of EUR 59,770 million). Environmental risk classification Billion euros 30 25 20 15 10 5 0 VL L- L+ M- M+ H- H+ Note: VIDA companies assessed in the retail banking network in Spain. VB: very low; L: low; M: medium and A: high. Low or very low environmental risk accounts for 78.3% of total risk. In 2011, there was a sharp fall in medium environmental risk (54.4% less than in 2010). ANNUAL REPORT 2011 177
  • 180.
    Informe_Gestion Riesgos 2011_ENG_V17:esp28/02/12 11:18 Página 178 4. Market risk 4.1 Activities subject to The aim of financial management is to inject stability and recurrence into the net interest margin of commercial activity market risk and the Group’s economic value by maintaining appropriate levels of liquidity and solvency. The perimeter for measuring, controlling and monitoring the area of market risk covers those operations where equity risk is Each of these activities is measured and analysed with different assumed. This risk comes from the change in interest rates, tools in order to show in the most precise way their risk profile. exchange rates, shares, the spread on loans, raw material prices and from the volatility of each of these elements, as well as the liquidity risk of the various products and markets in which the Group operates. 4.2 Methodologies On the basis of the finality of the risk, activities are segmented in A. Trading Activity the following way: The standard methodology that Grupo Santander applied to trading activities during 2011 was Value at Risk (VaR), which a) Trading: this includes financial services for customers and the measures the maximum expected loss with a certain confidence buying and selling and positioning mainly in fixed-income, level and time frame. The standard for historic simulation is a equity and currency products. confidence level of 99% and a time frame of one day. Statistical b) Balance Sheet Management: Interest rate and liquidity risk adjustments are applied enabling the most recent developments arises from mismatches between maturities and repricing of that condition the levels of risk assumed to be efficiently and assets and liabilities. It also includes active management of quickly incorporated. A time frame of two years or at least 520 credit risk inherent in the Group’s balance sheet. days from the reference date of the VaR calculation is used.1 Two figures are calculated every day, one applying an c) Structural risks: exponential decline factor which accords less weight to the • Structural Exchange-Rate Risk/Hedging of Results: Exchange observations furthest away in time and another with the same rate risk, due to the currency in which the investment is weight for all observations. The reported VaR is the higher of made, both in companies that consolidate and do not the two. consolidate (structural exchange rate) and exchange rate risk arising from the hedging of future results generated in The VaR is not the only measure used. It is used because it is currencies other than the euro (hedging of results). easy to calculate and is a good reference for the Group’s level of risk. There are also other measures that allow greater control of • Structural equity: This covers equity stake investments in risks in all the markets where the Group operates. financial and non-financial companies that do not consolidate, generating risk in equities. They include analysis of scenarios which define alternatives for the performance of different financial variables and provide the The Treasury area is responsible for managing the taking of impact on results. These scenarios can replicate critical trading activity positions. developments or circumstances that happened in the past (such The Financial Management area is responsible for the centralised as a crisis) or determine plausible alternatives that are not management of these structural risks, applying standardised concerned with past events. A minimum of three types of methodologies, adapted to each market where the Group scenario are given: plausible, severe and extreme, and a VaR is operates. In the area of convertible currencies, financial obtained as well as a much fuller picture of the risk profile. management directly manages the parent bank’s risks and The market risk area, at the level of each unit and globally and coordinates management of the rest of the units which operate following the principle of independence of the business units, in these currencies. The management decisions for these risks carries out daily monitoring of positions, through an exhaustive are taken by each country’s ALCO committee and, in the last control of the changes that take place in the portfolios in order instance, by the markets committee of the parent bank. to detect possible new developments for immediate correction. The daily preparation of the income statement is an excellent indicator of risk levels, as it enables us to identify the impact of changes on financial variables in the portfolios. 1. Since October 2011, the stressed VaR began to be calculated with the same methodology as for the usual VaR, but using as a time frame a fixed frame of one year, which covers a representative market crisis period for the trading portfolio of each unit within the perimeter of the internal model . 178 ANNUAL REPORT 2011
  • 181.
    Informe_Gestion Riesgos 2011_ENG_V17:esp28/02/12 11:18 Página 179 Lastly, in order to control derivative activities and credit b) Net interest margin sensitivity (NIM) management, because of its atypical nature, specific measures The sensitivity of net interest margin measures the change in the are conducted daily. In the first case, sensitivity to the price short/medium term in the accruals expected over a particular movements of the underlying asset (delta and gamma), volatility period (12 months), in response to a shift in the yield curve. (vega) and time (theta) is controlled. In the second case, measures such as the spread sensitivity, jump-to-default, and It is calculated by simulating the net interest margin, both for a concentration of positions by rating levels, etc, are systematically scenario of a shift in the yield curve as well as for the current reviewed. situation. The sensitivity is the difference between the two margins calculated. As regards the credit risk inherent in trading portfolios and in line with the recommendations of the Basel Committee on c) Market value of equity sensitivity (MVE) Banking Supervision and prevailing regulations, an additional This is an additional measure to the sensitivity of the net interest measurement began to be calculated (incremental risk charge, margin. IRC), in order to cover the risk of default and rating migration It measures the interest risk implicit in net worth (equity) on the that is not adequately captured in the VaR, via changes in basis of the impact of a change in interest rates on the current lending spreads. The controlled products are basically fixed-rate values of financial assets and liabilities. bonds, both public and private sector, derivatives on bonds (forwards, options, etc) and credit derivatives (credit default d) Value at Risk (VaR) swaps, asset backed securities, etc). The method for calculating The Value at Risk for balance sheet activity and investment the IRC is based on direct measurements of the tails of the portfolios is calculated with the same standard as for trading: distribution of losses to the appropriate percentile (99.9%). The maximum expected loss under historic simulation with a Monte Carlo methodology is used, applying a million confidence level of 99% and a time frame of one day. As for the simulations. trading portfolios, a time frame of two years, or 520 daily figures, is used, obtained from the reference date of the VaR B. Balance sheet management calculation back in time. Interest rate risk The Group analyzes the sensitivity of net interest margin and e) Analysis of scenarios market value of equity to changes in interest rates. This Two scenarios for the performance of interest rates are sensitivity arises from gaps in maturity dates and the review of established: maximum volatility and severe crisis. These interest rates in the different asset and liability items. scenarios are applied to the balance sheet, obtaining the impact on net worth as well as the projections of net interest margin On the basis of the positioning of balance sheet interest rates, for the year. as well as the situation and outlook for the market, the financial measures are agreed to adjust the positioning to that desired by Liquidity risk the bank. These measures range from taking positions in Liquidity risk is associated with the Group’s capacity to finance markets to defining the interest rate features of commercial its commitments, at reasonable market prices, as well as carry products. out its business plans with stable sources of funding. The Group permanently monitors maximum gap profiles. The metrics used by the Group to control interest rate risk in these activities are the interest rate gap, the sensitivity of net The measures used for liquidity risk control in balance sheet interest margin and of net worth to changes in interest rates, management are the liquidity gap, liquidity ratios, stress Value at Risk (VaR) and analysis of scenarios. scenarios and contingency plans. a) Interest rate gap of assets and liabilities a) Liquidity gap Interest rate gap analysis focuses on lags or mismatches The liquidity gap provides information on contractual and between changes in the value of asset, liability and off-balance expected cash inflows and outflows for a certain period of time, sheet items. It provides a basic representation of the balance for each of the currencies in which the Group operates. The gap sheet structure and allows for the detection of interest rate risk measures the net need or net excess of funds at a particular by concentration of maturities. It is also a useful tool for date, and reflects the level of liquidity maintained under normal estimating the impact of eventual interest rate movements on market conditions. net interest margin or equity. Two types of liquidity gap analysis are made, on the basis of the All on- and off-balance sheet items must be disaggregated by balance sheet item: their flows and looked at in terms of repricing/maturity. In the case of those items that do not have a contractual maturity, an 1. Contractual liquidity gap: All on-and off-balance sheet internal model of analysis is used and estimates made of the items are analysed provided they contribute cash flows placed in duration and sensitivity of them. the point of contractual maturity. For those assets and liabilities without a contractual maturity, an internal analysis model is used, based on statistical research of the historical series of products, and which determines what we call the stability and instability impact for liquidity purposes. 2. Operational liquidity gap: This is a scenario in normal conditions of liquidity profile, as the flows of the balance sheet items are placed in the point of probable liquidity and not in the point of contractual maturity. In this analysis defining the behaviour scenario —renewal of liabilities, discounts in sales of portfolios, renewal of assets— is the fundamental point. ANNUAL REPORT 2011 179
  • 182.
    Informe_Gestion Riesgos 2011_ENG_V17:esp28/02/12 11:18 Página 180 b) Liquidity ratios C. Structural exchange-rate risk/Hedging of The liquidity coefficient compares liquid assets available for sale results/Structural equity (after applying the relevant discounts and adjustments) with These activities are monitored by position measures, VaR and total liabilities to be settled, including contingencies. This results. coefficient shows, for currencies that cannot be consolidated, the level of immediate response to firm commitments. D. Additional measures Net accumulated illiquidity is defined as the 30-day accumulated Back-testing gap obtained from the modified liquidity gap. The modified Back-testing is an a posteriori comparative analysis between contractual liquidity gap is drawn up on the basis of the Value at Risk (VaR) estimates and the “clean” daily results contractual liquidity gap and placing liquid assets in the point of actually generated (results of the portfolios at the end of the day settlement or repos and not in their point of maturity. This valued at the next day’s prices). The purpose of these tests is to indicator is calculated for each of the main currencies. verify and measure the precision of the models used to calculate VaR. In addition, other ratios or metrics regarding the structural position of liquidity are followed: The back-testing analysis carried out by Grupo Santander complies, as a minimum, with the BIS recommendations • Loans/net assets. regarding the verification of the internal systems used to • Customer deposits, insurance and medium and long-term measure and manage market risks. In addition, back-testing financing/lending. includes the hypothesis test: tests of excess, normality, Spearman rank correlation, measures of excess average, etc. • Customer deposits, insurance and medium and long-term financing, shareholders’ funds and other liabilities/the sum of The valuation models are fine-tuned and tested regularly by a credits and fixed assets. specialized unit. • Short-term financing/net liabilities. Analysis of scenarios • Survival horizon. The potential impact on results of applying different stress scenarios on all the trading portfolios and using the same c) Analysis of scenarios/Contingency plan suppositions by risk factor is calculated and analysed regularly The Group’s liquidity management focuses on taking all the (at least every month). necessary measures to prevent a crisis. Liquidity crises, and their immediate causes, cannot always be predicted. Consequently, In addition, there are triggers for global scenarios, on the basis the Group’s contingency plans concentrate on creating models of the historic results of these scenarios and the capital of potential crises by analyzing different scenarios, identifying associated with the portfolio in question. If these triggers are crisis types, internal and external communications and individual surpassed those in charge of managing the portfolio are notified responsibilities. so that the pertinent measures can be taken. The results of stress exercises at the global level, as well as the possible The contingency plan covers the sphere of activity of a local unit excesses on the triggers are regularly reviewed by the global and of central headquarters. It specifies clear lines of committee of market risk, so that, if necessary, senior communication at the first sign of crisis and suggests a wide management can be informed. range of responses to different levels of crisis. Coordination with other areas As a crisis can occur locally or globally, each local unit must Every day work is carried out jointly with other areas to offset prepare a contingency financing plan. The contingency plan of the operational risk. This entails the conciliation of positions, each local unit must be communicated to the central unit at least risks and results. every six months so that it can be reviewed and updated. These plans, however, must be updated more frequently if market circumstances make it advisable. Lastly, Grupo Santander continues to actively participate in the process opened by the Basel Committee and other international institutions to strengthen the liquidity of banks 2, with a two- pronged approach: on the one hand, participating in calibrating the regulatory changes raised —basically, the introduction of two new ratios: Liquidity Coverage Ratio (LCR) and Net Stable Funding Ratio (NSFR)— and, on the other, being present in the different forums to discuss and make suggestions on the issue (European Banking Federation, etc), maintaining in both cases close co-operation with the Bank of Spain. 2. Basel III: International framework for liquidity risk measurement, standards and monitoring (Basel Committee on Banking Supervision, December 2010). 180 ANNUAL REPORT 2011
  • 183.
    Informe_Gestion Riesgos 2011_ENG_V17:esp28/02/12 11:18 Página 181 4.3. Control system 4.4. Risks and results in 2011 A. Definition of limits A. Trading activity The process of setting limits takes place together with the Quantitative analysis of VaR in 2011 budgetary process, and is the means used by the Group to The Group’s risk performance with regard to trading activity in establish the level of equity that each activity has available. The financial markets during 2011, as measured by VaR, was as process of definition of limits is dynamic, and responds to the follows: level of risk appetite considered acceptable by senior management. Evolution of VaR during 2011 Million euros. VaR at 99% with a time frame of one day B. Objectives of the structure of limits The structure of limits require a process that takes into account 34 the following aspects, among others: Max. (33.2) • Identify and define, efficiently and comprehensively, the main 30 types of risk incurred so that they are consistent with the management of business and with the strategy drawn up. 26 • Quantify and inform the business areas of the risk levels and profile that senior management believes can be assumed, in 22 order to avoid undesired risks. • Give flexibility to the business areas to build risk positions 18 efficiently and opportunely according to changes in the market, and in the business strategies, and always within 14 the risk levels regarded as acceptable by the entity. Min. (12.0) 10 • Allow the generators of business to assume prudent risks 03 Jan. 22 Jan. 10 Feb. 20 Mar. 08 Apr. 27 Apr. 16 May. 04 Jun. 23 Jun. 12 Jul. 31Jul. 19 Aug. 07 Sep. 26 Sep. 15 Oct. 03 Nov. 22 Nov. 11 Dec. 30 Dec. but sufficient to attain the budgeted results. • Define the range of products and underlying assets with which each treasury unit can operate, bearing in mind features such as the model and valuation systems, the liquidity of the tools used, etc. VaR during 2011 fluctuated between EUR 12 million and EUR 34 million. It rose as of the end of April to a maximum for the year of EUR 33.2 million on May 24, due to an increase in interest rate and exchange rate risk in Spain and Brazil. The increase in VaR during the first half of July was due to the rise in exchange rate risk and volatility in Brazil. As of then, dynamic management of portfolios, together with a reduction in exchange rate and interest rate risk in the treasuries of Madrid and Brazil, produced a downward path until the end of the year. The VaR reported as of November 15, 2011 excludes the risk from changes in the credit spreads of securitisations and portfolios affected by credit correlation. For regulatory reasons (BIS 2.5), these exposures are considered as banking book for capital purposes. This change caused a decline in risk in VaR terms, both at the total level as well as by credit spread. The average VaR of the Group’s trading portfolio in 2011 (EUR 22.4 million) was lower than in 2010 (EUR 28.7 million), even though volatility remained high in markets because of Europe’s sovereign debt crisis. Meanwhile, in relation to other comparable financial groups, the Group has a low trading risk profile. Dynamic management of it enables the Group to adopt changes of strategy in order to exploit opportunities in an environment of uncertainty. ANNUAL REPORT 2011 181
  • 184.