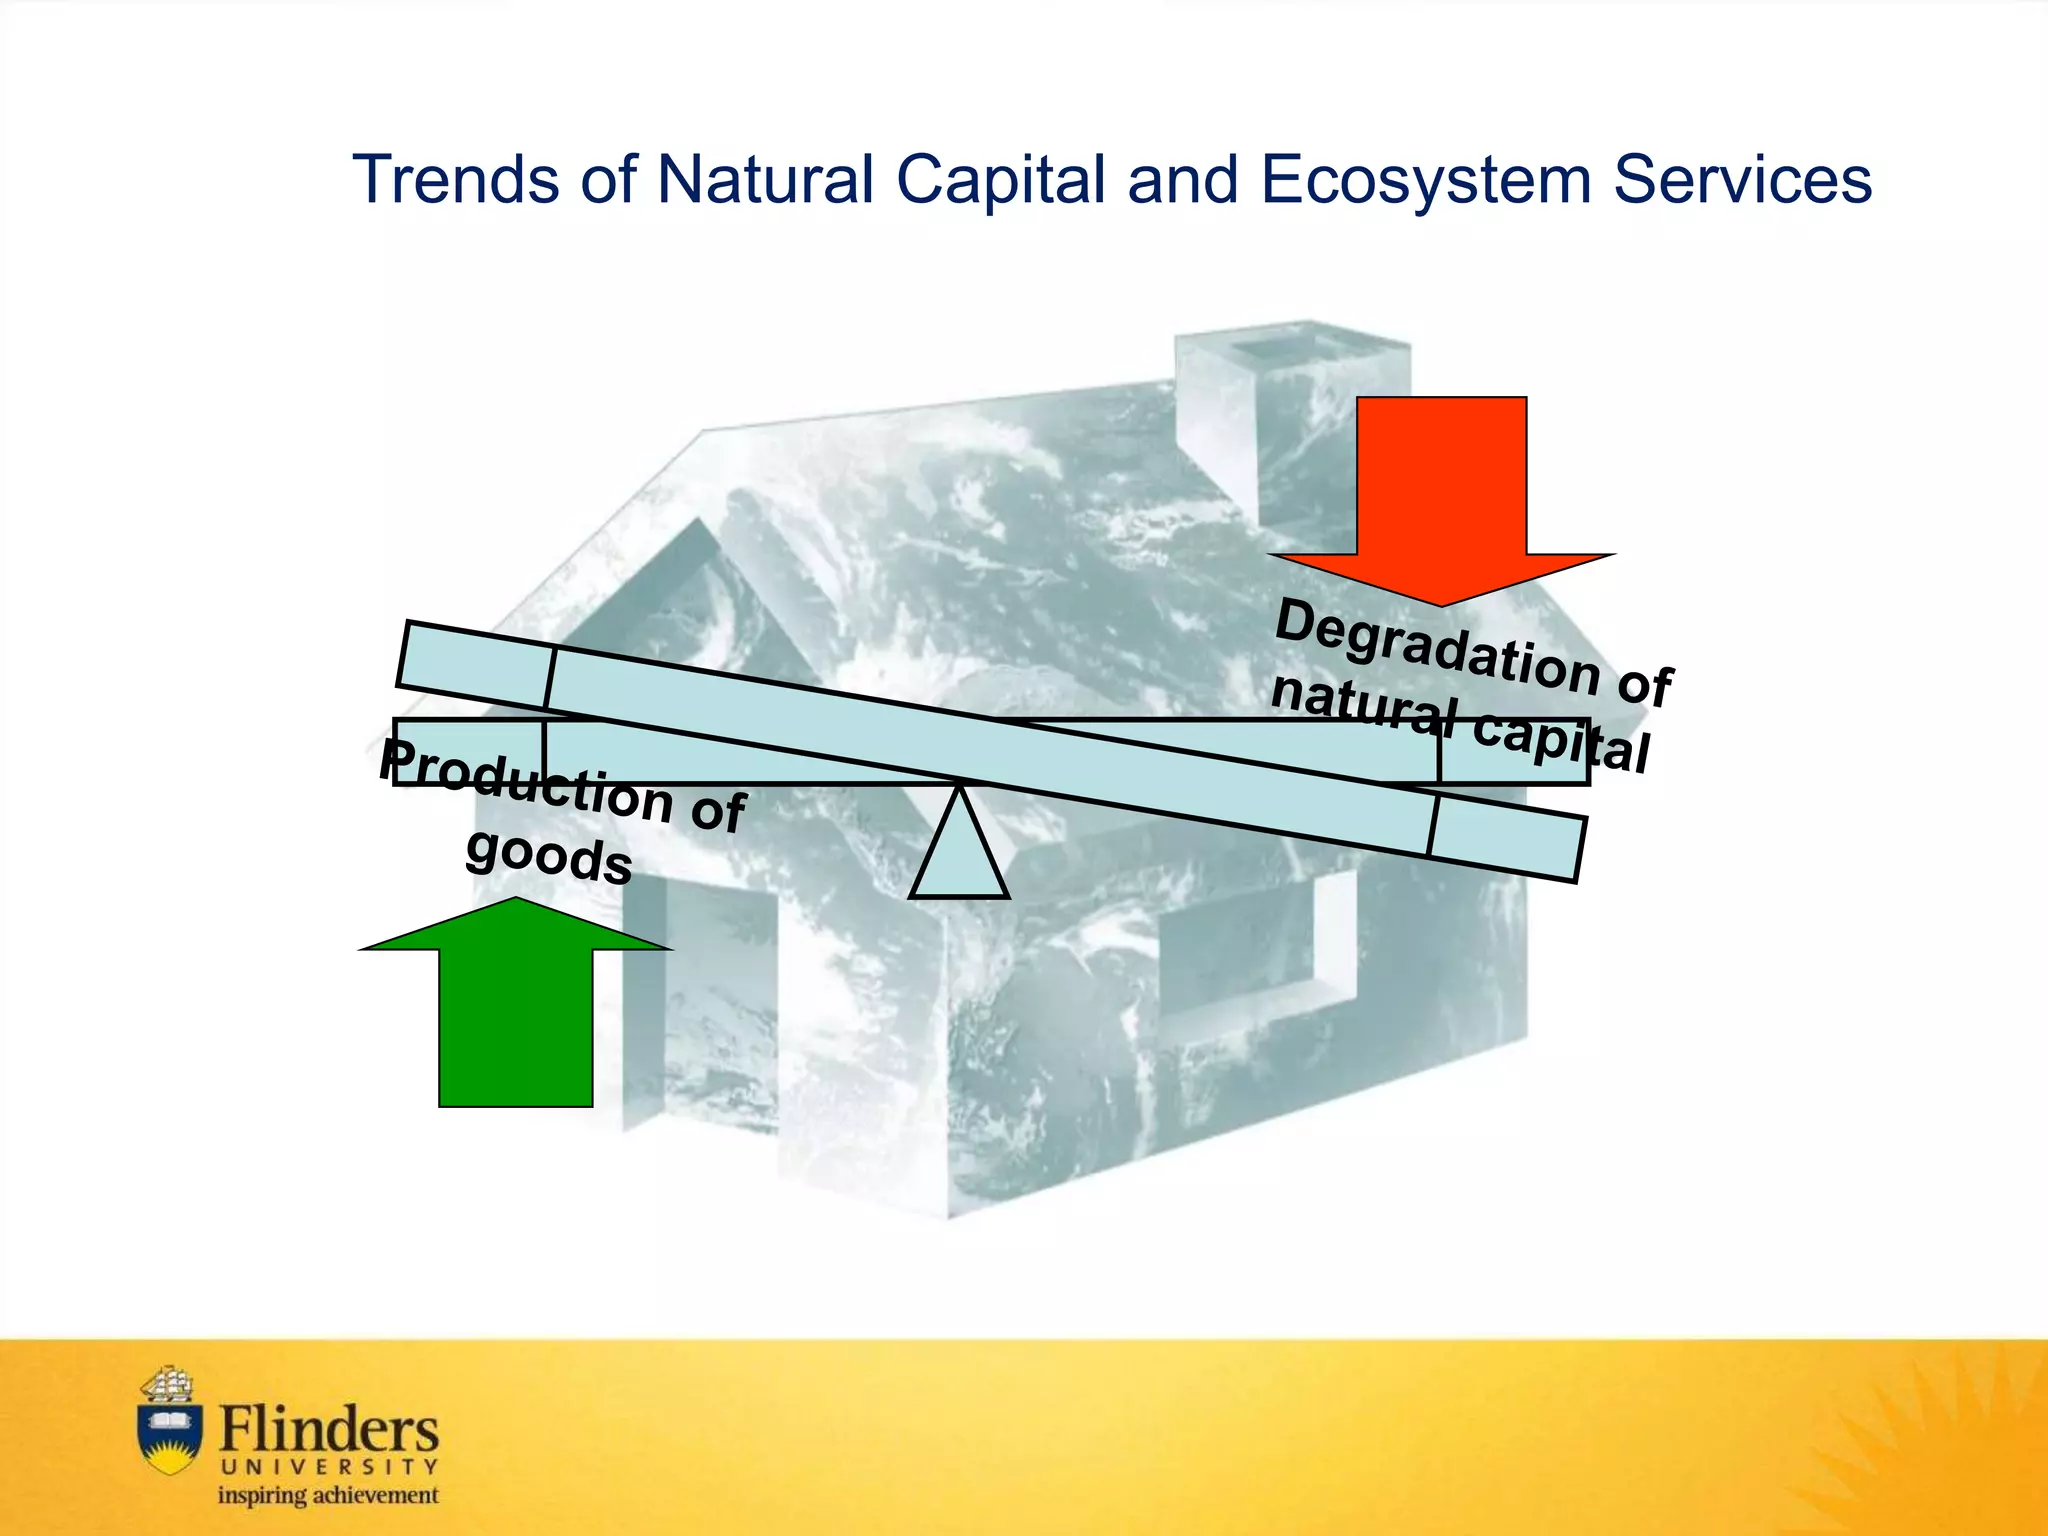
1) Agriculture is the largest industry globally but poses risks to ecosystems if ecosystem services are not incorporated into decision making.
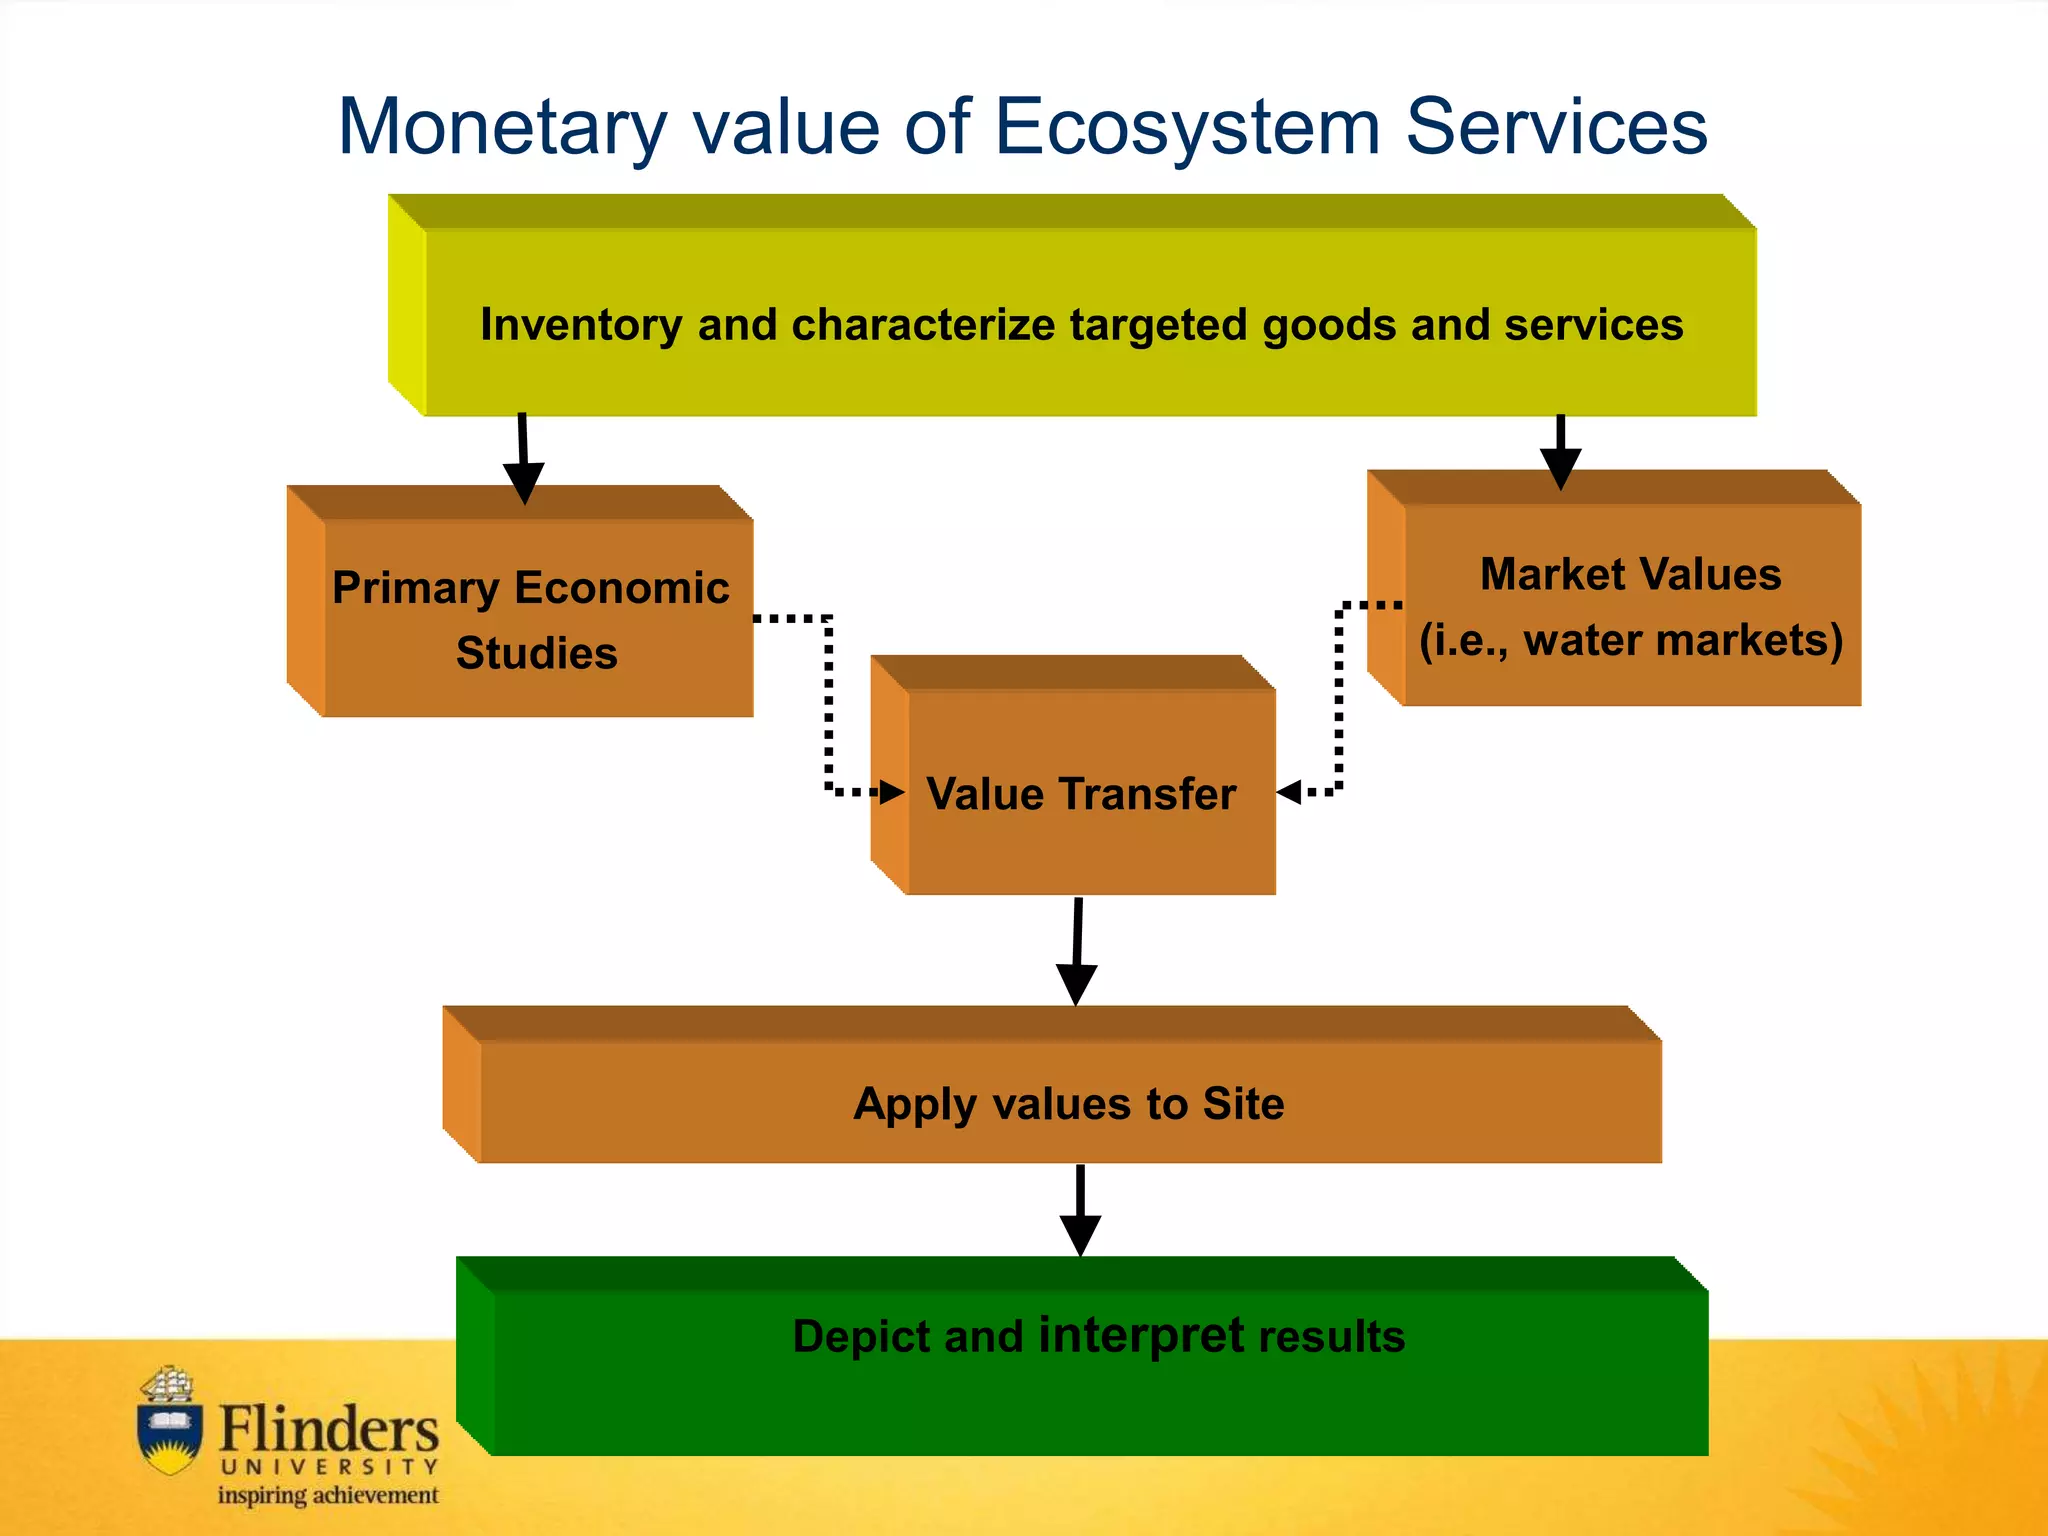
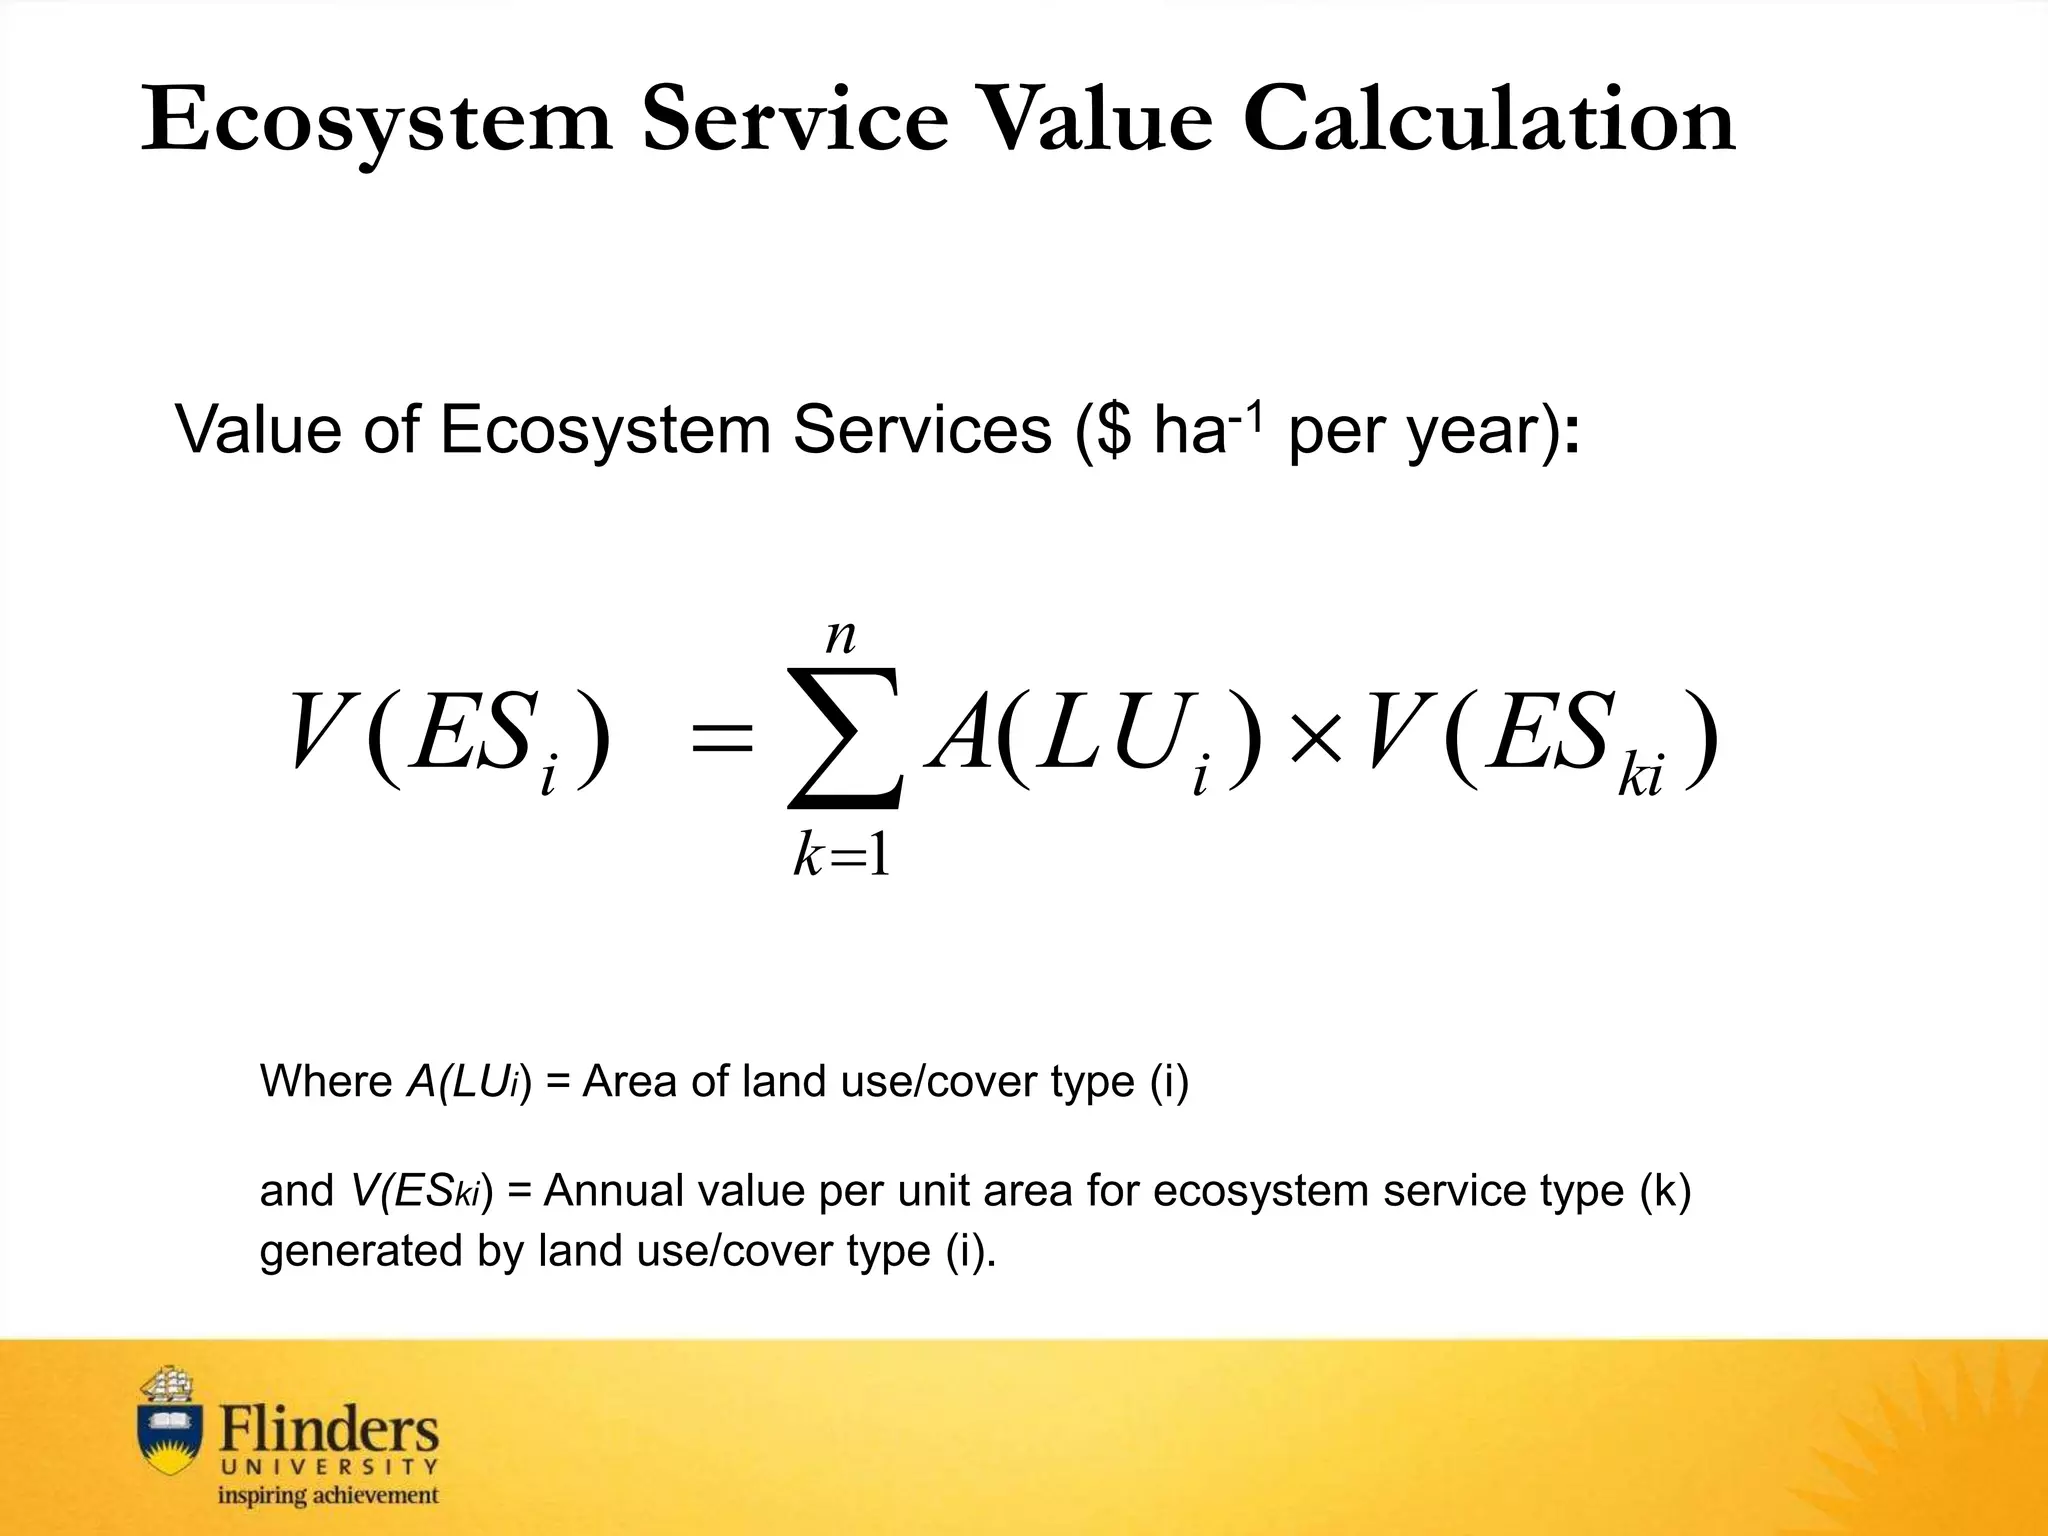
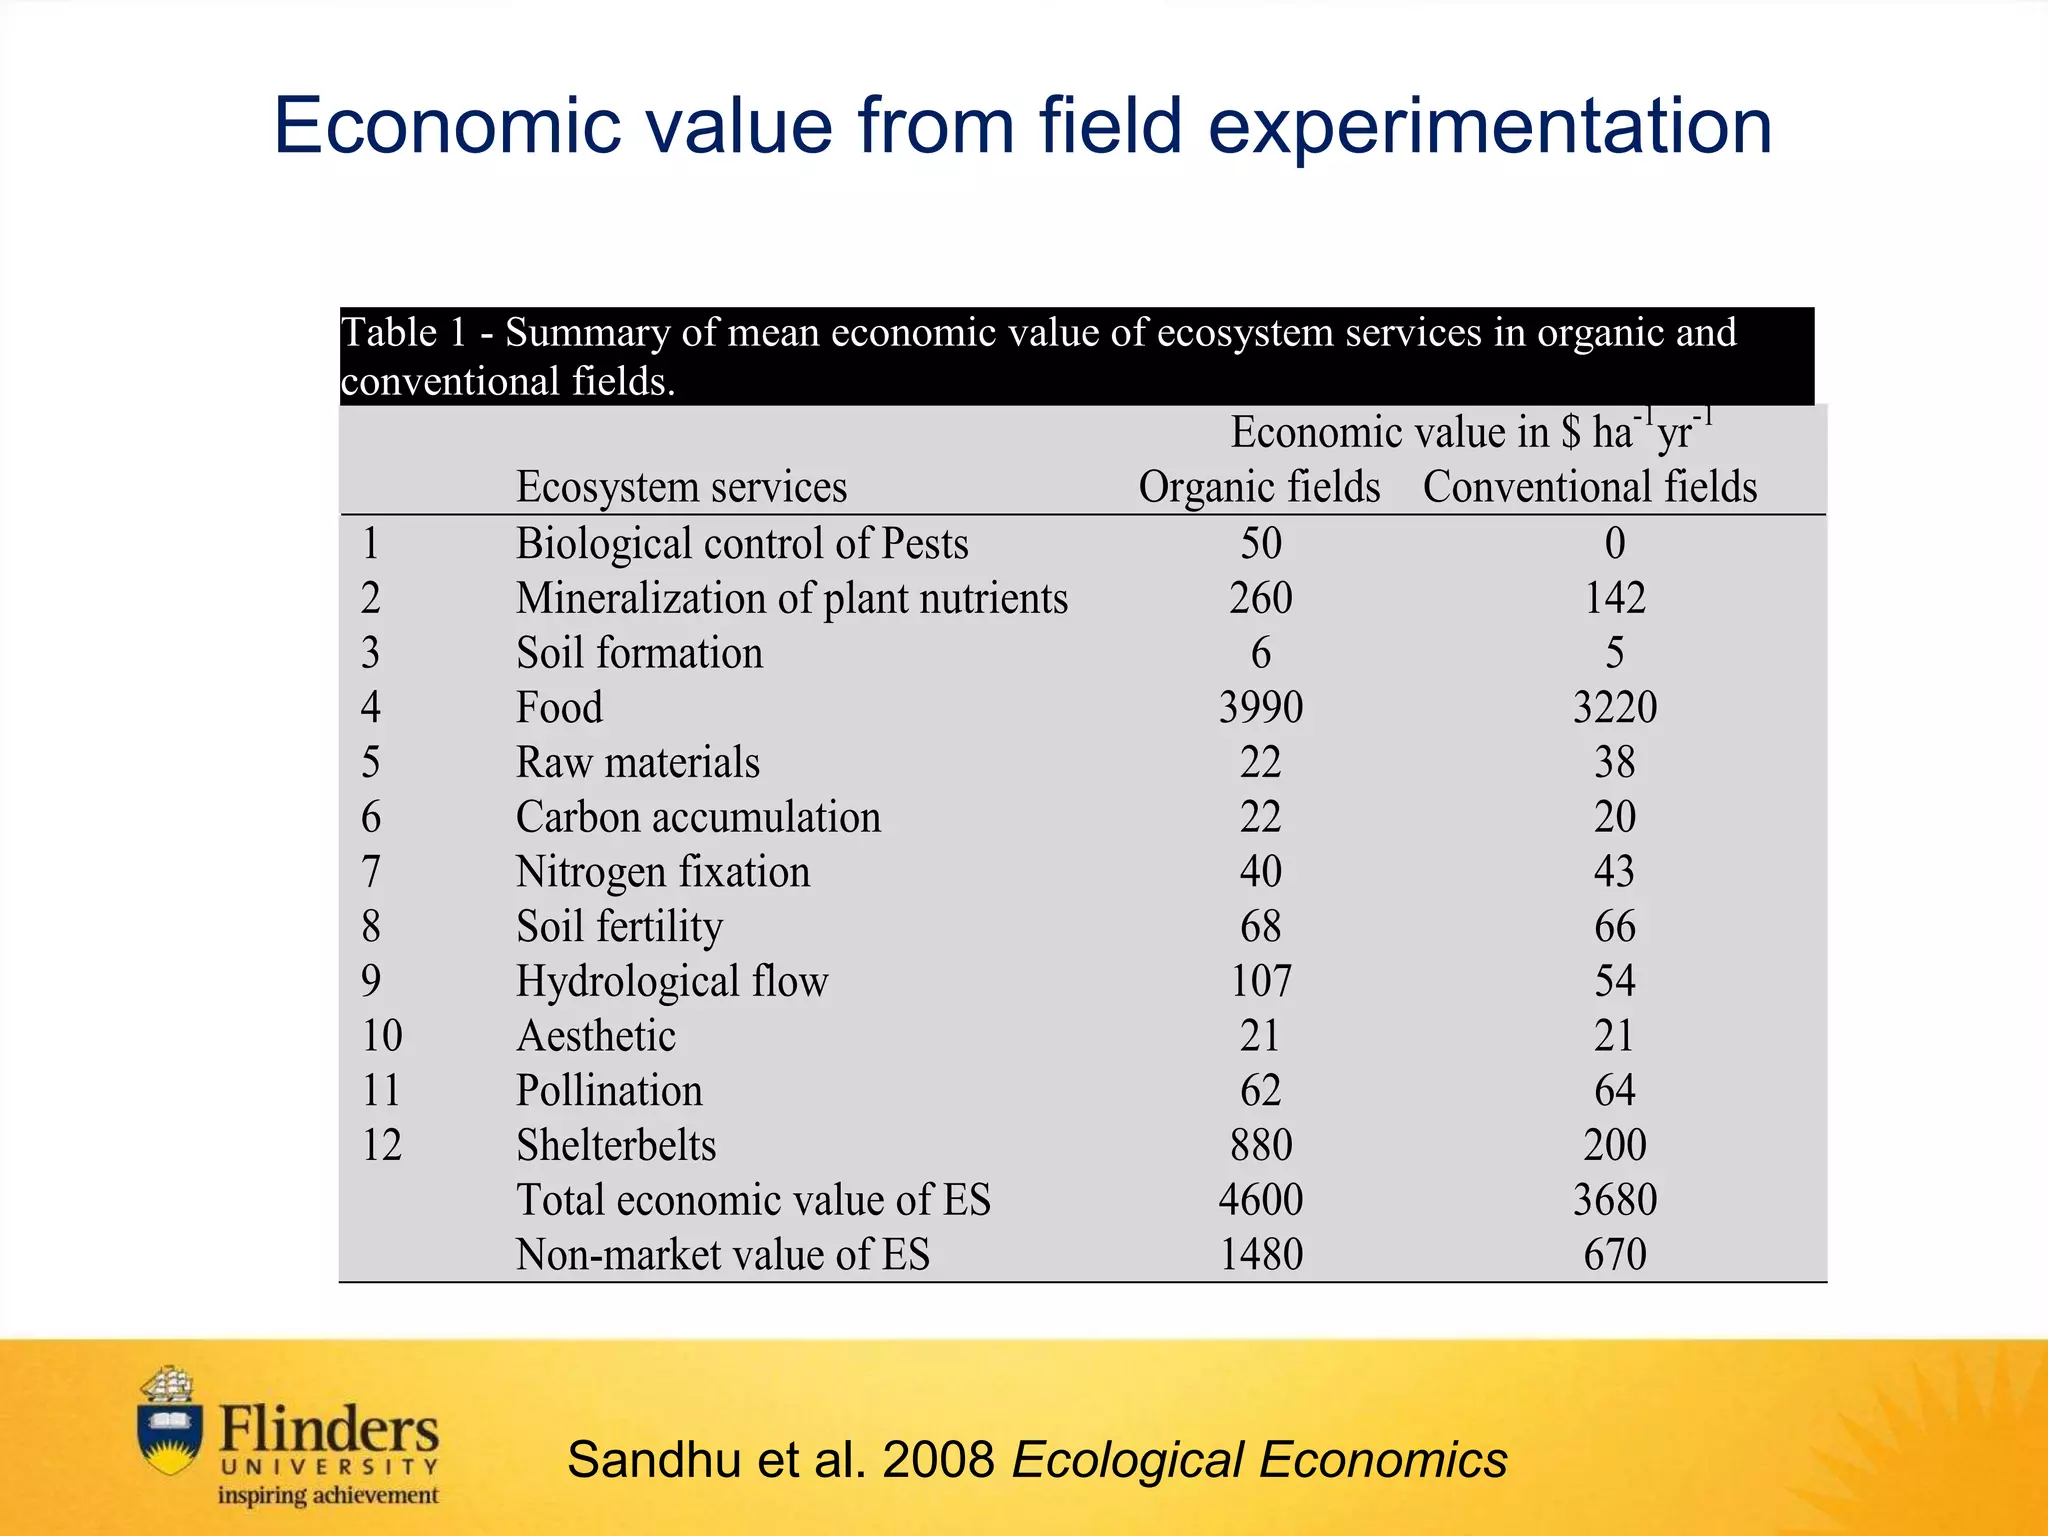
2) The document outlines methods to quantify and value ecosystem services provided by agricultural landscapes and peri-urban areas.
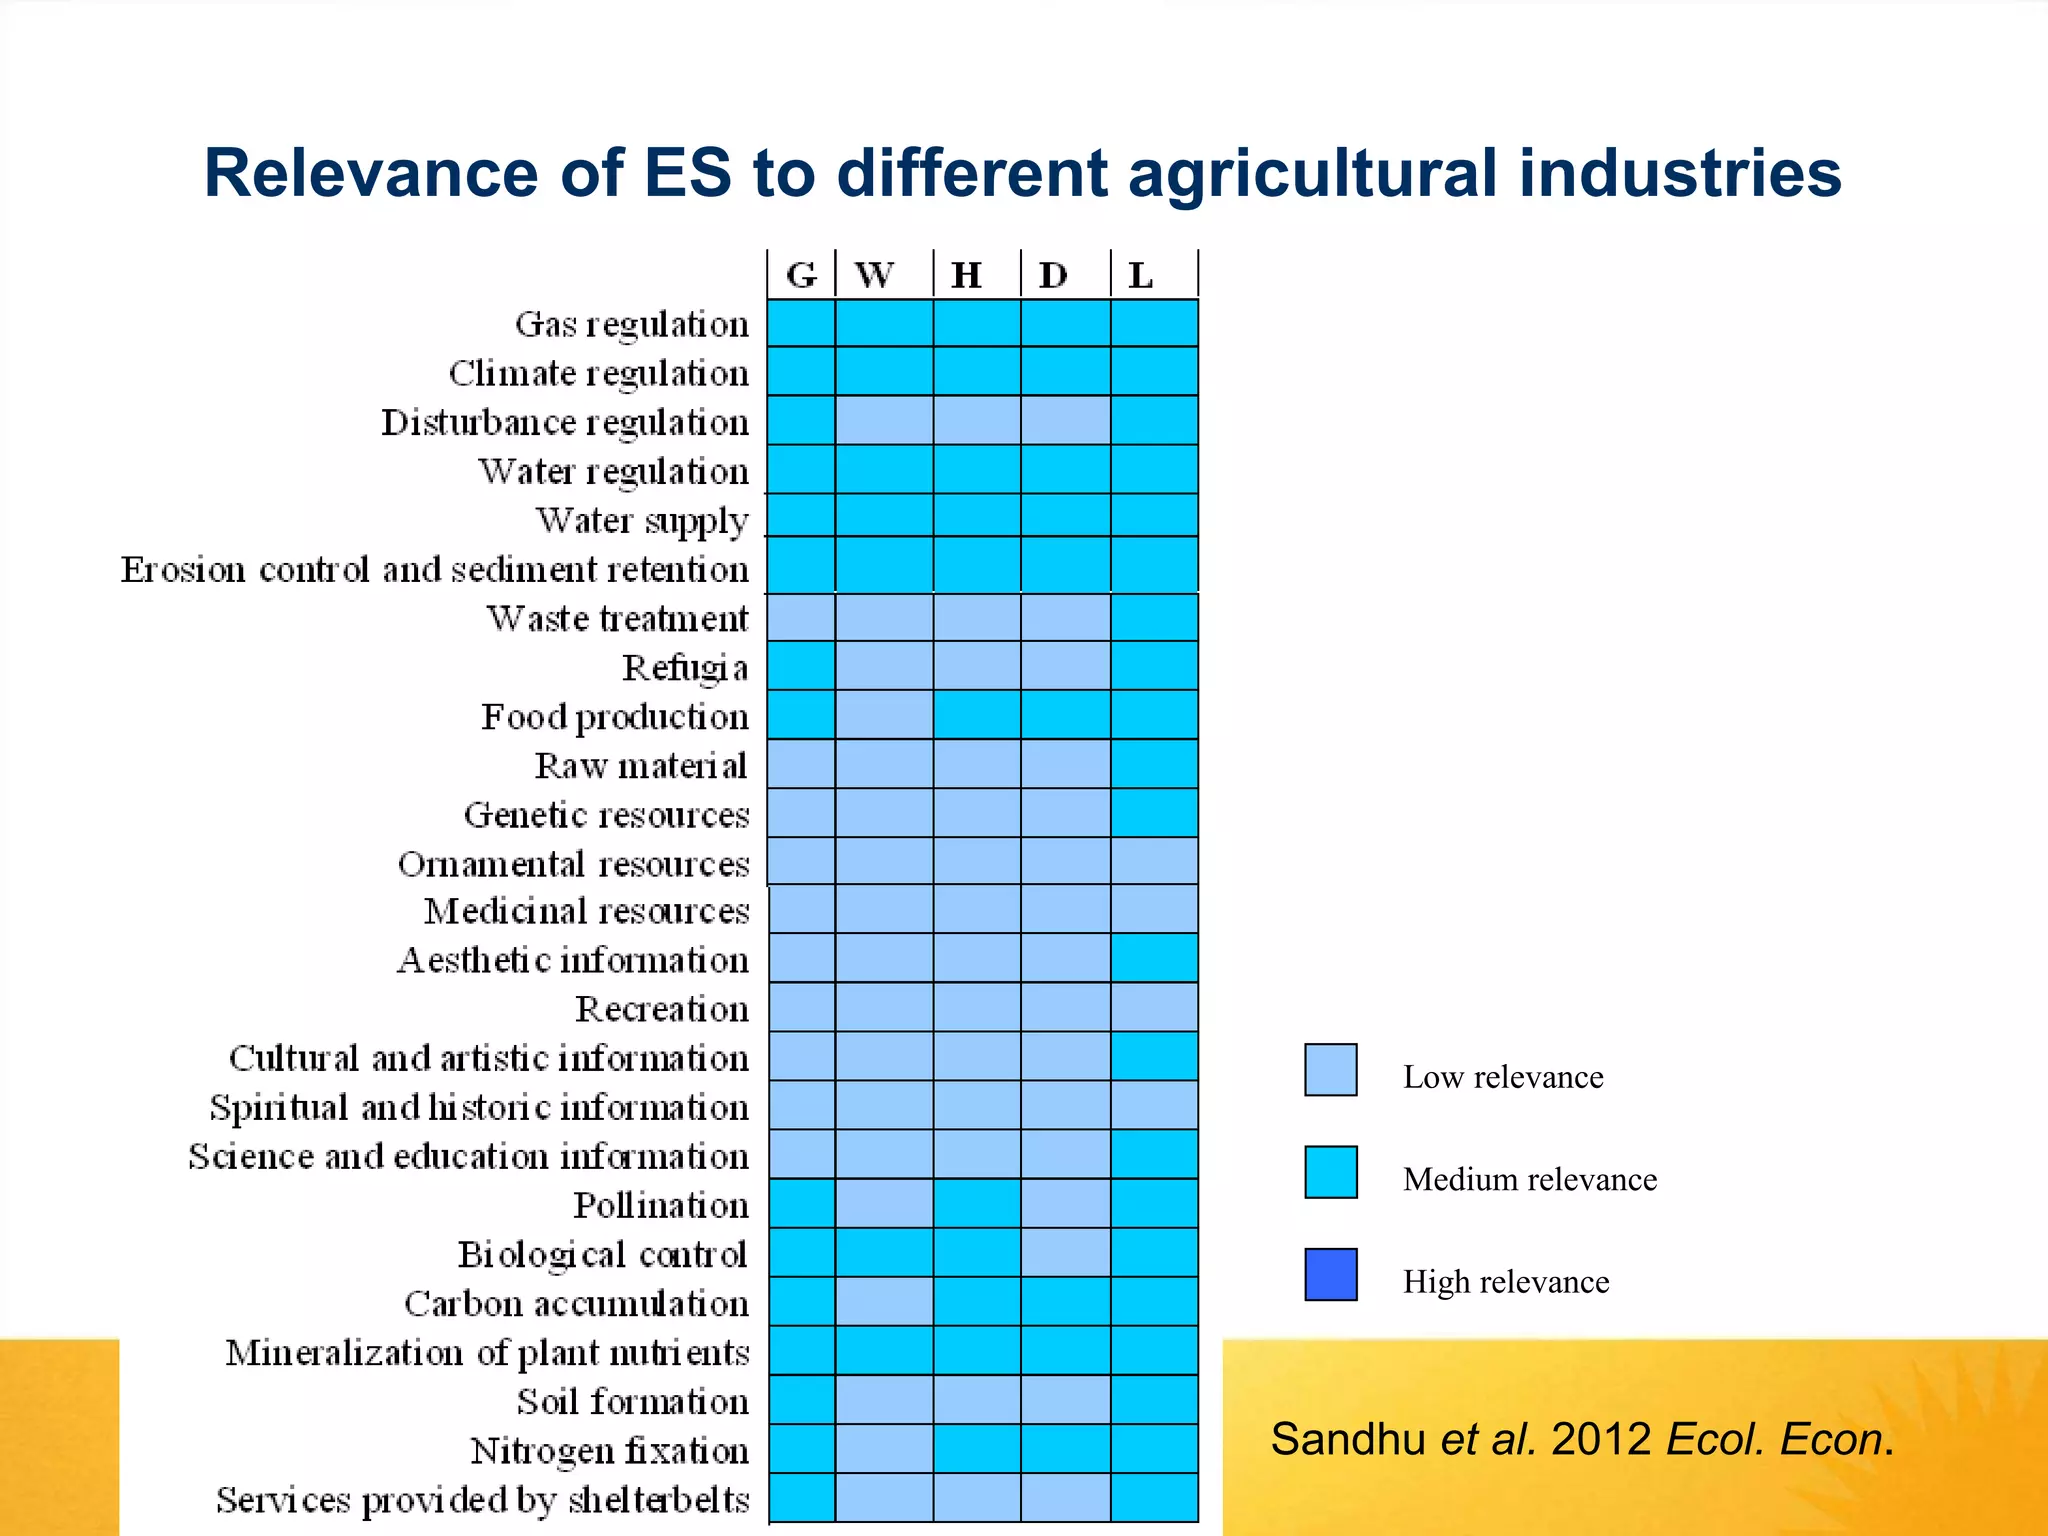
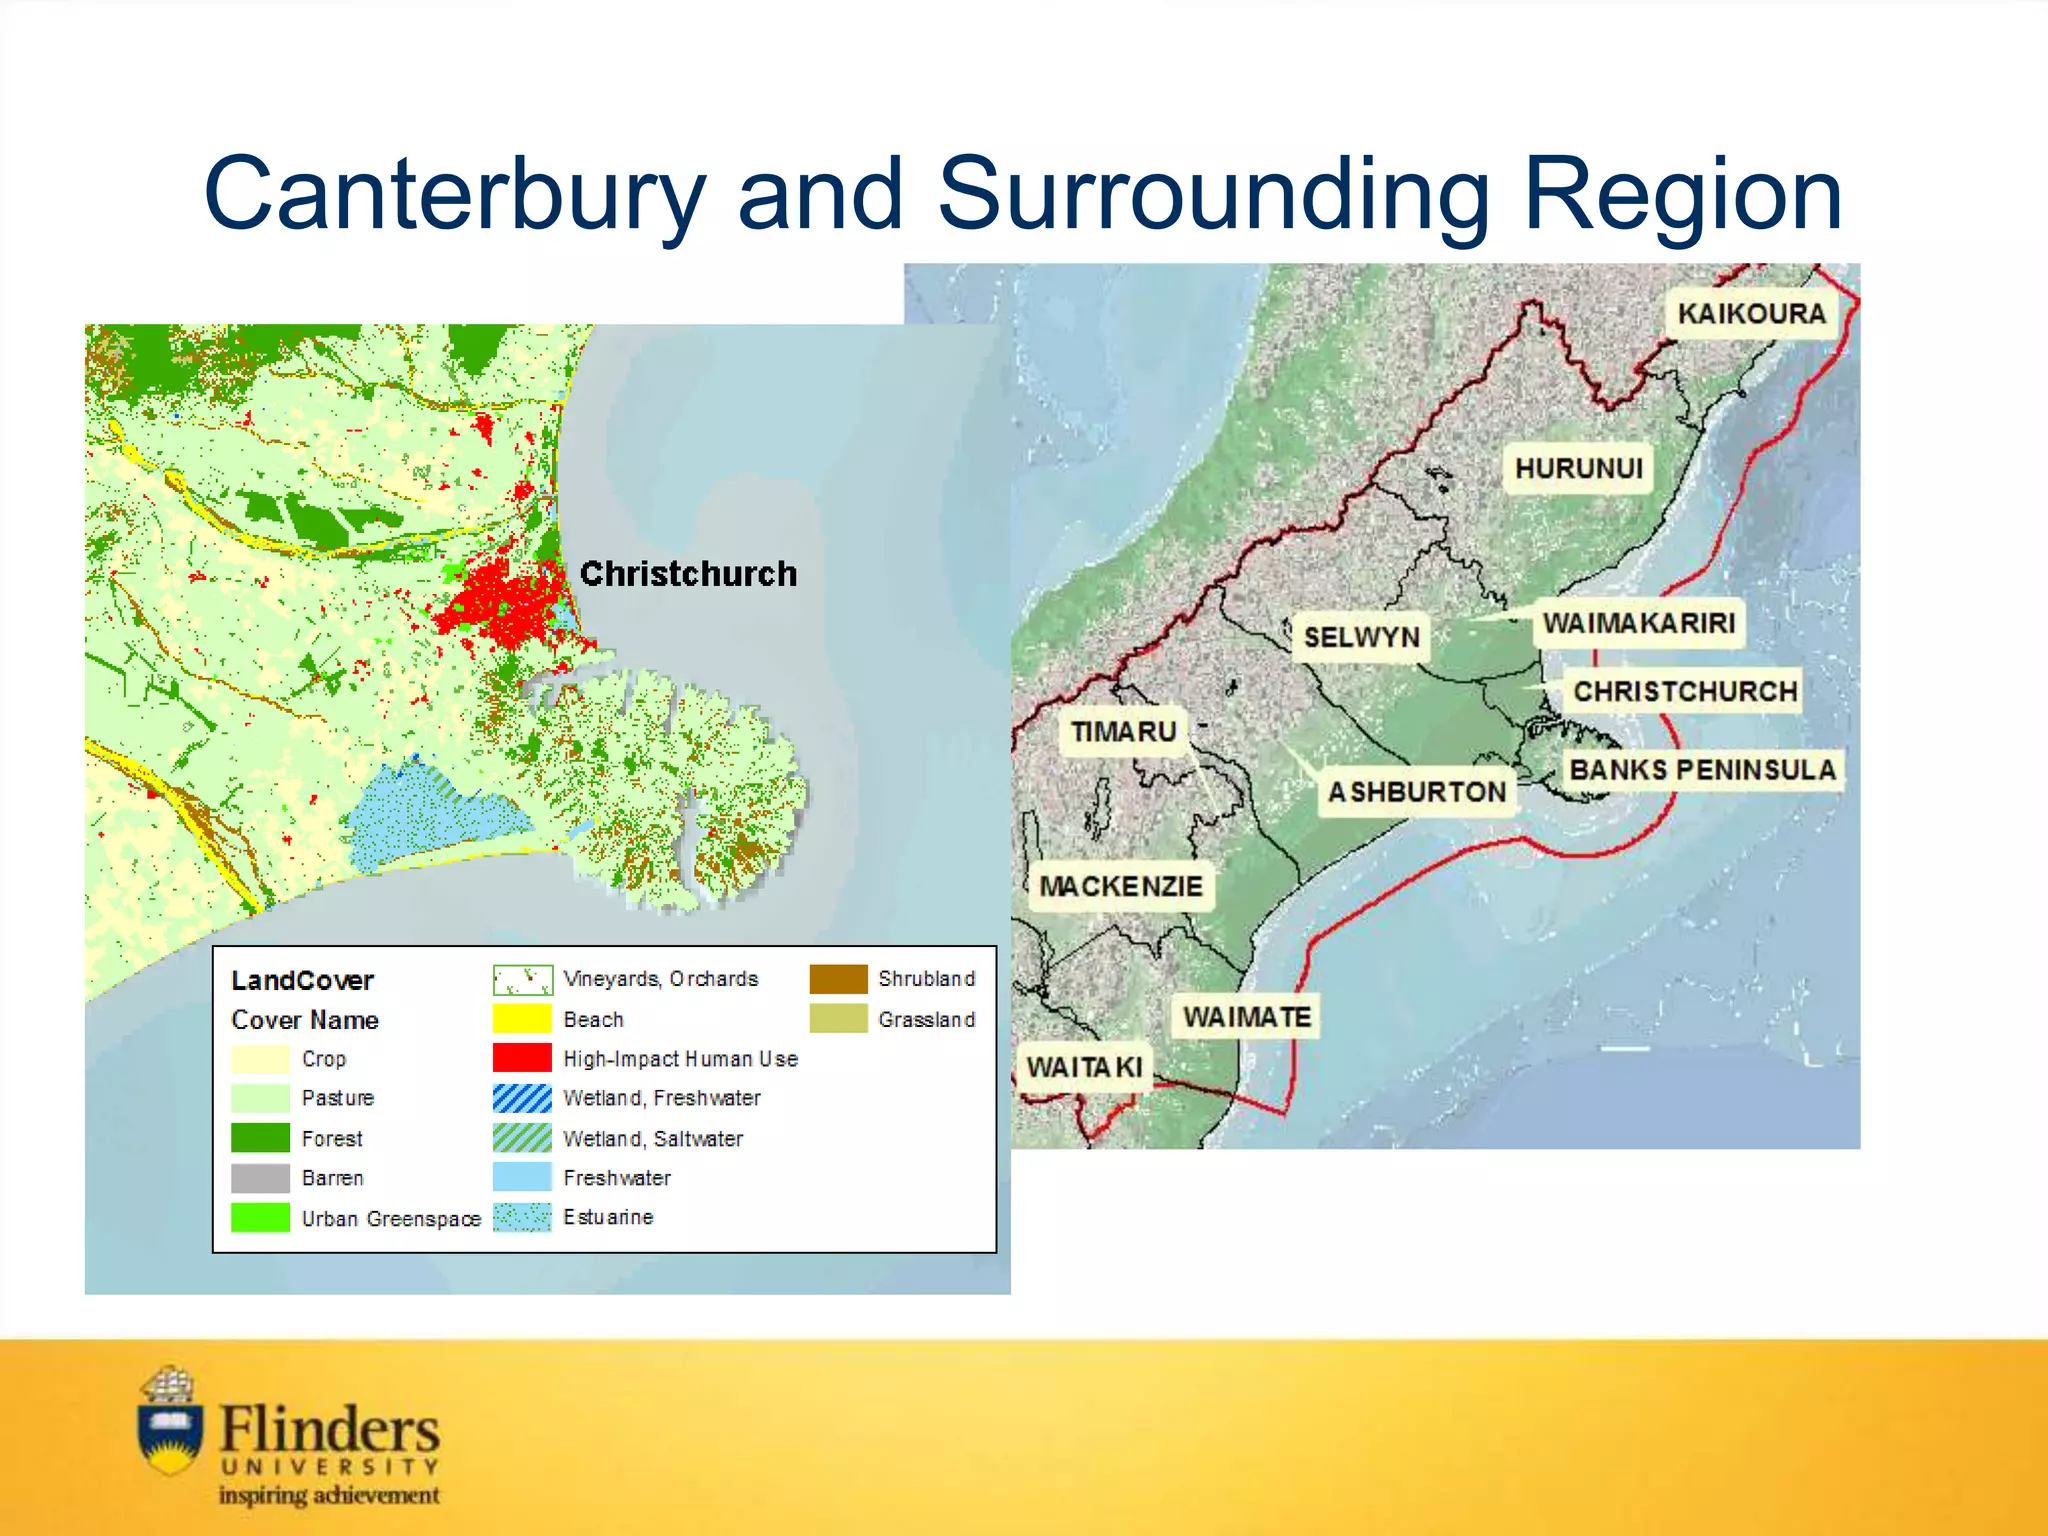
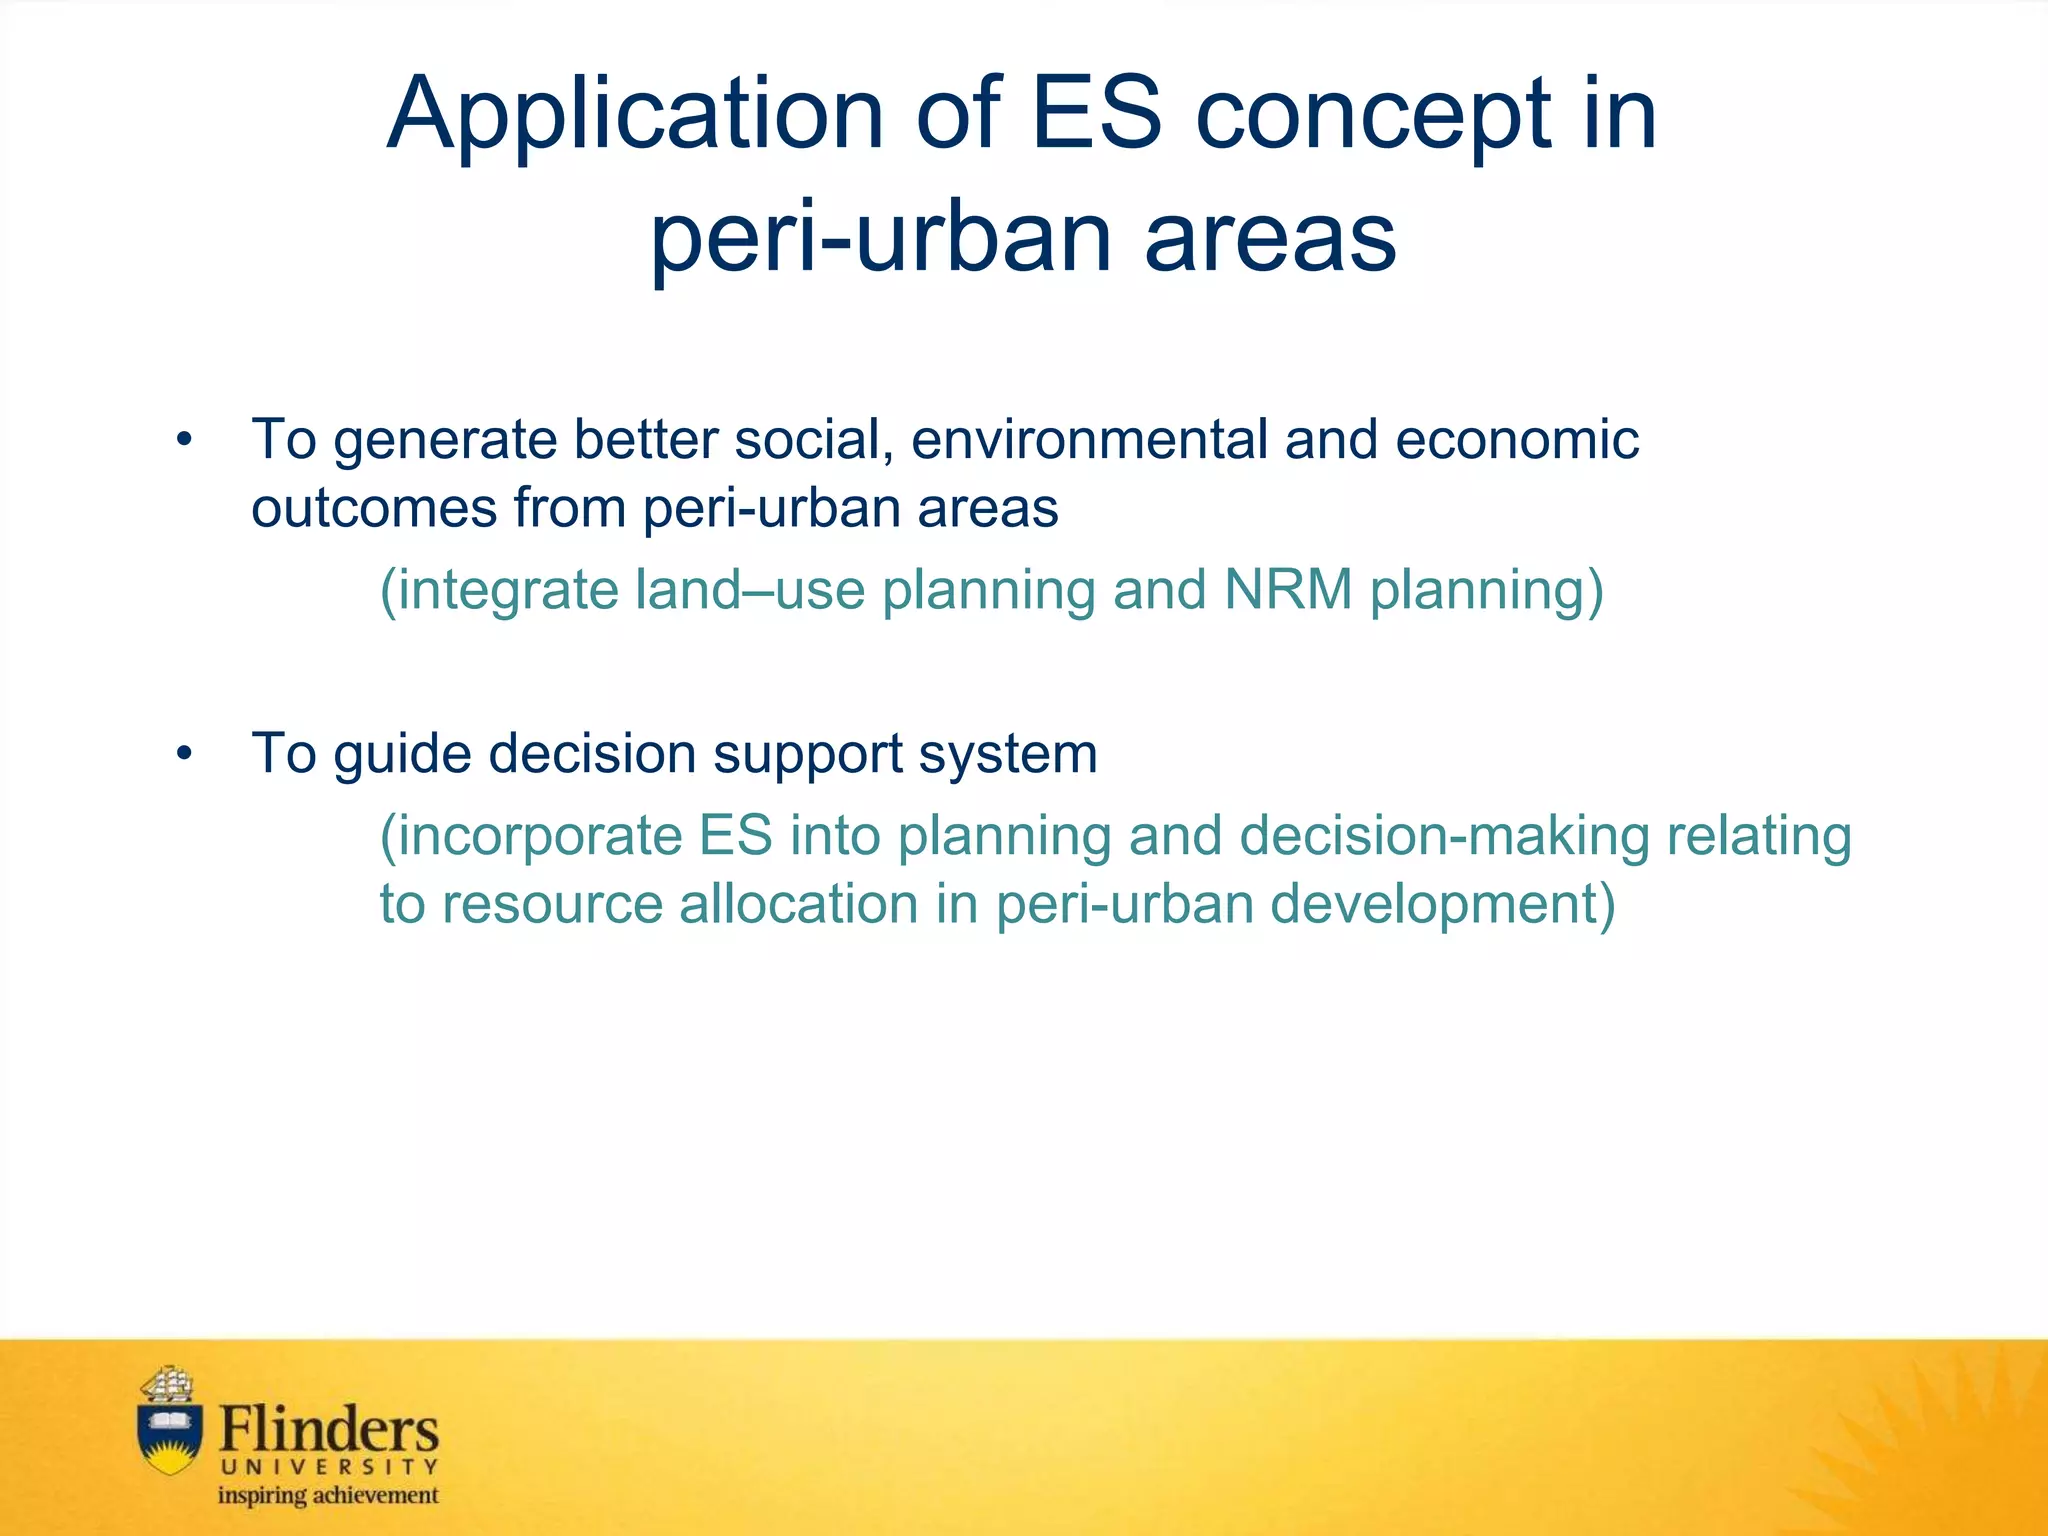
3) Case studies are presented showing how ecosystem services in agricultural fields and peri-urban areas can be inventoried, monetized, mapped with GIS, and incorporated into decision support systems to guide more sustainable land use planning and management.


![Coded Agents – with UiPath SDK + LangGraph [Virtual Hands-on Workshop]](https://cdn.slidesharecdn.com/ss_thumbnails/codedagentsdeck-251215155422-5497c599-thumbnail.jpg?width=640&height=640&fit=bounds)

