Downloaded 115 times
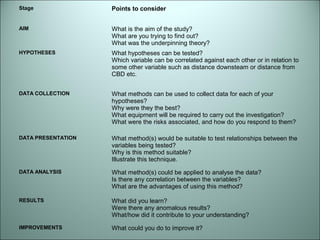

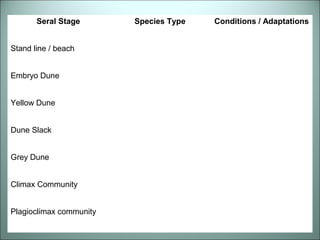
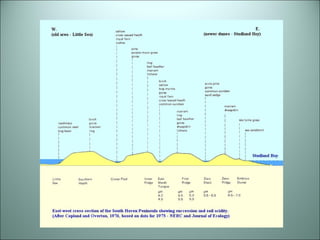
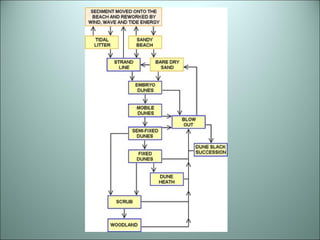
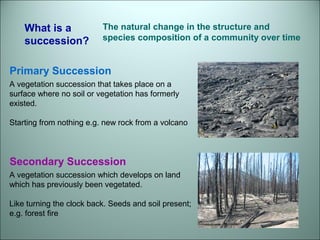
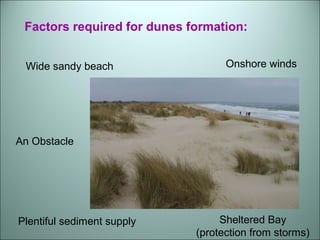
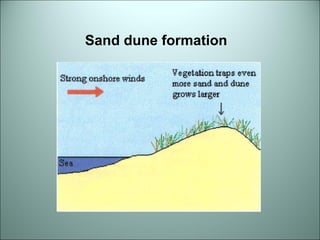
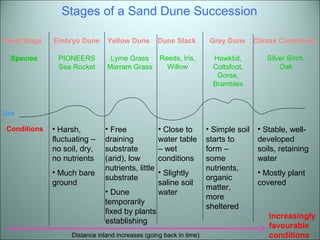


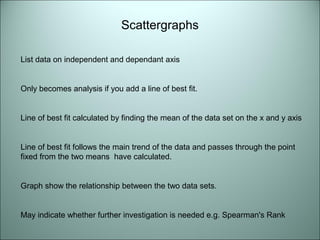


This document outlines the key stages and considerations for planning and conducting a fieldwork investigation into succession in sand dune ecosystems. It discusses establishing aims, hypotheses, appropriate data collection methods, health and safety risks, data presentation and analysis techniques. Specific topics covered include transect methods, quadrat sampling, soil moisture and pH testing. The document also provides background context on sand dune succession theory, including pioneer species, seral stages, and climax communities.