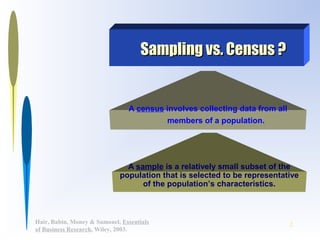
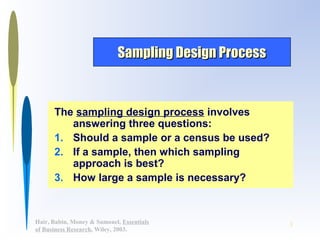
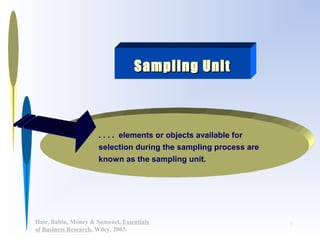
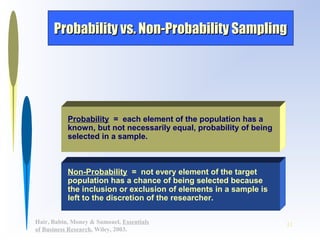
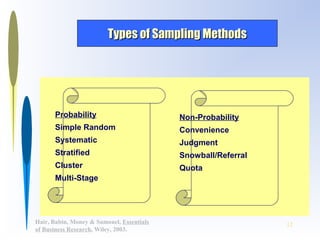
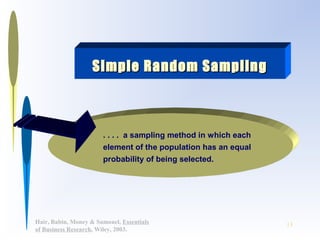
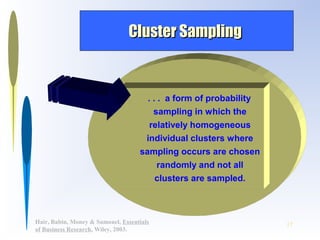
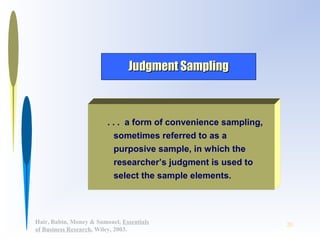
This PPT will give details about
Sampling Introduction
Types of Probability Sampling
Types of Non-Probability Sampling
Sampling Frame
Determination of Sample Size
Link for other units are provided below .Kindly check that also
Unit-I
https://www2.slideshare.net/ManojKumar730/research-methodology-unitiresearch-and-its-various-process
Unit-II
https://www2.slideshare.net/ManojKumar730/research-methodology-unit-iidata-collection
Unit-iii
https://www2.slideshare.net/ManojKumar730/research-methodlogy-unitiiisampling
Unit-IV
https://www2.slideshare.net/ManojKumar730/research-methodlogy-unitivmeasurement-and-data-preperationfor-bbabcommba-and-for-other-ug-and-pg-students
Unit-V
https://www2.slideshare.net/ManojKumar730/research-methodlogy-unitvreseach-report-for-bcom-bba-mba-and-other-ug-and-pg-courses
definition of survey
survey and its type
its purpose and uses.
sampling
approaches
survey methods
research designs
probability and non probability
population
cross sectional design
longitudinal design
successive independent sampling design
Sampling
Chapter 6
*
Introduction
Sampling is the process of selecting observations
Often not possible to collect information from all units you wish to study
Often not necessary to collect data from everyone out there
Allows researcher to make a small subset of observations and then generalize to the rest of the population
The Logic of Probability Sampling
Samples: a group of subjects selected from a population
Probability sampling: a method of selection in which each member of a population has a known chance of being selected
Enables us to generalize findings from observing cases to a larger unobserved population
Because we are not completely homogeneous, our sample must be representative of the variations that exist among us
Conscious and Unconscious Sampling Bias
Be conscious of bias – when sample is not fully representative of the larger population from which it was selected
Sampling bias is not always obvious
Use techniques to help avoid bias
Representativeness and Probability of SelectionA sample is representative of the population from which it is selected if the aggregate characteristics of the sample closely approximate the same aggregate characteristics in the populationSamples that are representative of the population are often labeled equal probability of section method (EPSEM) samples because all members of the population have an equal chance of being included in the sample
Sampling Terminology 1
Sample Element: who or what are we studying (student)
Population: whole group (college freshmen)
Population Parameter: summary description of a given variable in a population
Sample Statistic: summary description of a given variable in a sample; we use sample statistics to make estimates or inferences of population parameters
Sampling Terminology 2Sampling distribution: a range of sample statistics we obtain if we select many samples from a populationSampling frame: actual list of units to be selected (our school’s enrollment list)Binomial variable: a variable with only two values
Sampling Terminology 3
Standard error: a measure of sampling error; we can estimate the degree to be expected
Confidence Levels and Confidence Intervals
Two key components of sampling error
We express the accuracy of our sample statistics in terms of a level of confidence that the statistics fall within a specified interval from the parameter
Sampling Designs 1
Simple Random Sampling: each element in a sampling frame is assigned a number, choices are then made through random number generation as to which elements will be included in your sample
Systematic Sampling: elements in the total list are chosen (systematically) for inclusion in the sample
List of 10,000 elements, we want a sample of 1,000, select every tenth element
Choose first element randomly
Sampling Designs 2
Stratification: modification to random and systematic sampling; ensures that appropriate numbers are drawn from homogeneous subsets of that population
Dis.
Techniques to optimize the pagerank algorithm usually fall in two categories. One is to try reducing the work per iteration, and the other is to try reducing the number of iterations. These goals are often at odds with one another. Skipping computation on vertices which have already converged has the potential to save iteration time. Skipping in-identical vertices, with the same in-links, helps reduce duplicate computations and thus could help reduce iteration time. Road networks often have chains which can be short-circuited before pagerank computation to improve performance. Final ranks of chain nodes can be easily calculated. This could reduce both the iteration time, and the number of iterations. If a graph has no dangling nodes, pagerank of each strongly connected component can be computed in topological order. This could help reduce the iteration time, no. of iterations, and also enable multi-iteration concurrency in pagerank computation. The combination of all of the above methods is the STICD algorithm. [sticd] For dynamic graphs, unchanged components whose ranks are unaffected can be skipped altogether.
Enhanced Enterprise Intelligence with your personal AI Data Copilot.pdfGetInData
Recently we have observed the rise of open-source Large Language Models (LLMs) that are community-driven or developed by the AI market leaders, such as Meta (Llama3), Databricks (DBRX) and Snowflake (Arctic). On the other hand, there is a growth in interest in specialized, carefully fine-tuned yet relatively small models that can efficiently assist programmers in day-to-day tasks. Finally, Retrieval-Augmented Generation (RAG) architectures have gained a lot of traction as the preferred approach for LLMs context and prompt augmentation for building conversational SQL data copilots, code copilots and chatbots.
In this presentation, we will show how we built upon these three concepts a robust Data Copilot that can help to democratize access to company data assets and boost performance of everyone working with data platforms.
Why do we need yet another (open-source ) Copilot?
How can we build one?
Architecture and evaluation
Chatty Kathy - UNC Bootcamp Final Project Presentation - Final Version - 5.23...John Andrews
SlideShare Description for "Chatty Kathy - UNC Bootcamp Final Project Presentation"
Title: Chatty Kathy: Enhancing Physical Activity Among Older Adults
Description:
Discover how Chatty Kathy, an innovative project developed at the UNC Bootcamp, aims to tackle the challenge of low physical activity among older adults. Our AI-driven solution uses peer interaction to boost and sustain exercise levels, significantly improving health outcomes. This presentation covers our problem statement, the rationale behind Chatty Kathy, synthetic data and persona creation, model performance metrics, a visual demonstration of the project, and potential future developments. Join us for an insightful Q&A session to explore the potential of this groundbreaking project.
Project Team: Jay Requarth, Jana Avery, John Andrews, Dr. Dick Davis II, Nee Buntoum, Nam Yeongjin & Mat Nicholas
The Building Blocks of QuestDB, a Time Series Databasejavier ramirez
Talk Delivered at Valencia Codes Meetup 2024-06.
Traditionally, databases have treated timestamps just as another data type. However, when performing real-time analytics, timestamps should be first class citizens and we need rich time semantics to get the most out of our data. We also need to deal with ever growing datasets while keeping performant, which is as fun as it sounds.
It is no wonder time-series databases are now more popular than ever before. Join me in this session to learn about the internal architecture and building blocks of QuestDB, an open source time-series database designed for speed. We will also review a history of some of the changes we have gone over the past two years to deal with late and unordered data, non-blocking writes, read-replicas, or faster batch ingestion.
STATATHON: Unleashing the Power of Statistics in a 48-Hour Knowledge Extravag...sameer shah
"Join us for STATATHON, a dynamic 2-day event dedicated to exploring statistical knowledge and its real-world applications. From theory to practice, participants engage in intensive learning sessions, workshops, and challenges, fostering a deeper understanding of statistical methodologies and their significance in various fields."
Adjusting primitives for graph : SHORT REPORT / NOTESSubhajit Sahu
Graph algorithms, like PageRank Compressed Sparse Row (CSR) is an adjacency-list based graph representation that is
Multiply with different modes (map)
1. Performance of sequential execution based vs OpenMP based vector multiply.
2. Comparing various launch configs for CUDA based vector multiply.
Sum with different storage types (reduce)
1. Performance of vector element sum using float vs bfloat16 as the storage type.
Sum with different modes (reduce)
1. Performance of sequential execution based vs OpenMP based vector element sum.
2. Performance of memcpy vs in-place based CUDA based vector element sum.
3. Comparing various launch configs for CUDA based vector element sum (memcpy).
4. Comparing various launch configs for CUDA based vector element sum (in-place).
Sum with in-place strategies of CUDA mode (reduce)
1. Comparing various launch configs for CUDA based vector element sum (in-place).
1. 1Hair, Babin, Money & Samouel, Essentials
of Business Research, Wiley, 2003.
Learning Objectives:
1. Understand the key principles in sampling.
2. Appreciate the difference between the target
population and the sampling frame.
3. Recognize the difference between probability
and non-probability sampling.
4. Describe the different sampling methods.
5. Determine the appropriate sample size.
Sampling Approaches andSampling Approaches and
ConsiderationsConsiderations
2. 2Hair, Babin, Money & Samouel, Essentials
of Business Research, Wiley, 2003.
A sample is a relatively small subset of the
population that is selected to be representative
of the population’s characteristics.
A census involves collecting data from all
members of a population.
Sampling vs. Census ?Sampling vs. Census ?
3. 3Hair, Babin, Money & Samouel, Essentials
of Business Research, Wiley, 2003.
Sampling Design ProcessSampling Design Process
The sampling design process involves
answering three questions:
1. Should a sample or a census be used?
2. If a sample, then which sampling
approach is best?
3. How large a sample is necessary?
4. 4Hair, Babin, Money & Samouel, Essentials
of Business Research, Wiley, 2003.
Steps to follow:
To obtain a representativeTo obtain a representative
sample . . . .sample . . . .
1. Define the target population.
2. Choose the sampling frame.
3. Select the sampling method.
4. Determine the sample size.
5. Implement the sampling plan.
5. 5Hair, Babin, Money & Samouel, Essentials
of Business Research, Wiley, 2003.
Representative SampleRepresentative Sample
A representative sample mirrors the
characteristics of the population and
minimizes the errors associated with
sampling.
6. 6Hair, Babin, Money & Samouel, Essentials
of Business Research, Wiley, 2003.
. . . the complete group of objects or
elements relevant to the research
project. They are relevant because
they possess the information the
research project is designed to
collect.
Target PopulationTarget Population
7. 7Hair, Babin, Money & Samouel, Essentials
of Business Research, Wiley, 2003.
. . . . elements or objects available for
selection during the sampling process are
known as the sampling unit.
Sampling UnitSampling Unit
8. 8Hair, Babin, Money & Samouel, Essentials
of Business Research, Wiley, 2003.
. . . . as complete a list as possible of
all the elements in the population from
which the sample is drawn.
Sampling FrameSampling Frame
9. 9Hair, Babin, Money & Samouel, Essentials
of Business Research, Wiley, 2003.
The sampling frame often is flawed because . . .The sampling frame often is flawed because . . .
It may not be up to date.
It may include elements that do not belong
to the target population.
It may not include elements that do belong
to the target population.
It may be compiled from multiple lists and
contain duplicate elements.
10. 10Hair, Babin, Money & Samouel, Essentials
of Business Research, Wiley, 2003.
Non-Probability
Probability
SamplingSampling
MethodsMethods
11. 11Hair, Babin, Money & Samouel, Essentials
of Business Research, Wiley, 2003.
Probability vs. Non-Probability SamplingProbability vs. Non-Probability Sampling
Non-Probability = not every element of the target
population has a chance of being selected because
the inclusion or exclusion of elements in a sample is
left to the discretion of the researcher.
Probability = each element of the population has a
known, but not necessarily equal, probability of being
selected in a sample.
12. 12Hair, Babin, Money & Samouel, Essentials
of Business Research, Wiley, 2003.
Types of Sampling MethodsTypes of Sampling Methods
Probability
Simple Random
Systematic
Stratified
Cluster
Multi-Stage
Non-Probability
Convenience
Judgment
Snowball/Referral
Quota
13. 13Hair, Babin, Money & Samouel, Essentials
of Business Research, Wiley, 2003.
. . . . a sampling method in which each
element of the population has an equal
probability of being selected.
Simple Random SamplingSimple Random Sampling
14. 14Hair, Babin, Money & Samouel, Essentials
of Business Research, Wiley, 2003.
Systematic SamplingSystematic Sampling
. . . a process that involves
randomly selecting an initial
starting point on a list, and
thereafter every nth
element in
the sampling frame.
15. 15Hair, Babin, Money & Samouel, Essentials
of Business Research, Wiley, 2003.
. . . requires the
researcher to partition the
target population into
relatively homogeneous
subgroups that are distinct
and non-overlapping ..
Stratified SamplingStratified Sampling
16. 16Hair, Babin, Money & Samouel, Essentials
of Business Research, Wiley, 2003.
Two Types of Stratified SamplingTwo Types of Stratified Sampling
Disproportionate = the number of elements chosen
from each of the strata is not based on the size of the
stratum relative to the target population size, but
rather is based either on the importance of a
particular stratum or its variability.
Proportionate = the number of elements chosen
from each of the strata is proportionate to the size of
a particular strata relative to the overall sample size.
17. 17Hair, Babin, Money & Samouel, Essentials
of Business Research, Wiley, 2003.
Cluster SamplingCluster Sampling
. . . a form of probability
sampling in which the
relatively homogeneous
individual clusters where
sampling occurs are chosen
randomly and not all
clusters are sampled.
18. 18Hair, Babin, Money & Samouel, Essentials
of Business Research, Wiley, 2003.
Multi-Stage Cluster SamplingMulti-Stage Cluster Sampling
Cluster sampling involves dividing the
population into clusters and randomly
selecting a pre-specified number of
clusters and then either collecting
information from all the elements in each
cluster or a random sample. With multi-
stage cluster sampling the same process
is completed two or more times.
19. 19Hair, Babin, Money & Samouel, Essentials
of Business Research, Wiley, 2003.
Convenience SamplingConvenience Sampling
. . . involves selecting sample
elements that are most readily
available to participate in the
study and who can provide the
required information.
20. 20Hair, Babin, Money & Samouel, Essentials
of Business Research, Wiley, 2003.
Judgment SamplingJudgment Sampling
. . . a form of convenience sampling,
sometimes referred to as a
purposive sample, in which the
researcher’s judgment is used to
select the sample elements.
21. 21Hair, Babin, Money & Samouel, Essentials
of Business Research, Wiley, 2003.
. . . . similar to proportionately stratified
random sampling but the selection of
the elements from the strata is done on
a convenience basis.
Quota SamplingQuota Sampling
22. 22Hair, Babin, Money & Samouel, Essentials
of Business Research, Wiley, 2003.
. . . also called a referral sample, the initial
respondents typically are chosen using
probability methods and these respondents
then identify others in the target
population.
Snowball SamplingSnowball Sampling
23. 23Hair, Babin, Money & Samouel, Essentials
of Business Research, Wiley, 2003.
Determining sample size involves achieving aDetermining sample size involves achieving a
balance between several factors:balance between several factors:
• The variability of elements in the target population.
• The type of sample required.
• Time available.
• Budget.
• Required estimation precision.
• Whether findings will be generalized.
24. 24Hair, Babin, Money & Samouel, Essentials
of Business Research, Wiley, 2003.
Three decisions to make when statisticalThree decisions to make when statistical
formulas are used to determine sample size:formulas are used to determine sample size:
1. The degree of confidence
(often 95%).
2. The specified level of precision
(amount of acceptable error).
3. The amount of variability
(population homogeneity).