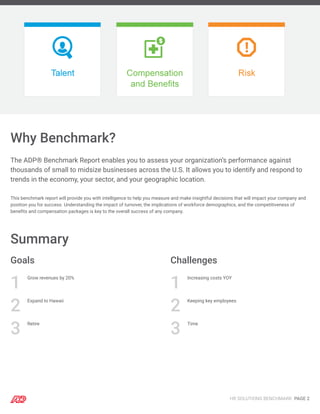
HR Solutions
Benchmark
2018/03/06
PREPARED FOR
ACME Inc
Why Benchmark?
The ADP® Benchmark Report enables you to assess your organization’s performance against
thousands of small to midsize businesses across the U.S. It allows you to identify and respond to
trends in the economy, your sector, and your geographic location.
This benchmark report will provide you with intelligence to help you measure and make insightful decisions that will impact your company and
position you for success. Understanding the impact of turnover, the implications of workforce demographics, and the competitiveness of
benefits and compensation packages is key to the overall success of any company.
Summary
Goals
1
Grow revenues by 20%
2
Expand to Hawaii
3
Retire
Challenges
1
Increasing costs YOY
2
Keeping key employees
3
Time
HR SOLUTIONS BENCHMARK PAGE 2
Key Metrics
Revenue per Employee
Revenue per employee is a key indicator of success because it
identifies workforce productivity as well as turnover and attrition
trends within a company.
You’ve been working hard. Here are a few things that can help you
increase your revenue per employee:
Start or enhance an employee development program that aligns
with your culture and brand.
Leverage workforce analytics to help you identify and recruit top
talent.
Keep your finger on the pulse of your workforce by creating a
continuous performance review process to drive engagement.
Time to Hire
The ability to quickly and accurately identify and hire your next
superstar can have a significant impact on your bottom line.
Finding the best candidates first, before your competition, can help
you fill the gaps and maximize productivity.
ACME Inc
Average Time to Hire 101
Days
Local Industry
Average
Average Time to Hire
48
Days
It’s tough out there! The war for talent is real and can impact
business results. Here are a few tips:
Implement an innovative and modern recruitment experience to
attract the best people in the shortest time.
Use a team of recruitment specialists who can provide an end-
to-end strategy that helps you find the right candidate before
your competition.
Sifting through emails and stacks of resumes is time-
consuming and outdated. Leverage an applicant tracking
solution to keep track of qualified candidates and present a
polished and professional appearance to job seekers.
Average Wage
Compensating employees competitively and fairly can provide you
with a competitive edge. Although wages are very important, they
must be evaluated as a piece of your overall compensation and
benefits strategy.
ACME Inc
Average Wage $56,578 Local Industry
Average
Average Wage
$64,696
It’s OK. There are a few reasons your average wage could be lower
than your competition. Here are some considerations:
Keep an eye on your compensation package by monitoring and
evaluating your programs to gain a competitive advantage.
Leverage workforce analytics and strategies to ensure you are
offering a well-rounded compensation and benefits package
that meets the needs of all employees.
Provide visibility into employees’ total compensation and
benefits programs for complete transparency into their total
package.
HR SOLUTIONS BENCHMARK PAGE 3
Talent
Revenue per Employee
Revenue per employee is a key indicator of success because it
identifies workforce productivity as well as turnover and attrition
trends within a company.
Workforce Demographics
At the heart of every business is its people. In today’s competitive
landscape it’s important to know what motivates each person so
you can maximize engagement and drive productivity.
Male Female
ACME Inc
Average Age 35
Years
Local Industry
Average
Average Age
35
Years
ACME Inc
Gender Breakdown
Local Average
Gender Breakdown
Expected Job Growth
Understanding the job growth in your industry can help you plan
ahead and ensure that you have the proper strategy in place to
attract and retain top performers.
ACME Inc
Job Growth 7% National Industry
Average
Job Growth
4%
Time to Hire
The ability to quickly and accurately identify and hire your next
superstar can have a significant impact on your bottom line.
Finding the best candidates first, before your competition, can help
you fill the gaps and maximize productivity.
ACME Inc
Average Time to Hire 101
Days
Local Industry
Average
Average Time to Hire
48
Days
Talent Sourcing
Here’s where you find top
talent:
Recruiters
Here is a breakdown of where
companies like yours find top
talent:
Additional Insights
Number of Job Openings
Here are the number of jobs you are
competing with in your industry and area.
102
Job Openings
Employee Engagement
Engaged employees can have a direct impact on your bottom line.
Take a look at the current national average. How engaged are your
employees?
Industry Average
HR SOLUTIONS BENCHMARK PAGE 4
Compensation
Average Wage
Compensating employees competitively and fairly can provide you
with a competitive edge. Although wages are very important, they
must be evaluated as a piece of your overall compensation and
benefits strategy.
ACME Inc
Average Wage $56,578 Local Industry
Average
Average Wage
$64,696
Medical Benefit Participation
Participation in your medical plan can impact your premiums in a
positive or negative way. Your participation rate can be an
indication of how effective your overall benefits strategy is.
ACME Inc
Benefits Participation Rate
National Industry Average
Benefits Participation Rate
Employer Contribution to Benefits
The contribution you make toward benefits on behalf of your
employees is likely one of your largest expense items and one of
their favorite perks. It’s important to know where you stand.
ACME Inc
Monthly Contribution
National Industry Average
Monthly Contribution
Employee 100% Employee 81%
Medical Plan Design
Plan design is one component of a comprehensive benefits
strategy. Effective plan designs that align with your workforce
demographics can help to stabilize benefits costs and attract and
retain star performers.
Deductible Coinsurance Out-of-pocket Max
Plan 1 $3,000 80/20% $5,000
Plan 2 $1,500 90/10% $4,000
Local Industry
Average
$3,000 80/20% $5,000
Retirement Plan Match
A well-rounded benefits program requires more than just medical
benefits. Employees want multiple choices and options that align
with their needs.
ACME Inc
Match Rate 1% National Industry
Average
Match Rate
4%
Benefits Strategies
Here is how you offset the
rising costs of medical
benefits:
Offer a less expensive plan
Here is the breakdown of the
strategies other companies
use to offset those costs:
Additional Insights
Wage Growth
Compensation is one of the most important
benefits to an employee. It’s important to
know what your industry is doing and how you
compare.
3.33%
HR SOLUTIONS BENCHMARK PAGE 5
Risk
Turnover
Turnover can significantly impact a company’s ability to reach
revenue targets and strategic goals.
ACME Inc
Total Turnover Rate 7% Local Industry
Average
Total Turnover Rate
3%
ACME Inc
Total Terminations
Industry Average
Total Terminations
State Unemployment Insurance Rate
State Unemployment Insurance is an employer’s one controllable
payroll tax, and it’s important to mitigate as much risk as possible
when dealing with unemployment claims.
ACME Inc
SUI 3.76% National Industry
Average
SUI
3.46%
Workers’ Compensation Mod Factor
Workers’ Compensation can be complicated, and the Experience
Mod Factor can have a costly impact on your premiums and
ultimately your P&L.
Confidence in Regulatory Compliance
One a scale of 1 to 5, with 1 being “not confident” and 5 being
“extremely confident,” this is how confident you are in your
organization’s compliance in the following areas:
OSHA
EEO
E-VERIFY
FLSA
FMLA
COBRA
Additional Insights
Turnover by Generation
Looking at turnover by generation can paint an unseen picture of
the culture and engagement of a workforce. Take a look at the
average turnover by generation in your industry.
Industry Average
Turnover Rates
0%
Traditionalists
15%
Baby Boomers
26%
Generation X
52%
Millennials
7%
Generation Z
HR SOLUTIONS BENCHMARK PAGE 6
Stay Competitive in Today’s Marketplace
As you look to grow or sustain your business, establishing a partnership with an HR
organization can help you gain a competitive edge. Leveraging innovative tools, customized
workforce insights, and proactive HR strategies can help you recruit and retain the right
people, maximize your benefits offerings, and protect your organization.
The benchmark information presented in this report was prepared for you based on the following information.
COMPANY NAME:
ACME Inc
HEADQUARTERS ZIP CODE:
23229
MSA:
40060
SIC:
8748
NAICS:
541320
This document is intended to provide practical information concerning the subject matter covered and is provided with the
understanding that ADP does not render legal advice or other professional services. The material is made available for information
purposes only and is not a substitute for legal advice or your professional judgment. ADP and the ADP logo are registered trademarks
of ADP, LLC. ADP A more human resource. is a service mark of ADP, LLC. All other marks are the property of their respective owners.
Copyright © 2018 ADP, LLC. All rights reserved.
HR SOLUTIONS BENCHMARK PAGE 7

Sample Business Analysis and Benchmark Report

  • 1.
  • 2.
    Why Benchmark? The ADP®Benchmark Report enables you to assess your organization’s performance against thousands of small to midsize businesses across the U.S. It allows you to identify and respond to trends in the economy, your sector, and your geographic location. This benchmark report will provide you with intelligence to help you measure and make insightful decisions that will impact your company and position you for success. Understanding the impact of turnover, the implications of workforce demographics, and the competitiveness of benefits and compensation packages is key to the overall success of any company. Summary Goals 1 Grow revenues by 20% 2 Expand to Hawaii 3 Retire Challenges 1 Increasing costs YOY 2 Keeping key employees 3 Time HR SOLUTIONS BENCHMARK PAGE 2
  • 3.
    Key Metrics Revenue perEmployee Revenue per employee is a key indicator of success because it identifies workforce productivity as well as turnover and attrition trends within a company. You’ve been working hard. Here are a few things that can help you increase your revenue per employee: Start or enhance an employee development program that aligns with your culture and brand. Leverage workforce analytics to help you identify and recruit top talent. Keep your finger on the pulse of your workforce by creating a continuous performance review process to drive engagement. Time to Hire The ability to quickly and accurately identify and hire your next superstar can have a significant impact on your bottom line. Finding the best candidates first, before your competition, can help you fill the gaps and maximize productivity. ACME Inc Average Time to Hire 101 Days Local Industry Average Average Time to Hire 48 Days It’s tough out there! The war for talent is real and can impact business results. Here are a few tips: Implement an innovative and modern recruitment experience to attract the best people in the shortest time. Use a team of recruitment specialists who can provide an end- to-end strategy that helps you find the right candidate before your competition. Sifting through emails and stacks of resumes is time- consuming and outdated. Leverage an applicant tracking solution to keep track of qualified candidates and present a polished and professional appearance to job seekers. Average Wage Compensating employees competitively and fairly can provide you with a competitive edge. Although wages are very important, they must be evaluated as a piece of your overall compensation and benefits strategy. ACME Inc Average Wage $56,578 Local Industry Average Average Wage $64,696 It’s OK. There are a few reasons your average wage could be lower than your competition. Here are some considerations: Keep an eye on your compensation package by monitoring and evaluating your programs to gain a competitive advantage. Leverage workforce analytics and strategies to ensure you are offering a well-rounded compensation and benefits package that meets the needs of all employees. Provide visibility into employees’ total compensation and benefits programs for complete transparency into their total package. HR SOLUTIONS BENCHMARK PAGE 3
  • 4.
    Talent Revenue per Employee Revenueper employee is a key indicator of success because it identifies workforce productivity as well as turnover and attrition trends within a company. Workforce Demographics At the heart of every business is its people. In today’s competitive landscape it’s important to know what motivates each person so you can maximize engagement and drive productivity. Male Female ACME Inc Average Age 35 Years Local Industry Average Average Age 35 Years ACME Inc Gender Breakdown Local Average Gender Breakdown Expected Job Growth Understanding the job growth in your industry can help you plan ahead and ensure that you have the proper strategy in place to attract and retain top performers. ACME Inc Job Growth 7% National Industry Average Job Growth 4% Time to Hire The ability to quickly and accurately identify and hire your next superstar can have a significant impact on your bottom line. Finding the best candidates first, before your competition, can help you fill the gaps and maximize productivity. ACME Inc Average Time to Hire 101 Days Local Industry Average Average Time to Hire 48 Days Talent Sourcing Here’s where you find top talent: Recruiters Here is a breakdown of where companies like yours find top talent: Additional Insights Number of Job Openings Here are the number of jobs you are competing with in your industry and area. 102 Job Openings Employee Engagement Engaged employees can have a direct impact on your bottom line. Take a look at the current national average. How engaged are your employees? Industry Average HR SOLUTIONS BENCHMARK PAGE 4
  • 5.
    Compensation Average Wage Compensating employeescompetitively and fairly can provide you with a competitive edge. Although wages are very important, they must be evaluated as a piece of your overall compensation and benefits strategy. ACME Inc Average Wage $56,578 Local Industry Average Average Wage $64,696 Medical Benefit Participation Participation in your medical plan can impact your premiums in a positive or negative way. Your participation rate can be an indication of how effective your overall benefits strategy is. ACME Inc Benefits Participation Rate National Industry Average Benefits Participation Rate Employer Contribution to Benefits The contribution you make toward benefits on behalf of your employees is likely one of your largest expense items and one of their favorite perks. It’s important to know where you stand. ACME Inc Monthly Contribution National Industry Average Monthly Contribution Employee 100% Employee 81% Medical Plan Design Plan design is one component of a comprehensive benefits strategy. Effective plan designs that align with your workforce demographics can help to stabilize benefits costs and attract and retain star performers. Deductible Coinsurance Out-of-pocket Max Plan 1 $3,000 80/20% $5,000 Plan 2 $1,500 90/10% $4,000 Local Industry Average $3,000 80/20% $5,000 Retirement Plan Match A well-rounded benefits program requires more than just medical benefits. Employees want multiple choices and options that align with their needs. ACME Inc Match Rate 1% National Industry Average Match Rate 4% Benefits Strategies Here is how you offset the rising costs of medical benefits: Offer a less expensive plan Here is the breakdown of the strategies other companies use to offset those costs: Additional Insights Wage Growth Compensation is one of the most important benefits to an employee. It’s important to know what your industry is doing and how you compare. 3.33% HR SOLUTIONS BENCHMARK PAGE 5
  • 6.
    Risk Turnover Turnover can significantlyimpact a company’s ability to reach revenue targets and strategic goals. ACME Inc Total Turnover Rate 7% Local Industry Average Total Turnover Rate 3% ACME Inc Total Terminations Industry Average Total Terminations State Unemployment Insurance Rate State Unemployment Insurance is an employer’s one controllable payroll tax, and it’s important to mitigate as much risk as possible when dealing with unemployment claims. ACME Inc SUI 3.76% National Industry Average SUI 3.46% Workers’ Compensation Mod Factor Workers’ Compensation can be complicated, and the Experience Mod Factor can have a costly impact on your premiums and ultimately your P&L. Confidence in Regulatory Compliance One a scale of 1 to 5, with 1 being “not confident” and 5 being “extremely confident,” this is how confident you are in your organization’s compliance in the following areas: OSHA EEO E-VERIFY FLSA FMLA COBRA Additional Insights Turnover by Generation Looking at turnover by generation can paint an unseen picture of the culture and engagement of a workforce. Take a look at the average turnover by generation in your industry. Industry Average Turnover Rates 0% Traditionalists 15% Baby Boomers 26% Generation X 52% Millennials 7% Generation Z HR SOLUTIONS BENCHMARK PAGE 6
  • 7.
    Stay Competitive inToday’s Marketplace As you look to grow or sustain your business, establishing a partnership with an HR organization can help you gain a competitive edge. Leveraging innovative tools, customized workforce insights, and proactive HR strategies can help you recruit and retain the right people, maximize your benefits offerings, and protect your organization. The benchmark information presented in this report was prepared for you based on the following information. COMPANY NAME: ACME Inc HEADQUARTERS ZIP CODE: 23229 MSA: 40060 SIC: 8748 NAICS: 541320 This document is intended to provide practical information concerning the subject matter covered and is provided with the understanding that ADP does not render legal advice or other professional services. The material is made available for information purposes only and is not a substitute for legal advice or your professional judgment. ADP and the ADP logo are registered trademarks of ADP, LLC. ADP A more human resource. is a service mark of ADP, LLC. All other marks are the property of their respective owners. Copyright © 2018 ADP, LLC. All rights reserved. HR SOLUTIONS BENCHMARK PAGE 7