Download to read offline


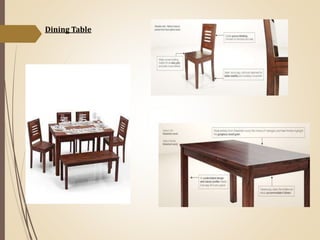
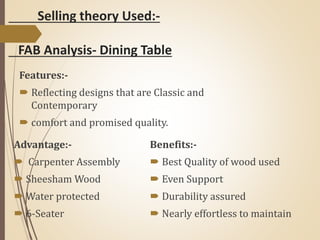
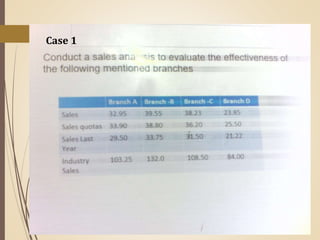
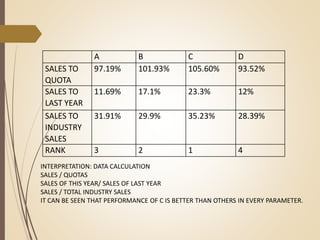
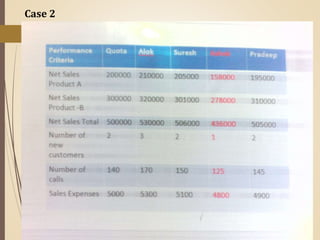
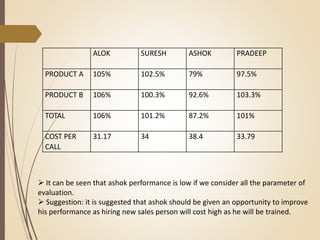
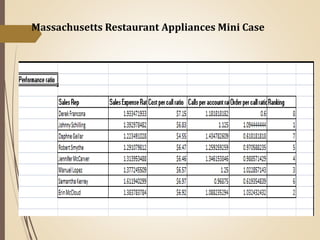
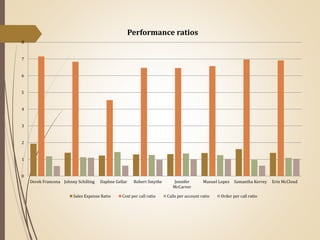
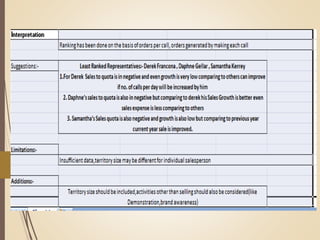
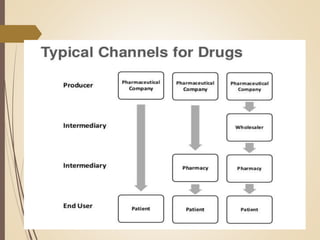

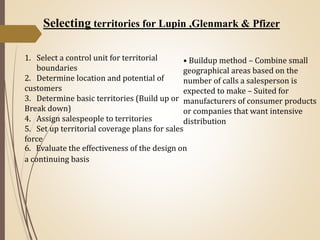

This document summarizes a sales and distribution management presentation submitted by three students. It discusses using FAB analysis to analyze the features, advantages, and benefits of a dining table product. It also includes two case studies, one analyzing the performance of different sales representatives and suggesting ways for an underperforming rep to improve. The other case analyzes performance ratios for different salespeople at a restaurant appliance company. Finally, it discusses three factors to consider when selecting sales territories for pharmaceutical companies Lupin, Glenmark and Pfizer.


