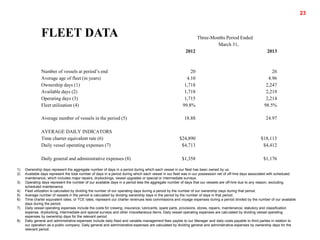
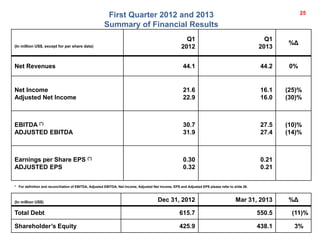
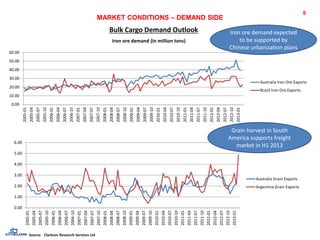
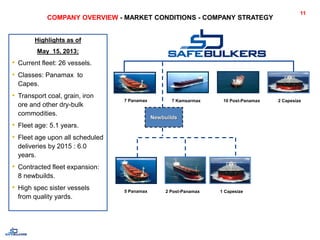
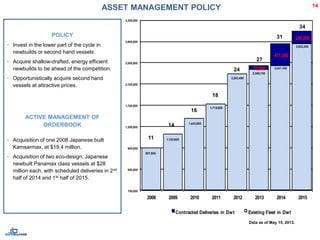
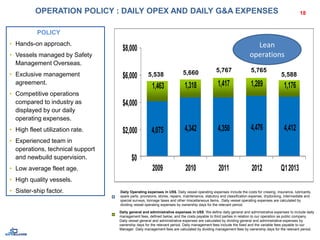
This document provides a summary of Safe Bulkers' 2013 first quarter financial results and industry conditions. It notes that Safe Bulkers currently has a fleet of 26 vessels transporting dry bulk commodities on both long-term charters and in the spot market. The document reviews positive market conditions including growing iron ore and grain demand and a stabilizing secondhand vessel market. It also summarizes Safe Bulkers' strategy of opportunistic fleet expansion and maintaining low operating expenses.


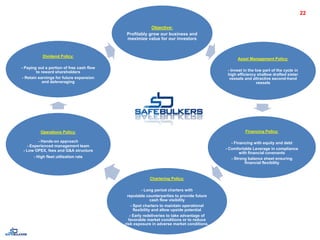
![DIVIDEND POLICY
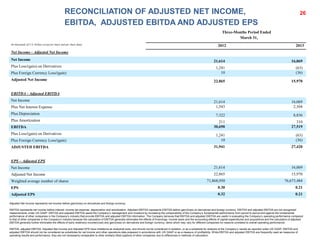
The Board of Directors of the
Company is continuing a policy of
paying out a portion of the
Company’s free cash flow at a
level it considers prudent in light
of the current economic and
financial environment.
The declaration and payment of
dividends, if any, will always be
subject to the discretion of the
Board of Directors of the
Company. The timing and amount
of any dividends declared will
depend on, among other things:
(i) the Company’s earnings,
financial condition and cash
requirements and available
sources of liquidity,
(ii) decisions in relation to the
Company’s growth strategies,
(iii) provisions of Marshall Islands
and Liberian law governing the
payment of dividends,
(iv) restrictive covenants in the
Company’s existing and future
debt instruments and
(v) global financial conditions.
Accordingly, dividends might be
reduced or not be paid in the
future.
0.82
0.72
0.22
1.14
1.07
0.410.42
0.58
0.37
0.33
0.47
0.41
0.270.28
0.33
0.300.28
0.27
0.42
0.21
0.146
0.475
0.15 0.15 0.15 0.15 0.15 0.15 0.15 0.15 0.15 0.15 0.15 0.15 0.15 0.15 0.15
0.050.05 0.05
0.0
0.2
0.4
0.6
0.8
1.0
1.2
Q2
2008
Q3
2008
Q4
2008
Q1
2009
Q2
2009
Q3
2009
Q4
2009
Q1
2010
Q2
2010
Q3
2010
Q4
2010
Q1
2011
Q2
2011
Q3
2011
Q4
2011
Q1
2012
Q2
2012
Q3
2012
Q4
2012
Q1
2013
EPS[$] Dividendpershare [$]
21
20 consecutive
quarterly dividends](https://image.slidesharecdn.com/safebulkersq12013resultspresentation-130517002821-phpapp02/85/Safe-Bulkers-Q1-2013-results-presentation-21-320.jpg)