Paul Dorosh - Wheat Prices, Procurement and Stocks
1.
POLICY REFORMS INFERTILIZER
INDUSTRY
Mubarik Ali
Senior Research Fellow, IFPRI/PSSP
2.
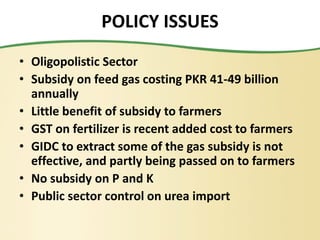
POLICY ISSUES
• OligopolisticSector
• Subsidy on feed gas costing PKR 41-49 billion
annually
• Little benefit of subsidy to farmers
• GST on fertilizer is recent added cost to farmers
• GIDC to extract some of the gas subsidy is not
effective, and partly being passed on to farmers
• No subsidy on P and K
• Public sector control on urea import
3.
FERTILIZER POLICY
“It isthe intent of this policy to provide
investors in new fertilizer plants in Pakistan a
gas price that enables them to compete in the
domestic market with fertilizer exporters of the
Middle East so that indigenous production is
able to support the agricultural sector’s
requirement by fulfilling fertilizer demand.”
4.
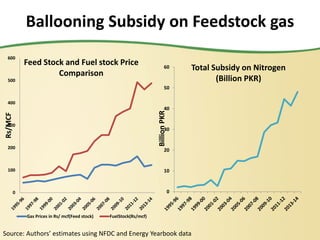
Ballooning Subsidy onFeedstock gas
0
100
200
300
400
500
600
Rs/MCF
Feed Stock and Fuel stock Price
Comparison
Gas Prices in Rs/ mcf(Feed stock) FuelStock(Rs/mcf)
0
10
20
30
40
50
60
Billion
PKR
Total Subsidy on Nitrogen
(Billion PKR)
Source: Authors’ estimates using NFDC and Energy Yearbook data
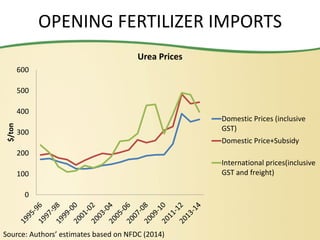
5.
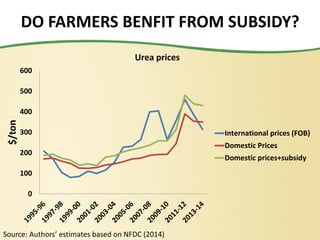
DO FARMERS BENFITFROM SUBSIDY?
Source: Authors’ estimates based on NFDC (2014)
0
100
200
300
400
500
600
$/ton
Urea prices
International prices (FOB)
Domestic Prices
Domestic prices+subsidy
6.
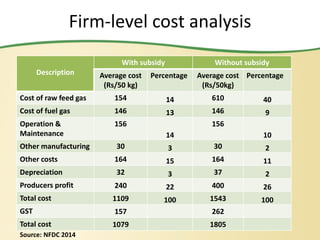
Firm-level cost analysis
Description
Withsubsidy Without subsidy
Average cost
(Rs/50 kg)
Percentage Average cost
(Rs/50kg)
Percentage
Cost of raw feed gas 154 14 610 40
Cost of fuel gas 146 13 146 9
Operation &
Maintenance
156
14
156
10
Other manufacturing 30 3 30 2
Other costs 164 15 164 11
Depreciation 32 3 37 2
Producers profit 240 22 400 26
Total cost 1109 100 1543 100
GST 157 262
Total cost 1079 1805
Source: NFDC 2014
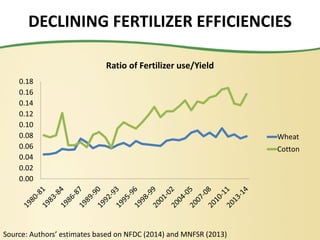
7.
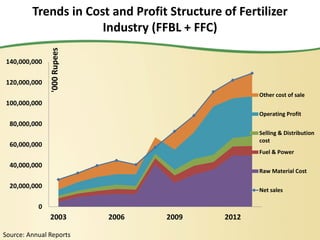
Source: Annual Reports
Trendsin Cost and Profit Structure of Fertilizer
Industry (FFBL + FFC)
0
20,000,000
40,000,000
60,000,000
80,000,000
100,000,000
120,000,000
140,000,000
2003 2006 2009 2012
'000
Rupees
Other cost of sale
Operating Profit
Selling & Distribution
cost
Fuel & Power
Raw Material Cost
Net sales
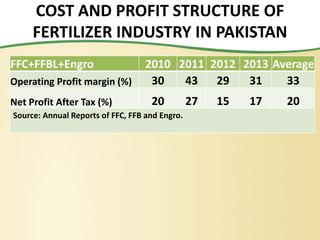
8.
COST AND PROFITSTRUCTURE OF
FERTILIZER INDUSTRY IN PAKISTAN
FFC+FFBL+Engro 2010 2011 2012 2013 Average
Operating Profit margin (%) 30 43 29 31 33
Net Profit After Tax (%) 20 27 15 17 20
Source: Annual Reports of FFC, FFB and Engro.
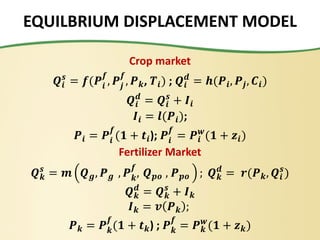
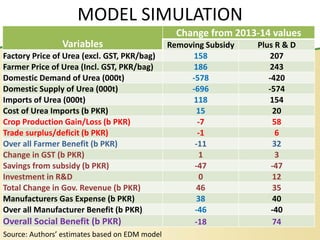
MODEL SIMULATION
Source: Authors’estimates based on EDM model
Variables
Change from 2013-14 values
Removing Subsidy Plus R & D
Factory Price of Urea (excl. GST, PKR/bag) 158 207
Farmer Price of Urea (Incl. GST, PKR/bag) 186 243
Domestic Demand of Urea (000t) -578 -420
Domestic Supply of Urea (000t) -696 -574
Imports of Urea (000t) 118 154
Cost of Urea Imports (b PKR) 15 20
Crop Production Gain/Loss (b PKR) -7 58
Trade surplus/deficit (b PKR) -1 6
Over all Farmer Benefit (b PKR) -11 32
Change in GST (b PKR) 1 3
Savings from subsidy (b PKR) -47 -47
Investment in R&D 0 12
Total Change in Gov. Revenue (b PKR) 46 35
Manufacturers Gas Expense (b PKR) 38 40
Over all Manufacturer Benefit (b PKR) -46 -40
Overall Social Benefit (b PKR) -18 74
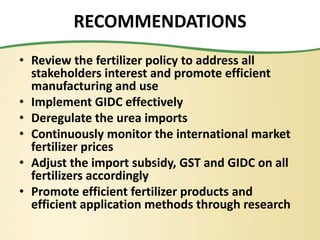
13.
RECOMMENDATIONS
• Review thefertilizer policy to address all
stakeholders interest and promote efficient
manufacturing and use
• Implement GIDC effectively
• Deregulate the urea imports
• Continuously monitor the international market
fertilizer prices
• Adjust the import subsidy, GST and GIDC on all
fertilizers accordingly
• Promote efficient fertilizer products and
efficient application methods through research
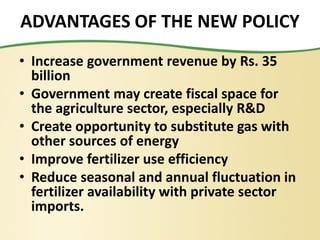
14.
ADVANTAGES OF THENEW POLICY
• Increase government revenue by Rs. 35
billion
• Government may create fiscal space for
the agriculture sector, especially R&D
• Create opportunity to substitute gas with
other sources of energy
• Improve fertilizer use efficiency
• Reduce seasonal and annual fluctuation in
fertilizer availability with private sector
imports.
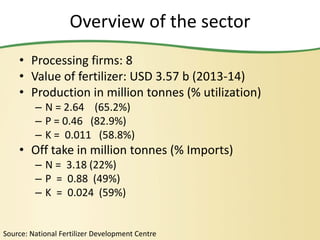
Overview of thesector
• Processing firms: 8
• Value of fertilizer: USD 3.57 b (2013-14)
• Production in million tonnes (% utilization)
– N = 2.64 (65.2%)
– P = 0.46 (82.9%)
– K = 0.011 (58.8%)
• Off take in million tonnes (% Imports)
– N = 3.18 (22%)
– P = 0.88 (49%)
– K = 0.024 (59%)
Source: National Fertilizer Development Centre
17.
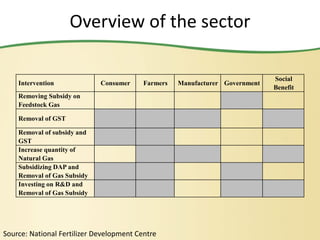
Overview of thesector
Source: National Fertilizer Development Centre
Intervention Consumer Farmers Manufacturer Government
Social
Benefit
Removing Subsidy on
Feedstock Gas
Removal of GST
Removal of subsidy and
GST
Increase quantity of
Natural Gas
Subsidizing DAP and
Removal of Gas Subsidy
Investing on R&D and
Removal of Gas Subsidy