Downloaded 13 times


![6
Special Issue of the International Dairy Federation 1201 IDF International Symposium on
Sheep, Goat and other non-Cow Milk
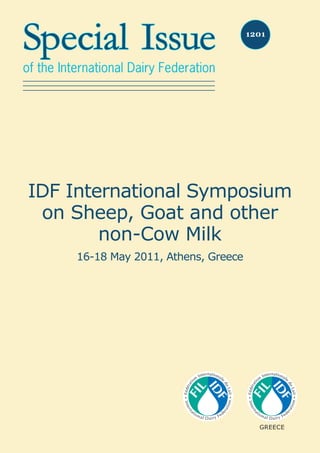
1.2. (S1.7) The Situation of Sheep and Goat’s Milk in Iran
M. Soltani1, D. Say2, N. Güzeler1
Summary
Iran’s total raw milk production is 7 905 406 tons and accounts for the 1.12% of the total world
production. 84.43% of total raw milk produced in Iran is cow’s milk, 7.10% is sheep’s milk,
5.26% is goat’s milk and 3.20 % buffalo’s milk. About 60% of total raw milk produced in Iran
is industrially processed. A small part of milk which is used in dairy factories for dairy products
manufacture is sheep’s milk. Sheep’s and goat’s milk are usually used to produce various
traditional cheeses such as Lighvan cheese, Khikki cheese, White cheese and traditional fermented
dairy products such as concentrated yoghurt, Kashk, liquid Kashk and yoghurt drink. The aim
of this review is to assess the situation of sheep and goat’s milk in Iran and to introduce Iran’s
dairy products which are made from them.
1. Sheep and goat’s milk production in Iran
According to the some estimates more than 750 million goats and 1 billion sheep are scattered
around the world [1]. Dairy sheep and goats have an important role in dairy industry of
Mediterranean and Middle East region countries [2]. Iran’s total raw milk production is 7 905
406 tons and accounts for the 1.12% of the total raw milk that is produced in the world [3].
Like the other parts of the world, much more cow’s milk is produced than milk of other lactating
animals in Iran, such that a large amount of raw milk produced is cow’s milk (84.43%). This is
followed by sheep’s milk (7.10%), goat’s milk (5.26%) and buffaloes’ milk (3.20%).
Iran ranks 7th in the world and 4th in Asia for sheep milk production with 534000 tonnes
and is 0.26% of world sheep milk production approximately (Table 1). The ratio of sheep milk
production to sheep population in Iran is lower than elsewhere in the world. It seems that this
subject is related to some parameters such as feeding, race and weather conditions [4].
Iran goat milk production is 410 000 tonnes and is constituted of 0.22 % of world goat milk
production approximately (Table 2). According to amount of goat milk produced, Iran qualified
8th in the world and 4th in Asia. Because of some parameters such as race, feeding and
environmental conditions the ratio of goat milk production to goat population in Iran is lower
than elsewhere in the world [4].
1 Department of Food Engineering, Faculty of Agriculture, University of Çukurova, Adana, Turkey.
2 Vocational School of Pozantı, University of Çukurova, Adana, Turkey (dsay@cu.edu.tr).
Table 1: World and Iran sheep population and sheep milk production in 2005-2008 [4]
2005 2006 2007 2008
World Sheep Population 1091375497m 1104192341m 1105610121m 1086307458m
Iran Sheep Population 52219000* 52219000** 53800000* 53800000*
World Sheep Milk Production
(tonnes)
194101483m 207399826m 210343406m 205304768m
Iran Sheep Milk
Production (tonnes)
534000* 543935** 534000* 534000*
* FAO estimated data; ** Official data; m May include official, semi-official or estimated data](https://image.slidesharecdn.com/sissue012012finalcat-140620033827-phpapp01/85/S-issue-01_2012_finalcat-11-320.jpg)
![7
Special Issue of the International Dairy Federation 1201 IDF International Symposium on
Sheep, Goat and other non-Cow Milk
2. Use of Sheep and Goat’s Milk in Iran Dairy Industry
A large part of milk which is used in Iran dairy factories in order to produce industrial dairy products
is cow’s milk and relastively little of it is sheep milk. There is no record about the industrial use
of goat’s milk in Iran dairy industry. Sheep and goat milk generally is used for traditional dairy
production such as lighvan cheeses, concentrated yoghurt, doogh (yoghurt drink), kashk and
traditional liquid kashk.
Lighvan cheese, one of the most popular cheeses in Iran, is produced in small local dairies
in Lighvan, a region of east Azerbaijan Province in north-west of Iran [5]. It is a semi-hard and
starter-free traditional Iranian cheese and is produced from a mixture of raw sheep and goat’s
milk [6]. Khikki cheese is traditionally made from whole sheep’s milk or mixed sheep and goat’s
milk using natural rennet in the Assalem region in the north of Iran. Cheese produced is ripened
and stored in brine in sheep-skin or goat-skin bags [7].
Concentrated yoghurt is made from cow’s milk at industrial level and from sheep and goat’s
milk or mixture of them at traditional level. The traditional production method consists of strain-
ing yoghurt using a cloth bag. The long time taken by production, nutrient value reduction and
contamination are the disadvantages of the traditional production method [8]. Doogh (yoghurt
drink) is a native beverage in Iran and it consists an important part of families’ daily beverage
consumption. Similar products exist as ayran in Turkey, tahn in Armenia and lassi in Southern
Asia. It is usually produced by mixing set or stirred yoghurt and water at the same rate and
addition some aqueous extracts of local herbs [9,10], some spices such as thyme, cucumber
and garlic essence or a mixture of them.
Kashk, a concentrated yogurt-type product, is produced traditionally with dehydration of
yogurt by sun-drying especially in west and north-west of Iran by villagers and nomads, from
sheep and goat’s milk [11]. It can be kept for long time at ambient temperature without loss
of nutritional value or spoiling [12]. The origin of kashk is in Middle East and it has different
names such as kashk in Iran [13], kurut in Turkey [12], kishk in Lebanon, jub-jub in Syria and
kushuk in Iraq [14].
Liquid kashk is a dairy product that is produced by milling, dilution, addition of salt and
pasteurization of kashk in industrial dairy units. Kashk is made traditionally from sheep and
goat’s milk used to traditional liquid kashk production [11]. It is produced according to the
standard defined by Iran Standard and Industrial Research Institute.
3. Conclusion
A wide variety of traditional dairy products such as lighvan cheese, khikki cheese, concentrated
yoghurt, doogh and kashk are produced from raw sheep and goat’s milk under non-standardized
conditions in the different rural areas of Iran. Due to the absence of a standard production
method, depending on processing method and storing conditions, the compositional characteristics
vary. Also, the microbiological quality of these traditional dairy products is low generally.
However, traditional liquid kashk does not have these problems because of the industrial
Table 2: World and Iran goat population and goat milk production in 2005-2008 [4]
2005 2006 2007 2008
World Goat Population 826905503m 827789739m 836893906m
864400877m
Iran Goat Population 25807000* 25833000** 25531000* 25300000*
World Goat Milk Production
(tons)
169617781m 170635173m 174557394m 179085902m
Iran Goat Milk
Production (tons)
396000* 410056** 410000* 410000*
* FAO estimated data; ** Official data; m May include official, semi-official or estimated data](https://image.slidesharecdn.com/sissue012012finalcat-140620033827-phpapp01/85/S-issue-01_2012_finalcat-12-320.jpg)

![9
Special Issue of the International Dairy Federation 1201 IDF International Symposium on
Sheep, Goat and other non-Cow Milk
1.3. (S1.11) Industrial Designs of Feta Cheese Packaging Using
Advance CAD Systems
V. Alexopoulos1, Dr Ing. P. Kyratsis1,2, N. Efkolidis1, S. Peristeri1
Summary
Feta is a cheese traditionally made in Greece. Since 2002, Feta has been a protected designation
of origin product. According to the relevant EU legislation, only those cheeses produced in
a traditional way in some areas of Greece and made from sheep’s milk or from a mixture of
sheep’s and goats’ milk (up to 30%) of the same area, may be named “Feta”. The term “Feta” in
Greek means “slice”, which is based on the way that Feta cheese is cut into slices in order to be
served as a starter. Although, it is one of the most famous products of Greece and in a number
of cases synonym of the Greek food quality, its packaging is very simple geometrically and its
promotion is based on label design and graphics.
1. Introduction
The present research aims to propose a number of different innovative packaging designs for
such a product, using the principles of industrial design engineering and advanced CAD systems
[1, 2]. The proposed packaging designs stress its name origin and can be used for both the
everyday consumption and for touristic promotion of the Feta cheese. These proposals are
expected to offer a further added value in the already world renowned Feta cheese product,
increase its sales and deliver higher income to the Greek Feta cheese producers. At the same
time, the product can be clearly distinguished from the other white cheeses available in the
market, that in a number of cases compete with the original Feta cheese.
2. Results and Discussion
Feta and olive oil with oregano
The proposed packaging combines the Feta cheese with olive oil and oregano or thyme (a
combination that is a tradition in Greece). Oregano and thyme, herbs with a strong flavor, also
have antibacterial activity when combined with Feta cheese. Olive oil is an ingredient that the
consumers prefer for its taste, flavor and the expected health benefits.
It is a packaging that offers the opportunity to the non native consumer to taste these
ingredients at the same time, as the Greek tradition requires. Thus it increases the possibility
for the consumer to be satisfied by the taste of the product and prefer it again in the future. As
a result, the milk and Feta cheese producers will be able to promote further their final product
and acquire a higher income, which will increase their capacity for further investments.
In this packaging, the main body of a rather ordinary Feta cheese container is extended, to
make an olive shaped sheath, which contains the extra virgin olive oil together with oregano
or thyme and is air tight sealed with aluminum foil (figure 1). The fact that the ingredients are
offered in separate containers, emphasizes the increased quality of the both products, while at
the same time the consumer has the opportunity to serve the cheese by himself.
The promotion of such a product is expected to be very successful not only in all Mediterranean
countries, but in all over the world too, since it promotes a very healthy way of life, which is
recognised globally.
1 Technological Educational Institution of West Macedonia, Department of Industrial Design Engineering, C3
Laboratory, www.c3.teiwm.gr, Kila Kozani, GR50100, Greece.
2 pkyratsis@teikoz.gr](https://image.slidesharecdn.com/sissue012012finalcat-140620033827-phpapp01/85/S-issue-01_2012_finalcat-14-320.jpg)


![13
Special Issue of the International Dairy Federation 1201 IDF International Symposium on
Sheep, Goat and other non-Cow Milk
Session 2: Raw Milk
Posters
2.1. (S2.10) Comparative Study of Terpenes Concentration in
Blood Plasma and Milk of Sheep and Goats Fed Indoors
I. Poulopoulou1, I. Hadjigeorgiou1, E. Zoidis1, T. Masouras2
Summary
The aim of the present study was to investigate the use of terpenes as feed tracers for the
identification of animal products. In a 20 day experiment, 8 ewes and 8 goats were divided in
two equal groups, representing control (C) and treatment (T). In T groups 1g/head of each of
the following terpenes, α-pinene, limonene and β-caryophyllene, was administered daily for
18 days. Milk production was recorded daily and blood plasma and milk samples were also
collected. Blood plasma samples were extracted with organic solvents and Solid Phase Micro-
extraction Method used for milk samples before terpenes were identified on a GC-MS. Dosed
terpenes were found in blood plasma and milk samples of T group for both sheep and goats.
β-caryophyllene was not detected in goats’ milk. It was concluded that terpenes can be integrated
in certification schemes as biomarkers in animal products, but always used together with other
indicators.
1. Introduction
Food tracers can be used to certify quality aspects and origin of animal products and to control
public health risks arising from product consumption [1]. Monoterpenes α-pinene and limonene
and sesquiterpene β-caryophyllene were chosen as a representative of the substances that
originate from pasture and can be used as biomarkers for the identification of animal products
[2].
2. Materials and Methods
In a 20 day experiment, 8 adult lactating ewes and 8 adult lactating goats were divided into
two equal groups, representing control (C) and treatment (T) group. Animals of the T group
were orally administered with 1g of each of the following terpenes, α-pinene, limonene and
β-caryophyllene. A 10 ml mixture of the three terpenes in vegetable oil (soybean oil) was pre-
pared and dosed orally each morning to provide 1g of each of the before mentioned terpenes,
to each of the T goats, for a period of 18 days, while the C goats respectively were receiving 10
ml of plain vegetable oil. Milk production was recorded daily for both species. Blood and milk
samples were also collected at 1, 2, 3, 5, 7, 15, 18, 19 and 20th day of the experiment. Blood
plasma samples were extracted with organic solvents and the Solid Phase Micro-extraction
Method, using PDMS/CAR fiber, was used for milk samples, before terpenes were identified on
a GC-MS.
1 Department of Nutritional Physiology and Feeding, Faculty of Animal Science and Aquaculture, Agricultural
University of Athens, 75 Iera Odos, Athens, 11855, Greece (gpoulop@hotmail.com).
2 Department of Dairy Science, Faculty of Food Science and Technology, Agricultural University of Athens, 75
Iera Odos, Athens, 11855, Greece.](https://image.slidesharecdn.com/sissue012012finalcat-140620033827-phpapp01/85/S-issue-01_2012_finalcat-18-320.jpg)
![14
Special Issue of the International Dairy Federation 1201 IDF International Symposium on
Sheep, Goat and other non-Cow Milk
3. Results and Discussion
The results indicated that terpenes did not have any effect on milk production for both goats
(Table 1) and sheep (Table 2).Dosed terpenes were found in blood plasma of T group for both
sheep and goats, whereas no differences between species were observed. All three terpenes
were identified in ewes’ milk, while β-caryophyllene was not detected in goats’ milk. Moreover,
milk α-pinene and limonene contents varied greatly (P<0.001) between species and days indicating
differences in transfer mechanisms for both ewes and goats.
The different concentrations determined within species, with monoterpenes α-pinene and
limonene to be transferred to a higher degree than β-caryophyllene, to both blood and milk,
urge us to carefully consider the use of these substances as biomarkers. Moreover the variability
of terpene concentration observed in milk samples between the two species can probably be
attributed to the physiological differences between sheep and goats [3].
Table 2: Evolution of sheep milk production (kg/head/day) for the Control (C) and Treatment
(T) groups of animals
Day
Treatment 1 2 3 5 7 15 18 19 20 SE P
C 0.65 0.60 0.48 0.78 0.70 0.70 0.51 0.93 0.75 0.018 ns
T 0.79 0.65 0.71 0.70 0.78 0.78 0.50 0.90 0.88 0.018 ns
Table 3: Evolution of average terpenes concentration in blood plasma of goat and sheep for
the Treatment (T) group of animals
Day
Substance Species 1 2 3 5 7 15 18 19 20 SE P
α-pinene
Goat 0.000 0.010 0.002 0.007 0.040 0.001 0.007 0.007 0.000
0.0052 ns
Sheep 0.000 0.001 0.004 0.005 0.000 0.002 0.006 0.004 0.002
Limonene
Goat 0.000 0.001 0.002 0.026 0.041 0.015 0.001 0.001 0.000
0.0053 ns
Sheep 0.000 0.001 0.001 0.001 0.000 0.000 0.000 0.000 0.002
β-caryophyllene
Goat 0.000 0.000 0.001 0.000 0.003 0.000 0.000 0.000 0.000
0.0001 ns
Sheep 0.000 0.001 0.001 0.001 0.000 0.000 0.000 0.000 0.000
Table 1: Evolution of goat’s milk production (kg/head/day) for the Control (C) and Treatment
(T) groups of animals
Day
Treatment 1 2 3 5 7 15 18 19 20 SE P
C 1.18 1.33 1.59 1.30 1.35 1.28 1.13 1.24 1.20 0.015 ns
T 1.06 1.10 1.14 1.30 1.15 1.11 1.01 1.01 1.03 0.015 ns](https://image.slidesharecdn.com/sissue012012finalcat-140620033827-phpapp01/85/S-issue-01_2012_finalcat-19-320.jpg)

![16
Special Issue of the International Dairy Federation 1201 IDF International Symposium on
Sheep, Goat and other non-Cow Milk
2.2. (S2.12) Growth of Psychrotrophic Bacteria in Raw Goat
Milk and Correlations with Lipolytic and Proteolytic Activities
C.R. Fonseca1, K. Bordin1, D.V. Neeff1, C.A.F. Oliveira1
Summary
This study investigated psychrotrophic bacteria growth in raw goat milk stored at 4 °C for 1,
3 and 5 days and its relation to the lipolytic and proteolytic activities in milk, using casein/
true protein ratio (C/TP) and free fatty acids (FFA) content. Linear increase of lipolytic and
proteolytic psychrotrophs growth during storage was observed. The C/TP ratio did not change
significantly (P<0.05) during storage, indicating low proteolytic activity in milk. However, a
linear increase (P<0.05) in FFA content was observed, showing high level of lipolytic activity
during storage (y = 0.3465x + 0.1223). Strong correlations (P<0.01) were found between
the growth of psychrotrophic microorganisms and the increasing of lipolytic activity in raw milk
during the storage. It is concluded that the storage of raw goat milk at 4 °C favors the growth
of proteolytic and lipolytic psychrotrophic bacteria which is related to undesirable biochemical
changes in milk.
1. Introduction
Due to the low quantity of goat milk produced in small farms, it must be kept under cold storage
for long periods before processing in the dairy industry. The bacterial growth in goat milk during
this storage period depends primarily on refrigeration. Psychrotrophic bacteria may grow readily
at temperatures below 7 °C although their optimum temperature is higher [1]. These micro-
organisms have been studied owing to their production of proteolytic and lipolytic enzymes.
Proteases hydrolyse milk proteins, forming smaller compounds that are responsible for bitter
flavor in milk. The lipolytic enzymes are responsible for fat hydrolysis, increasing the FFA in
milk, resulting in rancid, soapy and fruity flavor to milk [2]. This study evaluated the growth
of psychrotrophic bacteria in raw goat milk during the cold storage for different periods and
correlated their growth with the proteolysis and lipolysis of raw milk.
2. Material and methods
About 100 l of raw bulk goat milk (immediately after milking) were collected in the premises of
the College of Animal Science and Food Engineering of University of São Paulo – Brazil, within
three different weeks, during July and August 2009. The milk was refrigerated at 4.0 ± 0.1 °C
for 1, 3 and 5 days.
Mesophilic bacteria were counted in Plate Count Agar (Merck) after incubation at 37 °C/48h.
Proteolytic psychrotrophic bacteria were counted in Calcium Caseinate Agar (Merck) and
lipolytic psychrotrophic bacteria were counted in Tributyrin Agar (Merck), after 10 days of
incubation at 7 °C.
The goat milk proteolysis was quantitatively estimated through the ratio casein (C)/true
protein (TP), expressed as nitrogen-protein equivalent, using Kjeldahl method, as described
by AOAC [3]. The FFA quantification was realized according to Deeth et al. [4], where 4 ml of
milk were added to a mixture of isopropanol: petroleum ether: H2SO4 and then titrated with
methanolic solution of KOH. Results were expressed in meq.kg-1 of milk.
The Complete Randomized Design with factorial arrangement (3 storage times and 3 repetitions
of experiment) experiment was submitted to statistical analysis using SAS® software [5], using
the proc glm procedure and subsequent regression study by orthogonal contrasts. The Pearson
1 Faculdade de Zootecnia e Engenharia de Alimentos, Universidade de São Paulo, Brasil.
fonsecacr@usp.br, keliani.bordin@usp.br, dineeff@usp.br, carlosaf@usp.br](https://image.slidesharecdn.com/sissue012012finalcat-140620033827-phpapp01/85/S-issue-01_2012_finalcat-21-320.jpg)
![17
Special Issue of the International Dairy Federation 1201 IDF International Symposium on
Sheep, Goat and other non-Cow Milk
correlation coefficients (r) between the values of the log of counts of mesophiles, proteolytic
and lipolytic psychrotrophs and the rates of lipolysis and proteolysis were performed using the
proc corr procedure.
3. Results and discussion
The Brazilian regulations for raw goat milk [6] require maximum level of 5 x 10⁵ cfu.ml-1 of
mesophilic bacteria. The quality of milk used in this study complied with the legislation between
the first and the third day of storage (4.3 x 10⁵ and 4.6 x 10⁵ cfu.ml-1, respectively), but not in
the fifth day, when mesophilic bacteria population reached 3.6 x 10⁶ cfu.ml-1. The populations
of lipolytic psychrotrophic bacteria ranged from 5.2 x 10⁴ to 2.1 x 10⁶ cfu.ml-1 and those of pro-
teolytic bacteria from 2.1 x 10⁵ to 6.0 x 10⁶ cfu.ml-1. As happened with the mesophilic counts,
the growth of psychrotrophs was higher after the third day of storage. Between 1 and 3 days
of storage, the populations of lipolytic and proteolytic psychrotrophs were similar. The increase
was linear (P<0.05), of mesophiles (y = 0.4845x + 4.7626; R2 = 0.96), lipolytic (y = 0.8045x
+ 3.9855; R2 = 0.97) and proteolytic (y = 0.7278x + 4.5022; R2 = 0.95) psychrotrophs in
raw goat milk during storage. This effect was expected, since it is known that psychrotrophs
can grow at low temperatures. Furthermore, psychrotrophs have optimal growth in mesophilic
temperature range, which explains the observed linear increase of mesophilic population in raw
goat milk during storage.
The proteolysis and lipolysis of raw goat milk during the storage on the fifth day was 0.85
for C/TP and 1.088 meq.L-1 for milk for FFA content. Between first and third days, the FFA
contents were similar (0.530 vs 0.693 meq.l-1 of milk). The C/TP ratios were also similar (0.88
and 0.89, respectively). The higher values of lipolytic activity on fifth day of storage coincide
with the higher growth of the lipolytic microorganisms in raw milk, showing increasing linear
effect (P<0.05) during the storage time (y = 0.3465x + 0.1223). However, no effect (P>0.05)
of the storage time was observed on the proteolytic activity in milk.
Highly significant (P<0.01) correlations were found between the growth of microorganisms
and the proteolytic and lipolytic activities in raw milk (Table 1). The correlations between the
proteolytic activity and the counts of mesophiles, proteolytic and lipolytic psychrotrophs were
-0.70, -0.70 and -0.49, respectively, indicating that the growth of these bacteria decreases the
C/TP ratio and consequently, increases the proteolytic activity during the storage. The correlations
between the FFA contents and the same microbial group were 0.87, 0.81 and 0.74, respectively,
showing a high positive correlation between the growth of these microorganisms and the
lipolytic activity in milk during storage.
4. Conclusion
The storage of raw goat milk at 4 °C favors the growth of proteolytic and lipolytic psychrotrophic
bacteria and this group of bacteria is significantly correlated with the increase of proteolysis (by
decreasing the ratio casein/true protein) and lipolysis (by increasing free fatty acids content) in
Table 1: Correlation coefficients (r) between mesophiles, proteolytic and lipolytic psychrotrophs
growth and the lipolysis (FFA content) and proteolysis (ratio casein/true protein) in raw goat milk
stored for up 5 days at 4 °C
C/TP FFA
r P-value r P-value
Mesophilic counts - 0.70 0.001 0.87 <0.001
Proteolytic psychrotrophs - 0.70 0.001 0.81 <0.001
Lipolytic psychrotrophs - 0.49 0.039 0.74 0.003](https://image.slidesharecdn.com/sissue012012finalcat-140620033827-phpapp01/85/S-issue-01_2012_finalcat-22-320.jpg)

![19
Special Issue of the International Dairy Federation 1201 IDF International Symposium on
Sheep, Goat and other non-Cow Milk
2.3. (S2.19) Assessing The Charm II Bacterial Receptors
System to Detect Antibiotics in Sheep’s Milk
M. Borras1, M.C. Beltran1, I. Berruga2, A. Molina2, M.P. Molina1
Summary
The aim of this study is to assess the Charm II bacterial receptor system with sheep´s milk
using a specificity and sensitivity study and different types of milk (lyophilised cow´s milk,
lyophilised sheep´s milk and raw sheep´s milk) to establish the control point. To carry out the
study into the specificity of the methods antimicrobial free milk samples were analysed. To
calculate sensitivity 10 milk samples were analysed for the different antibiotics under study
aminoglycosides, betalactams, macrolides, sulfamides and tetracyclines at the Maximum
Residues Limits (MRL). Specificity was higher when using lyophilised sheep’s milk for the
control point. The sensitivity of the Charm II system method was 100% for ampicillin, cloxacillin,
penicillin G, cephalexin, ceftiofur, cefoperazone, gentamicin, neomicym, tetracycline, oxitet-
racycline, sulfadiazine, sulfadimethoxine, erythromycin, espiramycin and tylosin at the MRL
concentration when using lyophilised sheep’s milk for the control point. Therefore the Charm II
system is appropriate to analyse antimicrobial residues in sheep’s milk.
1. Introduction
Antibiotic residues in milk can cause toxicological problems that affect public health [1] and
could also pose a problem for the manufacturing of fermented products such as cheese and
yoghurt [2].
Screening methods have been developed for the detection of antibiotics in milk, among which
we find the bacterial receptors binding system known as Charm II. This test can detect a wide
range of residues in meat tissues, milk, animal urine, farmed fish, farmed shrimp, water, eggs,
feed and honey [3]. For the detection of any antimicrobial drug, Charm II uses a radioactively-
labelled antimicrobial drug ([14C] or [3H]) which competes for specific binding sites on a cell or
a ribosome (binding reagent) with the contaminating drug. When the binding reagent is added
to the milk with antimicrobial drugs, the contaminating antimicrobial drugs bind to receptors in
the cell. This prevents the [14C] or [3H] antimicrobial drug from binding to these sites. Thus, the
more radioactively-labelled and antibiotic bound, the less contaminating the antibiotic is in the
sample. Furthermore, the counts per minute (cpm) are inversely proportional to the amount of
antibiotic present in the sample [4].
It is necessary to point out that a large number of detection methods for residues of antimi-
crobials has been developed and assessed in analysis of cow’s milk and that assessment studies
in sheep’s milk are very scarce [5]. Therefore, this study aims to assess the use of the Charm II
system with sheep´s milk by means of calculating the specificity and sensitivity for the different
antimicrobials groups.
2. Materials and Methods
The milk samples employed in this study were obtained from the sheep in the University Polytechnic
of Valencia’s experimental flock throughout the lactation period. Animals were healthy and did
not receive any kind of treatment during the experiment.
1 Instituto de Ciencia y Tecnología Animal, Universitat Politècnica de València. 46071 Valencia. Spain
(miborllo@upvnet.upv.es)
2 Departamento de Ciencia y Tecnología Agroforestal, Universidad de Castilla-La Mancha. 02071 Albacete. Spain.](https://image.slidesharecdn.com/sissue012012finalcat-140620033827-phpapp01/85/S-issue-01_2012_finalcat-24-320.jpg)


![23
Special Issue of the International Dairy Federation 1201 IDF International Symposium on
Sheep, Goat and other non-Cow Milk
2.4. (S2.20) Effect of Freezing Sheep’s Milk on Microbiological
Methods to Detect Antibiotics
M. Borras1, M.I. Berruga2, A. Molina2, M. Roca3, M.P. Molina1
Summary
The milk samples collected during quality controls are sometimes frozen in laboratories to
confirm results at a later date. Given the possible degradation of some molecules during storage
at low temperatures, a study was proposed to assess the influence of freezing on the sensitivity
to betalactam antibiotics in some microbiological screening methods used to detect residues
in milk. Antimicrobial-free sheep’s milk samples fortified with 6 betalactam antibiotics at the
Maximum Residue Limits equivalent concentration were used. Each milk sample was divided
into 2 aliquots: without a preservative and with acidiol; frozen at -20ºC, -40ºC and -80ºC
and analysed after 0, 3, 7, 15 and 30 days using the CMT Copan, Delvotest MCS and Eclipse
100 microbiological screening tests. In general, freezing milk samples affects the response of
microbiological screening methods. Thus, it would be advisable to avoid freezing sheep’s milk
samples to detect betalactam antibiotics with these tests.
1. Introduction
The presence of antibiotic residues in milk can be related to serious problems for public health
and have negative consequences for the dairy industry [1, 2]. It is therefore necessary to
establish control measures to ensure that milk does not contain drug residues. Usually tests
for antibiotics detection are done on refrigerated milk, and even freezing raw milk samples is a
common practice in laboratories to repeat analyses and to confirm results.
Some authors have studied the influence of freezing on the stability of antimicrobials and
have generally indicated loss of antimicrobial activity with freezing time [3, 4]. There are very
few studies available on the effect of freezing milk samples on antibiotic detection by microbio-
logical methods. Therefore, the aim of this study was to assess the influence of freezing sheep’s
milk samples on the sensitivity to betalactam antibiotics in some microbiological screening
methods used to detect residues in milk.
2. Materials and methods
This study employed 16 antibiotic-free sheep’s milk samples, according to international standard
ISO 13969/IDF 183 [5]. Each milk sample was divided into 2 aliquots: without a preservative
and with acidiol. Milk samples were fortified with 6 betalactam antibiotics (penicillin, ampicil-
lin, cloxacillin, cephalexin, cefoperazone and ceftiofur) at the Maximum Residue Limits (MRLs)
equivalent concentration. When antibiotics were not detected at this concentration, they were
analysed at 2MRL. Afterwards, milk samples were frozen at -20ºC, -40ºC and -80ºC and were
analysed after 0, 3, 7, 15 and 30 days using the CMT Copan, Delvotest MCS and Eclipse 100
microbiological screening tests. To assess the effect of freezing temperature, freezing time and
acidiol on the sensitivity (positive results*100/total samples) of the microbiological methods, a
statistical analysis was performed using the SAS statistical package [6] and the following logistic
regression model:
1 Instituto de Ciencia y Tecnología Animal, Universitat Politècnica de València. 46071 Valencia, Spain
(miborllo@upvnet.upv.es)
2 Departamento de Ciencia y Tecnología agroforestal, Universidad de Castilla-La Mancha. 02071 Albacete, Spain
3 Centro Superior de Investigación en Salud Pública. 46022 Valencia, Spain.](https://image.slidesharecdn.com/sissue012012finalcat-140620033827-phpapp01/85/S-issue-01_2012_finalcat-28-320.jpg)
![24
Special Issue of the International Dairy Federation 1201 IDF International Symposium on
Sheep, Goat and other non-Cow Milk
Lijk = logit [ Pijk ] = β0 + β1 Fi + β2 Tj + β3 Ak + εijkl
where: Lijk= logistic model; [Pijk]= positive or negative probability; β0 = intercept; β1, β2 and
β3= estimated parameters, Fi = freezing temperature as dummy variables: -20ºC: z1=0 and
z2=0; -40ºC: z1=1 and z2=0; -80ºC: z1=0 and z2=1; Tj = freezing time (n=5); Ak= presence of
acidiol as dummy variables: without acidiol, z=0; with acidiol, z=1 and εijkl = residual error.
3. Results and Discussion
The sensitivity of the microbiological methods for betalactam antibiotics calculated from the
non-frozen sheep’s milk samples (freezing time=0) was 100% for all cases, while the percentage
of the positive results obtained lowered when using frozen milk samples. Table 1 offers the
percentages of the decrease in the positive results when samples were frozen regardless of
freezing temperature and time. Freezing-defrosting of sheep’s milk samples interferes with the
results of the microbiological tests for antibiotic detection, mostly for penicillin G, ampicillin and
cefoperazone and for cloxacillin, cephalexin and ceftiofur but to a lesser extent.
The statistical analysis of the factors of variation related to the response of the tests to
detect betalactam antibiotics reveals that the different temperatures studied had no significant
effect (p>0.05). Freezing time significantly (p<0.001) affected the response of the CMT Copan
test for cloxacillin, cephalexin and cefoperazone, and that of Delvotest MCS for ampicillin,
cloxacillin and cefoperazone (Figure 1).
Table 1: Percentage of the decrease in the positive results in microbiological tests when
freezing sheep’s milk samples
Antibiotics
Microbiological Tests
CMT Copan Delvotest MCS Eclipse 100
Penicillin G 69 48 73
Ampicillin 52 48 69
Cloxacillin 11 7 21
Cephalexin 24 17 23
Cefoperazone 54 20 54
Ceftiofur 6 2 5
Frequencyofpositiveresults(%)
Cloxacillin Cephalexin Cefoperazone
3 days
7 days
15days
30days
100
80
60
40
20
0
Copan
Frequencyofpositiveresults(%)
Ampicillin Cloxacillin Cefoperazone
3 days
7 days
15days
30days
100
80
60
40
20
0
Delvotest
Figure 1. Effect of acidiol on the microbiological screening tests’ sensitivity](https://image.slidesharecdn.com/sissue012012finalcat-140620033827-phpapp01/85/S-issue-01_2012_finalcat-29-320.jpg)


![27
Special Issue of the International Dairy Federation 1201 IDF International Symposium on
Sheep, Goat and other non-Cow Milk
2.5. (S2.21) Effect of Detergent Residues in Goat’s Milk on
The Response of Screening Methods for Antibiotic Detection
M.C. Beltrán1, T. Romero1, O.G. Nagel2, R.L. Althaus2, M.P. Molina1
Summary
This study aimed to asses the effect of the presence of residues deriving from detergents
used to clean and disinfect milking machines and milk storage tanks on the response of two
screening methods to detect antibiotics in goat’s milk. Antibiotic-free milk samples spiked with
different commercial detergents (5 acids, 5 alkalis and 5 domestic dishwashing liquids) and 2
disinfectants at different concentrations were used. Spiked milk samples were analysed by a
microbiological method (Eclipse 100) and by a protein receptors binding test (Twinsensor B/T).
Acid detergents and disinfectant products did not affect the response of the methods employed
as the obtained results were negative at the tested concentrations. Alkaline detergents and
domestic dishwashing liquids gave positive results when concentrations were 4-6 ml/l depending
on the product and method employed. These relatively high concentrations are very difficult to
encounter if good practices for cleaning milking machines and milk storage tanks on farms are
implemented.
1. Introduction
Nowadays, residues of antibiotics in raw milk are controlled on livestock farms, in the dairy
industry and/or in quality control laboratories which use microbiological methods and protein
receptor binding tests for a specific group of antibiotics (betalactams and/or tetracyclins).
Screening methods for antibiotic detection can be affected by different factors such as the milk’s
physico-chemical characteristics, natural inhibitors, preservatives, detergents and/or disinfectants
and other substances that are capable of producing non compliant results [1, 2]. Nevertheless,
very few studies about the effect of these factors have been carried out. Thus, this study was
about the effect of the presence of detergent or disinfectant residues on the response of antibiotics
detection methods with goat’s milk.
2. Materials and Methods
Antibiotic-free goat’s milk samples spiked with a selection of specific commercial detergents for
cleaning and disinfection of the milking machine as well as some domestic dishwashing liquids
that are sometimes employed for manual cleaning of milk storage tanks and milking utensils
were used. Eight different testing concentrations were prepared for each of the detergents and
disinfectants considered. These were: 0, 2, 4, 6, 8, 10, 12 and 14 ml/l for alkaline detergent,
disinfectants and domestic dishwashing liquids and 0, 0.25, 0.50, 0.75, 1.0, 1.25, 1.50 and 2.0
ml/l for acid detergents.
Spiked milk samples were analysed in duplicate by a microbiological method, Eclipse100
(Zeu-Inmunotec. Zaragoza, Spain), and by a protein receptor binding test, Twinsensor B/T
(Unisensor S.A. Angleur, Belgium), following each manufacturer’s indications. The Eclipse 100
results were visually interpreted by three trained technicians, while the “ReadSensor” equipment
(Model RS00650) was used with the Twinsensor B/T results. All the results were classified as
negative (compliant) and positive (non compliant).
1 Instituto de Ciencia y Tecnología Animal, Universitat Politècnica de València. 46071 Valencia, Spain
(mbeltran@dca.upv.es)
2 Departamento de Ciencias Básicas. Facultad de Ciencias Veterinarias, Universidad Nacional del Litoral.
3080 Esperanza. Argentina](https://image.slidesharecdn.com/sissue012012finalcat-140620033827-phpapp01/85/S-issue-01_2012_finalcat-32-320.jpg)

![29
Special Issue of the International Dairy Federation 1201 IDF International Symposium on
Sheep, Goat and other non-Cow Milk
Table 3 shows the results for the milk samples with domestic dishwashing liquids, whose
presence had no effect on the response of Eclipse 100. However, positive results were obtained
with Twinsensor B/T with concentrations from 6 ml/l, but only for the detection of tetracyclins.
Results obtained in this study are similar to those reported by other authors in sheep’s milk
[3] and cow’s milk [2, 4] who also indicated that there were interferences in the microbiological
methods when the detergent concentration is near or equal to the recommended usage dose.
As for protein receptor binding methods, results indicate that only high concentrations of
detergent interfere with the results. This coincides with other authors [2] who suggest that
such methods are affected by the detergent at concentrations equal to the recommended usage
dose.
4. Conclusion
Acid detergents and disinfecting products do not affect the Eclipse 100 and Twisensor B/T
methods. However, alkaline detergents and domestic dishwashing liquids affected them when
concentrations were high, at around 4-6 ml/l. All this suggests that, if good farming practices
are implemented for cleaning and disinfecting milking machines and milk storage tanks,
residual high detergent concentrations that can cause interferences in screening methods for
antibiotics cannot be found.
Acknowlegments
This work was a part of the Project AGL-2009-11514 financed by the Spanish Ministry of Science
and Innovation. The authors also wish to thank ZEU-Inmunotec (Zaragoza, Spain) and UNISENSOR
SA (Angleur, Belgium) for their support.
Table 3: Effect of domestic dishwashing liquids concentration on the specificity of Twinsensor
B/T and Eclipse 100
ALKALINE DETERGENTS
Detergent Concentration (ml/l) 0 0.5 1 2 4 6 8 10
Basix
Twinsensor
B1 100 100 100 100 100 100 100 100
T2 100 100 100 100 100 100 100 100
Eclipse 100 100 100 100 100 0 0 0 0
Circoaction AF
Twinsensor
B1 100 100 100 100 100 100 100 100
T2 100 100 100 100 100 100 100 100
Eclipse 100 100 100 100 100 0 0 0 0
Clor FW
Twinsensor
B1 100 100 100 100 100 100 100 100
T2 100 100 100 100 100 100 100 100
Eclipse 100 100 100 100 100 0 0 0 0
Grupaclor
Twinsensor
B1 100 100 100 100 100 100 100 0
T2 100 100 100 100 100 100 100 100
Eclipse 100 100 100 100 83.3 0 0 0 0
Manobactyl
Twinsensor
B1 100 100 100 100 100 100 100 0
T2 100 100 100 100 100 100 100 100
Eclipse 100 100 100 100 100 91.7 0 0 0
1-Betalactams, 2- Tetracyclines](https://image.slidesharecdn.com/sissue012012finalcat-140620033827-phpapp01/85/S-issue-01_2012_finalcat-34-320.jpg)


![34
Special Issue of the International Dairy Federation 1201 IDF International Symposium on
Sheep, Goat and other non-Cow Milk
2.7. (S2.29) Milk Production Parameters and Cheese
Efficiency of Ewes Risen in Two Different Feeding System
O. Maamouri1,2,3, N. Atti1, S. Smeti1,4, M.H. Othmane1,3
Summary
For this experiment on milk production and cheese efficiency, thirty ewes were divided into
three groups. Two groups were reared on a feed lot (FL), receiving silage (FL-S) or hay (FL-H)
ad libitum. The third group was reared on pasture. The concentrate supply was 500 g/day/ewe
for all groups. Milk production of pasture group (540 ml) was significantly higher than FL-H
group (439 ml) while FL-S group had an intermediate level (510 ml). Fat percentage did not differ
between groups, while protein percentage was significantly higher (P=0.05) for FL-S group.
Milk fat and protein content (g/day) were higher for ewes in FL-S and pasture groups than for
FL-H. However, milk urea (mg/dl) was higher for pasture (29) than both FL groups (23). Milk
yield significantly decreased (P<.0001) while fat and protein percentage significantly increased
(P<.0001) as lactation stage advanced. Cheese efficiency was significantly higher (P=0.01) for
FL-S group than other groups.
1. Introduction
In the Mediterranean region, sheep’s milk is used for the manufacture of cheese due to its
richness in useful compounds [Bocquier and Caja, 1993, Othman et al., 2002a]. Control of its
composition, including levels of fat and protein is important, since these parameters largely
determine the cheese yield [Pellegrini et al., 1997]. However, milk yield and cheese efficiency
vary as a result of animal genotype and environment characteristics. Among these factors,
animal feeding plays an important role. The objective of this experiment was to study the milk
production parameters and cheese efficiency of Sicilo-Sarde dairy ewes raised in feedlot (FL) in
comparison to pasture feeding system.
2. Material and methods
The experiment was carried out in the dairy experimental farm (Lafareg) of the National Institute
of Agricultural Research (INRAT). The region has a sub humid climate with 650 mm annual
precipitation. Thirty dairy ewes in middle lactation were divided into three groups. Two groups
were lodged on FL, receiving silage (FL-S) or hay (FL-H) ad libitum. The third group was reared
on triticale pasture (P) with rotational grazing system at a stocking rate of 57 ewes/ha. The
concentrate supply was 500 g/day/ewe for all groups. Individual milk yield was weekly recorded
and samples were analysed for milk fat, protein and urea using Milkoscan 4000 (Foss Electric,
integrated Milk Testing). The cheese yield was determined on individual basis for each sheep.
The process of making cheese until coagulation was applied in test tubes containing 10 ml of
milk [Othmane et al., 2002a].
Data of milk production and composition, and cheese efficiency were analysed by using the
MIXED procedure of SAS® (SAS Institute Inc., 2000, Cary, NC, USA) for block designs with
repeated measures. The statistical model included: diet treatment, time of sampling and their
interaction as fixed effects. Data recorded during pre-experimental period (milk yield, milk
1 INRA-Tunisie, Laboratoire de Productions Animales et Fourragères, 2080 Ariana, Tunisia
(omar_maamouri@yahoo.fr).
2 Institut Supérieur d’Agronomie Chott Meriem, Sousse, Tunisia.
3 Centre Régional de Recherches Agricoles Sidi Bouzid, Tunisia.
4 Faculté des Sciences de Bizerte, Bizerte, Tunisia.](https://image.slidesharecdn.com/sissue012012finalcat-140620033827-phpapp01/85/S-issue-01_2012_finalcat-39-320.jpg)
![35
Special Issue of the International Dairy Federation 1201 IDF International Symposium on
Sheep, Goat and other non-Cow Milk
composition and cheese efficiency) were used as covariates and included in the model.
Differences between diets were performed using the procedure of least squares means [SAS®,
2000], at (P<0.05) unless otherwise declared.
3. Results and Discussion
Chemical composition of various feed resources was determined in the Animal & Forage Production
laboratory at INRAT (Table 1). Chemical composition and nutritive values of experimental feeds
were determined following the method described by Sauvant [1981]. The contents in triticale
and oat hay of crude protein were low (9.7% and 7.5%, respectively). These results are due
to the lack of nitrogen fertilization during the growing cycle of the plant. Similarly, oat silage
presents a low crude protein (9%) probably due to inadequate conditions of storage of silage
causing leaching of crude protein [Nefzaoui and Chermiti, 1989].
Data concerning milk production, composition and cheese efficiency were reported in Table
2. Milk production of P group (540 ml) was significantly higher than FL-H one (439 ml) while
FL-S group had an intermediate level (510 ml). Milk yield significantly decreased (P<0.0001) as
lactating stage advanced. Fat percentage did not differ between groups despite the superiority
for FL-S group which may be due to crude fiber content of oat silage, while protein percentage
was significantly higher (P=0.05) for FL-S (5.4%) group than FL-H and P ones (5%). Fat and
protein percentage significantly increased (P<.0001) as lactation stage advanced. Milk fat and
protein content (g/day) were higher for ewes in FL-S and P groups than for ewes of FL-H one.
However, milk urea nitrogen (mg/dl) was higher for P (29) than both FL groups (23), but the
difference was not significant. The values of this parameter are close to the recommended
levels for sheep milk [Cannas, 2002]. Cheese efficiency values followed the same trend of fat
content throughout the recording period with a medium value of 34.8%. This could be due to
the abundance of fat content in the milk of sheep and its importance in determining cheese
yield [Othmane et al., 2002b]. Cheese efficiency was significantly higher (P<0.01) in FL-S group
(40.5%) than in the FL-H and P groups by 33.6% and 30.4%, respectively. This result may due
to silage nutrients properties like soluble nitrogen content. As lactating stage advanced, cheese
efficiency significantly decreased (P<.0001). A low milk urea and high protein content (casein
content) is often linked to improved cheese yield.
Table 1: Chemical composition of experimental feeds
Triticale Oat Hay Oat Silage Concentrate
DM % 23.7 84 26.2 88.1
Ash % 6.5 8 11 3.3
CP % 9.7 7.5 9.0 16.2
CF % 27.2 28.5 39 15.2
Energy (FU/kg DM) 0.6 0.6 0.5 1
DM: dry matter; CP: crude protein; CF: crude fiber; FU: fodder unit](https://image.slidesharecdn.com/sissue012012finalcat-140620033827-phpapp01/85/S-issue-01_2012_finalcat-40-320.jpg)

![37
Special Issue of the International Dairy Federation 1201 IDF International Symposium on
Sheep, Goat and other non-Cow Milk
2.8. (S2.30) Levels of PCDDs, PCDFs and Dioxin-Like PCBs in
Sheep Milk Collected in Sardinia, Italy
C. Scarano1, M.M. Storelli2, S. Virdis1, A. Mudadu1, C. Spanu1, E.P.L. De Santis1, G.O.
Marcotrigiano2
Summary
Polychlorinated dibenzo-p-dioxins (PCDDs), polychlorinated dibenzofurans (PCDFs) and dioxin-like
polychlorinated biphenyls (DL-PCBs) are widespread contaminants with important implications for
environmental and human health. Milk and dairy products consumption has been classified
as one of the primary pathways of human exposure to these toxic chemicals. In this study
we evaluated the levels of 17 laterally substituted PCDD/Fs and 12 DL-PCBs in 45 sheep milk
samples collected from 15 farms in Sardinia (Italy). Mean concentrations of PCDDs and PCDFs
were 2.31 and 3.11 pg.g-1 fat basis, respectively. Among DL-PCBs, only PCB 118 was detected
in 51.1% of samples. Contamination of milk by PCDD/Fs and DL-PCBs (0.92 pg WHO-TEQ g-1
fat) being within the permissible limit set by the European Commission (6 pg WHO-TEQ g-1 fat)
gives no indication of particular health risk. However, continuous surveillance in milk is needed
to correctly evaluate both the environmental impact and the human health risk.
1. Introduction
Dioxins and Polychlorinated biphenyls (PCBs) are chlorinated heterocyclic organic compounds
characterized by stability and toxicity to humans and animals. The Dioxins include 75 poly-
chlorinated dibenzo-p-dioxins (PCDDs) and 135 polychlorinated dibenzofurans (PCDFs). They
are volatile organic compounds released in the environment as consequence of organic material
and urban refuse combustion, during industrial activities and woodland fires. PCBs are subdivided
in two groups: the dioxin-like (DL-PCBs) and the non-dioxin-like (NDL-PCBs). PCBs have been
widely used in numerous industrial and commercial applications, as fluid for thermal and
hydraulic loops, adhesive components, paints and flame retardant. Among dioxins, the 2,3,7,8-
tetrachlorodibenzo-p-dioxin (TCDD) is the main toxic compound classified by the International
Agency for Research on Cancer (IARC) as “cancerogenous agent for the human” (group 1).
Although DL-PCB show similar toxicity as dioxins, they are classified by IARC as group 2A
“probable human cancerogens”. Dioxins and DL-PCBs, highly persistent in the atmosphere,
can be found in waters, sediments, air and soil. Due to their lipophilic character and low
biodegradability, PCDD/Fs and DL-PCBs are accumulated in foods, especially those with high
lipid content. After ingestion of contaminated vegetables, the toxic compounds are absorbed
in the gastrointestinal tract of the animals and concentrated in the liver and in the body fat.
Milk represent the main route of excretion of dioxins in human and animals [1]. The average
level of contamination reported in milk ranged between 0.6 and 1.0 pg TEQ g-1 of fat for the
PCDDs and PCDFs, and from 0.6 to 1.3 pg TEQ g-1 of fat for DL-PCBs [2]. The aim of the present
research was to assess the level of PCDD/Fs and DL-PCBs contamination in raw bulk tank milk
of sheep reared in 15 different husbandry areas in Sardinia.
2. Materials and methods
The level of contamination with PCDDs, PCDFs and DL-PCBs was determined in 45 raw sheep
bulk tank milk samples collected from 15 extensively managed flocks in Sardinia (Italy). From
1 Department of Animal Biology, University of Sassari, Italy (scarano@uniss.it).
2 Pharmacological-Biological Department, University of Bari, Italy.](https://image.slidesharecdn.com/sissue012012finalcat-140620033827-phpapp01/85/S-issue-01_2012_finalcat-42-320.jpg)
![38
Special Issue of the International Dairy Federation 1201 IDF International Symposium on
Sheep, Goat and other non-Cow Milk
each flock single bulk tank milk samples were collected monthly for three consecutive months
(from March to May). 12 of the 15 flocks were located in an high risk contamination area near
a major industrial pole. 6 farms (group A) were located within 7 Km and 6 farms (group B)
between 7 and 13 km from the industrial sites. 3 farms served as “control” (group C) and were
>140 Km from the main industrial site. The elevation above sea level (a.s.l.) of groups A and
B was between 10 and 49 m, while for group C was between 185 and 400 m a.s.l. Raw milk
samples were collected into glass flasks, transported refrigerated from the site of collection
to the laboratory where they were stored at -20 °C until analysis. Milk was extracted, parti-
tioned, cleaned up, fractionated and analyzed by high resolution gas chromatography-mass
spectrometry (GC/MS Polaris Q, Thermo) according to US EPA Method 1613 modified to include
DL-PCBs [3]. The extraction of lipids for the determination of the DL-PCBs has been carried out
by Erney method [4]. The congeners investigated in the sheep raw milk samples were: PCDDs
(2,3,7,8-TCDD; 1,2,3,7,8-PeCDD; 1,2,3,4,7,8-HxCDD; 1,2,3,6,7,8-HxCDD; 1,2,3,7,8,9-HxCDD;
1,2,3,4,6,7,8-HpCDD; OCDD), PCDFs (2,3,7,8-TCDF; 1,2,3,7,8-PeCDF; 2,3,4,7,8-PeCDF;
1,2,3,4,7,8-HxCDF; 1,2,3,6,7,8-HxCDF; 1,2,3,7,8,9-HxCDF; 2,3,4,6,7,8-HxCDF; 1,2,3,4,6,7,8-
HpCDF; 1,2,3,4,7,8,9-HpCDF; OCDF), non-ortho DL-PCBs (PCB 77; PCB 126; PCB 169) and
mono-ortho DL-PCBs (PCB 105; PCB 114; PCB 118; PCB 123; PCB 156; PCB 157; PCB 167;
PCB 189). The PCDD/Fs and Dl-PCBs contaminations are expressed as concentrations of toxic
equivalents (TEQs), using the toxic equivalency factors (TEFs). Comparison between mean
concentrations was performed by the Least Significance Difference (LSD) test (statistical
significance level P<0.05). The effect of the experimental variables was estimated using the
following generalized linear model: Yijkm=m+Gi+Cj+Ak+eijkm, where the concentration of the
polluting agent Yijkm, is the dependent variable, m is the mean, Gi is the farms group, Cj is the
effect of the sampling date, Ak the altitude and eijkm the residual error. Statistical analysis was
performed using Statgraphics Centurion XVI (StatPoint Technologies, Warrenton, VA, USA).
3. Results and discussion
Milk samples collected near the industrial sites (groups A and B) showed widespread contamina-
tion by PCDDs and PCDFs. PCDDs mean content was 2.31 pg.g-1 fat basis and ranged between
0.11 and 7.13 pg.g-1 fat basis, while PCDFs mean concentrations was 3.11 pg.g-1 fat basis and
ranged between 0.20 and 7.47 pg.g-1 fat basis. Among DL-PCBs, PCB 118 was detected in 48.9% of
milk samples with mean concentration of 0.73 ng.g-1 fat basis, while other congeners were never
found at detectable levels. PCDDs and PCDFs concentrations were lower in the first sampling as
compared to the second and third (P<0.05). The location of the farms (groups A, B and C), the
date of sampling and the altitude had a significant effect on PCDDs and PCDFs concentrations
(P<0.05), while no effects were observed for congener PCB 118. Among PCDDs, OCDD was the
2,3,7,8-substituted congener detected at the highest levels in most of the samples examined
(0.78 pg.g-1 fat basis), followed by 2,3,7,8-TCDD (0.41 pg.g-1 fat basis), 1,2,3,7,8,9-HxCDD
(0.41 pg.g-1 fat basis) and 1,2,3,4,6,7,8-HpCDD (0.39 pg.g-1 fat basis), while 1,2,3,7,8-PeCDD
exhibited the lowest concentration (0.01 pg.g-1 fat basis). Among furans, the lower chlorinated
penta PCDFs were in general more represented than the higher chlorinated PCDFs (hepta and
octa PCDFs). In particular, the prevalent congeners were 1,2,3,7,8-PeCDF and 2,3,4,7,8-PeCDF
which collectively accounted for 40.9% of the PCDFs, followed by OCDF (19.9%), 1,2,3,4,7,8,9-
HpCDF (13.5%) and 1,2,3,4,6,7,8-HpCDF (10.3%) and to a lesser extent by HxCDFs (1.2-
9.0%), while 1,2,3,6,7,8-HxCDF was below the detection limit in all samples analyzed. Com-
parison between dioxins and furans showed that 2,3,7,8-TCDD, the most toxic congener, was
present in 77.8% of milk samples, while 2,3,7,8-TCDF was detected in only four out of 45 sam-
ples. However, in all cases concentrations of 2,3,7,8-TCDD (0.41 pg.g-1 fat basis) were higher
than 2,3,7,8-TCDF (0.03 pg.g-1 fat basis), as well as HxCDDs (0.15-0.41 pg.g-1 fat basis) and
OCDD (0.78 pg.g-1 fat basis) were prevalent compared to HxCDFs (0.04-0.28 pg.g-1 fat basis)
and OCDF (0.62 pg.g-1 fat basis). In contrast, the levels of PeCDFs (0.52-0.75 pg.g-1 fat basis)
and HpCDFs (0.32-0.42 pg.g-1 fat basis) were higher than the corresponding dioxin homologue
groups (PeCDD: 0.01 pg.g-1 fat basis; HpCDD: 0.39 pg.g-1 fat basis). Contaminations of the
samples of groups A and B were not influenced by the distance from the major industrial pole,](https://image.slidesharecdn.com/sissue012012finalcat-140620033827-phpapp01/85/S-issue-01_2012_finalcat-43-320.jpg)

![40
Special Issue of the International Dairy Federation 1201 IDF International Symposium on
Sheep, Goat and other non-Cow Milk
2.9. (S2.36) Evaluation of a microbial indicator test for
antibiotic detection in ewe, goat and cow milk
R. Comunian1, I. Dupré1, A. Paba1, E. Daga1, S. Schirru1, M. F. Scintu1
Summary
The presence of residual antibiotics in milk could cause potentially serious problems in human
health and have technological implications in the manufacturing of milk products. The aim of
this study was to evaluate the ability of Delvotest® T in detecting seven antibiotics (penicillin
G, tetracycline, gentamicin, sulfadiazine, oxytetracycline, ceftiofur, and ampicillin) in ewe, goat
and cow milk. Twenty-seven samples of raw, whole, refrigerated bulk-tank milk were analyzed.
Higher detection ability was observed for cow and goat milks, compared with ewe’s milk samples.
Four out seven antibiotics were detected at or below the EU-MRL for all milk samples, while
oxytetracycline and ampicillin over. Tetracycline was detected below the EU-MRL only in cow
milk. Correlations (P<0.05 or P<0.01) between results obtained and some milk parameters
were observed for tetracycline and oxytetracycline. The milk composition affects the bioavailability
of oxytetracycline and tetracycline, and might slightly influence the detection of these drugs.
1. Introduction
Antibiotics are widely used for therapeutic and prophylactic purposes in human and veterinary
medicine. In regard to dairy animals, to avoid risks related to drug residues in milk, maximum
residue limits (MRL) have been established by law in many countries for each antimicrobial
agent. In the European Union, the MRLs (EU-MRL) in foodstuffs of animal origin are established
by the Codex Alimentarius Commission [1], the Regulation (EC) n. 470/09 [2], repealing the
Council Regulation n. 2377/90 [3], and the Commission Regulation (EU) n. 37/10 [4]. Different
methods of analysis for the detection of residues of inhibitors, mostly in cow milk, have been
developed and evaluated [5], whereas few studies have been carried out so far for ewe and
goat milks [6].
The aim of this study was to evaluate the ability of a prototype of Delvotest® T (DSM Food
Specialties - Delft, the Netherlands) in detecting the presence of seven antibiotic residues in
ewe, goat and cow milk, according to what is stipulated in FIL-IDF STANDARD 183:2003 “Milk and
milks products – Guidelines for the standardized evaluation of microbial inhibitor tests” [7].
2. Materials and methods
Milk samples and analyses. Twenty-seven samples of raw, whole, refrigerated bulk-tank
milk (13 ewe, 7 goat, and 7 cow milk samples) were analyzed. According to the guidelines [7]
all the animals were in good health condition, free from antibiotics for at least 8 weeks before
milk collection. Milk samples were analyzed with MilkoScan 4000 (FOSS Electric A/S, Hillerød,
Denmark) to determine the chemical composition (Fat, Protein, Lactose). Somatic cells count
(SCC) was measured with Fossomatic 5000 (FOSS Electric A/S). The pH values were measured
with a pH meter (pH302 Hanna Instruments, UK). Bacteria levels were verified by Standard
Plate Count (SPC) [8].
Antibiotics evaluation trials. The chosen antibiotics, the tested concentrations, and the
respective EU-MRL are reported in Table 1. The experimental plan was designed in 2 phases: 1)
3 concentrations (1, 2 and 3) of each antibiotic were tested on milk samples of each lactiferous
1 Dipartimento per la Ricerca nelle Produzioni Animali, AGRIS Sardegna, Loc. Bonassai – I 07040 Olmedo
(SS), Italy. (rcomunian@agrisricerca.it)?](https://image.slidesharecdn.com/sissue012012finalcat-140620033827-phpapp01/85/S-issue-01_2012_finalcat-45-320.jpg)


![47
Special Issue of the International Dairy Federation 1201 IDF International Symposium on
Sheep, Goat and other non-Cow Milk
2.11. (S2.50) Effects of Two Diets on Milk Production and Milk
Composition of High Producing Dairy Goats Milked Once A Day
Y. Lefrileux1, S. Raynaud2, S. Morge3, J. Barral4, Y. Gauzere5, E. Doutart2, C. Laithier2
Summary
This study was about the effect of the goats diet on milk composition for farmhouse lactic
cheese-making. On an experimental farm two groups of 60 goats were fed with two different
diets for two months: one group with a high nitrogen level and the second one with a low nitrogen
level. Individual zootechnical measures were taken every week and the milk composition of
each group was measured once or twice a week. The group fed with the high nitrogen level diet
gave more milk, but milk with a lower fat level. The level of urea in the milk and also dry matter
content, fat, sodium chloride and citrate changed according to the diet. There was a small, yet
significant, difference for total nitrogen, soluble nitrogen, non protein nitrogen and potassium.
The urea content of the milk can be linked to the rumen degradable nitrogen balance ratio
(PDIN-PDIE supplies/UFL supplies) of the diet.
1. Introduction
This study was part of a program dealing with the sustainability of the use of natural whey
starter for farmhouse lactic cheeses made from raw goats milk. Its goal was to study the
technological consequences of feed-related milk nitrogen composition variations, since urea
excess in the milk has been suspected to create curd drawbacks for lactic cheeses or a slowdown
in acidification during the making of semi-hard cheeses [8, 9].
The poster and the present article were only focused on the effects of the diet on milk
composition. The technological consequences of these changes in milk composition are described
elsewhere [6].
2. Materials and Methods
The experiment took place at the Pradel Experimental Farm (France). Two groups of 60 goats
were fed with two different diets for two months: one group with a high nitrogen level (20 to
22% of total nitrogen content) and the other with a low nitrogen level (14 to 15% of total nitrogen
content). The rumen degradable nitrogen balance ratios (PDIN-PDIE supplies/UFL supplies)
were very different for the two diets: -4 for group 1 and 26 for the group 2.
Individual zootechnical measures were taken every week and milk composition of each group
was measured once or twice a week. An analysis of variance for longitudinal data was carried
out to study the diet effect on these zootechnical measures. It was impossible to analyse each
individual milk sample in detail. In consequence, once a week for 7 weeks, we created 3 small
groups of 8 randomly chosen goats and their milk was analysed. The diet effect was tested by
analysis of variance.
SAS software was used for these analysis (SAS Institute Inc, Cary, NC, version 9.1).
1 Station expérimentale caprine du Pradel EPLEFPA, Le Pradel, 07170 – MIRABEL, France.
2 Institut de l’Elevage, Agrapole, 23, rue Jean Baldassini, 69364 – LYON CEDEX 07, France
(sabrina.raynaud@idele.fr)
3 PEP caprins Rhône-Alpes, Le Pradel, 07170 – MIRABEL, France.
4 Actilait Centre de Carmejane, Le Château, 04510 – LE CHAFFAUT SAINT JURSON, France.
5 ENILBIO Poligny, rue de Versailles, BP49, 39801 - POLIGNY Cedex, France.](https://image.slidesharecdn.com/sissue012012finalcat-140620033827-phpapp01/85/S-issue-01_2012_finalcat-52-320.jpg)
![48
Special Issue of the International Dairy Federation 1201 IDF International Symposium on
Sheep, Goat and other non-Cow Milk
3. Results
The group fed with high nitrogen level gave more milk, with lower fat level (Table 1). No difference
was detected between the two groups regarding the protein rate.
The milk production increase and the fat rate decrease were in accordance with the results
of a previous study [7]. The lower fat rate of the milk of the second group can be explained by
a dilution effect or by a higher fat level in the feeds given to the group 1 [10, 11].
Other authors have already pointed out that a variation of the nitrogen content of the diet
has no effect on the protein level of the milk as soon as the energy needs of the animals are
covered by the diet [10].
Milk composition of the two groups was different for urea but also dry matter content, fat,
sodium chloride and citrates (Table 2). There was a small, yet significant, difference for total
nitrogen, soluble nitrogen, non protein nitrogen and potassium. There did not seem to be any
difference between the groups regarding protein, caseins, lactose, calcium and phosphorus.
Furthermore, the milk urea content could be linked to the rumen degradable nitrogen balance
ratio (PDIN-PDIE supplies/UFL supplies) of the diet.
Table 1: Mean values and standard deviations (in brackets) of milk production, fat and
protein rate for each group / diet (risk 5%)
Criteria
Group 1
(n=60)
Group 2
(n=60)
Group effect
Milk production (kg/goat/d) 3,51 (0,93) 3,77 (0,99) ***
Fat rate (g/kg) 33,08 (3,83) 30,02 (3,96) ***
Protein rate (g/kg) 32,31 (2,05) 32,23 (2,04) ns
* p< 0,05 ** p< 0,01 *** p<0,001 ns : not statistically significant
Table 2: Mean values and standard deviations (in brackets) of milk composition criteria for
each group / diet (risk 5%)
Component
Group 1
(n = 7)
Group 2
(n=7)
Group effect
Dry matter (g/kg) 119,19 (1,43) 115,74 (2,54) **
Fat content (g/l) 33,79 (1,7) 30,45 (2,55) **
True Protein (g/l) 32,5 (0,80) 32,5 (0,45) ns
Total Nitrogen (g/kg) 5,47 (0,14) 5,59 (0,09) *
Soluble Nitrogen (g/kg) 1,27 (0,09) 1,42 (0,06) ***
Non protein nitrogen (g/kg) 0,33 (0,06) 0,44 (0,03) ***
Caseins (g/kg) 26,76 (0,74) 26,61 (0,65) ns
Urea (mg/l) 289,52 (152,88) 609,10 (73,05) ***
Lactose (g/l) 44,0 (1,32) 43,3 (0,87) ns
Calcium (g/kg) 1,14 (0,03) 1,12 (0,04) ns
Phosphorus (g/kg) 0,87 (0,04) 0,88 (0,03) ns
Sodium chloride (g/kg) 2,92 (0,20) 3,06 (0,11) *
Potassium (g/kg) 0,76 (0,03) 0,80 (0,02) **
Citrates (g/kg) 1,23 (0,05) 1,04 (0,10) ***
* p< 0,05 ** p< 0,01 *** p<0,001 ns : not statistically significant](https://image.slidesharecdn.com/sissue012012finalcat-140620033827-phpapp01/85/S-issue-01_2012_finalcat-53-320.jpg)
![49
Special Issue of the International Dairy Federation 1201 IDF International Symposium on
Sheep, Goat and other non-Cow Milk
Urea is known to be strongly influenced by the goat’s or cow’s diet [7, 10, 13]. Agabriel et
al. have shown that the citrate content of the cow milk can be influenced by the grazing period
or the type of farm and diet [1, 2].
The differences concerning the potassium, though significant, are very small. A higher sodium
chloride content for the group 2 (+5%) could have been explained by mammary infections, but
the average somatic cell counts are similar for the two groups.
Several criteria were not affected by the diet: lactose plays a role in milk production in the
udder and remains stable in the milk [3], calcium remains stable because the animal can mobilize
the body’s calcium reserves [4]. If the energy and nitrogen needs of the goats are covered by
the diet, the protein and casein contents of the milk are not affected by the nitrogen content of
the diet [5].
4. Conclusion
This study has shown that:
• Nitrogen excess in the goat’s diet not only has an impact on milk quantity and milk nitrogen
components, but also on the minerals.
• The rumen degradable nitrogen balance ratio (PDIN-PDIE supplies/UFL supplies) of the diet
influences the urea content of the milk.
Another part of this study (data not shown) focussed on the technological consequences of
these differences in milk composition for farmhouse lactic cheeses made from raw goat’s milk
with natural whey starter.
Acknowledgments
This study was funded by the French Ministry of Agriculture, FranceAgriMer and the Rhône-
Alpes region. We thank the staff of the Pradel experimental farm and Elodie Braud.
References
1. Agabriel, C., Hauwy, A. & Coulon, J.B. Effet des systèmes d’élevage sur la composition
chimique fine des laits de troupeaux des Alpes du Nord et du Massif Central. 3R, Paris. INRA-
Institut de l’Elevage, 7:292-295 (2000).
2. Agabriel, C., Coulon, J.B., Journal, C., De Rancourt, B. Composition chimique du lait et
systèmes de production dans les exploitations du Massif Central. INRA Prod. Anim. 14:119-
128 (2001).
3. Alais, C. Les glucides, le lactose, l’acide lactique. In : Science du lait. Sepaic, Paris, 814
pages (1984).
4. Brulé, G. Les minéraux. In: Le lait matière première de l’industrie. CEPIL, Paris, 394 pages
(1987).
5. Coulon, J.B., Hurtaud, C., Rémond, B., Vérité, R. Facteurs de variation de la proportion de
caséines dans les protéines du lait de vache. INRA Prod. Anim. 11 (4):299-310 (1998).
6. Lefrileux, Y., Raynaud, S., Morge, S., Barral, J., Gauzere, Y., Doutart, E., Laithier, C. Influence
de deux systèmes d’alimentation sur la production et la composition du lait de chèvres
hautes productrices et incidences technologiques en fabrication fermière lactique. 3R, Paris.
INRA, Institut de l’Elevage, 16: 139-142 (2009).
7. Lefrileux, Y., Le Scouarnec, J., Pommaret, A., Cirier, N. Incidences zootechniques, technologiques
et sensorielles d’une complémentation avec un aliment élaboré ou des céréales chez des
chèvres laitières conduites au pâturage. 3R, Paris. INRA, Institut de l’Elevage, 12:250
(2005).
8. Martin, B., Coulon J.B., Chamba J.F., Bugaud C. Effect of milk urea content on characteristics
of matured Reblochon cheeses. Lait, 77:505-514 (1997).](https://image.slidesharecdn.com/sissue012012finalcat-140620033827-phpapp01/85/S-issue-01_2012_finalcat-54-320.jpg)

![51
Special Issue of the International Dairy Federation 1201 IDF International Symposium on
Sheep, Goat and other non-Cow Milk
2.12. (S2.52) The Effect of Somatic Cell Count on The
Plasminogen, Plasmin and Plasminogen Activator System
in Ewe Milk
P.D. Angelopoulos1,2, E.M. Zoidou1
Summary
The purpose of this study was to evaluate the effect of somatic cell count (SCC) on the plas-
minolytic system in ewe milk. The distribution of plasminogen activator in different fractions
of milk was also examined. The results showed that the high-SCC milk had greater plasmin,
plasmin + plasminogen and plasminogen activator activities when compared with the low-SCC
milk, while plasminogen level and plasminogen:plasmin ratio were less. Greater plasminogen
activator concentrations were found in high-SCC milk compared to low-SCC milk, mainly localized
within the casein fraction, and in association with somatic cells. Two plasminogen activator
types, tissue- and urokinase-type, were associated with casein micelles, while urokinase-type
was the only form in milk serum and somatic cells.
1. Introduction
Plasmin (PL) which occurs in milk together with its inactive proenzyme, plasminogen (PG), is an
important indigenous heat-stable milk proteinase, with a relatively broad specificity on caseins.
The conversion of PG to PL is regulated by a complex system of molecular interactions between
plasminogen activators (PA) -tissue-(t-PA) and urokinase-type (u-PA)- and specific PA inhibitors
[5]. This system enters milk from blood. Somatic cell count (SCC) is a widely used marker for
both udder health and milk quality. The aim of this study was to evaluate the effect of SCC on
PL, PG, and PA activities in ewe milk. The type of PA in different fractions of ewe milk (casein,
serum and somatic cells) were also examined.
2. Materials and methods
A total of 202 milk samples were collected from a Greek dairy ewe breed (Karagouniko) throughout
a lactation period. The SCC was determined by a Fossomatic cell counter (Foss Electric, Hillerod,
Denmark). Milk samples were also analyzed for PL and PG activities [3, 5]. A total of 24 milk
samples were treated to obtain casein, serum and somatic cell fractions according to White et
al. [6]. A colorimetric assay was used to measure PA activity [1]. To identify the type of PA
present in each of the milk fractions, PA activity was determined in the presence and absence
of fibrin (20 μg/min) or amiloride (1 mM). For statistical analysis the software Statgraphics Plus
for Windows v.5.2 (Manugistics Inc., Rockville, Maryland 20852, USA) was used.
3. Results and discussion
3.1. Effect of SCC on the PG and PL activities
The PG and PL activities in ewe milk samples are shown in Table 1, as average values for four
SCC groups (A, Β, C, D). An increase of SCC from < 5 x 10⁵ /ml to SCC > 20 x 105 /ml resulted
in an increase to PL and PL+PG activities, while PG activity and PG:PL ratio were respectively
1 Laboratory of Dairy Research, Department of Food Science and Technology, Agricultural University,
Greece, ezoidou@aua.gr
2 Hellenic Ministry of Rural Development and Food. Department of Milk and Dairy Products, Greece,
peteraggel@gmail.com](https://image.slidesharecdn.com/sissue012012finalcat-140620033827-phpapp01/85/S-issue-01_2012_finalcat-56-320.jpg)
![52
Special Issue of the International Dairy Federation 1201 IDF International Symposium on
Sheep, Goat and other non-Cow Milk
decreased. The increase of PL and the decrease of PG:PL ratio in high-SCC ewe milk provide
evidence that there is an increased influx of blood proteins by passing the blood-milk barrier,
whilst at the same time an accelerated conversion of PG to PL occurs.
3.2. Effect of SCC on PA activity in different milk fractions - Type of PA
The quantity and distribution of PA activity in different milk fractions as affected by SCC level is
shown in Table 2. The PA activity presented as the average value for three SCC groups (I, II,
III) was increased with the increasing level of SCC. This elevated PA activity contributed to
the accelerated conversion of PG to PL (shown in Table 1) and maybe resulted from macro-
phages and neutrophils of high SCC milk [4]. PA activity in casein fractions of high SCC milk
(> 20 x 105 /ml) was 2.9 and 1.5-fold higher (P < 0 .05) than that in the casein fractions
of low (< 5 x 10⁵ /ml) or medium (10 x 105 <SCC< 20 x 105 /ml) SCC milk respectively. The
corresponding difference in PA activity for the high SCC serum fractions was 7.16 and 1.07-fold
higher and for the somatic cell extracts was 2.04 and 1.40-fold higher (P < 0.05). It is interest-
ing to note that the majority of PA activity across the SCC groups was in casein fractions and
then in somatic cell extracts. The lower PA values in the serum fractions could be attributed
to the occurrence of inhibitors in milk serum. These findings corroborate the observations by
Heegard et al. (1994) [2] for bovine milk.
The effect of fibrin and amiloride on PA activity in each fraction of ewe milk samples is shown
in Figure 1. There was a 43.7% increase in the PA activity associated with the casein fraction
in the presence of fibrin, indicating that t-PA was present. The ability of amiloride to inhibit PA
activity by 43.6% indicated the presence of u-PA in addition to t-PA. The PA activity associated
with the somatic cell extracts and serum fraction remained almost unaffected by the presence
of fibrin, but was strongly inhibited by amiloride (89% and 87,5% respectively), indicating that
only u-PA was present in serum fraction and somatic cell extracts.
Table 1: Plasmin (PL), plasminogen (PG), PL+PG activities (Units/ml)1 and PG:PL ratio in ewe
milk as affected by SCC (cells/ml)
SCC PG PL PG+PL PG/PL
A: SCC <5 x 10⁵ 29.10a 12.98a 42.08d 4.27a
Β: 5 x 10⁵ <SCC< 10 x 105 23.86ab 19.81b 43.67d 1.79b
C: 10 x 105 /ml <SCC< 20 x 105 20.17ab 23.81b 43.98de 0.85c
D: SCC >20 x 105 19.10b 35.89c 54.99e 0.65c
1 Values are means of 202 individual milk samples
a,b,c Means within the same column with different superscript differ significantly (Duncan test, P < 0.001)
d,e Means within the same column with different superscript differ significantly (Duncan test, P < 0.01)
Table 2: Distribution of plasminogen activator (PA) activity (absorbance/h)1 in ewe milk
fractions as affected by SCC (cells/ml)
PA activity
SCC Casein Serum
Somatic cells
(per 106 cells/ml)
I: < 5 x 10⁵ 0.175a 0.012a 0.075a
II: 10 x 105 <SCC< 20 x 105 0.340b 0.080b 0.109b
III: > 20 x 105 0.510c 0.086b 0.153c
1 Values are means of 24 individual milk samples
a,b,c Means within the same column with different superscript differ significantly (Duncan test, P < 0.05)](https://image.slidesharecdn.com/sissue012012finalcat-140620033827-phpapp01/85/S-issue-01_2012_finalcat-57-320.jpg)
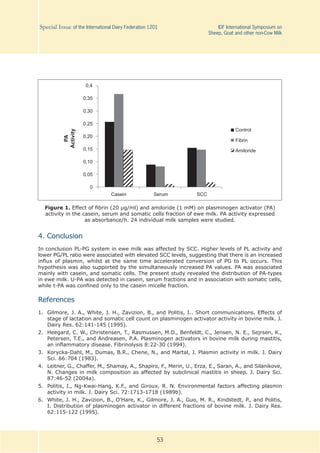
![54
Special Issue of the International Dairy Federation 1201 IDF International Symposium on
Sheep, Goat and other non-Cow Milk
Session 3: Processing and Products
Oral Presentation
3.1. (S3.oral) Relationship Between Technological Steps and
Behaviour of French Goat Cheeses for Culinary Applications
P. Barrucand1, K. Raynal-Ljutovac1
Summary
The use of goat milk cheese as an ingredient in ready made meals is increasing. However,
the lack of data concerning its cooking properties could impede the development of such ap-
plications. Therefore, the culinary behaviour of goat milk cheeses currently sold on the French
market (lactic and semi hard cheeses) was studied thanks to the development or adaptation of
methods (sensory analysis, cooking tests coupled with photographs allowing the evaluation of
flowability with image analysis and rheological measurement). The biochemical composition of
cheeses was also assessed. Significant differences in colour and to a lesser extent of flowability
were found between the cheeses studied but also differences concerning the appearance along
with the occurrence of cracks for most trade products. The last step was dedicated to highlighting
the main factors and mechanisms that are associated with the cooking ability of cheeses, using
experimentally made cheeses.
1. Introduction
A major outlet for cheese exploitation is its use as an ingredient. According to Guinee [1], 35
to 45% of global cheese (all species and especially cow) was used as an ingredient in 2000.
The distribution in Europe, given the dairy tradition of many countries, is as follows: 70, 20 and
10% of cheese consumed by retail sales, food services, and industry, respectively. In the U.S.A.,
these proportions are already distributed equally within the three sectors. The main uses are
hot applications (80%) such as savoury tarts, lasagnes, pizzas and burgers but also industrial
casseroles. Cheese can also be transformed into powders, or grated and then re-used in soups,
sauces etc. The goat sector is directly connected to these applications. For some companies,
this outlet is already a large volume market.. Many factors are involved in the variations
of cheese functionalities [1, 2], such as cheese making parameters and cooking intensity of
cheeses, but the greater part of the studies are about cow’s milk cheeses, like Emmental,
Mozzarella and especially low moisture partly skimmmed Mozzarella, Cheddar cheese and
process cheeses. Several tests are commonly applied to measure the culinary properties of
these types of cheeses [3]. No study concerned lactic cheeses, which correspond to 90% of
French goat cheeses, have been performed to date. Therefore, this work aimed at first to set
up and optimize tools and methods to evaluate culinary behaviour. The second step was the
characterisation of the functionalities of commercial French cheeses and the third step was to
establish the relationship between culinary behaviour and the processes by controlling key
factors in experimentally made cheeses.
2. Material and methods
2.1. Sampling of goat milk cheeses
For the setting up and optimization of the tools in order to evaluate the culinary behaviour of
1 Actilait, Avenue François Mitterrand, Surgères, France (k.raynal@actilait.com)](https://image.slidesharecdn.com/sissue012012finalcat-140620033827-phpapp01/85/S-issue-01_2012_finalcat-59-320.jpg)
![55
Special Issue of the International Dairy Federation 1201 IDF International Symposium on
Sheep, Goat and other non-Cow Milk
cheeses, 3 classes of products have been targeted: fresh lactic cheeses (15 products) and ripened
lactic cheeses (14 products), especially buchette type cheeses (mini log shape) and crottins,
and finally semi-hard cheese (8 products) named Tome. In order to develop tests that are valid
for a wide range of culinary behaviour, cheese composition used for this purpose had to be
variable. For this purpose, commercial cheeses were used but experimental cheeses were also
manufactured with different fat in dry matter (FDM, from 40 to 60%) and moisture in non fat
substances (MNFS, from 60 to 79%).
For the evaluation of the culinary behaviour of the cheeses of the French market, the main
studied cheese category was the ripened lactic cheeses because of their more frequent use in
culinary sector: ripened lactic cheeses (17 products), fresh lactic cheeses (5 products) and semi
hard cheeses (5 products). All the cheeses were studied at the same stage of ripening : 4 days
after renneting for fresh cheeses and 26 days for the ripened cheeses.
Finally, in order to study the relationship between the culinary behaviour and process,
lactic cheese makings were realised. The classical procedure was applied : starters CHN14
(Chr Hansen, Arpajon, France) 10g/100 l milk and bovine rennet at 520 mg chymosin/l
(Carlin, Texel, Dangé St Romain, France) at 5 ml/100 l milk were added to pasteurised or raw
milk and slow coagulation was conducted at 24°C for 24 h. Then fresh lactic curd was drained
and salt was added. Cheeses were then packed (fresh lactic cheeses) or ripened for about 8
days at 12°C with surface ripening strains, and finally stored at 4°C (shelf life 45-50 days).
Some parameters were modified in order to evaluate their impact:
- FDM (4 levels with constant MNFS).
- Ripening strains: cocktail A (PC PR1+ DHR form Cargill – dose ratio 4:1) and cocktail B
(PCTN form Danisco +DHR from Cargill – dose ratio 4:1). Cocktail B has higher proteolytic
and lipolytic activities than the cocktail A.
- Use of frozen lactic curd, 3 levels: 0% (only fresh curd), 50% frozen and 100% frozen curd.
The fresh curd was frozen in a quick freezing room (from 4 to -20°C in 45 minutes) and then
stored at -20° C. MNFS was 69% and FDM 47%.
- Freezing (and stored 30 days at -20°C) of slices of 7 day ripened lactic cheeses either with
A or B cocktail. MNFS after drying was 70% and FDM 53%.
2.2. Biochemical analyses
The following analyses were realised: pH, dry matter [4], proteins by evaluating nitrogen
fractions according to Kjeldhal method [5] , milk fat [6], cheese fat [7], lipolysis [8], calcium by
complexometry, phosphorus [9], chlorides, ash (drying at 525°C), lactose and galactose with
enzymatic kit (Boehringer test, Mannheim, Germany).
Fat organisation in six experimental cheeses of the final step was also observed by confocal
laser scanning microscopy on 5 mm thickness slices of cheeses, using a lipid soluble Nile Red
Fluorescent dye adapted from the protocol of Lopez et al [10].
2.3. Setting up of methods to characterise culinary behaviour
Adaptation or development of representative, repeatable and discriminative tests to assess
culinary behaviour of goat cheeses was the first phase of this study. Six specific protocols were
developed.
2.3.1. Cooking test
Heating protocols
The use of Petri dish (Schreiber test) was rejected soon after preliminary trials due to a too
rapid cooking and the direct contact that is not representative of the real application. Other
media types were tested: dry supports (toasts) and moist supports (pizzas). Different types of
oven and treatment intensity were also tested. Regarding microwaves, an atypical behaviour](https://image.slidesharecdn.com/sissue012012finalcat-140620033827-phpapp01/85/S-issue-01_2012_finalcat-60-320.jpg)
![56
Special Issue of the International Dairy Federation 1201 IDF International Symposium on
Sheep, Goat and other non-Cow Milk
was observed for lactic cheeses, so this type of cooking was not used in the next steps. Finally,
the most suitable protocol was: 5 mm thickness slice put on mini pizza (11 cm diameter) + 20 g
of tomato sauce in glass Petri dish (without lid), heated in a fan oven during 8 min at 200°C
(6 pizzas / batch, 5 replicates).
Flow ability
Before and after each cooking test, the cheeses were photographed in a standardized configu-
ration and the cheese surface was evaluated by computer processing by image analysis made
with the Image J Software (developed by National Institute for Health). The ratio (area after
heating - area before heating) x100/ (area before heating) gave the flow ability value (%).
The ranges of variation observed % for fresh lactic cheeses, ripened lactic cheeses and semi
hard cheeses ( 6-75%, 8-21% and 37-74 % respectively)were much larger than the standard
deviations of repeatability and limit of repeatability and reproducibility. Repeatability was deter-
mined on 5 cheeses samples and 3 replicates . The variance of repeatability S²r was 0.01 and
the repeatability limit r (= 2.8 x Sr) which is the maximum acceptable difference between two
measurements on the same sample, with a risk of error of 5%, was determined. On average,
for an initial surface 20 cm², r = 1.2%. Reproducibility was evaluated by 3 operators on a sam-
ple, with 3 replicates. The average limit of reproducibility was 2.3% of the initial surface. The
reproducibility of the complete tool “Heating step + flow ability measurement” was calculated
with 4 replicates on 3 samples per type of product. Sr was 2.3, 4.8 and 4.6 % for fresh lactic
cheeses, ripened lactic cheeses and semi hard cheeses respectively. Therefore, flow ability was
considered as a discrimination tool for this study.
Sensory characteristics after cooking
Owing to a high heterogeneous colour of cheese samples after cooking and to their size, colour
measurements with colorimeter tested in preliminary trials did not give repeatable results and
this parameter was finally assessed only by sensory analysis. A list of sensory descriptors was
generated by an internal panel (6 persons) for each type of cheese, including common descriptors:
flow ability, colour, cracks, fat exudation, granular, dry and sticky. During the last phase
(relationship between culinary behaviour and processes), 36 products were analyzed by 12
trained panellists from the laboratory of Maisons du Gout (Sensory Department of Actilait).
2.3.2. Exudation (laboratory test)
The method involving an aqueous extraction by centrifugation [11, 12] was applied to the un-
cooked cheeses. The standard deviation of repeatability for this method is less than 0.5g/100g
cheese [12], equivalent to about 2 g fat / 100 g of cheese fat. Moreover, the ranges of variation
observed for this parameter, increasing with high FDM values, were very large : 3-59, 11-70
and 50-75 g/100 g cheese fat for fresh lactic cheeses, ripened lactic cheeses and semi hard
cheeses respectively. The tool is therefore suitable for assessing indirectly the fat mobility in the
lactic cheese network, in terms of repeatability and discrimination ability.
2.3.3. Rheological methods
Two types of test have been optimised on uncooked cheeses: small amplitude oscillatory shear
measurements and texture profile analysis (TPA).
Small amplitude oscillatory shear measurements
This test was conducted with thermal scanning on an AR1000 rheometer with a strain of 0.1%
and a frequency of 1Hz. The modules were parallel planes. The cheese samples were 2 cm diameter
(without rind for ripened cheeses) and 5 mm thickness. According to previous works [13, 14],
the sample was protected from dehydration by use of silicone oil. The sample temperature was
increased from 20 to 90°C in 20 minutes. The storage modulus (G’), the loss modulus (G’’) and](https://image.slidesharecdn.com/sissue012012finalcat-140620033827-phpapp01/85/S-issue-01_2012_finalcat-61-320.jpg)
![57
Special Issue of the International Dairy Federation 1201 IDF International Symposium on
Sheep, Goat and other non-Cow Milk
the maximum ratio G’’/ G’ (tan δ max) were recorded. The temperature corresponding to tan δ
max was generally used as an indicator of cooking performance and indirectly to flow ability. As
the curves were very specific for lactic cheeses, 6 new descriptors selected according to their
low coefficients of variation (from 0 to 7% for lactic cheeses) given in table 5 : G’ and G”
measured at 39°C, tan δ max, T°C for tan δ max, ∆G’39°C and ∆G”39°C
Texture profile analysis (TPA)
This type of measurement was adapted to the fresh goat lactic cheeses [15] and had to be
validated on ripened lactic cheeses, especially concerning the sample shape. The apparatus
used for this analysis was TAXTPlus texturometer (Stable Micro Systems Ltd. Godalming UK). A
sample of cheese (20 mm diameter and 15 mm high) was compressed twice by a moving metal
plate (7 cm diameter). The compression ratio was 25% of the initial height at 1 mm/s speed.
The maximum forces recorded during successive compressions and areas under the curves
were used to calculate parameters such as hardness (or firmness), adhesiveness, cohesiveness,
springiness (or elasticity).
Comparison of standard deviations of fidelity with the ranges of variation (Table 1) showed
that the method can discriminate for firmness, cohesiveness and elasticity. In contrast, the
parameter measuring adhesiveness is not a discriminate factor because the limit of fidelity is 1
N.s for a ripened lactic cheese while the measured values varied from 0.6 to 2.6 N.s.
3. Results - discussion
3.1. Culinary behaviour of cheeses currently sold on the French Market
The objective of this phase was to characterize a representative range of commercial cheeses
to appreciate the diversity in terms of culinary behaviour with the tools previously developed.
Their biochemical composition given in Table 2 was highly variable for each type of cheese. The
levels of proteolysis and lipolysis remained within a normal range without generating sensory
defects.
Table 1: Comparison of standard deviations of fidelity with the ranges of variation
of TPA parameters
Firmness unit Cohesiveness unit Elasticity unit Adhesiveness unit
Fresh lactic cheeses (p= 6, n=3)
Standard
deviation Sr
0.3 N 2.2 % 1.9 % 0.2 N.s
Fidelity limit r 0.9 N 6.3 % 5.4 % 0.6 N.s
Variation range 6.6-13 N 40-57 % 59-85 % 0.4-1.3 N.s
Ripened lactic cheeses (p = 9, n=3)
Standard
deviation Sr
0.4 N 3.5 % 2.4 % 0.3 N.s
Fidelity limit r 1.2 N 9.9 % 6.7 % 1.0 N.s
Variation range 15-37 N 34-65 % 62-85 % 0.7-2.7 N.s
Semi hard cheeses (p= 11, n=3)
Standard
deviation Sr
0.5 N 0.9 % 0.8 % 0.3 N.s
Fidelity limit r 1.3 N 2.6 % 2.2 % 0.9 N.s
Variation range 16-30 N 67-75 % 59-92 % 1.0-1.8 N.s
p : number of products, n = replicates](https://image.slidesharecdn.com/sissue012012finalcat-140620033827-phpapp01/85/S-issue-01_2012_finalcat-62-320.jpg)
![58
Special Issue of the International Dairy Federation 1201 IDF International Symposium on
Sheep, Goat and other non-Cow Milk
Concerning texture parameters (TPA) and especially flow ability and exudation (table 3), a high
variability was observed. The firmness of cheeses, often inversely related to melting in the
mouth, is generally correlated to the amount of intact non hydrolysed casein. For semi hard or
hard cheeses, the fracture strength and hardness decrease during ripening due to proteolysis
(breakdown of the para-casein matrix) and the concomitant increase in the hydration of casein.
The preferential break-down of the αs1-casein by the residual chymosin is the most important
factor as regards the reduction of firmness [1]. Subsequently, the firmness increases by
decreasing of free water. For unpackaged cheeses and lactic cheeses, it seems that the loss of
water accompanied by an increase in firmness occured early and could be the main explaining
factor of our results. Cohesiveness and elasticity were correlated (r = 0.7, p<0.05) due to the
viscoelastic nature of this category of cheese.
The viscoelastic characteristics of the commercial cheeses evidenced a high variability (Table 5)
probably related to their composition and technological steps. An inverse correlation between
tan δ at 39°C and flow ability of ripened lactic cheeses was observed but all these new interesting
data need to be deeper analysed to be correlated to culinary behaviour.
Table 2: Compositions of the studied French commercial goat milk cheeses
Fresh lactic cheeses
(4 days old)
Ripened Lactic cheeses
(26 days old)
Semi hard cheeses
(26 days old)
Mean (SD) Range Mean (SD) Range Mean (SD) Range
pH 4.5 (0.1) 4.4-4.6 5.3 (0.3) 4.8-5.8 5.6 (0.2) 5.4-5.9
Dry matter (g/100g) 42 (4.2) 37-46 47 (3.4) 40-52 58 (3.5) 53-61
FDM (%) 50 (3.7) 46-55 51 (6.2) 48-57 51 (3.8) 47-56
MNFS (%) 74 (2.7) 77-76 70 (2.3) 66-75 60 (3.7) 55-64
Total Nitrogen/dry
matter (%)
38 (3.3) 32-40 41 (14) 27-43 46 (8.3) 35-58
pH4.6 soluble N/TN
(%)
9.7 (2.0) 6.8-12 27 (14) 10-55 23 (7.8) 14-30
Lipolysis (g Oleic Acid
/100 g fat)
0.8 (0.6) 0.3-1.7 4.0 (1.9) 1.6-7.3 0.7 (0.2) 0.5-1.0
Calcium (mg/100g) 115 (37) 75-155 86(25) 36-115 708 (88) 608-828
Phosphorus (g/kg) 1.7 (0.1) 1.6-1.8 1.9 (0.2) 1.6-2.2 4.7 (0.4) 4.3-5.4
Table 3: Variation range of fat mobility , flow ability and TPA parameters of the commercial
goat milk cheeses
Fresh lactic cheeses
(4 days old)
Ripened Lactic cheeses
(26 days old)
Semi hard cheeses
(26 days old)
Mean (SD) Range Mean (SD) Range Mean (SD) Range
Fat mobility
(g/100g cheese fat)
30 (18) 12-50 50 (34) 27-118 64 (19) 46-96
Flowability
(image analysis) (%)
17 (9.9) 3.3-29 25 (20) 3.4-84 55 (28) 21-96
Firmness (N) 6.1 (3.0) 3.7-9.5 22 (8.2) 11-36 30 (12) 21-48
Elasticity (%) 76 (6.2) 70-82 71 (11) 56-83 89 (2.1) 85-91](https://image.slidesharecdn.com/sissue012012finalcat-140620033827-phpapp01/85/S-issue-01_2012_finalcat-63-320.jpg)

![60
Special Issue of the International Dairy Federation 1201 IDF International Symposium on
Sheep, Goat and other non-Cow Milk
This phase of screening allowed the identification and quantification of different behaviours
during cooking that exist among many types of goat cheeses of the French market. This implies
that improvement can be achieved if relationship between process, composition and culinary
behaviour is understood.
3.2. Relationship between culinary behaviour and process
The behaviour of 79 ripened lactic cheeses with controlled characteristics was assessed by
means of six sets of cheese makings.
3.2.1. Influence of proteolysis and lipolysis levels
The higher ripening degree (lipolysis and proteolysis levels) obtained with the cocktail B was
associated with the larger coloured surface and a decrease in the granular texture (Figure 3).
Sensory analysis was the only reliable tool to assess the granular texture in the mouth,
a defect frequently detected for cooked lactic cheeses. This descriptor was not linked to other
sensory attributes of texture and also not linked to the parameters from the instrumental
methods such as TPA [15, 16]. The granular texture could be related to the formation of
aggregates of proteins under acidic conditions in the case of low enzyme activity of the cocktail (A).
The increase in coloured surface observed in cheeses with higher proteolysis levels corroborates
previous works on goat milk Mozzarella [17]. Colour of cheese made with goat milk was less
important than for cow’s milk due probably to a lower proteolysis extend in the goat milk product.
Maillard browning reaction is increased at high pH (above pH 6) and may be promoted by an
extensive proteolysis [18].
0
1
2
3
4
5
6
7
8
9
Colourintensity
%
coloured
surface
Flow
abilityFatexudation
blistered
granularinm
outhCraking
crust
stretching
chewy
Sensoryscores(/10)
Min
Max
Mean
Figure 2. characteristics of semi hard cheeses, mean and variation range](https://image.slidesharecdn.com/sissue012012finalcat-140620033827-phpapp01/85/S-issue-01_2012_finalcat-65-320.jpg)
![61
Special Issue of the International Dairy Federation 1201 IDF International Symposium on
Sheep, Goat and other non-Cow Milk
3.2.2. Influence of the freezing
The incorporation of frozen curd was accompanied by changes in lipolysis level (a 0.5-6 g
OA/100g fat decrease) and fat mobility (a 10-40 g/100 g fat increase), depending on the cheese
composition, especially in the 100% frozen curd. These phenomena were sometimes associated
with an increased fat exudation and a slight decrease in flow ability (sensory analysis results
not shown). Only slight modifications were observed by confocal microscopy (figure 4) even
using 100% of frozen lactic curd. The slight effect of freezing on goat milk lactic curd or fresh
cheese on sensory value of cheese was previously studied and the freezing parameters were
optimised (Gaborit, unpublished results). A minor impact of curd freezing was also observed by
Van Hekken et al [19].
Freezing the slices of ripened cheeses seemed to induce greater changes in the supra
molecular organisation of fat (Figure 4) and several changes in sensory quality such as the
decrease in the coloured surface and flow ability and the increase in the granular texture and
the presence of a crust and cracks (Figure 5). Other authors also found an impact of freezing
method on Cheddar and Mozzarella microstructure [20].
% of coloured surface
0
1
2
3
4
5
6
7
score/10
cocktail A
cocktail B
Granular texture
0
1
2
3
4
5
6
7
8
score/10
Proteolysis
0
10
20
30
40
50
60
70
pH4,6solubleN/TN(%)
Lipolysis
0
5
10
15
20
25
30
35
gOleicacid/100gfat
70 70 70 73 MNFS 70 70 70 73
38 42 48 57 FDM (%) 38 42 48 57
Figure 3. Effect of proteolysis level (higher for ripening cocktail A) of ripened lactic cheeses
on the percentage of coloured surface and granular texture in mouth after cooking](https://image.slidesharecdn.com/sissue012012finalcat-140620033827-phpapp01/85/S-issue-01_2012_finalcat-66-320.jpg)

![63
Special Issue of the International Dairy Federation 1201 IDF International Symposium on
Sheep, Goat and other non-Cow Milk
3.2.3. Compilation of the data obtained for the three steps
Finally, relationships between sensory and instrumental parameters were determined on the
data obtained during the two last steps by Pearson correlation coefficients and principal
component analysis (PCA). They confirmed the previously results for each step of the study
and also showed an increase in flow ability when higher lipolysis and proteolysis levels were
observed for lactic cheeses (Table 6). After melting of the fat, the integrity of the protein
network and the interactions between proteins and water determine the extent of the protein
flow. Anything that affects the amount and distribution of fat and strength of the protein network
(as is the case during ripening) influences the flow ability [1, 21]. In Raclette type cheese, a
positive impact of proteolysis level on its behaviour during heating and post cooking was
evidenced [22], especially concerning 12% TCA soluble Nitrogen (NPN) fraction [23]. Concerning
soft cheeses, a relationship between pH and flow ability of Cremoso Argentino was found [24],
that is higher flow ability at pH 5.5 compared to pH 4.9 (with similar proteolysis levels).
The results obtained for ripened lactic cheeses also corroborate the inverse relation observed
for Cheddar cheese between melting properties and content in Ca, P, lactose [25, 26].
4. Conclusion
The aim of this study was to characterize the most representative French goat cheese varieties,
in which are highly variable in respect to biochemical composition, sensory characteristics,
rheological properties and culinary behaviour. Many set-up or adapted methods were used for
these specific lactic cheeses. This enabled the highlighting of different behaviours for culinary
applications, in relation to some technological steps and the biochemical composition. These
first data concerning a large panel of lactic cheeses need to be further analysed. Moreover, the
observed tendencies need to be validated in a future research project in order to meet the
producers and users’ expectations (cheese makers, food industry, restaurants, consumers.) for
texture, flow ability, colour and goat flavour of cooked cheeses.
Acknowledgement
The authors wish to thank Isabelle Guillet and Julien Clochet for biochemical and microbiological
analyses, Marie-Noëlle Madec from INRA for confocal microscopy analyses and Romain Richoux
for his advice. The authors also thank Dairies for products supply and R&D department of
Danisco for giving us access to their rheometer. Support from Poitou-Charentes Region depart-
ment for Food, Agriculture and Forest (DRAAF) is gratefully acknowledged.
The authors Pierre Barrucand and Ketsia Raynal-Ljutovac do not have a financial or personal
relationship with other people or organisations that could inappropriately influence or bias the
paper entitled “Relationship between technological steps and behaviour of French goat cheeses
for culinary applications”
Table 5: Correlations (Pearson) observed for the 84 ripened lactic cheeses characterised
during the steps 2 and 3 (screening of the products of the French market and experimental
cheese makings)
r (Pearson)
N= 84
Flowability
(sensory evaluation)
Granular texture
pH 0.8
NCN/TN 0.7 -0.8
Fat/ Dry matter -0.54
Ca -0.88 0.67
Cl 0.64
Lactose -0.67](https://image.slidesharecdn.com/sissue012012finalcat-140620033827-phpapp01/85/S-issue-01_2012_finalcat-68-320.jpg)
![64
Special Issue of the International Dairy Federation 1201 IDF International Symposium on
Sheep, Goat and other non-Cow Milk
References
1. Guinee, T.P. The functionality of cheese as an ingredient: a review. Aust. J. Dairy Technol.
57:79-91 (2002).
2. Lucey, J.A. Some perspectives on the use of cheese as a food ingredient. Dairy Sci. Technol.
88:573-594 (2008).
3. Kindstedt, P.S., Hillier A.J. & Mayes J.J. Technology, biochemistry and functionality of pasta
filata/pizza cheese. In : Law, B.A. & Tamime A.(Editors) Technology of Cheese making.
Blackwell Publishing Ltd (2010).
4. ISO 5534:2004. Cheese and processed cheese. Determination of the total solids content
(Reference method). 16pp (2004).
5. Gripon, J.C., Desmazeaud, M.J., Le Bars D. & Bergère, J.L. Etude du rôle des microorganismes
et des enzymes au cours de la maturation du fromage. II. Influence de la présure. (Remise en
suspension du fromage. Dosage des différentes formes d’azote). Lait 548 :502-516 (1975)
6. NF V04-210 Lait - Détermination de la teneur en matière grasse - Méthode acido-butyrométrique
(2000).
7. Heiss, E. Versuche zur Bestimmung des Käsefettgehaltes mit Hilfe von Schnellmethoden.
[Studies on the determination of fat matter in cheeses by rapid methods]. Dtsch. Molk. Zeit.
82:67-70 (1961).
8. International Dairy Federation. Determination of free fatty acids in milk and milk products.
IDF Bull. n° 265. Appendix A. International Dairy Federation, Brussels (1991).
9. ISO 2962 Cheese and processed cheese products -- Determination of total phosphorus
content -- Molecular absorption spectrometric method (2010).
10. Lopez, C., Camier, B. & Gassi, J.Y. Development of the milk fat microstructure during the
manufacture and ripening of Emmental cheese observed by confocal laser scanning microscopy.
Int. Dairy J. 17:235-247 (2007).
11. Kindstedt, P.S. & Rippe, J.K. Rapid quantitative test for free oil (oiling off) in melted Mozzarella
cheese. J. Dairy Sci. 73:867–873 (1990).
12. Richoux, R., Roset, G., Famelart, M.H. & Kerjean, J.R. Diversity of some functional
characteristics of melted French Emmental-cheese. Lait 81: 547-559 (2001).
13. Reparet, J.M. & Noel, Y. Relation between a temperature-sweep dynamic shear test and
functional properties of cheeses. Lait 83:321-333 (2003).
14. Stenz, B., Hoglmeier, A., Fischer, U., Rock, S. & Kulozik, U. Comparison of the melting
properties of cheese by means of meltability tests and rheological measurements. Milch-
wissenschaft 61:304-307 (2006).
15. Laithier, C., Chatelin, Y.M., Doutart, E., Barrucand, P., Duchesne, C., Morge, S., Barral, J.,
Cuvillier, D., Minard, I. & Leroux, V. Evaluation et maîtrise de la texture des fromages frais
de chèvre à coagulation lactique Renc. Rech. Ruminants 16:143-146 (2009).
16. Foegeding, E.A. & Drake, M.A. Sensory and Mechanical Properties of Cheese Texture. J.
Dairy Sci. 90:1611-1624 (2007).
17. Imm, J.Y., Oh, E.J., Han, K.S., Oh, S., Park, Y.W. & Kim, S.H. Functionality and physico-chemical
characteristics of bovine and caprine Mozzarella cheeses during refrigerated storage J. Dairy
Sci. 86:2790-2798 (2003).
18. Mc Sweeney, P.L.H.How may browning of heated cheese be controlled ? In Cheese problems
solved. Woodhead Publishing Limited. P 364 (2007).
19. Van Hekken, D.L., Tunick, M.H. & Park, Y.W. Effect of Frozen Storage on the Proteolytic and
Rheological Properties of Soft Caprine Milk Cheese. J. Dairy Sci. 88:1966-1972 (2005).
20. Reid, D.S. & Yan, H.R. Rheological, melting and microstructural properties of cheddar and
mozzarella cheeses affected by different freezing methods. J. Food Qual. 27:436-458
(2004).](https://image.slidesharecdn.com/sissue012012finalcat-140620033827-phpapp01/85/S-issue-01_2012_finalcat-69-320.jpg)

![66
Special Issue of the International Dairy Federation 1201 IDF International Symposium on
Sheep, Goat and other non-Cow Milk
Posters
3.2. (S3.7) Jordan and Shor, Two Traditional Milk Products,
Which are Produced in Azerbaijan Region of Iran
Y. Shafiei1
Summary
Jortan and Shor are two traditional milk products of Azerbaijan region of Iran which are mainly
prepared from sheep milk. The main purposes of this study are to examine and to compare
some properties of experimentally prepared products.
After preparation of these products, sensory and chemical properties of them were examined
based on AOAC Official Methods. All of the stages repeated 5 times. For statistical analysis of
data, Software-SPSS was used.
Considering the results, sensory properties of Jortan and Shor were different. Also there was
a highly significant difference between most of chemical properties of two products (p<0.01),
but there was no significant difference between acidity and pH (p>0.05).
The findings suggest that these products have desired properties like that of cheese and
yogurt and have a potential possibility to be produced in large industrial scale with high quality
by utilizing modern dairy processing equipments and new technologies now available.
1. Introduction
In Azerbaijan region of Iran, many different milk products, which are traditionally prepared
from ewe and goat milk, are still unknown elsewhere in spite of their valuable properties. Two
of these products are Jortan (Cortan) and Shor (Şor), traditional fermented milk products
obtained from yogurt after producing Ayran and separation of butter. These products are fat
free or have a negligible fat content due to the extraction of fat from the yogurt as butter, so
they are nutritionally healthful and they could be good alternatives for other high fat content
products. Furthermore, in their manufacture no additional salt is used as preservative.
The main purposes of this study are: to introduce and to describe traditional production
process of these products, to examine some sensory and chemical properties of experimentally
prepared products with ewe milk, and to compare these properties in two products. Also, it
suggests an industrial method and procedure for producing these products by utilizing modern
dairy processing equipments and new technologies available today in order to produce them on
a large industrial scale with high quality.
2. Materials and Methods
Fresh ewe milk was collected during lactation period in the East Azerbaijan Region of Iran, in
April. Mixture of two starter cultures YC-X11 and YC-350 (Chr. Hansen, Denmark) were used by
Iran Dairy Industries Co. (Pegah) of Tabriz as bulk starter culture, ready for inoculation. This
mixture of yogurt starter culture consisting of Lactobacillus delbrueckii supsp. bulgaricus and
Streptococcus salivarius subsp. thermophilus (1:1) was used for the yogurt [6] needed for Jortan
and Shor production (Figure 1).
1 Corresponding author: Department of Food Science & Technology, Faculty of Agriculture Science and Natural
Resources, Islamic Azad University, Khoy Branch, Khoy, Iran.
Tel.: +98 461 2550001-6; Mob.: +98 914 404 90 42; fax: +98 461 2553304.
E-mail address: Shafieibavil@yahoo.com](https://image.slidesharecdn.com/sissue012012finalcat-140620033827-phpapp01/85/S-issue-01_2012_finalcat-71-320.jpg)
![67
Special Issue of the International Dairy Federation 1201 IDF International Symposium on
Sheep, Goat and other non-Cow Milk
Jortan and Shor were analyzed for moisture, total solids, ash and titratable acidity according
to AOAC official methods [1, 2]. To measure fat content of products Gerber Method was used
[3]. All pH measurements were taken with a digital pH meter, model Metrohm 691, manufactured
by Metrohm-co, Switzerland. Due to the lack of special standard tests for Jortan and Shor, we
applied standard tests of yogurt for Jortan and those of white cheese for Shor owing to their
organoleptic similarity.
Sensory evaluation of the samples was conducted by 30 untrained taste panelists. Each
panelist received three samples of each test product and control product for comparison and
was asked to evaluate using a sensory rating scale of 1 to 10.
Data were analyzed using Software-SPSS 11.5 [5]. The mean values and the standard
error were calculated from the data obtained by the five replicate trials for chemical analysis.
For comparison of mean values Independent t-test was used. The results of sensory evaluation
were submitted to the analysis of variance (ANOVA).
3. Results and Discussion
Results of chemical analyses are shown in Table 1 and results of sensory evaluation of Jortan
and Shor and other control products are shown in Table 2.
Raw ewe milk Yogurt production Diluting yogurt by water (1:1) Transfer in Tulugh or Nehra*
Churning (2 to 3 h)
Jortan
Straining in cloth bag
Shor whey
Ghara ghurut
Removing of butter grains
Collection of solid materials
Coagulum formation
Collection of solid materials
Butter
Jortan whey
Shor
Ayran
Straining in cloth bag
Heating at 100°C
Ghurut
Motal cheese
Figure 1. Schematic representation of traditional production procedure of Jortan and Shor.
* Tulugh and Nehra are traditional instruments which are used to shake the mixture of yogurt and water to separate
butter and to produce Ayran
Table 1: Chemical properties of Jortan and Shor
Sam. Moisture
(%)
Total solids
(%)
Fat
(%)
Solids non-fat
(%)
Ash
(%)
Acid
(%)
pH value
S1* 80.4 ± 0.4a 19.6 ± 0.4a 0.3 ± 0.009a 19.3 ± 0.4a 0.32 ± 0.05a 0.26 ± 0.01a 4.09 ±0.004a
S2* 69.2 ± 1.8b 30.8 ± 1.8b 1.04 ±0.04b 29 ± 1.78b 0.56 ± 0.04b 0.23 ±0.006a 4.1 ± 0.009a
a, b means in the column with no common superscript letters are significantly different (P<0.01).
* S1= Jortan, S2= Shor](https://image.slidesharecdn.com/sissue012012finalcat-140620033827-phpapp01/85/S-issue-01_2012_finalcat-72-320.jpg)
![68
Special Issue of the International Dairy Federation 1201 IDF International Symposium on
Sheep, Goat and other non-Cow Milk
Most of chemical and sensory properties of Jortan and Shor are different, but both of these
products have same characteristics as low acid and low fat content as compared with other milk
products (Table 1 and 2). Also, they have low fat content but they are rich in milk fat globule
membrane (MFGM) components that have valuable health effects.
4. Conclusion
Traditional methods have many disadvantages [4]. Hence, In Figure 2, we present a procedure
for industrial manufacture of Ayran, Jortan and Shor.
Table 2: Mean score of Sensory evaluation of Jortan and Shor and comparison of them with
sensory properties of control products
Evaluated Sample Taste Texture Colour Overall Acceptability
S1* 8.46 ± 0.08ac 8.56 ± 0.06a 8.5 ± 0.05ac 8.5 ± 0.1abc
S2* 8.23 ± 0.06cd 8.2 ± 0.05b 8.3 ± 0.05ab 8.2 ± 0.06b
C1* 8.6 ± 0.05a 8.66 ± 0.03a 8.63 ± 0.03c 8.7 ± 0.05c
C2* 8.33 ± 0.08ac 8.26 ± 0.03bc 8.36 ± 0.06a 8.36 ± 0.03ab
C3* 8.5 ± 0.05a 8.56 ± 0.03a 8.5 ± 0.05a 8.6 ± 0.05c
C4* 8.16 ± 0.03d 8.23 ± 0.06bd 8.16 ± 0.03bd 8.2 ± 0.05ab
a, b, c, d means in the column with no common superscript letters are significantly different (P<0.05).
* S1: Jortan, S2: Shor, C1: concentrated yogurt, C2: plain yogurt, C3: matured cheese, C4: fresh cheese
Raw milk
Clarification
Pasteurization
Stirred yogurt production
Churning of yogurt
Butter
Ayran
Filling
Packing
Cold storage
Heating at 100°C
Coagulum formation
Membrane processing
Membrane processing
Shor whey
Shor
Jortan whey
Jortan
Figure 2. Schematic representation of the industrial production procedure for Jortan and
Shor, as suggested by the author](https://image.slidesharecdn.com/sissue012012finalcat-140620033827-phpapp01/85/S-issue-01_2012_finalcat-73-320.jpg)

![70
Special Issue of the International Dairy Federation 1201 IDF International Symposium on
Sheep, Goat and other non-Cow Milk
3.3. (S3.9) Effect of Raw Goat Milk Storage Time at 4 °C on Goat
Milk Powder Quality
C. R. Fonseca1, K. Bordin1, D.V. Neeff 1, C.A.F. Oliveira1
Summary
About 100 L of fresh goat milk was divided into 3 fractions and stored at 4 °C. On 1st, 3rd and
5th days, one sample was collected for microbiological (mesophilic and psychrotrophic bacteria)
and biochemical analysis and the remainder of the fraction was spray dried. Immediately after
manufacture and on 60th, 120th and 180th days, powders were evaluated by microbiological,
proteolysis, lipolysis, fat oxidation and sensorial analysis. The raw milk storage time increased
(P<0.05) peroxide value, caprilic, myristic and total FFA contents in milk powder, but there was
no effect (P>0.05) on milk powder capric and rancid flavors. Milk powder time storage showed
linear increasing effect (P<0.05) on peroxide value, caprilic, capric and FFA total amounts,
capric odor and rancid flavor. It was concluded that the heat treatments used in milk powder
processing were effective to destroy psychrotrophic bacteria, but not their thermoresistant
enzymes.
1. Introduction
The drying process can be considered as an excellent alternative for extending the goat milk
shelf-life without changing nutritional and sensorial characteristics. Also, the product volume
decrease has technological and market advantages. Psychrotrophic bacteria may grow at
temperatures below 7°C in raw goat milk and produce proteolytic and lipolytic enzymes that
can make milk powder deteriorate faster, forming smaller compounds that are responsible for
bitter, rancid, soapy and fruity flavor in milk powder [2]. This study evaluated the effects of raw
milk cold storage on the quality of goat milk powder during its shelf life.
2. Material and methods
About 100 L of fresh goat milk was divided into 3 portions and stored at 4 °C. On 1st, 3rd and
5th days after storage, one of the fractions was submitted to pasteurization (65 °C for 30 min),
vacuum concentration (40% of total solids) and spray drying. The powders were stored in nitrogen
modified atmosphere packages at 25 °C. Immediately after the manufacture and on 60th, 120th
and 180th days powders were analyzed as follows:
Proteolytic and lipolytic psychrotrophic and mesophilic bacteria were counted using Calcium
Caseinate Agar, Tributyrin Agar and Plate Count Agar, respectively.
Proteolysis was quantitatively estimated through the relation casein (C)/true protein (TP) as
described in AOAC [3]. The total FFA quantification was realized according to Deeth et al. [4]
and the individual FFA was analyzed as described in De Jong & Badings [5]. Fat oxidation was
measured by peroxide value analysis [3].
Seven trained panelists evaluated the capric odor, capric and rancid flavor and bitter taste
of reconstituted goat milk (12%) samples using a non structured scale from 0 (no intensity) to
10 (strong intensity).
The Complete Randomized Design with factorial arrangement (3 storage times of raw milk, 4
storage times of milk powder and 3 repetitions) experiment was submitted to statistical analysis
using SAS® software [6], using the proc glm procedure and subsequent regression study by
orthogonal contrasts.
1 Faculdade de Zootecnia e Engenharia de Alimentos, Universidade de São Paulo, Brasil
fonsecacr@usp.br, keliani.bordin@usp.br, dineeff@usp.br, carlosaf@usp.br](https://image.slidesharecdn.com/sissue012012finalcat-140620033827-phpapp01/85/S-issue-01_2012_finalcat-75-320.jpg)


![73
Special Issue of the International Dairy Federation 1201 IDF International Symposium on
Sheep, Goat and other non-Cow Milk
3.4. (S3.13) Dairy Products Made from Sheep and Goat’s Milk
in Turkey
D. Say1, M. Soltani2, N. Güzeler2
Summary
Average total milk production in Turkey is around 13 million tons per year. Sheep’s milk
provides 5.85% of it , 1.53% is goat’s milk and 0.26% is buffalo’s milk. These kinds of milk are
consumed locally and processed into dairy products such as cheese, yoghurt, ice cream and
butter that are highly appreciated by the consumers. Their particular sensory characteristics
are more preferred than those of the respective cow’s milk products due to the composition of
sheep and goat’s milk. A variety of cheeses is produced: sheep’s milk cheeses named Kashar,
Tulum, Herby, and Orgu and goat’s milk cheeses named Tulum and Carra. Also traditional yo-
ghurt products are produced from sheep and goat’s milk such as Tulum, Salted yoghurt and
Kurut.The aim of this review is to introduce Turkey’s dairy products, which are made from sheep
and goat’s milk and to describe their compositional characteristics.
1. Introduction
After China and Greece, Turkey is the third leading country in the sheep milk production with
734219 tonnes and this represents about 5.85% of the total milk production of the country.
Also, Turkey ranks 13th in the world and 4th in Mediterranean countries after France, Greece
and Spain based on goat milk production with 192210 tonnes. This amount represents 1.53%
of the total milk production of the country [1]. Sheep and goat’s milk is widely used for home
consumption worldwide and to produce different cheeses and yoghurt, which makes them of
particular economic value in countries. Delicious cheese and yoghurt are produced from sheep
and goat’s milk and these products are usually preferred to the ones produced from cow milk.
Thus, raising sheep and goats is of great importance in Turkey. Similarly sheep and goat’s milk
are also used for manufacturing cheese in some countries such as France, Italy and Greece
[2].
2. Cheeses from sheep and goat’s milk
2.1. Kashar (Kaşar) cheese
Kashar cheese which is a semi-hard cheese is one of the the most important cheese varieties
manufactured in Turkey. This cheese is known as maturated Kashar if produced traditionally. In
cheese-making, curd is acidified and then it is scalded in hot water and kneaded. After ripening
period it has a unique flavour, taste and aroma. Cheeses similar to this type are extensively
manufactured in Balkan countries known as Kashkaval, Kasseri and Kachkawaj. The best quality
traditional Kashar cheese is made from sheep milk[3].
2.2. Tulum cheese
Tulum, a hard type traditional cheese, is the most commonly produced cheese after white and
kashar cheeses, respectively. The cheese is generally made from sheep’s milk without starter
culture. Its name, tulum, originates from the goat skin that is traditionally used as a casing
material and ripened in it. Today, tulum cheese is commonly cased in plastic barrels or ceramic
1 Vocational School of Pozantı, University of Çukurova, Adana, Turkey (dsay@cu.edu.tr).
2 Department of Food Engineering, Faculty of Agriculture, University of Çukurova, Adana, Turkey.](https://image.slidesharecdn.com/sissue012012finalcat-140620033827-phpapp01/85/S-issue-01_2012_finalcat-78-320.jpg)
![74
Special Issue of the International Dairy Federation 1201 IDF International Symposium on
Sheep, Goat and other non-Cow Milk
pots instead of tulum in some regions of Turkey [4]. Tulum is characterized as having a white or
cream colour, high fat, high protein and high dry material content, butter-like aroma, obvious
acidic taste, and a homogenous structure with no gas holes and not easily broken [5].
2.3. Herby (Otlu) cheese
Herby cheese a semi-hard, salty and herb added, is manufactured in small family businesses
for their needs and commercial purposes from generally made from sheep’s milk between May
and June in the East and South east regions of Turkey. The herbs have noticeable effect on the
taste and flavour of herby cheese, and this cheese is consumed almost every meal in all over
the country with a good taste.
There are 25 kinds of herbs used for this aim. The main herbs used in this cheese are Allium
sp. (local name ‘sirmo’), Anthriscus sp. (local name ‘mendo’), Ferula sp. (local name ‘heliz’),
Mentha sp. (local
name ‘nane’) and Thymus sp. (local name ‘kekik’) etc. Herby cheese is salty, with herb
flavour, white to yellowish colour [6].
2.4. Carra cheese
Carra, which means pottery, is one of the popular semi-hard traditional cheese in Turkey. It is
manufactured in South Anatolia region province in Hatay. Traditionally, Carra cheese is made
from mostly non pasteurized goat’s milk and heated acid curd (cokelek). The difference from
the other cheeses is that the curd is sliced into 1 cm thick pieces, salt is put between the slices
and then left for 2-3 days to harden. When cheese has reached the desired moisture content,
it is coated with black cumin (Nigella sativa) and filled into a Carra, one layer rennet curd and
one layer cokelek in alternating order until the carra is full. The pottery is turned up side down
and stored in a cool place for a few days. Then, some salt and thyme (Thymus vulgaris) are
sprinkled on the surface of the cheese before the potis closed with a piece of cloth. Finally, the
mouth of the potis closed with mud or a mixture containing ash, salt, olive oil and water. When
the mud or slurry dries, the pottery is buried in ground upside down and left for ripening at least
for 3 months [7].
2.5. Orgu (Braided) cheese
Orgu cheese is one of the common traditional cheese types in Eastern region of Turkey from
sheep milk, and becoming more popular and preferred almost all over Turkey. Orgu cheese
production involves intensive manual handling during the manufacturing stage and requires
skillful manipulation of the curd by the cheesemaker [8]. Acidified curd is scalded in hot water
at 70-80°C for 5-6 minutes. The scalded curd is stretched like a string of 1 cm in diameter.
Three strings are knitted together and then cut at approximately 10 cm in length. The Orgu
cheese is usually consumed either fresh or ripened for 60 days in brine of 12-15% salt [9].
Table 1: Composition of cheeses from sheep and goat’s milk
Cheese pH Acidity (LA%) Dry Matter (%) Fat (%) Protein (%) Salt (%) References
Kashar 5.13 - 56.79 - - 3.37 [10]
Tulum - 1.02 50.04 25.05 20.42 2.85 [11]
Herby 5.52 0.48 45.80 17.83 21.37 5.19 [6]
Carra 5.63 0.85 53.43 24.86 18.86 8.83 [12]
Orgu - 1.11 47.75 17.86 19.96 5.32 [9]](https://image.slidesharecdn.com/sissue012012finalcat-140620033827-phpapp01/85/S-issue-01_2012_finalcat-79-320.jpg)
![75
Special Issue of the International Dairy Federation 1201 IDF International Symposium on
Sheep, Goat and other non-Cow Milk
3. Yoghurt and yoghurt based products from sheep and goat’s milk
3.1. Tulum yoghurt
“Tulum” yoghurt is made by spontaneous coagulation of milk in a specially prepared sheep’s or
goat’s skin. 3-5 liters of milk are added to the skin every day and 100 g of salt every 2-3 days.
The desired characteristic properties of Tulum yoghurt appear one week later. Tulum yoghurt
has a high dry matter like concentrated yoghurt but higher protein and fat content as compared
with concentrated yoghurt. It has granular structural and salty taste [13].
3.2. Salted yoghurt (ayran)
In Mediterranean and Southern regions of Turkey, the traditional way of prolonging the keeping
quality of yoghurt is employed in production of “salted yoghurt”. Goat milk is preferred for the
production [14]. Flavour of salted yoghurt must be clean and mildy acidic. Body and texture
are homogenously soft and smooth with no graininess. It should has good spreadability and no
wheying off. Because of low moisture and high salt, salted yoghurt has good shelf life and lends
itself for use in winter which is from 5-6 months to one year of age [15]. There are two proce-
dures in the production of Salted yoghurt. The first procedure is the set-type yoghurt which is
boiled and then salt is added. The second method is where yoghurt whey is removed by using
cloth bag, boiled, and then salt (1-2%) is added in order to shorten cooking time. When the
cooking stage is completed, salted yoghurt is transferred into another container and left for
cooling generally stored under oils or fats [16]. It is sold in plastic trays in local markets and no
federal standards for salted yoghurt composition exist.
3.3. Kurut
Kurut which is a traditional sun-dried dairy products is known as “dried yoghurt” and made in
the villages of Eastern region of Turkey. Kurut is made in spring and consumed in winter while
purchasing fresh milk and dairy products is quite impossible in the region. It is made from
yoghurt or ayran in Anatolia. In production of kurut, salt (2-3%) is added into yoghurt and
salty yoghurt is strained for 12 h and typical kurut dough is obtained. Then, dough is shaped
into lumps of 40-60 g in weight and 3-5 cm in diameter. Kurut lumps are set aside in a shady
place to be dried for 10-15 days. Kurut can be stored at ambient temperature for more than 6
months[17].
4. Conclusions
A large number of traditional dairy products from sheep and goat’s milk are produced in Turkey
and consumed generally in local regions and in the home market. Large scale sheep and goat
farms could be a solution for solving this situation in the many regions, where only goats and
sheep can still support a farm family. It also remains to be accepted that technical knowledge
available can permito the manufacture of quality products from sheep and goat milk. Finally, the
Table 2: Composition of yoghurt and yoghurt based products from sheep and goat’s milk
Product pH Dry Matter (%) Fat (%) Protein (%) Lactose (%) Salt (%) References
Tulum yoghurt - 35.67 22.55 10.6 - 3.1 [13]
Salted yoghurt 4.09 23.27 6.94 8.05 5.85 2.76 [16]
Kurut 3.92 84.25 8.57 53.60 1.06 9.95 [17]](https://image.slidesharecdn.com/sissue012012finalcat-140620033827-phpapp01/85/S-issue-01_2012_finalcat-80-320.jpg)

![77
Special Issue of the International Dairy Federation 1201 IDF International Symposium on
Sheep, Goat and other non-Cow Milk
3.5. (S3.17) Study of The Coloring Properties of Powdered
Saffron Spice in Powdered Skim Ewe Milk
C. Licón1, M. Carmona2, A. Molina1, M.I. Berruga1
Summary
Color is one of the main food characteristics that influence consumer preferences, saffron spice
(Crocus sativus L.) being highly appreciated for this property. Several milk products use saffron
as an ingredient but its coloring properties in milk have never been reported. The aim of this
work was to study the effect of saffron concentration (2 to 10 mg/ml), temperature (37, 50
and 70ºC) and extraction time (20, 40 and 60 min) in powdered skim ewe milk by tristimulus
colorimetry. Saffron concentration influences color coordinates, but temperature and extraction
time did not have any significant influence.
1. Introduction
Saffron spice (Crocus sativus L.) is an important Spanish product specially used in food, for
its aromatic, flavour and colouring properties, having a Protected Designation of Origin named
“Azafrán Mancha” [1]. This spice has been known since ancient times for its biomedical properties,
such as antioxidant, anti-inflammatory, analgesic, and even by its antitumor and anticancer
activity, as well as antidepressant, respiratory decongestant, antispasmodic, aphrodisiac,
expectorant and sedative [2]. Many dishes are known around the world such as Spanish Paella,
Italian Risotto, French Bouillabaisse and even some cheeses in Germany and Italy that include
saffron, but the coloring properties of saffron in milk or the conditions for preparing these
solutions have never been reported. The aim of this work was to study the effect of saffron
concentration, and the extraction temperature and time on the coloring properties of saffron in
powdered skim ewe milk solutions using tristimulus colorimetry.
2. Material and methods
A 16-litre batch of skim ewe powder milk (18% w/v; 0.01% milkfat; ZEU Inmunotec, Zaragoza,
Spain) was used. Fifty-five grams of Spanish saffron spice (Crocus sativus L.) of the Protected
Designation of Origin “Azafrán de la Mancha” were used from the 2007 harvest. Saffron was
grounded according to ISO 3632 Technical specification [3]. The mixture was prepared in
reconstituted ewe milk following the specification of the pending patent No.P200930912. The
experiment consists on a multilevel factorial design based on the temperature of the saffron
color extraction (37±4, 50±4 and 70±4 ºC); extraction time (20, 40 and 60 minutes) and saffron
concentration (2, 4, 6, 8 and 10 mg/ml). All treatments were done by triplicate. Reflected color
was measured using a Minolta CR-400 (Minolta Camera Co., Osaka, Japan) with a CR-a33f cone
a D65 illuminant and an angle vision of 10º. CIE L*a*b*, CIEL*C*h coordinates were obtained.
Statgraphics Plus 5.1 was used to carried out a General Linear Model (GLM) analysis.
3. Results and Discussion
General Linear Model equations for the different color coordinates studied are shown in Table 1,
where saffron concentration, temperature and time were included. The coordinates L*, a* and
h had regression coefficients higher than 85%, but b* and C* explained no more than 5% of
1 Departamento de Ciencia y Tecnología Agroforestal y Genética, ETSIA-IDR. Universidad de Castilla-La Mancha,
02071, Albacete, Spain (mariaisabel.berruga@uclm.es).
Albacete Science and Technology Park, Campus Universitario, 02071 Albacete, Spain.](https://image.slidesharecdn.com/sissue012012finalcat-140620033827-phpapp01/85/S-issue-01_2012_finalcat-82-320.jpg)
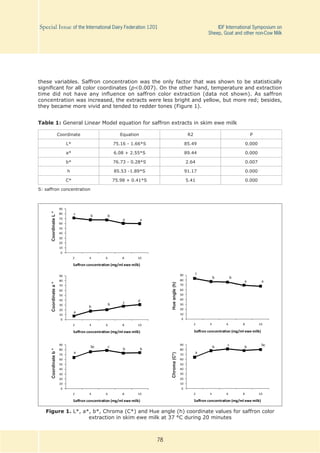
![79
Special Issue of the International Dairy Federation 1201 IDF International Symposium on
Sheep, Goat and other non-Cow Milk
Alonso et al. [4] obtained hue values for powder saffron water extracts at a concentration
of 0.05 mg/ml from 50° to 53°, being lower than the values found in the saffron milk extracts,
since prediction for hue at the same extraction conditions, using skim milk, will have values
near 85° (Table 1), saffron extracts in ewe milk having a yellow hue, while saffron extracts in
water tend to red hue. This color difference could be due by interactions between saffron coloring
compounds and the different milk components, including proteins and lactose, showing the matrix
effect of ewe milk in the saffron extracts, but further research is needed regarding these.
In saffron aqueous solutions, as well as in saffron ewe milk solutions, coordinate a* increased
with saffron concentration, thus the color tended to red [4], demonstrated by the positive sign
in the GLM equation (Table 1, Figure 1). In the other hand, in the saffron extracts coordinate
b* decreased with saffron concentration, having an opposite behavior comparing with saffron
aqueous extracts [4].
Even if temperature was not significant for any coordinate, it has been reported that this
factor could cause isomerization, foaming and degradation of some milk and saffron compounds,
such as crocetin esters, proteins, fat and lactose. In addition, heat treatment application to
milk molecules has been proved to cause denaturalization, lactose degradation, and structural
changes [5]. Some authors suggest the utilization of temperatures between 30 and 70°C for
saffron aqueous extraction to avoid compound damage and hence losses of saffron coloring
strength [6].
Extraction time was also not significant for any color coordinate studied, nevertheless some
authors [5, 6] mentioned that long extraction periods are not recommended because they could
cause loss of coloring strength, as well as saturation.
From the above, 37°C and 20 minutes were selected as suitable conditions for saffron
extraction in skim ewe milk.
4. Conclusion
As saffron concentration was increased, a*and C* coordinates were increased, and L*, b* and
h were decreased. Temperature and extraction time did not have any significant influence on
saffron color coordinates, so that, the lower extraction conditions (37 ºC and 20 minutes) could
be used to avoid milk and saffron damage.
References
1. Carmona, M., Zalacaín Aramburu, A. & Alonso Díaz-Marta, G. El color, sabor y aroma del
azafrán especia. Altabán Ediciones, Albacete, Spain (2006).
2. ISO 3632-1,2. Technical Specification. Saffron (Crocus sativus L.) Part 1. (Specification) and
Part 2 (Test methods). International Organization for Standarization. Geneva, Switzerland
(2003).
3. Licón, C., Carmon,a M., Llorens, S., Berruga, M.I. & Alonso, G.L. Potential healthy effects
of saffron spice (Crocus sativus L. stigmas) consumption. Functional Plant Science and
Biotechnology, 4(2): 63-74 (2010).
4. Alonso, G.L., Sánchez-Fernández, M.A., Sáez, J.R., Zalacaín, A. & Salinas, M.R. Evaluation
of the color of Spanish saffron using tristimulus colorimetry. Italian Journal of Food Science,
15(2): 249-258 (2003).
5. Orfanou, O. & Tsimidou, M. Evaluation of the coloring strength of saffron spice by UV-Vis
spectrometry. Food Chemistry, 57 (3): 463-469 (1996).
6. Sánchez, A.M., Carmona, M., Ordoudi, S.A., Tsimidou, M.Z. & Alonso, G.L. Kinectics of individual
crocetin ester degradation in aqueous extracts of saffron (Crocus sativus L.) upon thermal
treatment in the dark. Journal of Agricultural and Food Chemistry, 56: 1627-1637 (2008).](https://image.slidesharecdn.com/sissue012012finalcat-140620033827-phpapp01/85/S-issue-01_2012_finalcat-84-320.jpg)
![80
Special Issue of the International Dairy Federation 1201 IDF International Symposium on
Sheep, Goat and other non-Cow Milk
3.6. (S3.18) Effect Of Fat Content on The Coloring Properties of
Saffron Spice in Ewe Milk
C. Licón1, M. Carmona2, A. Molina1, M.I. Berruga1
Summary
Saffron spice (Crocus sativus L.) is widely used for its coloring properties in many dishes, but its
coloring ability in a fatty matrix, such as milk, has not been yet studied. Due to fat concentration
changes in sheep milk during lactation period, the aim of this work was to study by tristimulus
colorimetry, the effect of fat content on saffron coloring properties. A 1% saffron solution in ewe
milk was used, to consider the potential production of color in milk products. As milk fat content
was increased, the saffron extracts were brighter, more yellow and less red, and the values of
ΔE* coordinate were increased. Ewe milk was found an appropriate matrix for saffron color
extraction to elaborate milk products; however, the period of lactation has to be considered
when preparing these solutions.
1. Introduction
Saffron spice (Crocus sativus L.) is widely used for its coloring properties in many milk products
such as Box cheese in Germany, Luneberg in Austria, Piacentinu Ennese in Sicily, spreadable
cheeses in Sardinia, Bouchon allo Zafferano in Lombardia or Cacio allo Zafferano but its coloring
ability on milk, has not been yet studied. Physico-chemical composition of milk is variable and
mainly influenced by breed, feeding, milking system or lactation stage [1]. Particularly in ewe’s
milk, fat and protein concentrations vary significantly during lactation, from 4 to 10% and from
4.8% to 6%, respectively [2]. Standardization, which involves skimming or blending skim and
whole milk, is a common practice used in dairy industry. But many other industries that process
ewe milk do not practise this treatment resulting in variable milk composition during lactation.
Consequently, this variation must be taken into account when dairy products are produced. The
aim of this work was to study the effect of fat content on saffron coloring properties using a 1%
saffron solution in ewe milk with different fat contents by tristimulus colorimetry, to research
the possibility of future production of milk products.
2. Material and methods
Three 3 litre batches of ewe milk with different milk fat contents were used. Batch A, commercial
semi skim UHT ewe milk, had a fat content of 1.6% (Gaza, Zamora, Spain); batch B, obtained
from the Experimental farm “Las Tiesas”, had a 6% of fat content (Albacete, Spain) and batch
C, from the Experimental farm of Universidad de Castilla-La Mancha, had a fat content of 9%
(Albacete, Spain). Thirty-three grams of Spanish saffron spice (Crocus sativus L.) of the Pro-
tected Designation of Origin “Azafrán de la Mancha” were used from the 2007 harvest. Saffron
was ground according to the ISO 3632 Technical specification [3]. The mixture was prepared in
milk following the specification of the pending patent No.P200930912. The temperature of the
saffron color extraction was measured at 37 ± 4 ºC for 20 minutes at a saffron concentration of
1% (w/v). All treatments were done in triplicate. Reflected color was measured using a Minolta
CR-400 (Minolta Camera Co., Osaka, Japan) with a CR-a33f cone, a D65 illuminant and an angle
vision of 10º were used. CIE L*a*b* coordinates were obtained and ΔE*calculated according
to the following formula: ΔE* = (ΔL2 + Δa2 + Δb2)1/2, taking as a reference the corresponded
1 Departamento de Ciencia y Tecnología Agroforestal y Genética, ETSIA-IDR, Universidad de Castilla-La Mancha,
02071, Albacete, Spain (mariaisabel.berruga@uclm.es).
2 Albacete Science and Technology Park, Campus Universitario, 02071 Albacete, Spain.](https://image.slidesharecdn.com/sissue012012finalcat-140620033827-phpapp01/85/S-issue-01_2012_finalcat-85-320.jpg)

![82
Special Issue of the International Dairy Federation 1201 IDF International Symposium on
Sheep, Goat and other non-Cow Milk
Frost et al., [4] indicated a perception of a brighter cow milk sample as milkfat was increased,
as well as Popov-Raljic et al., [5], who suggested that milk fat provides a positive effect on L*
coordinate, whole milk being brighter than semi skim milk. Frost et al., [4] also observed that
as milk fat content increases; a yellower milk color is perceived. In ewe milk, b* coordinate
decreases (Table 1), while according to other authors yellow perception increases. This could
be caused by chemical differences between cow and ewe milk, since cow milk contains more
carotenes than ewe milk, and these are responsible for yellow color in milk [5].
Carotenes have a lipophilic structure, so milk with higher fat content would have a greater
influence in b* coordinate, and so that, contributing to make the saffron extracts yellower.
Studies regarding saffron coloration focus mainly on aqueous solutions. Coloration of saffron
milk extracts was different compared to saffron aqueous extracts, having yellow hues, while
saffron extracts in water tend to have red hues at the same concentration. This fact is explained
because the coloring compounds of saffron, crocetin esters, are water soluble substances that
give a reddish color to the aqueous saffron solutions [6].
4. Conclusions
Ewe milk was was found to be an appropriate matrix for saffron color extraction. It can therefore
be used to produce new products. However, the stage of lactation has to be considered when
preparing these solutions.
References
1. Pulina, G. & Nudda, A. Milk Production. In Dairy Sheep Feeding and Nutrition. Bologna: Editorial
Avenue Media (2002).
2. Molina, M.P., Berruga, M.I. & Molina, A. Calidad de leche de oveja. In Ovinotecnia. Producción
y economía en la especie ovina. Zaragoza: Prensas Universitarias de Zaragoza (2009).
3. ISO 3632-1,2. Technical Specification. Saffron (Crocus sativus L.) Part 1. (Specification) and
Part 2 (Test methods). International Organization for Standardization. Geneva, Switzerland
(2003).
4. Frost, B.M., Dijksterhuis, G. & Martens, M. Sensory perception of fat in milk. Food Quality
and Preference, 12: 327-336 (2001).
5. Popov-Raljic, J., Lakic, N.S., Lalicic-Petronijevic, J.G., Barac, M.B. & Skimic, V.M. Color
changes of UHT milk during storage. Sensors, 8: 5961-5974 (2008).
6. Alonso, G.L., Sánchez-Fernández, M.A., Sáez, J.R., Zalacain, A. & Salinas, M.R. Evaluation
of the color of Spanish saffron using tristimulus colorimetry. Italian Journal of Food Science,
15 (2): 249-258 (2003).](https://image.slidesharecdn.com/sissue012012finalcat-140620033827-phpapp01/85/S-issue-01_2012_finalcat-87-320.jpg)


![85
Special Issue of the International Dairy Federation 1201 IDF International Symposium on
Sheep, Goat and other non-Cow Milk
Figure 1. Two-dimensional electrophoresis of water-soluble extracts prepared from
Teleme cheese manufactured from (a) sheep milk, (b) goat milk
(S1-S7, G1-G3: spots selected for identification by MS)
Table 2: Identification of proteins from 2D electrophoresis gels following MALDI-MS
Spot
Protein identification
(ID)
Observed
molecular
weight (Da)
MOWSE
score(a) ID* Accession No(b)
Calculated
molecular
weight; pI
Ovis aries
S1 β-Lactoglobulin 20,362 99 I P67976 18,151;5.26
S2 β-Lactoglobulin 20,362 114 I P67976 18,151;5.26
S3 β-Lactoglobulin 20,362 149 I P67976 18,151;5.26
S4 Serum albumin 71,244 70 U P14639 66,328; 5.58
S5 α-Lactalbumin 14,200 84 I P09462 14,255; 4.70
S6
Immunoglobulin
gamma chain
~50k 61 U gi 388235 52,332;5.65
S7
Immunoglobulin
gamma chain
~50k 61 U gi 388235 52,332;5.65
Capra hircus
G1 α-Lactalbumin 14,641 42 U P00712 14,194; 4.92
G2 β-Lactoglobulin 20,362 112 I P02756 18,191; 5.29
G3 β-Lactoglobulin 20,362 158 I P02756 19,976; 5.50
* I = identified; U = uncertain. (a)MOWSE = Probability score [> 56 is significant ID].
(b) Accession No = SwissProt Acc. No., (http://expasy.org/sprot/) except S6 and S7 = Matrix Science
(http://www.matrixscience.com).](https://image.slidesharecdn.com/sissue012012finalcat-140620033827-phpapp01/85/S-issue-01_2012_finalcat-90-320.jpg)


![94
Special Issue of the International Dairy Federation 1201 IDF International Symposium on
Sheep, Goat and other non-Cow Milk
3.10. (S3.29) Mattonella Cheese: Production Process and
Microbiological Quality
V. Mariano1, S. Gradassi1, P. De Santis2, E. Vergari1, A. Nardi1
Summary
The objective of this study was to follow the production process and the bacteriological condi-
tion and to characterize the lactic flora of Mattonella cheese, a typical small scale dairy product
of the Italian Maremma territory, made of goat milk. Five batches were followed and sampled
along the production process. No pathogenic bacteria such as Listeria spp. and Salmonella
spp. were isolated. Staphylococcus spp. were present in low concentrations (max= 8,2 x10³
cfu.g-1) during the first phases of cheese processing and decreased close to the minimum
detectable limit (<1x10² cfu.g-1) during the transformation process. Sulfite-reducting clostridia
were isolated throughout the batches examined. Sample trends for mesophilic lactococci and
lactobacilli, thermophilic lactococci and total mesophilic count were examined throughout the
processing phases. Lactococcus spp. flora, when typified by PCR and DGGE, were identified as
Lactobacillus paracasei paracasei.
1. Introduction
The purpose of Reg. CE 509/2006 and 510/2006 is to guarantee and enhance traditional
productions. Goat milk production in Italy is high with 48520 tonnes/year [5] and destined
mainly to traditional dairy industry. To assure the authenticity of DOP, IGP and STG productions it
is necessary to distinguish these products. Dairy products are characterized from typical lactic
flora naturally present in the primary product and/or in the production environment [2]. The
aim of this preliminary study was to follow the production process and the bacteriological con-
ditions of a typical small scale Maremma dairy products, such as Mattonella cheese, in order
to identify the characteristics and safety of the traditional process. Mattonella is a rectangular,
surface mould goat milk cheese obtained through the addition of Penicillium candidum.
2. Materials and Methods
Five batches of Mattonella cheese were sampled together with environmental samples and followed
along the production process. Samples were taken from curd, from the product into the moulds
(T0), after the transfer into the ripening room (T1= 1st day), at the middle (T2= 7th day) and
at the end of the ripening period (T3=15th day). Two batches of Mattonella were also sampled
after the drying period at T4 (35th day) and T5 (60th day). On each sample the hygiene of the
production process and the bacteriological quality was tested for: Salmonella spp., Listeria
monocytogenes, Staphylococcus aureus, sulfite-reducting clostridia and total bacterial count.
To characterize the product, cheese was examined for: Lactobacillus spp., thermophilic and
mesophilic lactococci. Environmental samples from the working table, ripening rooms and the
working tools utilized (containers, moulds, agitator) were taken along the productive process
for pathogens bacteria. Lactococcus spp. flora was also characterized by PCR and DGGE
reaction.
1 Food Inspection Laboratory, Grosseto Section, Istituto Zooprofilatto Sperimentale delle Regioni Lazio e
Toscana, Viale Europa 30 – 58100 Grosseto- Italy- grosseto@izslt.it (valeria.mariano@izslt.it).
2 Food Inspection Laboratory, Istituto Zooprofilatto Sperimentale delle Regioni Lazio e Toscana,Via Appia
Nuova 1411 – 00178 Rome Italy.](https://image.slidesharecdn.com/sissue012012finalcat-140620033827-phpapp01/85/S-issue-01_2012_finalcat-99-320.jpg)

![96
Special Issue of the International Dairy Federation 1201 IDF International Symposium on
Sheep, Goat and other non-Cow Milk
4. Discussion and Conclusions
The study allowed to follow and describe the productive process of Mattonella cheese, a small
scale traditional dairy products. No pathogenic bacteria such as Listeria spp. and Salmonella
spp. were isolated in the cheese, nor in their environment, revealing high hygiene levels in
the processing procedures. The presence and inconstant trend of sulphite-reducting clostridia,
which did not cause any organoleptic alteration of the products, requires further study in order
to better understand the conditions of the production process. Staphylococcus aureus, isolated
in two batches of Mattonella cheese was detected in low concentrations (max = 8,2x10³ cfu.g-1
for Mattonella) during the first steps of cheese processing; moreover they decreased during
the transformation process, reaching a level close to the minimum detectable limit at the final
sampling (<1x10² cfu.g-1) for Mattonella and 5.9x10² cfu.g-1. Thus the antagonist activity of
lactic flora seem to be enough to ensure a good microbiological quality of the products at the
end of the process, since the level of coagulase positive staphylococci is lower than the limit
imposed by Council Regulation (EC) No 2073/2005. Previous studies have demonstrated the
bacteriocin activity of Lactobacillus paracasei subsp. paracasei [1, 3]. Mesophilic lactobacilli, as
well as thermophilic and mesophilic lactococci, in Mattonella cheese maintain high concentrations,
respectively around 1010,105 and 1010 for all the sampling period. The high concentration of
this bacteria is fundamental for the acidification of the product, which in turn contributes to the
demineralization of casein, and therefore to good cheese processing. Furthermore, mesophilic
lactococci and lactobacilli seem to have a proteolytic activity, which contributes to the organoleptic
characteristics of the product [4]. These data collected will help to provide a basis for risk
assessment that evaluate the microbiological safety of traditional and farmstead cheeses in
Grosseto.
Aknowledgments
These preliminary results are part of a research project on “Characterization and definition
of food safety of Italian typical products” supported by the Italian Ministry of Health. Special
thanks to the personnel of the Parrina farm, to Matteo Bruni and to the staff of the Food
Inspection Laboratory: Gianni Bartolini, Deborah Agnelli Amaranta Biancheri Mantovani and
B.M. Varcasia.
References
1. Atanassova, M., Chipeva, V., Ivanova, I., Haertle, T. Determination of the growth stages of
Lactobacillus paracasei subsp. paracasei M3 from Bulgarian yellow cheese by electroconduc-
tivity. J Microbiol Methods 46:227-233 (2001).
2. Beresford, T. P., Fitzsimons, N. A., Brennan, N. L., Cogan, T. M. Recent advances in cheese
microbiology. Int Dairy J. 11:259-274 (2001).
3. Caridi, A. Identification and first characterization of lactic acid bacteria isolated from the
artisanal ovine cheese Pecorino del Poro. Int J Dairy Technol. 56:105-110 (2003).
4. Cerri, D., Innocenti, E., Fratini, F., Ebani, V., Ampolla, M., Zucconi, C., Andreani E. Valutazi-
one igienico-sanitaria e caratterizzazione microbiologica della caciotta caprina a latte crudo
dell’isola di capraia. In Veinte años de buiatría: actas del XIV Congreso Internacional de la
Federación Mediterránea de Sanidad y Producción de Rumiantes (pp. 289-298). Universidad
de Santiago de Compostela (2006).
5. FAO STAT. Retrieved January, 2011, from http://faostat.fao.org/site/291/default.aspx (2010).](https://image.slidesharecdn.com/sissue012012finalcat-140620033827-phpapp01/85/S-issue-01_2012_finalcat-101-320.jpg)
![97
Special Issue of the International Dairy Federation 1201 IDF International Symposium on
Sheep, Goat and other non-Cow Milk
3.11. (S3.30) Raviggiolo Cheese: Production Process and
Microbiological Quality
V. Mariano1, S. Gradassi1, P. De Santis2, D. Agnelli1, A. Nardi1
Abstract
The aim of this study was to follow the production process and the the bacteriological conditions
and to characterize a typical small scale Maremma dairy product, such as Raviggiolo cheese
which is a soft cheese with a short shelf life (4 days). Five batches of each product were followed
and sampled during the production process. No pathogenic bacteria such as Listeria spp. and
Salmonella spp. were isolated. Staphylococcus spp. were present in low concentrations (max=4
x103 cfu g-1) during the first phases of cheese processing and decreased close to the minimum
detectable limit (5,9x10² cfu g-1) during the production process. Sulfite-reductive clostridia
were isolated throughout the batches examined. Sample trends for mesophilic lactococci and
lactobacilli, thermophilic lactococci and total mesophilic count were examined throughout the
processing phases. Lactococcus spp. flora, typified by PCR and DGGE, resulted to be constituted
of Lactococcus lactis and L. delbrueckii subsp. bulgaricus.
1. Introduction
The objective of the European food safety policy is to ensure a high level of human health
protection while also taking into account territorial diversity such as traditional food. The
objectives of Council Regulation (EC) No 509 and 510 of 26 March 2006 are the enhancement
and guarantee of traditional productions [2] In order to recognize traditional cultures and their
products, there are three different kinds of EU warranty labels in Italy: DOP, IGP and STG.
Italian traditional dairy products are exported all over the world. Italy is the largest EU exporter
of cheese, exporting 1.116.397 tonnes/year - 2009 data [3]. There are studies concerning
cheese quality of the best known cheeses but there are none on most of the small scale products
produced and consumed only in some particular territories, sometimes because of their short
shelf-life, sometimes because no marketing strategies are implemented by small scale dairies.
Italy is the third European country for ovine milk production, producing about 580.000 tonnes
of ovine milk per year [3], mainly produced by semi-extensive farms [1]. Tuscany is the 4th
Italian Region for ovine milk production [6] and 50% of its ovine farms are located in Central
Maremma. This area is the homeland of about 227.000 sheep, collected in 1383 farms [1],
mostly devoted to the production of ovine milk. Thus, many of the dairy products made with
ovine milk are known only locally and their characteristics have not been investigated yet. The
aim of this study was to follow the production process, the bacteriological conditions and to
characterize a typical small scale Maremma dairy product, such as Raviggiolo cheese, which
is a soft cheese with a short shelf life (4 days) obtained from breaking the curd of ovine milk,
typically served on fern leaves.
2. Material and Methods
Five batches of the product have been followed along the production process, noting environ-
mental conditions, timing and temperature. Samples were taken from milk, from the product
into the moulds (T0), twice during the shelf life of the product (T1=3rd day; T2=5th day) and
some days after the shelf life (T3=8th day). Each sample was tested for total bacteria count,
1 Food Inspection Laboratory, Grosseto Section, Istituto Zooprofilatto Sperimentale delle Regioni Lazio e Toscana,
Viale Europa 30 – 58100 Grosseto- Italy- grosseto@izslt.it (valeria.mariano@izslt.it).
2 Food Inspection Laboratory, Istituto Zooprofilatto Sperimentale delle Regioni Lazio e Toscana,Via Appia Nuova
1411 – 00178 Rome Italy.](https://image.slidesharecdn.com/sissue012012finalcat-140620033827-phpapp01/85/S-issue-01_2012_finalcat-102-320.jpg)

![99
Special Issue of the International Dairy Federation 1201 IDF International Symposium on
Sheep, Goat and other non-Cow Milk
4. Discussion and conclusions
No pathogenic bacteria such as Listeria spp. and Salmonella spp. were isolated in cheese, nor
in their environment, revealing high hygiene levels in the processing procedures. The presence
and variable trend of sulphite-reducting clostridia, which did not cause any organoleptic change
in the products, require further study in order to better understand the conditions of the
production process. Staphylococcus aureus was found in all the Raviggiolo batches but in low
concentrations (max= 4,3x10³ cfu g-1) during the first steps of cheese processing; moreover
they decreased during the production process, reaching a level close to the minimum detectable
limit at the final sampling 5,9x10² cfu g-1 (T3). The use of raw milk for the production of
Raviggiolo provides a good chance for contamination by pathogens and survival throughout
manufacture and storage as well. Nevertheless, the antagonistic activity of the lactic flora
seems to be enough to ensure good microbiological quality of the products at the end of the
process, since the level of coagulase positive staphylococci is lower than the limit imposed by
Council Regulation (EC) No 2073/2005. Previous studies have demonstrated the bacteriocin
activity of Lactococcus lactis [5] and Lactococcus delbrueckii [4]. Raviggiolo cheese revealed a
high concentration of mesophilic lactobacilli, as well as thermophilic and mesophilic lactococci,
respectively around 104,104 and 105 until the 4th day. After this time a decrease is noted in
mesophilic lactobacilli, as well as thermophilic and mesophilic lactococci, along with a relevant
increase in the total mesophilic count; a four day shelf life of the product is therefore to be
considered as appropriate. The data collected will help risk assessment that evaluates the
microbiological safety of traditional and farmstead cheeses in Grosseto.
Aknowledgments
These results are part of a research project on “Characterization and definition of food safety of
Italian typical products” supported by the Italian Ministry of Health.
Special thanks to the personnel of the Ovis farm, to Matteo Bruni and to the staff of the Food
Inspection Laboratory: Gianni Bartolini, Amaranta Biancheri Mantovani, Emanuela Vergari and
B.M. Varcasia.
References
1. Anagrafe Nazionale Zootecnica. Consistency of ovine farms. Retrieved January, 2011, from
http://statistiche.izs.it/portal/page?_pageid=73,12918&_dad=portal&_schema=PORTAL&op=view_
rep&p_report=plet_rep_r2_ovi&p_liv=P&p_sigla_liv=053. (2010).
0,00E+00
1,00E+05
2,00E+05
3,00E+05
4,00E+05
T0 T1 T2 T3
Time phase
CFUCFUg-1
Termophilic Lactococci
Mesophilic Lactobacilli
Mesophilic Lactococci
0,00E+00
5,00E+07
1,00E+08
1,50E+08
2,00E+08
2,50E+08
3,00E+08
3,50E+08
4,00E+08
4,50E+08
5,00E+08
T0 T1 T2 T3
Time phase
Mesophilic count UFC/g
Figure 2. Average trend of Raviggiolo total mesophilic count for each processing phase](https://image.slidesharecdn.com/sissue012012finalcat-140620033827-phpapp01/85/S-issue-01_2012_finalcat-104-320.jpg)
![100
Special Issue of the International Dairy Federation 1201 IDF International Symposium on
Sheep, Goat and other non-Cow Milk
2. European Union. Agricultural products and foodstuffs as traditional specialities guaran-
teed. Retrieved May, 2011, from http://europa.eu/legislation_summaries/agriculture/food/
l66043_en.htm (2007)
3. FAO. FAO STAT. Retrieved January, 2011, from http://faostat.fao.org/site/291/default.aspx
(2010).
4. Guglielmotti, D. M., Marco, M. B., Golowczyc, M., Reinheimer, J. A., Quiberoni, A. L. Probiotic
potential of Lactobacillus delbrueckii strains and their phage resistant mutants. Int Dairy J.
17:916-925 (2007).
5. Moschetti, G., Blaiotta, G., Villani, F., Coppola, S. Nisin-producing organisms during traditional
‘Fior di latte’ cheese-making monitored by multiplex-PCR and PFGE analyses. Int J Food
Microbiol. 63:109-116 (2001).
6. Porcu, F. & D’Andrea, F. [The current situation of sheep milk and cheese production in Italy];
La situazione della produzione del latte e dei formaggi ovini in Italia. Allevatore Di Ovini e
Caprini (Italy). 20(5):9-12 (2004).](https://image.slidesharecdn.com/sissue012012finalcat-140620033827-phpapp01/85/S-issue-01_2012_finalcat-105-320.jpg)
![101
Special Issue of the International Dairy Federation 1201 IDF International Symposium on
Sheep, Goat and other non-Cow Milk
3.12. (S3.31) Influence of Salting Method on The Mineral
Content of Ovine Halloumi Cheese
F. Karali1, E. Moschopoulou1, S. Kaminarides1
Summary
Halloumi cheese was dry-salted or salted in brine under various conditions. The results obtained
showed that the sodium content increased with increasing brine concentration and brining time,
while the rate of increase was affected by the brining temperature. The concentrations of calcium,
magnesium, phosphorus and, in particular, potassium in the cheese were also affected by the
method of salting. Cheeses that were dry-salted exhibited higher levels of calcium, phosphorus,
magnesium and potassium than cheeses salted in brine. In addition, the concentrations of
calcium, phosphorus, magnesium and potassium decreased, as brining time increased.
1. Introduction
The salt content of a cheese depends on several parameters, such as the method of salting
(e.g. dry or brine salting), the temperature, the cheese type and size etc., and affects not only
the flavour but also most of the biochemical characteristics of the cheese. The aim of this study
was to evaluate the effect of various methods of salting on the sodium, potassium, calcium,
magnesium and phosphorus content of ovine Halloumi cheese.
2. Material and methods
Halloumi cheese was manufactured according to the technology described by Anifantakis and
Kaminarides [1] and was salted in 2 ways: a) by dry-salting or b) in brine at three concentrations
(7%, 10% and 13% NaCl) and at two temperatures (4°C and 20°C) for 3, 6, 24 and 48 hours.
The dry-salted cheeses were analyzed after 24 h, while the control cheese was left unsalted.
The salt content was determined by a potentiometric titration method [2], the Ca, Mg, K and
Na contents were determined by Atomic Absorption Spectrometry (AAS) method [3] and the P
content was determined by a spectrometric method [4].
3. Results
The sodium content of cheese salted in brine increased with the brine concentration and the
brining time, while the rate of increase was affected mainly by the brining temperature
(Figure 1a,b).
In contrast, the increase of the duration of brining caused a reduction in the concentrations
of calcium, phosphorus, magnesium and potassium (Figure 2).
A comparison of the results obtained from the different methods of salting for 24 h,
showed that the sodium content was lower in dry salted cheeses than in cheeses salted in
brine (Figure 3a), whereas the reverse was observed for potassium (Figure 3b), calcium
(Figure 3c), phosphorus (Figure 3d) and magnesium (Figure 3e).
4. Conclusion
From the obtained results it is clear that the method and conditions of salting significantly
influenced the mineral content of ovine Halloumi cheese.
1 Laboratory of Dairy Science & Technology, Department of Food Science & Technology, Agricultural University
of Athens, Greece (catmos@aua.gr)](https://image.slidesharecdn.com/sissue012012finalcat-140620033827-phpapp01/85/S-issue-01_2012_finalcat-106-320.jpg)


![108
Special Issue of the International Dairy Federation 1201 IDF International Symposium on
Sheep, Goat and other non-Cow Milk
3.14. (S3.35) Effect of Commercial and Potential Probiotics
on The Characteristics of Soft Goat Cheeses
Z. Radulovic1, J. Miocinovic1, M. Petrusic1, N. Mirkovic1, D. Paunovic1, T. Petrovic1
Summary
The aim of this study was to investigate the survival of commercial and potential probiotic
bacteria and their effect on the chemical composition and sensory quality of soft goat cheeses.
Three variants of soft goat cheeses were produced: 1. control cheese (starter CHN 11; Chr.
Hansen, Denmark); 2. starter + autochthonous potential probiotic Lactobacillus plantarum 564;
3. starter + commercial probiotic Lactobacillus acidophilus LA-5 (Chr. Hansen, Denmark). The
survival of potential and commercial probiotic bacteria, chemical composition, pH values and
sensory evaluation were examined during storage. Lb. plantarum 564 and Lb. acidophilus LA-5
counts were at the level of >107 cfu.g−1. The chemical composition and pH values of cheeses
with probiotic bacteria did not differ significantly from the control variant. High viability of
probiotic bacteria and acceptable cheese sensory properties indicate that these probiotic
bacteria can be successfully used in the production of soft goat cheeses.
1. Introduction
Probiotic bacteria are living microorganisms which have a beneficial effect on human health.
Effects on human health include an enhanced immune response, reduction of serum cholesterol,
vitamin synthesis, anticarcinogenic activity and antibacterial activity [1]. The use of goat’s
milk in combination with probiotic bacterial strains in cheese production represents one of
the technology options for manufacturing new functional dairy products. Considering that the
cheeses has been shown as a very good carrier product for delivering probiotic bacteria, it is
important to conduct more studies of using potential probiotic bacteria in soft cheeses made
from goat milk and their effect on final product characteristics of the cheeses. The objective of
this study was to determine viability and survival of potential and commercial probiotic bacteria
in soft cheeses made from goat milk during 56 days of storage, and their effect on chemical
properties and sensory quality of cheeses.
2. Materials and Methods
Milk was pasteurized at 85°C for 10 min, cooled to 30°C and divided into three equal parts.
Control cheese (C1) was produced using commercial starter culture CHN 11. Cheese C2
contained starter culture + potential probiotic strain Lb. plantarum 564 (isolated from white
brined cheese), from the strain collection of the Department for Food Microbiology, Faculty of
Agriculture, University of Belgrade. Lb. plantarum 564 was tested for its probiotic potential
properties by Radulović et al. (2010). Test cheese C3 contained starter culture + commercial
probiotic strain Lb. acidophilus LA-5. All three batches were inoculated with starter cultures
(1mL/100mL) and potential and commercial probiotic strains were added in order to achieve
7 log cfu.g-1. Solution of rennet (Sacco Clarifici, Italy) was added in concentration of 0.5g/100
L-1 to each batch. Fermentation lasted for 15 hours. After fermentation, cheeses were cut into
small cubes, placed in sterilized cotton cheesecloth, and drained for 10 hours at 15°C. Then,
the cheeses were salted with 1% of NaCl and packed in individual plastic cups. Cheeses were
stored under refrigeration at 4°C for 56 days.
1 University of Belgrade, Faculty of Agriculture, Institute for Food Technology and Biochemistry, Serbia
(zradulovic@agrif.bg.ac.rs)](https://image.slidesharecdn.com/sissue012012finalcat-140620033827-phpapp01/85/S-issue-01_2012_finalcat-113-320.jpg)


![116
Special Issue of the International Dairy Federation 1201 IDF International Symposium on
Sheep, Goat and other non-Cow Milk
3.16. (S3.45) Consumer Preferences of Cheeses from The
Canary Islands Made With Traditional Kid Rennet Pastes
M. Fresno1, S. Álvarez1, M. de Renobales2
Summary
Preferences of 118 non-expert tasters and 24 expert panellists were analyzed. Cheeses were
made using 2 different traditional kid rennet pastes: 1) rennet prepared from abomasa full of
milk at collection time (TAR); 2) rennet prepared from emptied and washed abomasa which
were then refilled with goat's raw milk (AAR). Recombinant chymosin was used in control cheese
fabrications (CC). According to the expert panel, the intensity of traditional characteristics (pi-
quant odour with rancid notes and rennet taste) of cheeses made with TAR rennet was higher
than those of cheeses made with AAR rennet, but these characteristics were not detected in CC
cheeses. AAR cheeses were preferred by 45% of all panellists (expert and non-expert), whereas
31% of them preferred TAR cheeses and only 24% preferred CC cheeses. However, expert
panellists selected TAR and AAR cheeses with the same frequency, and none of them preferred
CC cheeses. A majority (76.1 %) of consumers chose cheeses made with rennet pastes.
1. Introduction
In the past, cheese makers have used rennet paste preparations for curdling milk that were
produced by macerating the stomachs from suckling ruminants according to various local uses.
Because rennet preparation is cumbersome and time-consuming, nowadays most of the cheeses
are made with commercial rennet and these artisan pastes are used only in some ovine and
caprine raw milk cheeses [1, 2, 3], In contrast, recombinant chymosin is widely used, even
in farmhouse cheeses, resulting in the loss of differentiating characteristics of cheeses with
protected denomination of origin (PDO). Sensory characteristics of these cheeses made with
traditional kid rennet paste should correspond to the traditional product. However, in spite of
technical aspects, cheese makers need to take consumers' preferences into consideration, even
if they differ from those of expert taste panels.
This paper analyses the preferences of non-expert consumers and expert panellists about
cheeses made with traditional kid rennet pastes compared with cheeses made with recombinant
chymosin.
2. Material and methods
Cheeses were made in the traditional way using 2 different traditional rennet pastes: 1) traditional
artisan rennet prepared from abomasa full of milk at collection time (TAR); 2) adapted artisan
rennet prepared from emptied and washed abomasa which were refilled with goat's raw milk
(AAR). Recombinant chymosin was used in control cheese fabrications (CC). All rennet solutions
were prepared to have the same rennet strength and added to the vats in order to complete
clotting in 30-35 min at 30 ± 1 ºC [4]. Cheeses were ripened for 90 days.
Sensory profile analysis was carried out by a panel of 7 formally trained and highly experienced
judges. Odour and flavour attributes were as described by [5] Berodier et al. (1996), and
texture followed the guidelines published by [6] Lavanchy et al. (1999) both adapted to goat
cheeses by [7] Fresno and Álvarez (2007). For the preference test, each participant (n=142;
expert and non-expert) had to choose only one of the 3 different cheese samples presented.
The non-expert panel (n= 118) comprised individuals who consume cheese regularly. It was
1 Animal Production and Forage Research Unit, Canarian Agronomic Research Institute (ICIA), PO Box 60,
38200 La Laguna, S/C de Tenerife, Spain, (mfresno@icia.es).
2 Biochemistry and Molecular Biology, Faculty of Pharmacy, University of the Basque Country, PO Box 450,
01080 Vitoria-Gasteiz, Spain.](https://image.slidesharecdn.com/sissue012012finalcat-140620033827-phpapp01/85/S-issue-01_2012_finalcat-121-320.jpg)
![117
Special Issue of the International Dairy Federation 1201 IDF International Symposium on
Sheep, Goat and other non-Cow Milk
divided into 2 groups: 44 university students under 25 years of age, and 74 consumers over
25 years old. Twenty-four expert judges also participated in this preference test following an
adaptation of [8] UNE 87-005-92.
3. Results and discussion
According to the expert panel (n=7), sensory results for cheese description profile were:
• Odour and taste intensity: TAR > AAR>CC.
• Rennet odour and taste: TAR>AAR
• Piquant odour and taste: TAR
• Rancid notes in odour and taste: TAR
• Butter odour and taste: AAR
• Fermented fruits: CC
• Pungent in taste: TAR > AAR>CC.
Authors agree that rennet pastes prepared from suckling animals slaughtered right after suckling
have significantly higher pregastric lipase activity than those prepared from animals sacrificed
with empty stomachs [1, 3]. The increase in lipolysis yields cheeses with higher intensity scores
for strong sensory attributes such as pungent and “natural rennet” flavour [1, 9]. This is most
likely the explanation for TAR cheeses receiving higher intensity scores in traditional characteristics
(piquant odour with rancid notes and rennet taste) as compared to cheeses made with AAR
rennet. Those characteristics were not detected in CC cheeses.
Table 1 shows the preference test results. AAR cheeses were preferred by 45% of all panellists,
whereas 31% preferred TAR cheeses, and only 24% preferred CC cheeses. However, expert
panellists selected TAR and AAR cheeses with the same frequency, and none of them preferred
CC cheeses. But non-expert student panellists preferred AAR and CC cheese with the same
frequency, whereas older panellists preferred TAR and AAR cheeses, although almost 19% of
them chose CC cheeses. It was clear that 76.1% of all panellists (expert and non expert)
preferred cheeses made with artisan rennet pastes.
4. Conclusion
TAR cheeses obtained higher scores in strong attributes: odour and flavour intensity, rennet and
pungent odour and flavour, while recombinant rennet cheeses did not present these attributes.
Expert judges and older consumers preferred cheeses made with TAR rennet and university
students preferred AAR and recombinant rennet cheeses because they considered TAR cheeses
to be too strong. TAR cheeses can be a good choice for consumers that like strong traditional
cheeses, and AAR cheeses can be a good solution for consumers that like milder traditional
tastes.
Table 1: Preference test results for cheeses made with different coagulants
Judges CC TAR AAR
Non-expert university students under 25 years of age (n=44) 20 4 20
Non-expert consumers over 25 years of age (n=74) 14 30 30
Trained judges (n=24) - 10 14
Total (n=142) 34 44 64
Judges who selected each cheese (%) 23.94 30.99 45.07
CC: control cheese made with recombinant rennet; TAR: traditional kid artisan rennet prepared from abomasa
full of ingested milk; AAR: adapted kid artisan rennet prepared from emptied abomasa refilled with raw goat’s
milk.](https://image.slidesharecdn.com/sissue012012finalcat-140620033827-phpapp01/85/S-issue-01_2012_finalcat-122-320.jpg)

![119
Special Issue of the International Dairy Federation 1201 IDF International Symposium on
Sheep, Goat and other non-Cow Milk
3.17. (S3.46) Influence of By-Product Diets on Textural and
Colour Properties of Artisanal Goat Cheeses
S. Álvarez1, P. Méndez1, T. Pérez2, M. Fresno1
Summary
The objective of this experiment was to analyze the effect of fermented silage diets using
agroindustrial by-products on different physicochemical goat cheese properties. Three ex-
perimental groups were used: DT was fed a standard diet (mixture of cereal grain and straw),
while DB1 and DB2 were supplemented with different increasing amounts of fermented feed:
18% and 36% of DM respectively. A Texture Profile Analysis (TPA) and colour profile was carried
on fresh (7 d) and semihard (45 d) raw milk goat cheeses.
Diet showed higher effect on fresh cheeses than on semihard cheeses. Five of six textural
parameters presented significant differences. No statistical effect was detected on elasticity.
DT fresh cheeses showed lower fracturability, hardness and gumminess scores while they were
more cohesive and adhesive. Diet affected (p<0.001) all colour parameters in fresh and semihard
cheeses. DB1 and DB2 cheeses presented similar colour characteristics in fresh cheeses but not
in 45 day cheeses.
1. Introduction
The use of agro-industrial by-products in animal nutrition can be adopted as a strategy to
reduce feeding costs and also to cope with the need to recycle waste material which is costly
to dispose of. The traditional problems usually encountered with by-products are seasonality of
supply that is often accented by their high moisture content. Hence, they easily spoil creating
a nuisance and are often wasted. Ensiling by-products is the most suitable method for their
conservation for a long period. Silage may be defined as moist forage in the absence of air
and preserved by fermentation [1]. Fermentation is carried out by bacteria acting on plant
carbohydrates in the chopped forage. The bacteria feed on the carbohydrates in the forage and
rapidly produce volatile acids and lactic acid. When the production of this acid reaches a certain
level, it prevents further bacterial action; resulting in the preserved feed we call silage.
The objective of this experiment was to analyze the effect of fermented silage diets using
agroindustrial by-products on instrumental texture and colour goat cheese properties.
2. Material and methods
42 goats belonging to the Canarian breeds were divided into three experimental groups. Each
group received a different diet: group DT was fed a standard diet (mixture of cereal grain and
straw), while groups DB1 and DB2 were supplemented with different increasing amounts of
fermented feed based on agroindustrial by-products (brewer’s grain and bran): 18% and 36%
of DM respectively. Cheeses, to evaluate diet effect, were made according previous methodology
[2]. A Texture Profile Analysis (TPA) was carried on fresh (7 d) and semihard (45 d) raw milk
goat cheeses determining fracturability, hardness, cohesiveness, adhesiveness, elasticity and
gumminess (Texturometer TA-Xt2i, Stable Micro Systems, Surrey, UK). Inside cheese colour
was also measured using a colorimeter, measuring Lightness (L), Croma (C*), Hue angle (H*),
a and b parameters (Colorimeter CR 300, Minolta, Osaka, Japan). Statistical methodologies
were made with SPSS 15.0.
1 Animal Production Unit. Canarian Agronomic Research Institute. Spain. (salvarez@icia.es).
2 Canarias Forestal S.L. Tenerife, Spain.](https://image.slidesharecdn.com/sissue012012finalcat-140620033827-phpapp01/85/S-issue-01_2012_finalcat-124-320.jpg)
![120
Special Issue of the International Dairy Federation 1201 IDF International Symposium on
Sheep, Goat and other non-Cow Milk
3. Results and discussion
Diet showed higher effect on fresh cheeses than on semihard cheeses (Table 1 and 2). In 7d
cheeses five of six textural parameters presented significant differences (p<0.01). No statistical
effect was detected on elasticity. DT fresh cheeses showed lower fracturability, hardness and
gumminess scores while they were more cohesive and adhesive.
With the ripening process hardness, fracturability and gumminess increased, while elasticity
decreased. As it is common in Canarian cheeses [3], cohesiveness and adhesiveness did not
change as cheeses matured.
Diet affected (p<0.001) all colour parameters in fresh and semihard cheeses (Tables 3 and 4).
DB1 and DB2 cheeses presented similar colour characteristics in fresh cheeses but not in 45 day
cheeses. In reference to lightness values, cheeses from DB2 group were the lightest, but once
completed the ripening process they became the darkest. Differences were also found in Croma
values where the most intensive colour cheeses were DT cheeses and DB1 the least. Hue Angle
values showed that standard diet cheeses were the least yellow and DB1 the most.
Table 1: Texture parameters determined by TPA of fresh cheeses
Texture
Diet
DT DB1 DB2
Fracturability 7.52±3.45a 28.84±9.39b 22.36±8.12b
Hardness 15.57±1.85a 40.27±8.99b 31.03±13.97b
Cohesiveness 0.22±0.03a 0.15±0.03b 0.13±0.03b
Adhesiveness 1.62±1.88a 0.31±0.71ab 0.10±0.12b
Elasticity 87.70±7.66 81.92±11.14 87.14±5.01
Gumminess 305.80±50.03a 514.19±191.41b 367.23±199.11ab
Different letters in the same row mean significant differences a,b=p<0.001
Table 2: Texture parameters determined by TPA of semihard cheeses
Texture
Diet
DT DB1 DB2
Fracturability 67.63±17.95 65.17±18.24 81.53±18.88
Hardness 139.70±33.41a 145.92±40.96ab 181.26±23.10b
Cohesiveness 0.14±0.04 0.14±0.02 0.15±0.01
Adhesiveness 0.64±0.53ab 0.93±0.87b 0.10±0.17a
Elasticity 55.38±20.06 64.26±10.55 62.90±3.91
Gumminess 1006.93±362.52a 1275.23±408.47a 1707.12±306.80b
Different letters in the same row mean significant differences a,b=p<0.001](https://image.slidesharecdn.com/sissue012012finalcat-140620033827-phpapp01/85/S-issue-01_2012_finalcat-125-320.jpg)

![122
Special Issue of the International Dairy Federation 1201 IDF International Symposium on
Sheep, Goat and other non-Cow Milk
3.18. (S3.47) Sensory Characteristics of Goat Cheeses: The
Use of Agroindustrial By-Products in The Diet
S. Álvarez1, P. Méndez1, T. Pérez2, M. Fresno1
Summary
The main objective of this experiment is the evaluation of some agroindustrial by-products
(beer and flour industry by-products) as silage forages for feeding goats. Three experimental
groups were used: A first group, DT, was fed a standard diet (mixture of cereal grain and straw),
while Groups DB1 and DB2 were supplemented with different increasing amounts of fermented
feed: 18% and 36% of DM respectively. The organoleptic profile of manufactured cheese (7 and 45
days) was determined: texture, odour and flavour parameters were evaluated by an expert panel.
The cheeses studied were different when analyzing their organoleptic profile. DB1 and DB2
fresh cheeses were more elastic (p<0.001) and showed higher granularity scores but had lower
solubility and adhesivity than DT fresh cheeses. The odour and flavour intensity and persistence
were higher in DB1 and DB2 cheeses. All the experimental cheeses showed notes of goat milk,
whey and cream. Six of the nine texture parameters were affected by diet in semihard cheeses.
None of the cheeses studied showed odour and flavours that do not correspond with the typical
characteristics of Canarian goat raw milk cheeses.
1. Introduction
Agro-industrial by-products can be an important source in animal feeding and can minimize two
important problems in the Canary Islands: the high cost of Canarian goat industry now linked
to imported and expensive products and the environmental risk that may result from the un-
controlled dumping of by-products. High-moisture agro-industrial by-products are often of high
nutritional value. In industrial countries there are well-developed technologies for recovering
by-products and converting them into protein-rich meals and/or energy-rich concentrates.
Ensiling by-products is a simple and low-cost option which can preserve feeds that are sea-
sonally abundant for later feeding during periods of feed shortage. Ensiling can also render
some previously unpalatable products useful to livestock by changing the chemical nature of
the feed [1]. The brewer’s residues: extracted malt or spent grain, contains 75 - 80% water
when filtered off. Wet spent grain spoils rather quickly and should be used fresh or stored out of
contact with air. Wet spent grain can be ensiled alone or in association with other ingredients,
for example, with flour industry by-products. The latter has the advantage to absorb the juice
from spent grain and consequently to limit losses during fermentation.
The main objective of this experiment is the evaluation of some agroindustrial by-products
(beer and flour industry by-products) as silage forages for feeding goats.
2. Material and methods
In this study 42 goats belonging to the Canarian breeds were divided into three experimental
groups. Each group received a different diet: group DT was fed a standard diet (mixture of
cereal grain and straw), while in groups DB1 and DB2 concentrate was partially substituted with
different amounts of fermented feed based on agroindustrial by-products (brewer’s grain and
bran): 18% and 36% of DM respectively. Cheeses were made according previous methodology
[2], to evaluate the effect of diet. The organoleptic profile of cheeses (7 and 45 days) was
determined: texture, odour and flavour parameters were evaluated by an expert panel following
the methodology described by (3) Fresno and Álvarez (2007). Statistical methodologies were
made with SPSS 15.0.
1 Animal Production Unit. Canarian Agronomic Research Institute. Spain. (salvarez@icia.es).
2 Canarias Forestal S.L. Tenerife, Spain.](https://image.slidesharecdn.com/sissue012012finalcat-140620033827-phpapp01/85/S-issue-01_2012_finalcat-127-320.jpg)
![123
Special Issue of the International Dairy Federation 1201 IDF International Symposium on
Sheep, Goat and other non-Cow Milk
3. Results and discussion
Fresh cheeses were quite different when analyzing their texture profile (Table 1). DB1 and DB2
fresh cheeses were more elastic (p<0.001) and showed higher granulosity scores but had lower
solubility and adhesivity than DT fresh cheeses. Fresh cheeses showed similar firmness, friability
and mouth moisture scores.
Six of the nine texture parameters were affected by diet in semihard cheeses (Table 2). DB2
cheeses where the most different, presenting lower superficial moisture and elasticity scores
while showed higher firmness, solubility and granularity (p<0.001). DT and DB1 cheeses were
quite similar with no differences in all textural parameters. As more silage is added to the diets
differences in cheese texture are extended. In opposite to fresh cheeses where DB1 and DB2
were a homogeneous group, in semihard cheeses DT and DB1 showed the same textural
sensory profile. All experimental cheeses presented typical texture characteristics of Canarian
goat cheeses [3].
Table 1: Texture sensory evaluation of fresh cheeses. DT standard diet (mixture of cereal grain
and straw); DB1 concentrate partially substituted with fermented brewer’s grain and bran 18%
DM; DB2 concentrate partially substituted with fermented brewer’s grain and bran 36% DM
Diet
DT DB1 DB2
Rugosity 3,14±0,24a 2,15±0,27b 2,21±0,26b
Superficial Moisture 5,28±0,27a 5,80±0,28b 5,85±0,28b
Springiness 1,79±0,30a 3,43±0,45b 3,50±0,40b
Firmness 2,57±0,45 2,71±0,39 2,75±0,40
Friability 2,00±0,30 2,00±0,30 2,00±0,30
Adhesivity 4,30±0,27a 2,36±0,24b 2,36±0,24b
Solubility 4,00±0,30a 3,00±0,30b 3,00±0,30b
Mouth moisture 4,14±0,24 4,14±0,24 4,14±0,24
Granulosity 1,71±0,30a 3,00±0,29b 3,00±0,29b
Different letters in the same row mean significant differences a,b=p<0.001
Table 2: Texture sensory evaluation of semihard cheeses. DT standard diet (mixture of cereal
grain and straw); DB1 concentrate partially substituted with fermented brewer’s grain and bran
18% DM; DB2 concentrate partially substituted with fermented brewer’s grain and bran 36% DM
Diet
DT DB1 DB2
Rugosity 3,80±0,27 3,80±0,27 3,80±0,27
Superficial moisture 3,00±0,19a 3,10±0,20a 2,28±0,30b
Springiness 3,14±0,24a 3,14±0,24a 2,50±0,29b
Firmness 4,14±0,24a 4,20±0,20a 5,14±0,25b
Friability 4,14±0,24 4,20±0,20 4,00±0,41
Adhesivity 3,14±0,24 3,14±0,24 3,50±0,40
Solubility 4,57±0,18a 4,65±0,20a 4,15±0,25b
Mouth moisture 3,21±0,26a 3,25±0,30a 2,86±0,24b
Granulosity 3,20±0,27a 3,30±0,30a 2,14±0,25b
Different letters in the same row mean significant differences a,b=p<0.001](https://image.slidesharecdn.com/sissue012012finalcat-140620033827-phpapp01/85/S-issue-01_2012_finalcat-128-320.jpg)
![124
Special Issue of the International Dairy Federation 1201 IDF International Symposium on
Sheep, Goat and other non-Cow Milk
Diet also affected five odour, flavour and taste parameters in fresh cheeses. The odour
intensity, flavour intensity and persistence were higher in cheeses made with milk from goats
fed fermented products. All the experimental cheeses showed notes of goat milk, whey and
cream (data not shown). DT group cheeses were sweeter and less acidic. As is normal in fresh
cheeses, bitterness, astringency or trigeminal sensations were not detected.
The sensory profile showing odour, flavour and taste characteristics of semihard cheeses is
presented in Table 4. As was expected odour and flavour intensity increased compared to fresh
cheeses. DB1 presented the highest intensities (p<0.001) while DT cheeses the lowest. The
persistence value behaved differently, the mouthfeel of DB1 cheeses disappeared before. The
only parameter that showed no significant difference was saltiness, all cheeses showed a proper
degree of salt, slightly below average. It is important to remark that dried and fermented fruit
descriptors appeared in DB1 and DB2 cheeses with the ripening process. None of the cheeses
analysed showed textures, odours or flavours that do not correspond with the typical characteristics
of Canarian goat raw milk cheeses [3].
As a conclusion DB1 and DB2 cheeses showed traditional characteristics. This result may
encourage the use of agroindustrial byproducts in the diets of dairy ruminants.
Table 3: Odour, flavour and taste evaluation of fresh cheeses. DT standard diet (mixture of cereal
grain and straw); DB1 concentrate partially substituted with fermented brewer’s grain and bran
18% DM; DB2 concentrate partially substituted with fermented brewer’s grain and bran 36% DM
Diet
DT DB1 DB2
Odour intensity 1,36±0,24a 1,79±0,27b 1,85±0,30b
Flavour intensity 1,79±0,27a 2,14±0,24b 2,20±0,24b
Saltiness 3,14±0,24 3,14±0,24 3,14±0,24
Sweetness 1,43±0,45a 0,64±0,25b 0c
Acidity 1,64±0,38a 2,07±0,35a 2,64±0,38b
Persistence 1,79±0,26a 2,30±0,28b 2,40±0,30b
Different letters in the same row mean significant differences a,b=p<0.001
Table 4: Odour, flavour and taste evaluation of semihard cheeses DT standard diet (mixture
of cereal grain and straw); DB1 concentrate partially substituted with fermented brewer’s
grain and bran 18% DM; DB2 concentrate partially substituted with fermented brewer’s grain
and bran 36% DM
Diet
DT DB1 DB2
Odour intensity 2,86±0,24a 4,21±0,27b 3,79±0,27c
Flavour intensity 3,36±0,38a 4,99±0,26b 4,50±0,41c
Saltiness 3,50±0,15 3,50±0,15 3,50±0,15
Sweetness 0a 1,71±0,27b 0,71±0,30c
Acidity 3,50±0,41a 2,79±0,27b 1,14±0,24c
Spicy 1,14±0,24 1,50±0,55 1,36±0,30
Astringency 0a 0a 1,00±0,08b
Persistence 4,14±0,25a 3,14±0,30b 4,14±0,25a
Different letters in the same row mean significant differences a,b=p<0.001](https://image.slidesharecdn.com/sissue012012finalcat-140620033827-phpapp01/85/S-issue-01_2012_finalcat-129-320.jpg)

![126
Special Issue of the International Dairy Federation 1201 IDF International Symposium on
Sheep, Goat and other non-Cow Milk
3.19. (S3.55) Implications of Farm Environment Microflora
and Milk Production Practices for Acidifying Ability of Raw
Goat Milk in Lactic Cheese-Making
C. Laithier1, A. Bonnes1, E. Doutart1, L. Barbeau1, H. Tormo2, M. Pétrier1, S. Morge3, V. David1
Summary
The control of acidification step in lactic cheese-making based on whey as a starter culture and
raw milk depends on the acidifying ability of milk microflora. This acidifying ability was studied,
in relation with the acidifying ability of two microflora reservoirs: the milking machine (MM) and
the teat’s skin. Twenty farms were visited twice, to collect information about production practices
and samples from the considered reservoirs. The pH measured show that microflora from the
teats and from milking machine can settle and have an acidifying activity in the milk. Among
the two reservoirs investigated, milking machine contributes the most to the raw milk acidifying
ability. The most influential practices on the acidifying capacity of the milking machine reservoir
are the design, the maintenance of the milking parlour and the milking machine. Further
investigations are necessary to make practical recommendations for the farmers.
1. Introduction
This study was part of a three-year program dealing with the sustainability of the use of natural
whey starter for farmhouse lactic goat cheeses. Quality of whey depends on the control of acidi-
fication step, itself linked with the acidifying ability of milk microflora. This acidifying ability was
studied, in relation to the acidifying ability of two microflora reservoirs: the milking machine
(MM) and the teats’ skin. The influence of some farm management practices on these reservoirs
was also investigated.
2. Materials and methods
This study was carried out at 20 goat cheese dairy farms in the Rhône-Alpes region in France.
It was important for the study for the farms chosen to have comparable milking systems, but
different milk production practices. Also farms employing extreme practices resulting in
sub-standard levels of hygiene were eliminated as previous studies have shown that the levels
of flora in these farms are generally higher, thus increasing the risk of the uncontrolled develop-
ment of spoilage flora and even potentially pathogenic flora [2]. Two visits were conducted,
between March and May 2009, with an interval of six weeks between the two visits. During the
visits, the farms were given a comprehensive questionnaire on their milk production practices
and samples were collected for each reservoir. For each sample, 20 ml of milk (UHT milk that
had passed through the milking machine (MM), composite milk used to smear the teats, milk
from one milking before inoculation) was placed to incubate in five sterile test tubes at 22°C
and pH measurements were taken at 0, 8, 24, 32 and 48 hours. In parallel, the enumeration
of microflora and identifications were made (results not presented here). The MPLS (Multiblock
Partial Least Square) statistical method used, was programmed in the Scilab® software (INRIA,
France). This method is used to explain a given data block (Y) in relation to several other blocks
(X) based on the hierarchical structure of the data blocks studied. This method provides three
types of result: BIP (Block Importance for the Projection): contribution of an X block to explain
1 Institut de l’Elevage, Agrapole, 23, rue Jean Baldassini, 69364 – Lyon cedex 07, France (cecile.laithier@idele.fr).
2 Université de Toulouse, Ecole d’Ingénieurs de Purpan, 75, voie du TOEC, BP 57611, 31076 - TOULOUSE cedex 3,
France.
3 PEP Caprins Rhône-Alpes, Le Pradel, 07170 – Mirabel, France.](https://image.slidesharecdn.com/sissue012012finalcat-140620033827-phpapp01/85/S-issue-01_2012_finalcat-131-320.jpg)
![127
Special Issue of the International Dairy Federation 1201 IDF International Symposium on
Sheep, Goat and other non-Cow Milk
a Y block; VIP (Variable Importance for the Projection): contribution of each variable in the
explanatory blocks to explain a given Y block; regression coefficients between each Y block
variable and each block X variable. The MPLS method allows us to study on the one hand the
relation between the acidification capacity of the reservoirs and the milk collected and on the
other hand between the milk production practices and the acidification capacity of the flora in
the reservoir.
3. Results and discussion
Acidification capacity of milk and reservoirs.
The microflora in the reservoirs is thus capable of settling in the milk and producing an acidifying
effect (table 1). The pH measurements of the samples of milk inoculated by the microflora in
the MM and the teats explained the 80% plus variability of the pH measurements of the milk
collected.
Between the two reservoirs, the milking machine showed a preponderant importance: the
pH measurements of the samples of UHT milk having passed through the MM explained the
68% plus pH levels of the milk collected (table 2). This confirms the importance of the milking
machine in the acidification capacity of milk [1].
Impact of milk production practices on the acidification capacity of flora in the
milking machine.
The explanatory power of the model is lower than previously shown (24.84%), which is
insufficient to be able to provide practical recommendations for producers but may be useful
for constructing hypotheses. Observing the contribution of each block of practices to the block
of pH measurements does not allow us to confirm that any of them has significantly higher or
lower importance than the others. Examining the values of the VIP showed that the variable
concerning general dust accumulation after milking is considered significantly more important
than the others, as is the age of the teat cup liners, the existence or not of a waiting area, the
percentage of plastic in the milking machine and the dates when liners last changed. It was
Table 1: Acidification characteristics of the reservoir samples
Milk
collected(n=40)
Milking machine milk
(n=40)
Composite milk
(n=40)
Average pH at 48 hours
(standard deviation)
4.58 (0.39) 4.58 (0.37) 4.88 (0.52)
Average pH reduction
(standard deviation)
-2.17 (0.38) -2.16 (0.38) -1.80 (0.51)
% samples attaining a pH level≤4.6
at 48 hours (standard deviation)
72.50% 70.00% 42.50%
Table 2: Influence of each “pH of reservoir” on the “pH of milk collected” (block importance for
the collection, BIP)
Milk collected Confidence interval of 95% (BIP under null hypothesis: 50%)
MM 68.93% 56.87% 80.99%
Teats 31.07% 19.02% 43.13%](https://image.slidesharecdn.com/sissue012012finalcat-140620033827-phpapp01/85/S-issue-01_2012_finalcat-132-320.jpg)
![128
Special Issue of the International Dairy Federation 1201 IDF International Symposium on
Sheep, Goat and other non-Cow Milk
observed that the majority of the variables concerning the cleaning practices used on the MM
are significantly less important than the others, while previous studies showed they had an
impact on the acidifying flora in the milk [5, 6]. It is probable that the cleaning practices have
less of an impact in our study due to their lesser variability, in line with the criteria used to select
the farms for the study. Moreover, in previous studies, direct relations were sought, descriptively
without statistical modeling, between the milk collected and combinations of practices involving
other actions than cleaning.
An examination of the regression coefficients showed that the most important variables are
related to the design of the milking parlour and the design and maintenance of the milking
machine. The results are consistent with previous studies [1, 2, 5] or could be explained [3, 4].
Although we were unable to measure their impact on the pH data block in their ensemble, some
cleaning practices were nevertheless in line with the pH levels at end of acidification. A positive
influence of prewashing was noted. The lower delta pH indicating more thorough rinsing is
commensurate with the higher acidifying capacity of the milk, which is similar to what was
observed [2]. Regarding the milking practices, UHT milk that passes through the milking
machine is more acidifying when more air enters when the claws are attached.
4. Conclusion
The microflora in the reservoirs studied (milking machines, teats) is capable of settling in
the milk and producing an acidifying effect. Applying an innovative data analysis method, we
confirmed that the milking machine has an important impact on the acidifying capacity of the
milk collected. The most influential practices on the acidifying capacity of the milking machine
reservoir are the design, the maintenance of the milking parlour and the milking machine. It is
therefore difficult with the current data in hand to recommend more sophisticated management
controls to farmers wishing to maintain a healthy balance between preserving the beneficial
flora and reducing the spoilage flora.
References
1. Laithier, C., Talon, R. Biofilms present in farms producing goat cheese and development
of targeted desinfection procedures. Actes du deuxième colloque Food Factory, 7 octobre,
Laval (2004).
2. Laithier, C. Le réservoir machine à traire : sa composition et les pratiques influentes. In
« Microflore du lait cru. Vers une meilleure connaissance des écosystèmes microbiens du
lait et de leurs facteurs de variation ». CNAOL, 85-98 (2011).
3. Leriche, V., Briandet, R., Carpentier, B. Ecology of mixed biofilms subjected daily to a
chlorinated alkaline solution. Environ. Microbiology. 5:64-71 (2003).
4. Lomander, A., Schreuders, P., Russek-Cohen, E., Ali, L. Evaluation of chlorines impact on
biofilms on scratched stainless steel surfaces. Bioresource Technology. 94:275-283 (2004).
5. Michel, V., Hauwuy, A., Chamba, J.F. La flore microbienne des laits crus de vache : diversité
et influence des conditions de production. Lait. 81:575-592 (2001).
6. Tormo, H., Agabriel, C., Lopez, C., Ali Haimoud Lekhal, C., Roques, C. Relationship between
the production conditions of goat’s milk and the microbial profiles of milk. Int. J. Dairy
Science. 6:13-28 (2010).](https://image.slidesharecdn.com/sissue012012finalcat-140620033827-phpapp01/85/S-issue-01_2012_finalcat-133-320.jpg)
![129
Special Issue of the International Dairy Federation 1201 IDF International Symposium on
Sheep, Goat and other non-Cow Milk
3.20. (S3.62) Traditional Cheeses: Effect of Cheesemaking
Technology on The Physicochemical Composition and Mineral
Contents
A. Nega1, C. Kehagias1, G. Moatsou2
Summary
The objective of the present study was to determine the major minerals of various ovine/
caprine Greek cheese types in relation to physicochemical composition and to investigate the
influence of cheesemaking technology on them. Forty eight cheese market samples, belonging to
various cheese groups, i.e. brined, gruyère, hard cheese, and pasta filata types, were analyzed.
Ca, P and Mg contents varied from 318 to 963, from 248 to 623 and from 22 to 59 mg·100 g-1,
respectively following the variability in the ash content, i.e. from 4.08 to 7.58 g·100 g-1. The
results show how the cheesemaking technology is reflected, not only in the gross composition,
but also in the mineral content of various cheese varieties. Especially, pH, calcium and moisture
were strongly correlated and they can serve as identity indices for each cheese group. In fact,
mineral contents and both Ca:P and Ca:Protein ratios were indicative of each cheese type.
1. Introduction
One of the major characteristics of Greek dairy sector is the production of various cheese types
in different regions of the country. A great part of them are cheeses of Protected Designation
of Origin [3]. They are mainly produced from ovine milk or from its mixtures with caprine milk.
These two kinds of milk correspond to the 60% of the total milk production of the country.
They are produced mainly from animals of autochthonous breeds and their exploitation through
cheese production is an ancient practice. In fact, only 15% of the cheese production in the country
is manufactured from bovine milk. Cheese characteristics are determined by the cheesemilk
composition, cheesemaking technology and ripening conditions [1]. The way of cutting and the
thermal treatment of the cheesecurd affect curd moisture and control acid development and pH
that along with the salt determine the environment, in which the biochemical reactions involved
in cheese ripening also have an influence. Thermal treatment of the cheese curd also affects
the numbers and the kinds of bacteria as well as the enzymatic activities in the curd, these
two being the most important ripening factors in cheese [1, 5]. Cheese pH, concentration of
minerals and the ripening changes particular for each cheese variety affect both cheese flavour
and texture [6]. The aim of the present study was to determine the major minerals of various
Greek cheese types, to relate them with the physicochemical composition reported by Nega &
Moatsou [7] and to examine the influence of cheesemaking technology on them.
2. Materials and Methods
Samples of 48 commercial cheeses belonging to various cheese groups, i.e. brined-, Gruyère,
hard cheese, and pasta filata types were analyzed (Table 1). The determination of physicochemical
characteristics have been published by Nega & Moatsou [8]. The estimation of Ca, Mg, K and Na
in the ash fraction of cheeses was carried out by means of the atomic absorption spectrometric
method [3]. For the stock dilution 40 mg of cheese ash was dissolved in 1 ml nitric acid 25%
(v/v) and then the final volume was made up to 100 ml with ultra pure water HPLC grade. Various
quantities of the stock ash dilution were further diluted in ultra pure water after the addition of
10 ml lanthanum trichloride solution (1% in 25% nitric acid). AAS analyses were carried out in
the above-mentioned dilutions and quantification was based on the respective reference curves.
1 Department of Food Technology, Technological Educational Institute of Athens, Greece.
2 Department of Food Science & Technology, Agricultural University of Athens, Greece (mg@aua.gr).](https://image.slidesharecdn.com/sissue012012finalcat-140620033827-phpapp01/85/S-issue-01_2012_finalcat-134-320.jpg)
![130
Special Issue of the International Dairy Federation 1201 IDF International Symposium on
Sheep, Goat and other non-Cow Milk
Phosphorus was also determined in the ash fraction of cheeses using molecular absorption
spectrometry [4].
3. Results and Discussion
The major mineral constituents of the ash fraction of the studied cheese samples are presented in
Table 2. The Na content was as expected high in the cheeses with high salt content, confirmed
also by the high correlation coefficient (R=0.951) between Na and NaCl content of cheeses [8].
It is evident that acidic cheeses, i.e. B1 and B2 had the lowest calcium, phosphorus and magnesium
contents due to the effect of intense curd acidification on CCP solubilisation and concomitant
loss of minerals in the whey. High values of these minerals were observed in cheeses with pH
>5.5. Calcium concentration was correlated strongly positively with cheese pH (R=0.845) and
negatively (R=-0.902) with cheese moisture [7]. The pH and therefore calcium content configure
for the most part the particular textural characteristics of each cheese category [5, 6].
According to Lucey and Fox [6], cheeses can be classified on the basis of Ca:PO4 ratio. They
report that this ratio tends to decrease as the overall mineral content of cheese decreases,
because during cheesemaking calcium is lost in the whey more rapidly than phosphorus as
whey pH decreases. This is in accordance with the low Ca:P ratios of B1 and B2 acidic cheese
varieties (1.28 and 1.19 respectively) and the high ratios of hard-type and Gruyère-type cheese
(ranged from 1.34 to 1.55). The same was true for the Ca:protein ratio, which is also indicative of
cheesemaking conditions, i.e. acid development and pH at drainage, as suggested by the same
authors. The ratio Ca:protein was low, i.e. lower than 0.021, in acidic high moisture cheeses,
whereas high ratios were observed in high pH cheeses, i.e. >0.029 [7].
Table 1: Samples of traditional Greek cheese varieties analyzed in the present study
Code Cheese variety Cheese type Number of samples
B1 Feta Brined 19
B2 Kalathaki Limnou Brined 3
B3 Sfela Brined 3
G1 Graviera Kritis Gruyére 6
H1 Kefalograviera Hard 5
H2 Ladotyri Mytilinis Hard 3
P1 Kasseri Pasta filata 9
Table 2: Major minerals of traditional Greek cheeses, in mg×100 g-1 (mean ±SD)
Cheese code* Ca P Mg K Na
B1 318.2 ± 99.1 248.1 ±82.7 22.3 ±8.4 69.8 ±28.2 939.8 ±429.3
B2 320.9 ± 82.8 269.6 ±39.0 24.7 ±3.0 63.7 ±16.0 1371.3±267.8
B3 621.0 ±34.6 458.8 ±11.3 43.2 ±3.8 65.8 ±7.1 2296 ±418.6
G1 963.2 ±104.8 623.9 ±61.9 57.8 ±6.1 94.8 ±17.9 642.0 ±185.8
H1 850.6 ± 91.6 574.1±126.6 55.8 ±3.2 80.9 ±9.6 1509.6±216.2
H2 894.5 ±64.9 575.5 ±61.8 59.0 ±6.1 77.8 ±16.1 803.0 ±137.7
P1 858.2 ±76.7 560.5 ±36.5 48.0 ±4.0 74.1 ±13.0 599.0 ±266.7
* For cheese codes see Table 1](https://image.slidesharecdn.com/sissue012012finalcat-140620033827-phpapp01/85/S-issue-01_2012_finalcat-135-320.jpg)

![132
Special Issue of the International Dairy Federation 1201 IDF International Symposium on
Sheep, Goat and other non-Cow Milk
3.21. (S3.64) Use of a Plasminogen Activator in Kefalotyri
Cheese Manufacture
P.D. Angelopoulos1, 2, E.M. Zoidou1
Summary
Urokinase was added to milk for Kefalotyri cheese manufacture to examine the possibility of
accelerating proteolysis during ripening by conversion of indigenous plasminogen to plasmin.
Cheeses were analyzed for their composition and plasmin activity, plasminogen level, proteolysis
and casein hydrolysis after 1, 9, 60 and 120 days of ripening. The addition of urokinase to the
milk significantly increased plasmin activity in the cheese with concomitant decreases in plas-
minogen level and plasminogen:plasmin ratio. Activation of plasminogen to plasmin occurred
principally during 1st day of manufacture presenting a progressive increase up to 120 days of
ripening. The increased plasmin activity in cheese caused increased production of γ-caseins and
N-fractions during ripening indicating that the addition of urokinase to cheesemilk accelerated
proteolysis in Kefalotyri cheese.
1. Introduction
Kefalotyri is a Greek cheese made from ewes'’ milk or a mixture of ewes'’ and goats'’ milk. The
cheese is scalded at 45 oC and ripened for 90 to 120 days. Plasmin has potential role in cheese
ripening, as it contributes to proteolysis, especially in high temperature-cooked varieties. In the
present study a plasminogen activator (urokinase) was added to ewe milk in order to accelerate
proteolysis in Kefalotyri cheese. Ewe milk with low somatic cell count was chosen and the plas-
minolytic system and proteolytic profile of the resulting cheese during ripening were studied.
2. Materials and methods
Urokinase (Sigma Chemical Co., St. Louis, MO) was added to cheesemilk after pasteurization
at a level of 0.5 Units/l and Kefalotyri cheese (cheese C), was manufactured according to the
traditional protocol described by Anifantakis, 1991 [2]. Two control cheeses, one supplemented
with 80 mM plasmin inhibitor 6-aminohexanoic acid (AHA, Sigma Chemical Co., St. Louis, MO)
(cheese A) and the other without additives (cheese B), were also manufactured at the same
time with the same procedure.
Cheese milk was analyzed for chemical composition, somatic cell count (SCC) and total
mesophilic microflora (TBC) according to IDF standards [7, 9, 5].
Cheeses were analyzed at 1, 9, 60 and 120 days for protein [6], moisture [8], fat [10], salt
content [4], pH, total nitrogen (TN%) and nitrogen fractions (N-fractions):nitrogen soluble at
pH 4.4 (pH 4.4-SN) % and nitrogen soluble fraction at 12% TCA (TCA-SN) % [6]. The proteolytic
profile of cheeses was examined by urea-PAGE [1].
Plasmin (PL) and plasminogen (PG) activity in milk was determined as described by Korycka-
Dahl et al. (1983) and Politis et al. (1989b) [11, 13] and in cheeses according to Farkye et al.
(1992) [3].
For statistical analysis the software Statgraphics Plus for Windows v.5.2 (Manugistics Inc.,
Rockville, Maryland 20852, USA) was used.
1 Laboratory of Dairy Research, Department of Food Science and Technology, Agricultural University, Greece,
ezoidou@aua.gr
2 Hellenic Ministry of Rural Development and Food Department of Milk and Dairy Products, Greece,
peteraggel@gmail.com](https://image.slidesharecdn.com/sissue012012finalcat-140620033827-phpapp01/85/S-issue-01_2012_finalcat-137-320.jpg)

![134
Special Issue of the International Dairy Federation 1201 IDF International Symposium on
Sheep, Goat and other non-Cow Milk
3.3. Proteolysis
The evolution of the N-fractions during ripening are reported on Table 1. The total nitrogen in
dry matter was not significantly different for cheeses A, B and C throughout ripening. Percentage
pH 4.4-SN expressed on total nitrogen (pH 4.4-SN/ΤΝ%) (maturation index) and on dry matter
and 12% TCA-SN expressed on total nitrogen (TCA-SN/ΤΝ%) and on dry matter, were higher
in experimental cheese C, especially at the end of ripening, compared to the control cheeses. Control
cheese A, had the lowest maturation index. The increased production of nitrogen fractions in
cheese C during ripening is ascribed to the proteolytic process accelerated by the increased
PL activity observed. Our findings are consistent with the observations of Farkye et al. [3] and
McSweeney et al. [12].
3.4. Casein Hydrolysis
Plasmin cleaves β- and αs- caseins into γ-casein fractions and several proteose-peptones. In our
study a breakdown of αs- and β- caseins occurred in cheeses throughout maturation especially
after 9 days of ripening, while more marked bands ascribed to γ-caseins were observed (Figure 2).
The bands were more intense for cheese C, followed by those of cheeses B and A. These results
were in good agreement with PL activity levels (Table 1). Inhibitor added in cheese A prevented,
while urokinase in cheese C accelerated, the hydrolysis of caseins by plasmin.
4. Conclusion
Urokinase successfully activated PG in Kefalotyri cheese to PL, as indicated by increase in PL
activity and concomitant decrease in PG level. Plasminogen activation occurred principally
during 1st day of cheese making and then presented a progressive less increase up to 120 days
of ripening. The resulting elevated plasmin activity led to accelerated proteolysis in Kefalotyri
cheese as apparent from the levels of N-fractions and casein profiles of the cheese.
Figure 1. Plasmin activity expressed as Units/g (U/g) in Kefalotyri cheeses during ripening.
Values are means of triplicate analyses of three trials. Cheese codes are presented in Table 1](https://image.slidesharecdn.com/sissue012012finalcat-140620033827-phpapp01/85/S-issue-01_2012_finalcat-139-320.jpg)


![137
Special Issue of the International Dairy Federation 1201 IDF International Symposium on
Sheep, Goat and other non-Cow Milk
Extract Sodium Lactate agar Medium after incubation at 30°C for 7 days, Pseudomonas spp.
were counted in PSA agar medium (Microbiol) after incubation at 22°C for 2 days, yeasts were
enumerated on oxytetracycline glucose yeast extract agar (OGYE-Agar) and the plates were
incubated at 22°C for 5 days. Results were expressed as log of colony forming units (cfu) per ml
or gram of sample.
DNA extraction, PCR amplification of the V3 variable region of the 16s rDNA gene and TTGE
analysis were performed as previously described [1], with the following minor differences: gels
were stained with SBYR safe (Invitrogen), no identification ladder made up of reference species
was utilized, bands were excised from gels after staining, eluted overnight in 50 μl of sterile
water, re-amplified with the same primers used for 16S rDNA PCR without the GC-clamp and
then sequenced.
3. Results and discussion
The evolution of the microbial flora based on three batches per farm were analyzed throughout
the ripening. In Table 1 we report the composition and evolution of the average number of the
different microbial groups. The microbial composition of the raw goat milk collected from different
farms is highly variable, as highlighted by the high standard deviation values. Enterobacteria,
Pseudomonas spp, mesophilic and thermophilic lactobacilli were the most variable populations.
Similar results were obtained by other authors for raw goat and cow milk, Foschino et al. [2],
Delbes et al. [3] respectively. On the contrary, the counts of the different microbial populations
were rather similar between batches of the same farm, except for the enterobacteria group
which was variable. This was most likely due to the different hygienic and sanitary conditions in
the farms. Counts of total mesophilic bacteria reached the highest value at day three (9.8 log
cfu/g of cheese), as did counts of mesophilic lactobacilli and lactococci, with maximal populations
around 9.3 log cfu/g of cheese: these numbers tend to decrease by one logarithm unit towards
the end of ripening. A similar pattern was followed by coagulase negative staphylococci. Coagulase
positive staphylococci were detected in low numbers in milk and tended to disappear after 3
days of ripening. The number of propionibacteria increased from the first day and reached a
peak after 20 days of ripening whereas yeast counts reached a maximum of 5.9 log cfu/g of
cheese at 30 days of ripening.
Table 1: Average microbial count (in Log cfu/ml or g) and standard deviation of diverse microbial
groups along manufacturing and ripening stage of 12 batches made in four different farmhouses
(three batches per farmhouse)
Microbial
Groups
Raw milk Curd C3 C10 C20 C30 C60 C90
TMC 6,29 ± 0,94 7,31 ± 0,22 9,68 ± 0,10 9,40 ± 0,16 9,10 ± 0,24 9,06 ± 0,06 8,66 ± 0,29 8,65 ± 0,32
Mesophilic
lactobacilli
5,18 ± 1,27 6,33 ± 0,50 9,31 ± 0,08 9,16 ± 0,06 9,00 ± 0,32 8,84 ± 0,08 8,40 ± 0,46 8,47 ± 0,14
Thermophilic
lactobacilli
3,29 ± 1,27 4,91 ± 1,10 7,35 ± 0,84 7,29 ± 0,62 7,46 ± 0,65 7,35 ± 0,56 7,49 ± 0,61 7,68 ± 0,54
Enterococci 3,22 ± 1,08 4,73 ± 0,43 7,63 ± 0,43 7,72 ± 0,39 7,69 ± 0,51 7,90 ± 0,38 7,87 ± 0,41 7,86 ± 0,36
Lactococci 6,08 ± 0,83 6,91 ± 0,43 9,39 ± 0,03 9,24 ± 0,09 9,05 ± 0,21 8,81 ± 0,21 8,66 ± 0,09 8,35 ± 0,06
Enterobacteria 3,11 ± 1,97 4,59 ± 2,71 6,57 ± 1,92 5,56 ± 1,58 5,55 ± 0,46 3,72 ± 0,56 1,02 ± 1,76 1,02 ± 1,76
Propionibacteria 3,87 ± 0,54 4,38 ± 0,14 5,57 ± 0,39 5,30 ± 0,60 5,38 ± 1,51 4,75 ± 2,40 3,78 ± 1,76 3,52 ± 3,06
CNS 4,13 ± 1,05 4,67 ± 1,25 6,10 ± 0,58 6,73 ± 0,37 6,32 ± 0,41 6,50 ± 0,40 6,34 ± 0,60 6,52 ± 0,50
CPS 1,78 ± 0,74 2,09 ± 0,88 0,43 ± 0,74 0,47 ± 0,81 0,44 ± 0,76 0,64 ± 1,11 0,00 ± 0,00 0,00 ± 0,00
Pseudomonas
spp.
3,15 ± 2,74 4,38 ± 1,52 3,29 ± 0,85 1,71 ± 1,48 1,29 ± 1,55 0,97 ± 0,89 0,54 ± 0,47 0,33 ± 0,57
Yeast 3,08 ± 0,78 3,79 ± 0,57 5,28 ± 1,74 5,82 ± 0,47 5,84 ± 0,14 5,90 ± 1,15 4,85 ± 0,55 4,84 ± 0,91
TMC: Total mesophilic count; CNS: Coagulase Negative Staphylococci; CPS: Coagulase Positive Staphylococci;
C3, C10, C20, C30, C60, C90: cheese at the 3, 10, 20, 30, 60, 90 days of ripening.](https://image.slidesharecdn.com/sissue012012finalcat-140620033827-phpapp01/85/S-issue-01_2012_finalcat-142-320.jpg)
![138
Special Issue of the International Dairy Federation 1201 IDF International Symposium on
Sheep, Goat and other non-Cow Milk
Samples of raw milk, curd and cheese at 3, 10, 20, 30, 60, and 90 days of ripening of the 12
batches were analyzed by TTGE. As an example, the fingerprint obtained using the V3 variable
region of the 16S rDNA for one of the batches is presented in figure 1. The electrophoresis pro-
files of the raw milk showed the presence of three principal bands which were identified as Lac-
tococcus lactis (band m), Enterococcus faecalis (band g) and Escherichia coli (band l). During the
ripening, the most prominent band in all samples was that of Lactococcus lactis. The intensity
of the band, as seen in the figure 1, increased throughout the ripening period. The prevalence
of recovery of this species is mostly in agreement with previous findings [4,5]. Two other bands
were also detected during ripening, one faint band in all samples corresponding to Lactobacillus
plantarum, and an intense one corresponding to Enterococcus faecium. Other bands detected
only in some samples were identified as Leuconostoc mesenteroides, Staphylococcus xilosus
and Hafnia alvei. An intense band identified as Lactobacillus casei was only detected at 90
days of ripening. This species together with L. plantarum and others LAB species belonging
to non-starter lactic acid bacteria (NSLAB) can play an important role in the formation of the
aroma and taste of cheese.
Raw Milk Curd C3 C10 C20 C30 C60 C90
a a a aaaa
b b
c c c c c c
d
f
g
i
m m
g
l
m
i
h
m m m m m
b
n n
o
f
e ee
Figure 1. TTGE analysis of V3 16s rDNA fragments from samples of one batch of “Semicotto
Caprino” goat cheese at various stages of manufacturing and ripening. Bands indicated by
letters were selected for sequencing. A, Lactobacillus plantarum; b, Leuconostoc mesenteroides;
c, Enterococcus faecium; d and e, sequencing failure; f, Staphylococcus xilosus; g, Enterococcus
faecalis; h and i, sequencing failure; l, Escherichia coli; m Lactococcus lactis; n, Hafnia alvei;
o, Lactobacillus casei](https://image.slidesharecdn.com/sissue012012finalcat-140620033827-phpapp01/85/S-issue-01_2012_finalcat-143-320.jpg)

![140
Special Issue of the International Dairy Federation 1201 IDF International Symposium on
Sheep, Goat and other non-Cow Milk
3.23. (S3.71) Detection of Caprine Milk in Ovine Milk
S. Alexandraki1, G. Moatsou1
Summary
The aim of the present study was the determination of the percentage of bovine, ovine and
caprine milk in mixtures. The para-κ-casein fraction was prepared by rennet treatment of the
above milk mixtures. Analysis of the curds was carried out by means of cation-exchange HPLC.
Para-κ-casein retention times were verified, using hydrolysates of crude preparation of κ-casein
from the three kinds of milk. The quantitative determination of the composition of the mixtures
was successful, based on the area of the para-κ-casein chromatographic peaks which were
standardized taking into account the differences in the protein content of the milks. The results
showed that para-κ-caseins of the three different types of milk were clearly separated. Although
the differences between caprine and ovine para-κ-casein are limited, an average difference of
1.6 minutes between the two retention times with low standard deviations (less than 4% of the
average) was observed.
1. Introduction
The problem of adding bovine milk or proteins to cheesemilk has been addressed in detail by
the official method of isoelectric focusing of γ-casein. However, the discrimination between the
proteins of goat and sheep milk is difficult, since they have very few differences. Also, it is
known that the application of isoelectric focusing for the separation of their para-κ-caseins does
not give safe results due to the occurrence of multiple overlapping zones [2]. Thus, the present
study was designed to identify and quantify the type of milk in mixtures based on para-kappa
casein, using an easily applicable chromatographic method [1, 3].
2. Materials and Methods
Four milk mixtures were prepared in triplicate (w/w, Table 1).
The para-κ-casein fraction was prepared by rennet treatment of the above milk mixtures as
described below. Lyophilized mixtures of milk were reconstituted in 40 ml of distilled water
followed by good stirring and heating at 35oC. At this temperature an aqueous solution of rennet
5% (800 μl) was added. After incubation at 37oC for 1 h, the curd was cut and placed in a fabric
filter to drain. The next day, 5 g of the curd was dissolved in 50 ml trisodium citrate buffer 0.1
M, pH 6.6 with continuous stirring and mild heating until the solution was clear. Subsequently,
1 Department of Food Science and Technology, Agricultural University of Athens, Greece.
(voula_alexandraki@yahoo.gr)
Table 1: Codes, composition and reconstitution concentrations of experimental milk mixtures
Code Composition
Concentration of reconstitution
g/40 ml
M2 70% ovine + 30% caprine milk 4.16
M3 50% ovine + 50% caprine milk 4.00
M4 40% ovine + 40% caprine + 20% bovine milk 3.84
M5 50% ovine + 50% bovine milk 3.80](https://image.slidesharecdn.com/sissue012012finalcat-140620033827-phpapp01/85/S-issue-01_2012_finalcat-145-320.jpg)


![143
Special Issue of the International Dairy Federation 1201 IDF International Symposium on
Sheep, Goat and other non-Cow Milk
Session 4: Characteristics and Nutritional Value Of
Ewe, Goat and Other Non-Cow Milk and Milk Products
Posters
4.1. (S4.1) Origin and Control of The Typical Goat Flavour:
Example of French Cheeses
P. Gaborit1, K. Raynal-Ljutovac1
Summary
Goat milk cheeses are characterized by their unique sensorial properties and especially their
typical goat flavor. Compounds such as the 4 ethyl octanoic acid (thresholds, concentration
in milk according to lactation stages and diets), the impact of technological steps of cheese
making and the “quality” of the lipolysis are presented as the main contributors of goat flavour.
Emphasis is placed on the optimum ratio between 4 ethyloctanoic and other free fatty acids
to induce a favorable typical goat flavor. The results concerning the impact of surface ripening
strains (Penicillium camemberti, Geotrichum candidum, yeasts…) in relation to the technological
parameters and biochemical composition of cheeses are also discussed. Finally, the most recent
studies carried out using an edible lactic cheese model for rapid screening of the ripening strains
for their aromatic potentiality are presented.
1. Introduction
Goat milk cheeses are characterized by their typical goat flavour. One of the most influential
compounds is 4 ethyl C8 acid with very low perception thresholds. Parameters controlling its
release in goat milk cheeses are complex and were studied at Actilait. These parameters are the
impact of technological steps, the ripening strains but also its total content in milk according to
lactation stage and feeding of the goats.
2. Perception thresholds
Typical goat flavour is mainly linked to specific free fatty acids: caproïc (C6:0), caprylic (C8:0)
and capric (C10:0) acids but the main marker is 4-ethyloctanoïc acid (4-Ethyl C8) [1, 2] with
very low threshold values (table 1).
1 Actilait, avenue François Mitterrand, Surgères, France (k.raynal@actilait.com).
Table 1: Some perception thresholds according to Le Quéré et al (1996)
Free Fatty acids
Perception thresholdin water
(µg/l)
Perception thresholdin oil
(µg/l)
C8 5,8 - 19 10 - 350
4-methyl C8 0,02 -
4-ethyl C8 0,0018 0,006 – 2,4](https://image.slidesharecdn.com/sissue012012finalcat-140620033827-phpapp01/85/S-issue-01_2012_finalcat-148-320.jpg)
![144
Special Issue of the International Dairy Federation 1201 IDF International Symposium on
Sheep, Goat and other non-Cow Milk
In order to evaluate the threshold level for 4 ethyl octanoïc acid in dairy matrices, the latter
was added to cow milk products free of this compound: soft white cheese and UHT skim milk
(Jaubert and Gaborit 1997, unpublished data). The required concentration to obtain a score
of 5/10 for goat flavour (sensory analysis carried out with a trained panel) varied from about
1 ppm in skimmed milk to more than 10 ppm in soft white cheese with 40% fat in dry matter
(Figure 1).
3. Impact of cheese making parameters
In milk and dairy products, fatty acids are included in triacyglycerol molecules; the main condition
for flavour perception is the release of these fatty acids from the triacyglycerol molecule by the
lipases. It can be either lipase from milk (LPL) or from microorganisms. Their activities vary
according to physiological stage, genetic, sanitary status, etc… and can be amplified by milk
processing (homogenisation, cold storage…). Concerning cheeses, lipase activity is attributed
mainly to the surface mold and yeast ripening strains, especially for the French soft surface
mold ripened cheeses. The main ripening strains encountered on French soft cheeses made with
goat milk are yeasts, Geotrichum candidum and Penicillium. The specific lipolytic behaviour of
ripening strains and the predominant role for goat flavour development of G candidum in ripened
goat cheeses in comparison to Penicillium camemberti was shown [3] (Figure 2), by specifically
releasing 4 ethyl octanoic acid (more than 0,25‰ of free fatty acids for G. candidum against
about 0,15‰ for P camemberti).
The analysis of the free fatty acids [4] showed that goat flavour intensity was directly
correlated to the concentration of 4 ethyl octanoïc acid up to a level of lipolysis 10 g Oleic Acid
per 100 g Fat, equivalent to a concentration of total free fatty acids of 20 g/kg (Figure 3). Beyond
this threshold, defects occurred such as rancid-lipolysed flavour at the expense of goat flavour.
The expression of the aromatic potential of these ripening strains also depends on technological
conditions of manufacture such as moisture of non fat cheese [3] and therefore on the type of
cheese, lactic cheese or camembert type cheese (Figure 2).
0
1
2
3
4
5
6
7
8
9
0 0,1 1 10
Goat Flavour
(score/10)
4 ethyl C8 (ppm)
Soft white cheese (40% fat/ dry matter) UHT skim milk
Perception thresholds
for milk
for cheese
Figure 1. Perception levels in milk products according to Jaubert and Gaborit (unpublished)](https://image.slidesharecdn.com/sissue012012finalcat-140620033827-phpapp01/85/S-issue-01_2012_finalcat-149-320.jpg)
![145
Special Issue of the International Dairy Federation 1201 IDF International Symposium on
Sheep, Goat and other non-Cow Milk
4. Origin of 4 ethyl octanoic acid
Finally, with the aim of better understanding and controlling goat flavour, the total content of 4
ethyl C8 acid present in goat milk was recently studied by Actilait. The minimum values were
observed at the beginning of lactation (Figure 4) whatever the goat feed (Dehydrated Hay, Corn
Silage or Pasture). These data complete those of Lamberet et al. [5] who also studied levels
of total 4 ethyl octanoic acid in goat milks, not according to the lactation stage but according
to the alpha s1-casein genotype (0.019 % and 0.015 % of 4 ethylC8 for FF and AA genotypes
respectively).
r = -0,7
0.0
0.1
0.2
0.3
0.4
0.5
0.6
0.0 10.0 20.0 30.0 40.0 50.0
Total FFA (g/kg)
Rancid- lipolysed
Goat flavour
4-Ethyl C8 (%FFA)
Figure 3. Influence of the proportion of free 4 ethyl C8 acid on the sensorial characteristics of
cheeses
0
1
2
3
4
5
PC GC PC + GC PC GC GC + PC
Lactic cheese Camembert type cheese
Geotrichum
Gc
Penicillium
Pc
Sensorial
score/10
Goat Odour
Goat Flavour
Pungent
Soap
Figure 2. Influence of the cheese making (lactic or camembert type cheese) and ripening strains
(Penicillium camemberti and Geotrichum candidum) on the sensorial characteristics of cheeses](https://image.slidesharecdn.com/sissue012012finalcat-140620033827-phpapp01/85/S-issue-01_2012_finalcat-150-320.jpg)

![147
Special Issue of the International Dairy Federation 1201 IDF International Symposium on
Sheep, Goat and other non-Cow Milk
4.2. (S4.2) Study of Sensorial Characteristics of Ripening
Strain on a New Edible Goat Milk Model Cheese
P. Gaborit1, K. Raynal-Ljutovac1
Abstract
The flavor of soft surface-ripened goat milk cheeses is related to the activity of ripening strains.
In order to evaluate rapidly, effectively and without significant cost the aromatic potential
of ripening strains an edible experimental lactic cheese was set up, taking into account goat
cheese specificities (goat milkfat and lactic technology),. Lactic curd, prepared with standardized
pasteurized goat milk, was frozen or freeze dried and stored at -20°C. Frozen, reconstituted
freeze dried curd and fresh control curds were ripened with Penicillium or Geotrichum, with or
without yeasts, in Petri dishes at 12°C (= model cheeses) and compared to classical cheeses.
Model cheeses enabled a ripening process twice as fast as that observed during cheese making
with similar biochemical (proteolysis and lipolysis) and sensory patterns. A rapid screening of
genus, species and strains specificities was possible, especially concerning goaty descriptors but
also yeast and mould morphology in the mature cheese.
1. Introduction
Flavor of soft surface-ripened goat milk cheeses is mainly linked to the activity of their ripening
strains. Many models, based on cow milk components, have been used or developed to study
strains or specific compounds [1-4] but these models do not meet our requirements in respect
to goat milkfat in the raw material, lactic cheese composition and edible product. Therefore, in
order to evaluate rapidly, effectively and with minimal costs the aromatic potential of ripening
strains, an edible experimental lactic cheese was set up.
2. Material and methods
After lactic coagulation of standardised pasteurized bulk goat milk, curd was either frozen or
freeze dried and then stored at -20°C. The model cheese, made with frozen curd or reconsti-
tuted from freeze dried curd to get the same characteristics as the control (43% dry matter for
fresh curd) and all were salted at 1.3 %. Model cheeses inoculated with ripening strains were
poured into large Petri dishes (140 mm diameter with a non hermetical lid) and ripened at
12°C (Figure 1). All the trials were compared to classic lactic buchette-type (small log-shaped)
cheeses ripened with the same strains. The strains used in the study were commercial strains
of Geotrichum candidum (Gc), Penicillium camemberti (Pc), Debaryomyces hansenii (Dh) and
Kluyveromyces lactis (Kl). At this stage only mixtures (two strains) were studied that are related
to the cheese making process:
2 cocktails with Pc as the main strain (Pc at 2 doses/ 100 kg of curd + Gc at 1 dose/ 100 kg of
curd): PC Neige + GEO17 and PC02 + GCM33 (Choozit - Danisco, Dangé St Romain, France)
2 cocktails with Gc as the main strain (Gc at 2 doses/ 100kg of curd + yeast at 1 dose/ 100
kg of curd): GCD (Cargill, La Ferté-sous-Jouarre, France) + DhR (Cargill) and GEO18 (Danisco)
+ KL71 (Danisco).
The ripening tests made on reconstituted model cheeses, including visual development,
sensorial analysis, microbiological and biochemical characterisations were conducted on curds
stored 0, 1, 3, 6 and 9 months at -20°C.
Total solids (TS) were assessed [5]. Total nitrogen (TN), non casein nitrogen (NCN) and
Non Protein Nitrogen (NPN) were prepared according to [6] and analysed according to Kjeldhal
1 Actilait, avenue François Mitterrand, Surgères, France (k.raynal@actilait.com).](https://image.slidesharecdn.com/sissue012012finalcat-140620033827-phpapp01/85/S-issue-01_2012_finalcat-152-320.jpg)
![148
Special Issue of the International Dairy Federation 1201 IDF International Symposium on
Sheep, Goat and other non-Cow Milk
method. Fat was measured according to [7] and lipolysis according to a procedure adapted from
[8]. pH was also measured.
The total bacteria [9] and yeast and moulds [10] were assessed. The absence of the main
pathogens E. coli, L. monocytogenes, Salmonella and S. aureus was checked before each
sensorial analysis.
Sensorial analysis was performed with 12 trained panelists of the sensorial department of
ENILIA (Surgères, France), specialised for goat milks products, who evaluated the samples
according to [11].
3. Results and discussion
Lipolysis and proteolysis levels observed for fresh curd and stored frozen and freeze dried curds
indicated a faster expression of enzymatic potential of the surface ripening strains on the model
cheese, compared to a classical buchette-type lactic cheese making. Actually, at 12 and 26 days
after the inoculation of ripening strains, the proteolysis and lipolysis levels of the model cheese
corresponded to those observed in ½ shelf life cheeses (about 20-25 days after inoculation =
average consumption stage) and at the end of cheese shelf-life (40-45 days after inoculation),
respectively. For instance, average lipolysis levels were about 5,5 g oleic acid/ 100 g fat for both
Geotrichum candidum strains grown 12 days on freeze dried curd (whatever the cold storage time
before use) and Gc grown 20 days on buchette-type cheese. The early expression of the ripening
strains can be related to a large contact area of the ripening strain surface with its substrate in
the Petri dish and to the very low dehydration throughout the ripening (very low increase in dry
matter, data not shown).
For each cocktail of strains, the overall intensities of odor and flavor were very similar for
all the tested curds, either cold stored or fresh curd. As for the biochemical characteristics, the
intensities of odor and flavor descriptors at day 12 and 26 were close to those of a ½ shelf life
(Figure 2) and an end-shelf life cheese respectively.
A significant differentiation was observed not only between genera but also between strains
of ripening microorganisms, concerning both expression of their potential enzymatic proteolysis
and lipolysis and their sensory specificities (Figure 3). For example, G2 strain specifically
released more free 4-ethyl octanoïc acid (0,14 ‰ of total free fatty acids) than G1 (0,03 ‰).
This was related to the sensory profile meaning a higher intensity of the goaty descriptors
for G2.
P.camemberti
Figure 1. Example of model cheese in Petri dish (140 mm diameter) ripened with Penicillium
camemberti](https://image.slidesharecdn.com/sissue012012finalcat-140620033827-phpapp01/85/S-issue-01_2012_finalcat-153-320.jpg)

![150
Special Issue of the International Dairy Federation 1201 IDF International Symposium on
Sheep, Goat and other non-Cow Milk
4. Conclusion
Owing to this innovative work in goat milk cheese field, surface ripening strains can be rapidly
evaluated for their flavour and odour but also for the yeast and mould morphology in the ripened
lactic goat milk cheeses. Depending on the ripening time, the model cheese may also amplify
the sensory characteristics of the strains, which enable the anticipation of their behaviour when
technological parameters are changed (ripening temperature, dry matter and salt content). This
model could be appropriate for the screening of strains that are not used nowadays but which
could be of technological interest.
Acknowledgements
The authors wish to thank DRAAF (French Regional Direction of Agriculture and Forest of Poitou
Charentes) for its financial support, the dairies for their participation to the sensorial evaluations
and milk supply but also the ripening strain producers for the supply of the micro organisms
(Cargill, Danisco).
References
1. Salles, C., Dalmas, S., Septier, C., Issanchou, S., Noël, Y., Etievant, P. & Le Quere, J.L.
Production of a cheese model for sensory evaluation of flavour compounds. Lait 75:535-549
(1995).
2. Molimard, P., Berger, C., Martin, N., Dreyfuss, A., Brousse, M. & Spinnler, H.E. Propriétés
aromatiques de diverses souches de Geotrichum candidum en milieu fromager. 5eme congrès
de la société française de microbiologie, 27-29 avril 1998. Lille. France (1998).
3. Martin, N., Savonitto, S., Molimard, P., Berger, C., Brousse, M. & Spinnler, H.E. Flavor
generation in cheese curd by coculturing with selected yeast, mold, and bacteria. J. Dairy
Sci. 82:1072-1080 (1999).
4. Leclercq Perlat, M.N., Corrieu, G. & Spinnler, H.E. Comparison of volatile compounds
produced in model cheese medium deacidified by Debaryomyces hansenii or Kluyveromyces
marxianus. J. Dairy Sci. 87:154-1550 (2004).
5. ISO 5534:2004. Cheese and processed cheese. Determination of the total solids content
(Reference method). 16pp.
6. Gripon, J.C., Desmazeaud, M.J., Le Bars D. & Bergère, J.L. Etude du rôle des microorganismes
et des enzymes au cours de la maturation du fromage. II. Influence de la présure. (Remise en
suspension du fromage. Dosage des différentes formes d'azote). Lait 548:502-516 (1975).
7. Heiss, E. Versuche zur Bestimmung des Käsefettgehaltes mit Hilfe von Schnellmethoden.
[Studies on the determination of fat matter in cheeses by rapid methods]. Dtsch. Molk. Zeit.
82:67-70 (1961).
8. International Dairy Federation. Determination of free fatty acids in milk and milk products.
IDF Bull. n° 265. International Dairy Federation, Brussels (1991).
9. International Dairy Federation. Milk and milk products: enumeration of microorganisms. IDF
standard 100B. International Dairy Federation, Brussels (1991).
10. ISO 6611: 2004 Milk and milk products. Enumeration of colony-forming units of yeasts and/
or moulds. Colony-count technique at 25°C (2004)
11. Gaborit, P., Menard, A. & Morgan, F. Impact of ripening strains on the typical flavour of goat
cheeses. Int. Dairy J. 11:315-325 (2001).](https://image.slidesharecdn.com/sissue012012finalcat-140620033827-phpapp01/85/S-issue-01_2012_finalcat-155-320.jpg)
![151
Special Issue of the International Dairy Federation 1201 IDF International Symposium on
Sheep, Goat and other non-Cow Milk
4.3. (S4.6) The Nutritional Value of Trahanas : A Fermented
Milk-Cereal Traditional Greek Food
A. Georgala1, E. Anastasaki1, D. Xitos1, D. Kapogiannis1, T. Malouxos2, T. Massouras1,
I. Kandarakis+1
Summary
Trahanas is one of the most popular fermented milk-cereal products in Greece which is produced
during summer mainly from whole fresh ewes’, goats’ milk or a mixture of them. Acidified (sour)
milk or sweet milk is used and the final products are called sour or sweet trahanas, respectively.
Sometimes instead of milk a pulp of vegetables is used and the product is called nistisimos
trahanas.
40 trahanas samples were examined for their gross composition, fatty acid and mineral
composition. The most significant differences were found to be in the amount of total saturated
fatty acids (TSFAs) and total unsaturated fatty acids (TUFAs) and the mineral calcium.
1. Introduction
Traditional dried fermented milk/cereal foods are widely used in the diet of people in the
Middle East, Asia, Africa and some parts of Europe. These products have high nutritive value
and interesting organoleptic characteristics. There are similar products with different names
such as ‘Kishk’ in Egypt, Syria, Lebanon and Jordan, ‘Kushuk’ in Iraq, ‘Tarhana’ in Turkey,
‘Trahanas’ in Cyprus and Greece, ‘Tarhonya/Talkuna’ in Hungary and Finland [1, 3, 4]. Trahanas
is one of the most popular fermented milk-cereal products of Greece which is produced during
summer mainly from whole fresh ewes’, goats’ milk or a mixture of them. Sometimes instead
of milk a pulp of vegetables is used and the product taken is called nistisimos trahanas. For the
production of trahanas fresh milk is allowed to be acidified for some days either spontaneously
or by adding a culture of yoghurt. It is stirred every day until it reaches the desired acidity.
Then it is heated and some ground wheat and salt are added gradually. The mixture is heated
thereafter to the boiling point and cooled down. The paste taken is cut in finger sized pieces and
subsequently sun-dried. When it is dry enough, it is stored in a cool place. Sometimes instead
of sour milk, sweet milk is used for the production of sweet trahana [1, 3, 5]. In this study the
gross, fatty acid and mineral composition of 40 trahanas samples was studied.
2. Materials and Methods
40 trahanas samples purchased from local market, dairy companies or home made were studied.
The methods used were : 1. Moisture content : drying of samples at 105°C for 24 h. 2. Ash
content : samples were ashed at 550 ± 5°C for 6 hours. 3. Total crude fat content : Soxhlet
method. 4. Salt content : BSI method [2]. 5. Dietary fiber : Fibertec System. 6. Protein content
: Kjeldhal method. 7. Fatty acid content : Gas chromatography (GC) after methylation of the
lipid extraction taken by the Sohxlet method. 8. Minerals : in ash using atomic absorption.
3. Results and Discussion
The mean composition of ‘nistisimos’ trahanas was: moisture 11.1, total solids 88.9, total
carbohydrates 70.5 g/100g product, protein 11.9, fat 2.9, dietary fiber 1.4, ash 2.5, salt 1.6
1 Laboratory of Dairy Science and Technology, Department of Food Science and Technology, Agricultural University
of Athens, Greece (georgala@aua.gr).
2 Laboratory of Food Chemistry, Department of Food Science and Technology, Agricultural University of Athens,
Greece.](https://image.slidesharecdn.com/sissue012012finalcat-140620033827-phpapp01/85/S-issue-01_2012_finalcat-156-320.jpg)


![154
Special Issue of the International Dairy Federation 1201 IDF International Symposium on
Sheep, Goat and other non-Cow Milk
4.4. (S4.10) Enhancing Proteolytic Activity, Nutritional and
Physiological Benefits of Caprine Yogurt
D.M. Beshkova1, E.D. Simova2, Zh.P. Dimitrov3, Zh.I. Simov2
Summary
The proteolytic systems play an essential role in nitrogen metabolism of lactic acid bacteria in
milk. A novel approach for enhancing the nutritional and physiological benefits of caprine yogurt
involves effective use of the proteolytic potential of the Lactobacillus bulgaricus by including in
the fermentation process a probiotic and bacteriocinogenic culture with high lytic effect against
the starter proteolytic. The strain Lactobacillus bulgaricus P1 had a highly developed proteolytic
system – a broad spectrum of strong amino-, di- and tripepsidases, oligopeptidase and strong
proline-specific peptidases. Co-cultivation of a yogurt culture with a probiotic bacteriocinogenic
culture in caprine milk offers a possibility of producing alternative probiotic yogurt.
1. Introduction
Caprine milk is beneficial to health, however, its physico-chemical properties are not fully
exploited for manufacturing foods with enhanced nutritional and medicinal properties. The
nutritional advantages of caprine milk over cow’s and sheep’s milk are due to the specificity and
higher level of short-chain fatty acids within the lipids. Caprine milk contains higher levels of
caproic, caprylic, capric, medium chain fatty acids and medium chain triglycerides that could be
used to treat some metabolic disorders [1].
Caprine milk proteins are also more easily digestible, and the released amino acids are
absorbed more efficiently than those from cows' milk. The anti-allergic properties of caprine
milk are due to the inability of milk proteins to pass through the walls of the digestive tract in
native and undigested state. Because of this property, caprine milk can be used as an alternative
therapeutic food in the diet of people suffering from allergies to cow's milk and also in patients
with ulcers and ulcerative colitis. [2, 3].
The use of caprine milk for fermented dairy products by combining selected starter cultures
with active peptidase systems, able to produce antimicrobial substances, is an innovative direction
in the production of new products.
Here we report on enhancing the proteolytic activity and the nutritional composition of
fermented caprine milk. Our goal is to improve proteolysis in caprine milk by the lytic action of
bacteriocinogenic strain Lactobacillus delbrueckii ssp. bulgaricus BB18 on the proteolytic strain
Lactobacillus delbrueckii ssp. bulgaricus P1.
2. Material and methods
Samples of goat milk were collected from 3 goat herds in an ecological region in Rodophi
Mountains.
The strains Lactobacillus bulgaricus P1 (Lb. bulgaricus P1), and Streptococcus thermophilus
ТЕР4 (S. thermophilus TEP4) have been isolated from authentic home made fermented milks,
produced in ecological regions in Rodophi Mountains, and the strain Lactobacillus bulgaricus
BB18 (Lb. bulgaricus BB18) isolated from kefir grains. Strain Lb. bulgaricus P1 shows strong
intracellular peptidase activities [4]. Strain Lb. bulgaricus BB18 is an active producer of bacte-
riocins [5].
1 The Stephan Angeloff Institute of Microbiology, Department of Applied Microbiology, Laboratory of Applied
Biotechnology, Bulgarian Academy of Sciences, 139 Ruski Blvd., 4000 Plovdiv, Bulgaria (beshkova@yahoo.com).
2 University of Food Technologies, Department of Technology of Milk and Milk Products, 26 Maritza Blvd., 4002
Plovdiv, Bulgaria.
3 "LB Bulgaricum", Research and Development Center, 12A Malashevska str., 1225 Sofia, Bulgaria.](https://image.slidesharecdn.com/sissue012012finalcat-140620033827-phpapp01/85/S-issue-01_2012_finalcat-159-320.jpg)
![155
Special Issue of the International Dairy Federation 1201 IDF International Symposium on
Sheep, Goat and other non-Cow Milk
Each strain in the bacterial starter was cultivated in autoclaved caprine milk, inoculated with
1% of each single-strain culture. The cultures were incubated until coagulation of milk at 37 °C
as follows: S. thermophilus TEP4 for 4.5 h; Lb. bulgaricus P1 for 5.5 h; Lb. bulgaricus BB18 at
37 °C for 9 h;
The yogurt starters were prepared as follows: Starter 1 (for yogurt 1) — A 2% (v/v) individual
inoculum of yogurt strains Lb. bulgaricus P1 + S. thermophilus TEP4 (1:1 v/v) was inoculated
in autoclaved (115 °C for 15 min) caprine milk and incubated at 37 °C for 5.5 h; Starter
2 (for yogurt 2) — the autoclaved caprine milk was inoculated with 2% (v/v) of individual
strains Lb. bulgaricus P1 + S. thermophilus TEP4 + Lb. bulgaricus BB18 in ratio 1:3:1 (v/v/v)
and incubated at 37 °C for 9 h.
Yogurt 1 and yogurt 2 were cultivated in a 6 litre MBR bioreactor (MBR AG Ltd, Zurich,
Switzerland) with repeated agitation, without oxygen, to pH 5.1 for 5.5 h and 9 h, respectively,
portioned in sterile packages for yogurt and after that stored at 6 °C about 168 h.
All methodology for determination of specific hydrolase activities was described by Simova
& Beshkova [4].
All the experiments were carried out in three independent experiments and the results are
shown as mean ± SD. Statistical analysis was undertaken using the software SigmaPlot 2001.
3. Results and discussion
The intracellular peptidases present in Lb. bulgaricus P1 and S. thermophilus TEP4 are presented
in Table 1. It was found that the growth phase significantly (P <0.05) affects the peptidase
activities in cell free extracts of Lb. bulgaricus P1 and S. thermophilus TEP4. The highest activities
were recorded when the cells were harvested at the end of the late log phase of both strains
(Table 1).
The results point to a highly complex peptidase system of Lb. bulgaricus P1, including high
total aminopeptidase activity with significant specificity to substrates containing Lis, Leu and
Arg; strong dipeptidases (Leu-Tyr, Leu-Gly, Leu-Leu and Ala-His); strong proline-specific peptidases
(PepX-X-prolyl-dipeptidyl aminopeptidase, PepI, PepQ-prolidase and Pro-Ile hydrolase).
S. thermophilus TEP4 had significantly lower aminopeptidases, dipeptidases and proline-specific
peptidases (Table 1) than those of Lb. bulgaricus P1. The most remarkable difference between
the specific peptidase activities of both strains was found in the hydrolysis of the Glu-Glu
substrate. It is probably the glutamyl-aminopeptidase (RerA) that is responsible for this activity
of S. thermophilus TEP4. This enzyme is probably less present in the cells of Lb. bulgaricus P1.
In the cell-free extracts of both strains, there was oligopeptidase (PepF) able to hydrolyse
the long peptide bradykinin. The Pro7-Phe8 bond in bradykinin was efficiently hydrolysed by the
oligopeptidase of Lb. bulgaricus P1, which indicates the activity of this enzyme in hydrolysing
prolyl peptide bonds. The oligopeptidase of S. thermophilus TEP4 has about 3.5 times weaker
activity than that of Lb. bulgaricus P1 (Table 1).
The bacteriocinogenic strain Lb. bulgaricus BB18 showed the presence of peptidases with a
significantly lower peptidase activity than that of Lb. bulgaricus P1 (data not presented). The
aminopeptidases of Lb. bulgaricus BB18 showed no capacity for active hydrolysis of substrates.
The dipeptidases showed 2-4 times lower activity, and the proline-specific peptidases PepI,
PepX, PepQ and Pro-Ile hydrolase revealed about 1.5-3 times lower hydrolase activity than that
of Lb. bulgaricus P1.
The results suggest that during the fermentation starter culture 2 actively uses the amino
acids released from Lb. bulgaricus P1 + Lb. bulgaricus BB18 for growth and accumulation of
cell mass (data not presented). During fermentation until coagulation of milk in yogurt 2 the
accumulated free amino acids were around 3.6 times more. The bacteriocins produced during
fermentation provoked the lysis of the Lb. bulgaricus P1 cells and supported the natural cell
lysis, occurring mainly during cooling. Thus, the lytic effect of bacteriocin BB18 raised the level
of free amino acids in the yoghurt until the beginning of cooling. The lysis of the Lb. bulgaricus
P1 cells and the release of free amino acids continued during the cooling after 24 h up to 168
h (data not presented).](https://image.slidesharecdn.com/sissue012012finalcat-140620033827-phpapp01/85/S-issue-01_2012_finalcat-160-320.jpg)

![157
Special Issue of the International Dairy Federation 1201 IDF International Symposium on
Sheep, Goat and other non-Cow Milk
4.5. (S4.11) Biochemical Characteristics of Yogurt Beverage
From Donkey Milk
Ch. Salakidou1, Zh. Simov1, D. Beshkova2, Zh. Dimitrov3, E. Simova1, K. Yoanidou1
Summary
Donkey milk was supplied from the region of Northern Greece. The yogurt beverage was
obtained by a technology developed by the research team, using a symbiotic starter culture
for Bulgarian yogurt from selected probiotic strains of Lactobacillus delbrueckii ssp. bulgaricus
BB18 and Streptococcus thermophilus. The beverage was stored for 15 days at +4 °С – +6 °С.
The biotransformation of casein and milk fat was studied during refrigerated storage of the yogurt
beverage by determining the free amino acids, peptide fractions and content of fatty acids.
During refrigerated storage, the content of free amino acids in the yogurt beverage increased
to 632.50 mg.kg-1 on day 15. A significant increase was found in the proportion of hydrophilic
peptides – up to 59.9% on day 15. The yogurt beverage from donkey milk is characterized by
higher biological value, and high concentrations of monounsaturated and polyunsaturated fatty
acids.
1. Introduction
In recent years there has been a growing interest in donkey milk due to the fact that its composition
is similar to that of breast milk [1]. Donkey milk can be used as a good substitute for cow's milk
for infants and children with severe allergy to cow’s milk proteins [2].
According to Guo et al. [3], donkey milk is poor in proteins and milk fat, but rich in lactose,
making it closer to breast milk and mare's milk. It is characterized as albumin milk with low
casein content and a higher content of whey proteins, β-LG and lysozyme. Donkey milk contains
higher levels of the eight essential amino acids, higher levels of Ser, Glu, Arg and Val, and lower
levels of Cys. Because of that composition, donkey milk exhibits unique nutritional character-
istics and can be potentially used as a new dietary and functional substitute for breast milk.
Pediatric studies point to an increased interest in the consumption of donkey milk in the form of
various dairy products, mainly fermented probiotic milks [4].
The purpose of this study was based on our preliminary studies on the composition and
technological properties of donkey milk in the region of northern Greece, aimed to obtain a
yogurt beverage using symbiotic starter cultures for Bulgarian yogurt from a selected probiotic
strain Lb. bulgaricus BB18 and S. thermophilus, and to trace the biochemical characteristics of
the beverage by determining the fatty acid composition and the products of biotransformation
of casein during cold storage of the yogurt beverage.
2. Materials and methods
In laboratory tests, donkey milk produced in the region of Northern Greece was used with the
following chemical composition (g l-1): total protein - 17.8, including casein -7.4, whey proteins
- 10.4 solids - 89.8, milkfat - 5.6 lactose - 68.0, ash - 3.5, pH- 7.03.
A starter culture for Bulgarian yoghurt was used, consisting of Lb. bulgaricus BB18 and S.
thermophilus. Strain Lb. bulgaricus BB18 was isolated from kefir grain [5]. It has a high and
broad antimicrobial activity against pathogens [5].
1 University of Food Technologies, Department of Technology of Milk and Milk Products, 26, Maritza Blvd., 4002
Plovdiv, Bulgaria.
2 The Stephan Angeloff Institute of Microbiology, Department of Applied Microbiology, Bulgarian Academy of
Sciences, 26 “Acad. G. Bonchev” str., 1113 Sofia, Bulgaria, (beshkova@yahoo.com).
3 "LB Bulgaricum", Research and Development Center, 12A Malashevska str., 1225 Sofia, Bulgaria.](https://image.slidesharecdn.com/sissue012012finalcat-140620033827-phpapp01/85/S-issue-01_2012_finalcat-162-320.jpg)
![158
Special Issue of the International Dairy Federation 1201 IDF International Symposium on
Sheep, Goat and other non-Cow Milk
Milk in a quantity of 1 l was pasteurized at 68 °C for 5 min. After cooling to 42 °C, it was
portioned into 100 ml in 200 ml sterile containers and inoculated with the liquid symbiotic starter
culture in a quantity of 40 g l-1. The fermentation was conducted at 42 °C until pH 4.6 was
reached. After coagulation at pH 4.6, the resulting coagulum was stirred very well and cooled
to 6 °C. At this temperature the yogurt beverage was stored for 15 days.
The content of free amino acids was determined by the Pico Taq method (Millipore, USA) with
a HPLC system (Water Corp., Milford, MA, USA), described by Cohen et al. [6].
Peptide fractions were analyzed using a ProSphere C18 column, absorbance at 210 nm.
The fatty acid composition was analyzed on a gas chromatography column (Shimadzu GC
17A, Japan) using a capillary gas chromatography column (Bp-1.30 m and 0.32 mm).
Three independent experiments were carried out and the results are shown as mean ± SD.
The statistical analysis was undertaken using the software SigmaPlot 2001.
3. Results and discussion
The physicochemical composition of the yogurt beverage from donkey milk is as follows (g kg-1):
solids, 90.1±0.29; proteins, 18.0±0.22; milkfat, 6.0±0.12; lactose, 62.5±0.58; ash, 3.8 ±0.18;
pH - 4.61±0.05.
The concentration of free amino acids of the yogurt beverage from donkey milk is shown in
Table 1.
Table 1: Content of free amino acids (mg kg-1) in yogurt beverage from donkey milk during
refrigerated storage at 6 °C
Amino acids,
mg kg-1
Refrigerated storage, d
1 5 15
Asp 18.3±7.93 21.6±5.61 13.2±4.77
Glu 23.5±1.97 33.4±1.08 39.5±1.85
Asn 9.4±0.27 14.1±0.19 12.3±0.08
Ser 51.2±1.01 64.6±1.13 69.8±1.20
Gln 30.3±1.1 40.3±0.93 45.3±3.63
Gly 8.5±0.38 15.0±6.93 12.4±3.4
His 11.4±3.57 19.1±4.77 35.0±3.54
Arg 29.8±21.04 38.6±26.07 47.1±12.63
Thr 13.2±9.93 18.7±7.05 14.3±4.77
Ala 12.1±4.77 16.4±6.89 24.3±8.77
Pro 38.7±26.77 40.8±11.56 45.9±27.07
Tyr 12.5±5.83 18.5±6.29 27.4±11.76
Val 20.3±5.62 24.1±9.46 32.1±10.31
Met 3.2±4.20 6.5±4.45 28.0±5.62
Cys 1.2±1.53 2.3±2.97 3.8±3.70
Ile 23.5±5.62 27.9±5.86 32.2±21.04
Leu 30.1±20.10 39.7±15.56 63.5±35.01
Phe 18.9±8.82 25.6±7.30 45.1±35.29
Trp 3.6±3.65 7.2±9.24 9.1±2.93
Lys 14.5±1.86 26.8±5.01 42.2±13.92
Total 374.3±53.17 501.2±37.23 632.5±64.33](https://image.slidesharecdn.com/sissue012012finalcat-140620033827-phpapp01/85/S-issue-01_2012_finalcat-163-320.jpg)


![161
Special Issue of the International Dairy Federation 1201 IDF International Symposium on
Sheep, Goat and other non-Cow Milk
4.6. (S4.27) Temporal Variations of Conjugated Linoleic Acid
(Cla) in Goat’s Milk
D. Cattaneo1, M. Ferroni1, F. Caprino1, V. Moretti1, A. Agazzi1, G. Savoini1
Summary
Diet is the most significant factor affecting the quality of ruminant milk fat and the content of
beneficial fatty acids (FA) such as conjugated linoleic acid (CLA). However, other physiological
factors, such as stage of lactation, that may significantly affect milk CLA content, have not been
extensively investigated yet. The aim of this study was to evaluate temporal changes as lactation
progresses of milk FA profile and CLA content of dairy goats fed a constant diet. Individual milk
samples were collected at 60, 90, 120, 150 and 180 d of lactation from seven second parity
Saanen dairy goats fed the same conventional diet throughout the duration of the trial. Milk fat
cis-9, trans-11 CLA (rumenic acid; RA) increased by 61.3% as lactation progressed from 60 to
180 days. Milk trans-11 C18:1, the mammary precursor of RA, did not vary significantly while
cis-9, cis-12 C18:2, the ruminal precursor of RA, increased with progressing lactation.
1. Introduction
A number of studies have investigated the effects of nutrition on the concentration of the cis-9,
trans-11 CLA isomer (rumenic acid, RA) in ruminant milk, but very limited information is available
on the effects of other factors that may affect milk CLA content, such as stage of lactation.
Previous studies [1] with Saanen and Alpine goats fed the same conventional diet showed a
significant increase in milk fat cis-9, trans-11 CLA (averaging 0.56 g/100 g FA methyl esters),
by 62% and by 76% respectively, as lactation progressed. Similar temporal changes have been
confirmed in studies on sheep [2, 3] and were observed also in dairy cows [4, 5]. The variation
in milk CLA content observed has been suggested to be a possible result of changes in stearoyl-
CoA desaturase (SCD) activity in the mammary gland, responsible for the synthesis of most of
the cis-9, trans-11 CLA from its precursor vaccenic acid (VA) (trans -11 C 18:1) and of several
MUFA (monounsaturated FA) from their saturated FA (fatty acids) counterparts.
The aim of this study was to evaluate temporal changes in milk fatty acid profile and CLA
content and of various desaturase indices in dairy goats fed the same constant diet , during 4
months of lactation.
2. Material and methods
Seven second parity Saanen dairy goats, reared at the goat farm G.P. G. Cavalchini of the
University of Milan, were used to determine differences in milk FA as lactation progressed from
60 to 180 days. Goats were housed in a free stall and fed the same total mixed ration for the
entire period (table 1). Individual milk samples were collected at 60, 90, 120, 150 and 180 d of
lactation. For FA analysis, total lipids were extracted from milk samples using a modified Folch
procedure [6]. FAME (FA methyl esters) were prepared using sodium methoxide in methanol [7]
and were separated by an automated gas chromatograph (GC autosystem XL, Perkin Elmer),
equipped with a 100-m fused silica capillary column (0.25 mm i.d.) coated with 0.25 μm of
CP-Sil 88 phase (Chrompack, Middelburg, The Netherlands). Desaturase indices (C14I, C16I,
C18I and CLAI) were used as a proxy for SCD activity and were determined as follows: [product
of SCD] / [product of SCD + substrate of SCD] for each FA pair and multiplied by 100 [8] . Data
of milk FA composition and desaturase indices were analysed statistically as repeated measures
by GLM of SAS [9].
1 Dipartimento di Scienze e Tecnologie Veterinarie per la Sicurezza Alimentare, Università degli Studi di Milano -
Via Trentacoste 2, 20134 Milano, Italy. (donata.cattaneo@unimi.it)](https://image.slidesharecdn.com/sissue012012finalcat-140620033827-phpapp01/85/S-issue-01_2012_finalcat-166-320.jpg)
![162
Special Issue of the International Dairy Federation 1201 IDF International Symposium on
Sheep, Goat and other non-Cow Milk
3. Results and discussion
Temporal changes in milk FA profile occurred during lactation of dairy goats fed the same
constant diet and are reported in table 2. Proportions (g/100 g FAME) of several de novo FA
increased (P<0.05) as lactation progressed (C12:0 4.23 vs 5.81; C14:0 9.49 vs 11.92; C15:0
0.8 vs 1.22, respectively at 60 and 150 days) while the proportion of stearic acid decreased
(P<0.01), averaging 14.06 and 9.64 g/100 g FAME, respectively at 60 and 180 days.
Milk fat cis-9, trans-11 CLA increased by 61.3% as lactation progressed from 60 to 180 days
(0.62 vs 1 g/100 g FAME, P<0.05) in agreement with our previous results with different breeds
of goats [1] . Milk trans-11 C18:1 (vaccenic acid), the mammary precursor of cis-9, trans-11
CLA, in the present study did not vary significantly during lactation, while cis-9, cis-12 C18:2
(linoleic acid), the ruminal precursor of cis-9, trans-11 CLA, increased with progressing lactation
(3.46 vs 4.66 g/100 g FAME, respectively at 60 and 150 days, P<0.05).
Temporal changes in desaturase indices, which represent an estimation of SCD activity,
occurred only for C18 index, which was higher at 180 day than at 60 days (70.03 vs 60.55,
P<0.01)
Table 1: Ingredients (DM basis) and fatty acid profile of the diet
Ingredients (% DM)
Alfalfa hay 36.00
Beetpulp dry 14.80
Triticale silage 13.60
Corn 10.00
Wheat bran and cereal by-products 8.00
Barley 5.72
Field bean 4.60
Sunflower meal 3.75
Alfalfa meal 2.00
Molasses 0.88
Mineral premix 0.65
Fatty acid profile (% total FA)
C12 0.15
C14 0.40
C16 17.75
C16:1 0.20
C18 3.35
C18:1, cis - 9 30.75
C18:2, cis-9, cis-12 36.05
C18:3, cis-9, cis-12, cis-15 8.20](https://image.slidesharecdn.com/sissue012012finalcat-140620033827-phpapp01/85/S-issue-01_2012_finalcat-167-320.jpg)


![165
Special Issue of the International Dairy Federation 1201 IDF International Symposium on
Sheep, Goat and other non-Cow Milk
4.7. (S4.28) Fatty Acid Profile of Sarda and Maltese Goat
Milk
D. Pittau1, A. Marras1, C. Scarano1, G. Moniello1, S. Banni2, P. Delmonte3, E. De Santis1
Summary
This study compared the fatty acid (FA) profile of milk produced by Sarda and Maltese goats. It
was carried out utilizing one group of 13 Maltese goats and one group of 13 Sarda goats in two
dairy farms (N=52). Individual milk samples were collected 4 times over one lactation period.
FA were analyzed by gas chromatography utilizing 100 m Supelco SLB-IL111 capillary column,
that provided the separation of most trans-fatty acids (t-FA) and conjugated linoleic acid (CLA)
isomers. For each goat breed we evaluated the milk fat content in saturated (SFA), monoun-
saturated (MUFA), polyunsaturated fatty acids (PUFA), plus the detailed composition in t-FA and
CLA isomers. The n-3 polyunsaturated fatty acid docosahexaenoic acid (C22:6, DHA) content
was higher in the milk of the Sarda breed while CLA, vaccenic acid (VA) and t-FA were higher in
the milk of the Maltese breed, suggesting the influence of breed on milk FA profile.
1. Introduction
Milk of small dairy ruminants was proven to have more beneficial effect on consumer’s health
than cow’s milk. In fact, human consumption of goat milk reduces total and LDL cholesterol
plasma levels due to its high content of medium chain fatty acids (MCFA) which decrease
cholesterol biosynthesis [1]. The high content of short chain fatty acids (SCFA), and of CLA,
plus the favorable n-6/n-3 ratio, provide goat milk with a distinct advantage for human nutrition
[2, 3]. The most abundant FAs in goat milk are 16:0, 18:1 n-9, 14:0 and 10:0 [4]. The lipid
content of milk from healthy animals varies widely among different species, within the same
species, and within breeds. The influence of breed on the Δ9-desaturase metabolic activity in
the mammary gland results in differences in the metabolism of lipids and milk FA composition
[5], especially for PUFA, 18:0 FA, and CLA.
Dairy and meat products from ruminants are a source of t-FAs [6]. The milk content in VA
and CLA, including rumenic acid (c9,t11-18:2), is of special interest because of the reported
beneficial physiological effects of these FAs [7]. The total trans MUFA (t-MUFA) content may
represent up to 23% of total milk fat, considering all the 16:1, 18:1, 20:1, 22:1 and 24:1 t-FA
isomers [8] that occur. The objective of the present study was to determine the influence of the
breed on the milk FA composition and metabolic index for the Sarda and Maltese goat breeds
farmed in Sardinia, under similar dietary conditions.
2. Materials and methods
Goat milk samples were collected from two dairy farms located in Sardinia. Thirteen Maltese
and thirteen Sarda goats from each farm were sampled 4 times in the period from January to
June. Samples were immediately cooled to 4 °C, transported to the laboratory within 12 hours,
and kept frozen at −20 °C until analysis. The total fat content of milk was measured by infrared
spectrometry using an Integrated Milk Testing Milkoscan FT 6000 (CombiFoss 6000 FC instrument,
Denmark) following the method in FIL-IDF 141C:2000 . Fatty acids were extracted from milk
samples applying a liquid/liquid extraction with chloroform–methanol–water, according to the
Bligh and Dyer method (with modifications) [9]. The FA methylation was obtained using sodium
1 Department of Animal Biology, University of Sassari, Italy (dpittau@uniss.it).
2 Department of Sperimental Biology, University of Cagliari, Italy.
3 Office of Regulatory Science, Center for Food Safety and Applied Nutrition, Food and Drug Administration, USA.](https://image.slidesharecdn.com/sissue012012finalcat-140620033827-phpapp01/85/S-issue-01_2012_finalcat-170-320.jpg)
![166
Special Issue of the International Dairy Federation 1201 IDF International Symposium on
Sheep, Goat and other non-Cow Milk
methoxide in methanol following the procedure described by Cruz-Hernandez et al. [10]. Gas
chromatographic separation of the FAs as fatty acid methyl esters (FAMEs) was achieved with
a Shimadzu GC-2010 gas chromatograph (Shimadzu Italia, Milano) equipped with a flame
ionization detector (FID), and a SLB-IL111 ionic liquid capillary column (100 m, 0.25 mm i.d.,
0.2 µm film thickness, Supelco, Bellefonte, PA) [11]. The oven temperature was set at 80 °C
for 2 min, then programmed at 15 °C/min to 162 °C, held constant per 18 min, raised at
5 °C/min to 186 °C and held constant 33 min. The injector was maintained at 250 °C and the
detector at 280 °C. The injection port was operated in split injection with 50:1 split ratio, and
typical injection volume was 1µL. The carrier gas was H2 at 1.36 ml/min, while the gases for the
detector were H2 at 30 ml/min, ultrapure air at 400 ml/min, and make-up gas N2 at 30 ml/min.
Tritridecanoin (13:0 triglyceride) was used as internal standard. Individual FA identification was
carried out by retention time comparison with available FA reference standards, and available lit-
erature. The FA content was expressed as mg per gram of milk fat. Each analysis was performed
in triplicate. Statistical analysis was performed using the general linear model (GLM) procedure
of Statgraphics Centurion XVI (StatPoint Technologies, Warrenton, VA, USA).
3. Results and discussion
The data presented in this study are the average of 4 independent samples, expressed as mg
per gram of fat. The milk fat content was higher for the Sarda goat breed (5.55 g per 100mL)
than for the Maltese (4.57 g per 100mL) (P <0.05). The major FA components were 16:0, c9-
18:1, 18:0, 10:0 and 14:0 (NS). Among PUFAs no significant difference was found between the
two breeds, except for the DHA content (P <0.05). The content of DHA, the n-3 fatty acid most
representative and concentrated in human tissues, and the metabolic index DHA/EPA (EPA,
eicosapentaenoic acid) were higher in milk of Sarda goat breed (P <0.05). The concentration
of DHA was respectively 0.51 mg per g in the Maltese milk fat and 0.63 mg per g in the Sarda
milk fat. The content of total CLA was higher (P <0.001) in Maltese goat milk (7.02 mg per g
of fat) compared to the one of Sarda goat milk (5.76 mg per g of fat). Among the CLA isomers
investigated, c9,t11–18:2, t10,t12-18:2 and t9,t11-18:2 were present in higher amounts in
the Maltese goat milk than in Sarda goat milk (P <0.05). The most abundant CLA isomer was
rumenic acid, c9,t11–18:2 with a content of 5.8 mg per g of milk fat for the Maltese breed and
4.8 mg per g for the Sarda breed. Other CLA isomers measured in the milk of both breeds were
t7,c9-18:2, t11,c13-18:2 and t9,c11-18:2. The content of t-FA was higher (P <0.01) in the milk
of the Maltese breed (44.32 mg per g of fat) than in the milk of Sarda breed (37.34 mg per g
of fat). The most abundant t-FA was VA with a content of 14.94 mg per g of fat for the Maltese
breed and 11.36 mg per g of fat for the Sarda, respectively (P <0.05). The other trans-18:1
FAs were found in greater amounts in the milk of the Maltese breed than in Sarda breed, and
consisted of t10-18:1, t13- and t14-18:1 (co-eluting), and t16-18:1 which co-elutes with c14-
18:1 (P <0.05). The trans-16:1 FAs were higher in the milk fat of the Maltese breed (P <0.01)
compared to Sarda; the sum of the trans-16:1 FAs was 5.04 mg per g of fat for the Maltese
breed, compared to 4.57 mg per g of fat for the Sarda. In this study, the measured trans-16:1
FAs were: t6-16:1, t9-16:1 that elute with ai-17:0, t10-16:1; t11-16:1 that co-elutes with c7-
16:1 and t12-16:1. There was no significant difference in the SCFA content (6:0–10:0 FAs) of
both goat breeds. Among medium and long chain saturated fatty acids (12:0–24:0), only the
15:0 content was significantly higher in the milk fat of Maltese breed than in the milk of Sarda,
with values of 9.48 and 8.51 mg per g of fat (P <0.05), respectively.
4. Conclusions
Sarda goat breed milk showed a nutritionally valuable FA profile with higher desiderable n-3
fatty acids (DHA) than that of the Maltese. This suggests that the activity of peroxisomal beta-
oxidation of n-3 FAs, which participates in the formation of DHA from EPA, and it is also involved
in the catabolism of pro inflammatory eicosanoids, is more effective for this breed than for the
Maltese. The beneficial value of Sarda goat milk is also increased by the observed lower content in
t-FAs. Maltese goat milk fat on the other hand showed a higher content in CLA and VA compared](https://image.slidesharecdn.com/sissue012012finalcat-140620033827-phpapp01/85/S-issue-01_2012_finalcat-171-320.jpg)
![167
Special Issue of the International Dairy Federation 1201 IDF International Symposium on
Sheep, Goat and other non-Cow Milk
to Sarda goats, which present well-known nutritional value and health benefits [7]. The results
of this study showed that the goat breed significantly affected the FA composition of goat milk
fat when goats receive an identical diet and are housed under the same conditions. Whether
these differences are also nutritionally significant has to be investigated.
Acknowledgements
This work has been carried out with funding RAS - P5A "Attivazione del centro di Biodiversità
animale per la valorizzazione del patrimonio animale con riferimento alla produzione e alla
ricerca al servizio dell’allevamento”
References
1. Alferez, M.J.M., Barrionuevo, M., Lopez Aliaga, I., Sanz Sampelayo, M.R., Lisbona, F., Robles,
J.C., Campos, M.S. Digestive utilization of goat and cow milk fat in malabsorption syndrome.
J. Dairy Res. 68:451-461 (2001).
2. Haenlein, G.F.W. Goat milk in human nutrition. Small Ruminant Res. 51:155-163 (2004).
3. Ceballos, L.S., Morales, E.R., Adarve, G.D.L.T., Castro, J.D., Martìnez, L.P., Sampelayo,
M.R.S. Composition of goat and cow milk produced under similar conditions and analyzed
by identical methodology. J. Food Compos. Anal. 22:322-329 (2009).
4. Zan, M., Stibilj, V., Rogelj, I. Milk fatty acid composition of goats grazing on alpine pasture.
Small Ruminant Res. 64:45-52 (2006).
5. Zidi, A., Fernández-Cabanás, V.M., Urrutia, B., Carrizosa, J., Polvillo, O., González-Redondo,
P., Jordana, J., Gallardo, D., Amills, M., Serradilla, J.M. Association between the polymorphism
of the goat stearoyl-CoA desaturase 1 (SCD1) gene and milk fatty acid composition in
Murciano-Granadina goats. J. Dairy Sci. 93:4332-4339 (2010).
6. Wallace, R.J., McKain, N., Shingfield, K.J., Devillard, E. Isomers of conjugated linoleic acids are
synthesized via different mechanisms in ruminal digesta and bacteria. J. Lipid Res. 48:2247-
2254 (2007).
7. Belury, M.A. Dietary conjugated linoleic acid in health: physiological effects and mechanisms
of action. Annu. Rev. Nutr. 22:505-531 (2002).
8. Cruz-Hernandez, C., Kramer, J.K.G., Kennelly, J.J., Sorensen, B.M., Okine, E.K., Goonewardene,
L.A., Weselake, R.J. Evaluating the CLA and trans 18:1 isomers in milk fat of dairy cows fed
increasing amounts of sunflower oil. J. Dairy Sci. 90:3786-3801 (2007).
9. Bligh, E. G. & Dyer, W. J. A rapid method of total lipid extraction and purification. Can. J.
Biochem. Physiol. 37:911-917 (1959).
10. Cruz-Hernandez, C., Deng, Z., Zhou, J., Hill, A.R., Yurawecz, M.P., Delmonte, P., Mossoba,
M.M., Dugan, M.E.R., Kramer, J.K.G. Methods to analyze conjugated linoleic acids (CLA) and
trans-18:1 isomers in dairy fats using a combination of GC, silver ion TLC-GC, and silver ion
HPLC. J. AOAC Int. 87:545-562 (2004).
11. Delmonte, P., Fardin Kia, A.R., Kramer, J.K.G., Mossoba, M.M., Sidisky, L., Rader, J.I. Separation
characteristics of fatty acid methyl esters using SLB-IL111, a new ionic liquid coated capillary
gas chromatographic column. J. Chromatogr. A. 1218:545-554 (2011).](https://image.slidesharecdn.com/sissue012012finalcat-140620033827-phpapp01/85/S-issue-01_2012_finalcat-172-320.jpg)
![168
Special Issue of the International Dairy Federation 1201 IDF International Symposium on
Sheep, Goat and other non-Cow Milk
4.8. (S4.36) Composition and Nutritional Value of Donkey Milk
N. Innocente1, M. Parpinel2, A. Rinaldi1, M. Biasutti1
Summary
This study aims to assess the potentialities of donkey milk as functional food. Fat and total
protein contents were low and milk protein fraction was rich in whey proteins. β-lactoglobulin
and α-lactalbumin were the most important whey proteins detected. Furthermore, donkey milk
was found to be richer in the proteose-peptone fraction than cow milk. The high content of
lactose can be considered one of the characteristics of this milk. The glycemic index value and
the Energy content indicated that donkey milk may be considered a low calorie product, potentially
evaluable as an easily digestible and highly bio-available carbohydrate supplement.
1. Introduction
In recent years, interest in donkey milk was considerably increased due to its composition,
which is very close to that of human milk, so much so that it may be considered a good substitute
for dairy cow milk derivatives in feeding children with severe cow milk protein allergy Despite
the number of studies on composition, dietary, therapeutic and functional properties of donkey
milk [1, 2, 3, 4], its characterization in terms of glycemic index (GI) has never been investigated.
Foods containing low GI carbohydrates improve diabetes management and blood cholesterol
levels. On the other hand, foods containing high GI carbohydrates improve glycemia and help
to refuel carbohydrate stores after physical activity [5]. The aim of this study was to assess
the potentialities of donkey milk as functional food, with particular attention to the nutritional
contribution of the lactose. For this purpose, the glycemic index and the evaluation of Energy
content of donkey milk were carried out and compared with the values of other milks.
2. Material and methods
Two independent samplings were performed. For each trial, bulk milk samples were obtained
from 10 Amiatina breed pluriparous donkeys in mid-stage of lactation. The milk samples were
taken from the collection of two daily milkings and they were stored at 4 °C and analyzed within
24 hours. A portion of milk was for chemical composition analyses. The milk portion for the
glycemic index determination was pasteurized at 70 °C for 30 s and then frozen in 400mL
portions until the test.
The following analyses were performed: moisture [6], ash [7], fat [8], lactose [9]. Content
in total protein, casein and the various non-casein proteins was determined according to
Aschaffenburg and Drewry [10]. The whey protein profile was determined by the RP-HPLC
method reported by De Noni et al. [11].
The determination of the glycemic index (GI) was performed on healthy, non-diabetic volunteers
of normal weight (6 men and 5 women; mean age = 24.8 years; mean Body Mass Index =
22.2). They were involved in two tests, one test for the reference food (a glucose solution) and
one for donkey milk. All tests were carried out with a minimum interval of 2 days. The volunteers
submitted to testing fasted the evening before the day of analysis and samples were taken at
0, 15, 30, 60, 90, 120 minutes after the ingestion of food. During the trial, the volunteers were
kept in a state of physical rest. As a reference, a glucose solution (25 g of pure glucose in
approximately 347 mL of water) was used. The isoglucidic portion of donkey milk was equal
1 Department of Food Science, University of Udine, Via Sondrio 2/A, 33100 Udine, Italy.
(nadia.innocente@uniud.it).
2 Unit of Hygiene and Epidemiology Department of Medical Science and Biological, University of Udine, P.le Kolbe
4, 33100 Udine, Italy.](https://image.slidesharecdn.com/sissue012012finalcat-140620033827-phpapp01/85/S-issue-01_2012_finalcat-173-320.jpg)
![169
Special Issue of the International Dairy Federation 1201 IDF International Symposium on
Sheep, Goat and other non-Cow Milk
to 347 mL. Blood samples were analyzed with a glucometer (G+meter, A. Menarini Diagnostics)
daily used for monitoring of blood glucose in diabetic subjects. Data on GI were calculated
according to the Tai method [12].
2. Results and discussion
The mean gross composition of the donkey milk samples is reported in Table 1. The major
component of donkey milk was lactose, being present in an amount higher than 7%, whereas
total protein, fat and ash contents were present at about 1.5%, 0.35% and 0.25%, respectively.
These data are consistent with the values reported in the literature for donkey milk [1, 2]. As
regards proteins, the total whey proteins accounted for about 64% of the total protein content.
Donkey milk richer in whey protein fraction was also reported by other authors [2, 3].
Table 2 summarizes the whey protein distribution determined on the donkey milk samples.
β-lactoglobulin and α-lactalbumin were the most important whey proteins, in agreement with
the data reported by Vincenzetti et al. [2]. In comparison with cow milk, the donkey milk
samples were characterized by a lower amount of β-lactoglobulin and a higher percentage of
α-lactalbumin. Moreover, it is noteworthy that donkey milk was found to be richer in the pro-
teose peptone fraction than cow milk. No data on the proteose peptone fraction in donkey milk
have previously been reported in the literature. Therefore, the detection of the proteose peptone
fraction in donkey milk may be considered as new information.
Table 1: Chemical parameters of raw donkey milk
g/100 g ± Standard Deviation
Dry matter 8.58 ± 0.01
Ash 0.34 ± 0.048
Lactose 7.16 ± 0.057
Fat 0.25 ± 0.040
Total protein 1.46 ± 0.022
Whey protein 0.93 ± 0.003
Casein 0.53 ± 0.006
Table 2: Whey proteins distribution in raw donkey milk and in raw cow milk
Raw donkey milk Raw cow milk
α-lactoalbumin (mg/mL) 1.620 ± 0.09 1.093±0.042
Serum albumin (mg/mL) 0.014 ±0.0001 0.381±0.064
β-lactoglobulin (mg/mL) 3.324±0.0900 4.432±0.343
Proteose peptone (mg/mL) 2.270±0.0900 1.221±0.240](https://image.slidesharecdn.com/sissue012012finalcat-140620033827-phpapp01/85/S-issue-01_2012_finalcat-174-320.jpg)
![170
Special Issue of the International Dairy Federation 1201 IDF International Symposium on
Sheep, Goat and other non-Cow Milk
Table 3 reports the glycemic index (GI) and the Energy Value (EV) determined in the donkey
milk sample. The mean value of donkey milk GI was equal to 89.25 (SD = 7.03). Therefore,
donkey milk may be consider as a good source of quick energy. If compared with other types
of milk, the GI value of donkey milk is much higher than the data for whole cow milk (31),
skimmed cow milk (47) and soy milk (44) reported by Atkinson et al. [13]. The GI value of
donkey milk is related to its compositional profile, which is poor in fat and protein, but rich in
lactose, as previously discussed. In fact, it is known that the presence of lipids and proteins
and fiber decreases the glucose absorption rate [14]. As regards the Energy, the values were
calculated by appropriate conversion factors [15] taking into account the experimental data of
composition for the donkey milk and the data reported in the literature for the other types of
milk. It can be seen that donkey milk was characterized by a low value, which is similar to the
value of soy milk, but much lower to that of cow milk. The percentage of Energy from lactose is
71.5% for donkey milk against 28.6% and 9.5% for cow milk and soy milk, respectively [16].
3. Conclusion
Donkey milk was found to be poor in protein and fat and rich in lactose and with high value
of GI. These data may suggest the use of donkey milk both as a quick source of energy and
as a low-calorie carbohydrate beverage to restore carbohydrate stores after physical activity.
In comparison with cow milk, donkey milk GI was estimated to be about three times greater,
whereas the Energy intake was found to be much lower. The protein profile was characterized
mainly by the whey protein fraction, in which a significant amount of proteose peptones was
measured.
References
1. Salimei, E., Fantuz, F., Coppola, R., Chiofalo, B., Polidori, P., & Varisco, G. Composition and
characteristics of ass’s milk. Anim. Res. 53:67-78 (2004).
2. Vincenzetti, S., Polidori, P., Mariani, P., Cammertoni, N., Fantuz, F., & Vita, A. Donkey’s milk
protein fractions characterization. Food Chem. 106:640–649 (2008).
3. Polidori, P. & Vincenzetti, S. Differences of protein fractions among fresh, frozen and powdered
donkey milk. Recent Pat. Food Nutr. Agric. 2:56-60 (2010).
4. Uniacke-Lowe, T., Huppertz, T., & Fox, P.F. Equine milk proteins: chemistry, structure and
nutritional significance. Int. Dairy J. 20:609-629 (2010).
5. Jenkins, D.J., Wolever, T.M., Jenkins, A.L., Josse, R.G., & Wong, G.S. The glycaemic response
to carbohydrate foods. Lancet 2:388–391 (1984).
Table 3: Glycemic index and energy value of different types of milk
Milk Glycemic index Energy (kcal/kJ)c
Donkey 89.25 ± 7.03 36/151
Whole Cow 31a 64/287b
Skimmed Cow 47a 106/441b
Soy 44a 32/132b
a [13]
b [16]
c Energy conversion factors by [15].](https://image.slidesharecdn.com/sissue012012finalcat-140620033827-phpapp01/85/S-issue-01_2012_finalcat-175-320.jpg)


This document provides terms and conditions for using content from the International Dairy Federation's (IDF) electronic publication on their 2012 International Symposium on Sheep, Goat and other non-Cow Milk. It states that users can make unlimited use of the content for research, teaching, or private study but not commercial use. The copyright of the content belongs to IDF and cannot be modified or distributed without permission. It also provides liability statements and contact information for IDF. The publication then lists the contents which include posters and presentations from the symposium organized into sessions on social/economic aspects, raw milk, and processing/products.


