Download to read offline


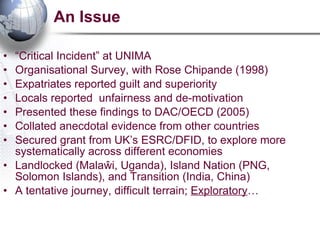
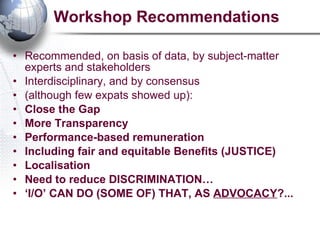
![Participants Total Number of Participants N =1290 Nationalities represented: N = 42 Local 77%, Expatriate 23% Response rate = 46%(overall); 50%(local); 38%(expatriate) Pay type: Local 76%, International 17%, [Volunteer 7%] Gender breakdown = 64% males, 36% females Age: Mean=36.5yrs, sd=9.5 yrs More than 90% of the sample tertiary-educated, from tertiary diploma (9%) and Bachelor degree (37%) through to postgraduate diploma (12%), masters degrees (26%) and doctoral or postdoctoral-qualified (9%). Number of Organisations (nesting) = 202 Mean n per organization = 6.4 Breakdown by type (sector) = Aid: 60 orgs, Commercial: 75 orgs, Education: 27 orgs, Government: 40](https://image.slidesharecdn.com/zwk2conf09slidesharescarraddup-090906165518-phpapp02/85/S-Carr-Project-ADDUP-6-320.jpg)


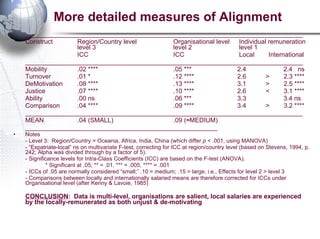
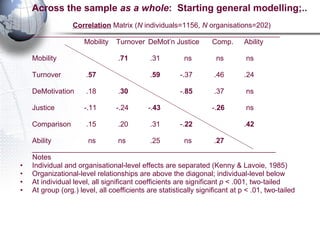


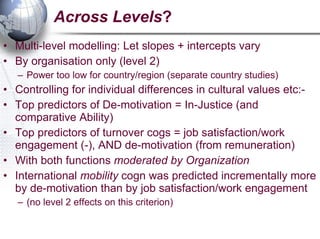

This document summarizes a study examining pay differences between local and expatriate workers in international development organizations across multiple countries. The study found that expatriate workers earned on average 4 times as much as local workers. Both local and expatriate workers felt pay differences above a ratio of 3:1 were unjust. Local workers reported feelings of demotivation and unfairness due to the pay differences, while expatriate workers did not report these feelings as strongly. The study concluded that reducing pay differences and increasing transparency around pay could help address issues of discrimination and demotivation among local staff.


