SlideShare a Scribd company logo
Running head: PROJECT PLAN INCEPTION 1
PROJECT PLAN INCEPTION 2
Information Technology and Business
Babatunde Ogunade
CIS499: Information System Capston
Professor Reddy Urimindi
October 13, 2019
Information Technology and Business
Project Introduction
The very core operation of this company involves the collection
and analysis of data through a currently limited technological
infrastructure. The basis of this business may focus on
leadership structure, the type of industry, business culture, core
vision and mission including objectives. The company has a
Chief Executive Officer (CEO) as the highest rank, four
Information Technology experts and other employees.
Marketing can, therefore, categorize this company as a service
industry company with a core vision of a 60 percent growth in
the next eighteen months and mission of redesigning its
information technology to fulfill its organizational needs.
Product features, new market product, differentiation
techniques, and value addition defines the type of business
which the company is operating. The assessment of its product
features which involves data indicate that the opportunities
focus on marketing. In the continued operations of the company,
the management is not foreseeing any shift from its original
product but is rather fixing a differentiation technique within
six months. An addition in product value should be achieved by
employing an exclusively new technology based on a hybrid
model, hosted solution or on-site solution.
The idea of integrating technologies from other partners to
realize cost-effective outcomes and best operations outlines the
outsourcing policies as far as new technology is concerned.
Consequently, future intentions to acquire services such as
Software-as-a-Service (SaaS) and cloud computing technologies
may involve the adoption of knowledge and skills from outside
the country, therefore, describing offshoring activities. As
asserted by Aithal, (2017), the success of fulfilling the effective
company operation, these activities are important.
One of the skilled personnel in the company is the Chief
Information Officer (CIO) whose basic role is to keep a charge
on the computer systems and information technology (IT)
necessary in ensuring a company’s goals and objectives.
Additionally, the CEO has devolved the responsibility of
security protocols to the CIO in the process of more digitized
frameworks. Other personnel includes the company CEO tasked
with communicating to partners, creating the company mission
and vision, and generally heading the implementation of both
long term and short term objectives. The other information
technician is mandated in both the installation and configuration
of computer hardware and software.
Based on the current collection and analysis method, data on the
customer, marketing, lifecycle, website engagement, and funnel
analytics. In broad-spectrum, funnel analytics provide customer
information through registration, lead generation, and other
checkout pages. Website engagement deals with data on how
users dwell on-site to buy products, subscribe or take any other
action. Additionally, lifecycle analytics deals with giving access
to large volumes of product durability and informed product
investment decisions. Marketing and customer analytics provide
a solution for accessing customer understanding of superior
delivery experiences.
The major current information system used by the company
include Web analytics in combination with other operating
systems. With this tool, the company can gain customer
behavior regarding their visits to the websites. Therefore, it is
easy to establish a customer-management relationship from
which the company can retain and attract new customers or gain
insight attraction to visitors and expand the amount that a
customer spends. The specificity of this system is to provide
information on how to promote a product and determine the
other products that customers are likely to purchase.
Operational systems and database used by Web analytics;
numerous operational systems are available depending on the
choice of the user. Potential clients may have their default
browsers to be internet explorer, firefox and chrome which have
an operational system in windows predominant in computer
usage. Consequently, android and iPhone also give platforms to
other users. Microsoft SQL server is a rational database system
that can be used to store and retrieve data as requested by other
web users. Another database in this web analytics includes
embedded which is highly integrated, requires little or no
maintenance and the end-user is not capable of accessing the
system through applications.
The good user interface is important for instilling confidence,
improving data discoverability, broadening the context and easy
understanding of the data. A command-line interface is text-
based and the customer or the user can respond to prompts by
typing commands and receiving feedback. Natural language
interface allows interaction by use of normal languages such as
English or French as opposed to the use of computer language
and is meant for understanding spoken or written texts. As
earlier discussed, the analytics contained in the company
includes the marketing, customer, life cycle and web-site
engagement analytics and are regarded as important elements in
interpreting, communicating and discovering meaningful data
patterns.
Since the company deals in information technology, the
infrastructural components of the company are divided into
three important splits of computing, network, and storage.
About the young age of the company, the technological
infrastructure is still very limited and therefore the current
system is not strong enough to warrant its reliability.
Fundamental facility and system are achievable for serving its
market and supporting day-to-day functions. The company's
physical infrastructure such as buildings is also inadequate to
allow an expanded system.
The security of the company’s system can be defined by
countermeasures that are put in place to ensure that cyber,
computer and information technology are protected. The risks
that are associated with these facilities cover those from theft,
physical damage and electronic damages such as file corruption,
cyberattacks, and hacking. Web analytics is a modern technique
that is considered secure. In this system, the information
technologist can set predetermined rules which a firewall
protects against untrusted networks. Firewall security system
controls and monitors outgoing and incoming networks which in
the overall view protects computers against cyber-attacks.
Data encryption in another security measure which is enabled in
the web analytics. The company can decide to encode
information and only be accessed to those employees or users
with the correct encryption key. Consequently, the data can also
be made to appear unreadable and scrambled to users who have
permission to access these files. The security technique
provides the company with the necessary data protection against
accessibility from unauthorized users. Sensitive information on
tax, confidential emails and other important files cannot be
intercepted or be viewed by other parties.
Additionally, creating passwords and biometrics is also a
security feature relevant in the daily web analytics operations.
The biometrics system is a more secure system where access to
files can only be granted to a person through the identification
of a unique biological trait such as DNA, voice or fingerprints.
According to Pane, Awangga, Nuraini & Fathonah, (2018)
establishing a strong password is adequate protection against
identity theft and financial fraud in accompany. Combining
these two can be used by the company to offer protection
against cyber hacks.
References
Aithal, P. S. (2017). Company Analysis–The Beginning Step
for Scholarly Research. International Journal of Case Studies in
Business, IT and Education (IJCSBE), 1(1), 1-18.
Pane, S. F., Awangga, R. M., Nuraini, R., & Fathonah, S. (2018,
April). Analysis of Investment IT Planning on Logistic
Company Using COBIT 5. In Journal of Physics: Conference
Series (Vol. 1007, No. 1, p. 012051). IOP Publishing.
I have chosen Social Media as the behavior for this assignment.
Addictions come in many forms and almost always involve a
complex three-way interaction between the person, the object of
the addiction (e.g., drugs, gambling, chocolate), and the societal
context of the addiction. This complex interaction raises a
controversial social question: Is addiction always a bad thing?
Although there is often a significant amount of social stigma
attached to addictions, and popular media often focuses on the
treatment and prevention of addiction, there may also be
associated positive qualities of addictive substances and
behaviors.
For your initial post, the class will be split into two groups.
Please see below for your assigned topic group.
Initial post will be written on social media which is a specific
behavior that has addictive potential.
Begin your initial post by choosing a behavior with addictive.
For this discussion, you must explain both the positive and
negative potential of addiction to your chosen behavior. The
behavior should present both positive and negative potential
outcomes.
Research your behavior providing at least two peer-reviewed
resources to support any claims made. In your post, construct
clear and concise arguments using evidence-based psychological
concepts and theories to create a brief scenario or example of a
situation in which your chosen addiction provides both positive
and negative potential outcomes for a subject. Integrate
concepts developed from different content domains to support
your arguments. Evaluate and comment on the reliability and
generalizability of the specific articles and research findings
you have chosen to support your arguments. Explain how the
APA’s Ethical Principles and Code of Conduct might be used to
guide your decisions as a psychology professional if you were
assigned to consult with the subject in the situation you have
created.
The following websites may help when explaining the APA’s
Ethical Principles and Code of Conduct might be used to guide
your decisions as a psychology professional:
American Psychological Association. (2010). Ethical principles
of psychologists and code of conduct: Including 2010
amendments (Links to an external site.). Retrieved from
http://www.apa.org/ethics/code/index.aspx
I have chosen Social Media as the behavior for this assignment.
Addictions come in many forms and almost always involve a
complex three
-
way interaction
between the person, the object of the addiction (e.g., drugs,
gambling, chocolate), and the
societal
context of the addiction. This complex interaction raises a
controversial social question:
Is addiction always a bad thing? Although there is often a
significant amount of social stigma
attached to addictions, and popular media often focuses on the
treatme
nt and prevention of
addiction, there may also be associated positive qualities of
addictive substances and behaviors.
For your initial post, the class will be split into two groups.
Please see below for your assigned
topic group.
Initial post will be writ
ten on
social media
which is
a specific behavior that has addictive
potential
.
Begin your initial post by choosing
a behavior with addictive.
For this discussion, you must
explain both the positive and negative potential of addiction to
your chosen behav
ior.
The
behavior
should
present
both positive and negative potential outcomes.
Research your behavior providing at least two peer
-
reviewed resources to support any claims
made. In your post, construct clear and concise arguments using
evidence
-
based psych
ological
concepts and theories to create a brief scenario or example of a
situation in which your chosen
addiction provides both positive and negative potential
outcomes for a subject. Integrate
concepts developed from different content domains
to support
your arguments. Evaluate and
comment on the reliability and generalizability of the specific
articles and research findings you
have chosen to support your arguments. Explain how the APA’s
Ethical Principles and Code of
Conduct might be used to guide your
decisions as a psychology professional if you were
assigned to consult with the subject in the situation you have
created.
The following websites may help when explaining the APA’s
Ethical Principles and Code of
Conduct might be used to guide your decisi
ons as a psychology professional:
American Psychological Association. (2010).
Ethical principles of psychologists and code of
conduct: Including 2010 amendments
(Links to an external site.
)
. Retrieved from
http://www.apa.org/ethics/code/index.aspx
TOJET: The Turkish Online Journal of Educational Technology
– January 2018, volume 17 issue 1
Copyright © The Turkish Online Journal of Educational
Technology
169
Social Media Addiction Scale - Student Form: The Reliability
and Validity Study
Cengiz Şahin
Faculty of Education, Ahi Evran University, Kirsehir, Turkey
[email protected]
ABSTRACT
The purpose of this study is to develop a valid and reliable
measurement tool to determine the social media
addictions of secondary school, high school and university
students. 998 students participated in the study. 476
students from secondary schools, high schools and universities
participated in the first application during which
the exploratory factor analysis of the scale was conducted. 298
students participated in the second application
during which the confirmatory factor analysis was carried out.
Test-retest method was used to determine the
consistency of the scale with the participation of 224 student.
Expert opinion, exploratory factor analysis,
confirmatory factor analysis, total item correlations, mean
differences between upper and lower groups, internal
consistency coefficient and test-retest correlation coefficients
were calculated within the scope of assessing the
validity and reliability of the research. According to the
exploratory and confirmatory factor analysis, the scale
has a 4-factor structure accounting for 53.16% of the total
variance. Kaiser-Meyer-Olkin (KMO) coefficient and
the Bartlett’s test were found significant respectively at .96 and
χ2=12680.88 (p=.00). Internal consistency
coefficient (Cronbach’s alpha coefficient) was found .93 for the
whole scale and at values ranging from .81 to
.86 for the sub-factors. Test-retest coefficient was found .94. In
conclusion, SMA-SF is a 5-point Likert-type
scale consisting of 29 items grouped under 4 factors (virtual
tolerance, virtual communication, virtual problem
and virtual information). The statistical analysis indicates that
the scale is valid and reliable enough to be used in
determining the social media addictions of secondary school,
high school and university students.
Keywords: Social media, addiction, student, scale development,
reliability and validity.
INTRODUCTION
The Internet is a knowledge technology that has entered into
every aspect of life as a means of information, trade
and communication. Although the purpose of its emergence was
to reach secure, fast, inexpensive information
and to facilitate communication, today it has become a means of
causing significant changes in individuals and
society. The fact that internet usage takes place independently
of time and space over a virtual environment leads
to changing forms of communication. And social media, which
is an extension of internet technology, changes
communication channels among people. The use of social media
in Turkey and around the world is increasing,
especially young people and students show intense interest in it.
According to information provided by Internet World Stats
(2017) based on data provided by leading
organizations in Internet researches (Nielsen/NR, eTForcasts,
CIAlmanac, ITU, IWS, CIA), as of March 2017
the number of Internet users worldwide has increased by
approximately 3 billion 732 million people (49.6%).
The rate of increase in internet usage 2000-2017 was 933.8%. In
the same research, it is reported that the number
of internet users in Turkey is approximately 46 million 283
people (59.6%) and the number of social media
(Facebook) users is about 41 million people (53.2%). It is
observed that the rate of social media usage in Turkey
is higher than that of Europe (37.6%). According to the Turkish
Statistical Institute (TUIK, 2016), the rate of
individuals using the internet in Turkey is 61.2%. When
purposes of internet usage in Turkey is taken into
consideration, 82.4% of the individuals who use the internet in
the first three months of 2016 have shared their
social networking profile or photo, messages and content. This
ratio is higher in adolescents and students
compared with other age groups (TUIK, 2016).
Social networks are applications that run over the internet and
cannot be evaluated independently from the
internet. Today, social media tools have enabled each user to
become a content producer through account/profile
creation with the burst of web 2.0 technologies (Tekvar, 2012).
Social media contributes to the transformation of
users from passive listeners to active content producers and it
makes it easier to stay connected and to produce
content by providing applications for different mobile devices
and operating systems (Karasu & Arıkan, 2016).
Therefore, people use social media more widely than expected.
Excessive, problematic, and pathological use
leads to personal, social, vocational and educational problems
for individuals (Griffiths Kuss & Demetrovics,
2014). There is no consensus among researchers about
identifying problematic social networking or Internet
TOJET: The Turkish Online Journal of Educational Technology
– January 2018, volume 17 issue 1
Copyright © The Turkish Online Journal of Educational
Technology
170
addiction (Wegmann, Stodt & Brand, 2015), depending on the
conceptual confusion surrounding the problematic
internet use classification.
People think that addiction usually involves substances use such
as drugs or alcohol. Uncontrollable habits or
practices are also referred to as addiction (Harris, Nagy &
Vardaxis, 2014). In this sense, the concept of
technological dependency has also been used to describe the
extreme Internet usage behaviors that arise due to
developed technologies (Kuss & Griffiths, 2012; Turel &
Seronko, 2012). Internet addiction (Young, 2004,
Sahin, 2011), game addiction (Fisher, 1994, Griffiths & Hunt,
1998; Horzum, 2011), CyberSex addiction
(Cavaglion, 2009; Schwartz & Southern, 2000); online addiction
(Tüzer, 2011), Social network addiction
(Griffiths, 2012), mobile phone addiction (Bianchi & Phillips,
2005; Fidan, 2016), Facebook addiction
(Andreassen, Torsheim, Brunborg & Pallesen, 2012), Twitter
addiction (Said, Al-Rashid & Abdullah, 2014),
social media disorder (van den Eijnden, Lemmens &
Valkenburg, 2016) and social media addiction (Andreassen,
Torsheim, Brunborg and Pallesen, 2012; Şahin & Yağcı, 2017)
have been investigated in the context of
behavioral addiction and are gaining importance along with
developing technology.
Social media addiction is considered as a kind of internet
addiction (Kuss & Griffiths, 2012). Individuals who
spend too much time on social media have a desire to be
notified of anything immediately, which can cause
virtual tolerance, virtual communication and virtual problem.
Behaviors that force the person into these actions
can be explained as social media addiction.
Turne & Serenko (2012) have identified three notionally
different perspectives to explain the formation of social
network addiction: Cognitive-behavioral model; this model
emphasizes that ‘abnormal’ social networking arises
from maladaptive cognitions and is amplified by various
environmental factors, and eventually leads to
compulsive and/or addictive social networking. Social skill
model; this model emphasizes that ‘abnormal’ social
networking arises because people lack self-presentational skills
and prefer virtual communication to face-to-face
interactions, and it eventually leads to compulsive and/or
addictive use of social networking. Socio-cognitive
model; this model emphasizes that ‘abnormal’ social networking
arises due to the expectation of positive
outcomes, combined with internet self-efficacy and deficient
internet self-regulation eventually leads to
compulsive and/or addictive social networking behavior
(Griffiths, 2013).
The transition from normal to problematic social media use is
seen as an important mechanism to alleviate stress,
loneliness or depression for the individual, so they become
more active with more social media. This ultimately
leads to many problems and exacerbates the unwanted mental
states of the individual (Xu & Tan, 2012). Brown
& Bobkowski (2011) stated that social media use can lead to
harmful behaviors such as aggression, personality
disorder, unhealthy diet, early sexuality, tobacco and alcohol
use in young people. As a result, the psychological
dependence level in social sharing develops when this cyclical
situation is repeated in order to get rid of the
unwanted mood in social media use.
The researchers conducted in different countries revealed that
internet usage addiction is not limited to university
students, but also includes secondary school and high school
students (Al-Menayes, 2015). Individuals who
spend 8.5 to 21.5 hours online per week are considered to be
addicted (Yang & Tung, 2007).
It can be said that the determination of this situation is
important when considering the problems caused by
social media addiction. The diagnosis of social media addiction
cannot be justified indiscriminately or just by
observation. Valid and reliable scales can be used for this. In
this respect, when the literature about social media
addiction scales was examined, various researches, tests and
scales were found (Banyai at.al, 2017; Al-Menayes,
2015). It seems that there are a few researches in Turkish
literature to determine the social media addiction of
university students (Tutkun Ünal & Deniz, 2015; Kırık, Arslan,
Çetinkaya & Gül, 2015; Şahin ve Yağcı, 2017).
However, there were no tests or scales that measured the social
media addiction of 12-22 year old students in the
literature. 12-18 age group is accepted as puberty or
adolescence in developmental psychology literature
(Gündoğdu, 2016). The term late puberty is proposed as well for
18-25 ages (Arnett, 2004). The latter is
considered as the prolongation of development (Arnett, 2007).
From this point of view, it can be said that 12-22
ages show similar properties. In this context, this study aims to
develop a measurement for the determination of
social media addiction of students and reveal the validity and
reliability results.
METHOD
The progress of the scale development work carried out to
determine the social media addiction of the students
and the characteristics of the working group are presented
below.
TOJET: The Turkish Online Journal of Educational Technology
– January 2018, volume 17 issue 1
Copyright © The Turkish Online Journal of Educational
Technology
171
Study Group
The study included students from 12 to 22 years of age
(M=17.26 ± SD=3.09) who were studying in different
departments of a university as well as secondary and high
school students in the districts representing different
socio-economic levels of a city during the 2016-2017 academic
year. The scale development process was carried
out with the participation of a total of 998 students. 566
(56.7%) female students and 432 (43.3%) male students
participated voluntarily. The participants were determined by
simple random sampling. The working group has
been considered to be "at least ten times the number of items"
(Sönmez & Alacapınar, 2014). 476 students from
secondary school, high school and university participated in the
first application in which explanatory factor
analysis of the scale was performed and 298 students
participated in the second application in which
confirmatory factor analysis was performed. The test-retest
method was used to determine the consistency of the
scale and the application was performed with the participation
of 224 students.
Development of Scale Form
In order to establish a trial form for determining the social
media addiction of students, it was necessary firstly to
create a conceptual framework by examining the social media
use and addiction research (Griffiths, 1995;
Young, 2004; Şahin, 2011; Al-Menayes, 2015, Tutgun Unal &
Deniz, 2015, Banya et al., 2015). In this
framework, a frame for the scope of the "Social Media
Addiction Scale-Student Form (SMAS-SF)" was
determined in line with the information obtained from the
related literature and opinions of field experts, an item
pool consisting of 41 items was formed and a draft form was
prepared. The scale includes 39 positive and 2
negative items. A 5-point grading is used in the scale: “(1)
Definitely not appropriate”, “(2) Not appropriate”,
“(3) Undecided”, “(4) Appropriate” and “(5) Quite appropriate”.
The negative items are scored reversely.
The collected data were uploaded to SPSS 22.00 and LISREL
8.80 programs in order to conduct statistically
reliability and validity tests of the scale. Values for negative
expressions are inversely encoded when loading to
the programs.
The Scoring of the Scale
This is a 5-point Likert type scale which consists of 29 items
and 4 sub-dimensions. 1-5 items are within virtual
tolerance sub dimension;6-14 items are within virtual
communication sub dimension, 15-23 items are under
virtual problem sub dimension and 24-29 items are under virtual
information sub dimension. All of the items in
the scale are positive. The highest point that can be scored from
the scale is 145, and the least one is 29. The
higher scores indicate that agent perceives himself as a “social
media addict”.
Analysis of Data
The construct validity of the scale was examined by the Kaiser-
Meyer-Olkin (KMO) coefficient and the Bartlett
Sphericity test, and it was determined whether or not to perform
factor analysis (Russell, 2002; Kalayci, 2009).
Explanatory factor analysis was performed on the data through
the obtained data. A factor analysis method has
been adopted to determine the validity structure of the scale
(Balcı, 2009; Seçer, 2013). An analysis of basic
components was conducted to determine the factors underlying
the scale; Factor loadings were investigated by
choosing Varimax rotation technique. The factorization
technique was used in the analysis of the basic
components (Büyüköztürk, 2002). By identifying the grouped
factors observed in the scale, the number of
variables was reduced (Seçer, 2013). The factor analysis was
repeated by removing the items below 30 as a
result of the principal components analysis and by removing the
factor loadings which are distributed to two
factors (Kline, 1994; Büyüköztürk, 2002; Balcı, 2009).
The exploratory factor analysis was applied to a different study
group in order to test the model structure.
Confirmatory factor analysis was performed on the obtained
data. Confirmatory factor analysis is based on the
relationship between observed and unobserved variables (items
and factors) that are treated as hypotheses
(Pohlmann, 2004). It has been tested whether the model created
through previously acquired information has
been verified by the present data. Many adaptation indices are
used in literature to demonstrate the adequacy of
the model (Kline, 2005).
As a result of the factor analysis, the item discriminative
powers of the remaining scale items are determined by
testing them with independent sample t test and the validity
feature of the scale is determined by testing the item-
total correlations with Pearson's r test (Büyüköztürk, 2002).
Discrimination is considered to be one of the most
important pieces of evidence used in determining the validity of
a scale (Büyüköztürk, 2008). The discrimination
of items on the scale is determined by testing the
meaningfulness of the difference between the scale scores of
the 27% upper and 27% subgroups after the raw scores are
ranked from small to large.
TOJET: The Turkish Online Journal of Educational Technology
– January 2018, volume 17 issue 1
Copyright © The Turkish Online Journal of Educational
Technology
172
Internal consistency coefficients and stability tests were
performed to determine the reliability of the scale. The
internal consistency level of the scale was calculated using the
Cronbach Alpha reliability coefficient and the
correlation value between two peer half was calculated by using
the Sperman-Brown and the Guttmann split-half
reliability formula. The level of stability within the reliability
of the scale was calculated by determining the
correlation values between the results of the two applications
which were conducted within four weeks intervals
(Büyüköztürk, 2002; Balcı, 2009).
Negative items on the scale are coded by reverse scoring. The
scale is determined as a result of analysisand it
was applied to the study group by multiplying the scale. The
validity and reliability analysis of the data obtained
from the application was conducted using IBM SPSS 20.0 and
Lisrel 8.80 programs.
FINDINGS
In this section, findings on the validity and reliability studies of
"Social Media Addiction Scale: Student Form
(SMAS-SF)" are included.
Findings Related to the Validity of the Scale
The validity of a measurement tool can be defined as the degree
of serving purpose of the items prepared to
measure a specific feature (Seçer, 2013). In this context, the
findings of content validity and construct validity,
total item correlations and item discrimination levels of SMAS-
SF are presented below.
Content Validity
The validity of the quantitative and qualitative content of the
scaled items has been consulted by expert opinion
(Balcı, 2009; Büyüköztürk, Çakmak, Akgün, Karadeniz &
Demirel, 2015). One expert in the field of
psychological counseling and guidance,one expert in psychiatric
field, two experts in computer and instructional
technology field, one expert in measurement and evaluation
field and one expert in Turkish language education
have shared their opinions about whether SMAS-SF is adequate
to measure social media addiction. Opinions of
these experts were obtained using a 3-point rating form. Experts
were asked to respond by marking the
"appropriate", "partially appropriate" and "not suitable" options
for the items on the form. In the view of the
experts, the content validity rate of the items has been
determined (Veneziano & Hooper, 1997). The said ratios
were determined by the ratio of the total number of experts who
responded positively to each item to the total
number of experts.
The items with a coverage rate of less than 0.80 in the created
item pool were subtracted from the draft scale.
The draft scales were read by two Turkish literature experts in
order to eliminate mistakes related to imputation
and punctuation errors. Some items were removed from the
scale in line with the calculated coverage validity
ratios and some items were rearranged (Şahin & Beydoğan,
2016). The draft scale of 41 items has been prepared
for initial implementation with the contribution of student
opinions, information obtained from the literature and
the literature experts. 38 of the items in the draft scale were
positive and 3 of them were negative. Against the
material created, five-grade options have been placed to
determine the attitude levels of the students. These
options were edited and scored as: (1) I do not agree at all, (2) I
little agree, (3) I agree, (4) I quite agree, and (5)
I strongly agree. The final scale was multiplied and applied.
Construct Validity
Exploratory Factor Analysis
The suitability of the data obtained from the scale items for the
factor analysis was determined by using the
Kaiser Meyer Olkin (KMO) and Bartlett test. The values have
been obtained as KMO test value, 965; Bartlett
test value χ2 = 18304.06; df=400 (p=.00). In order to perform
item factor analysis, it is suggested that the value
of KMO should be at least .70 (Sönmez & Alacapınar, 2014)
and the Bartlett test should be meaningful (Kalayci,
2009). Findings on the scale show that the data are appropriate
for factor analysis.
First, we conducted the basic components analysis in order to
determine if the scale is one-dimensional. The
basic components analysis used in the factor analysis and
varimax vertical rotation technique is used to remove
the items with factor loading values less than .40 and the items
with two loading value at different factors (Balcı,
2009). At the end of the analysis of the basic components
analysis in the factor analysis and the rotation process
with the Varimax technique, 6 factors were determined with a
value greater than 1.00. Due to excessive factor
numbers, Cattel's scree test was done.
TOJET: The Turkish Online Journal of Educational Technology
– January 2018, volume 17 issue 1
Copyright © The Turkish Online Journal of Educational
Technology
173
Figure 1. Social media addiction scale-student form self-value
factor graph
It is possible to say that the number of factors in the scale can
be limited to 4 because the factors after the fourth
point are small and the distances between them are very close
and similar in the eigenvalue graph. Büyüköztürk
(2002) states that the eigenvalue graph will give the number of
factors of fast drops or fracture points as seen in
the graph.
As a result of the exploratory factor analysis, factor loading
values of the items were examined and 5 items were
subtracted from the measurement since they were not
determinative of which factor is measured. As a result of
the factor analysis, it was seen that the items in the measure
were collected in four groups. Experts examine the
items in the group and determine what they measure
thematically. Four items which had high loading values in
more than one factor were removed from the scale after the
restructuring analysis.
In the scope of the study, it was determined that there are 4
factors with an eigenvalue greater than 1 and a
variance value of more than 5%. The variance explained by the
first factor is 14.17%; The variance explained by
the second factor is 14.15%; The variance explained by the third
factor is 12.97% and the variance explained by
the fourth factor is 11.86%. The total variance explained by the
scale is 53.16%. The results of the analysis
showed that 5 items of 29 items on the scale gave the first
factor, 9 gave the second factor, 9 gave the third factor
and 6 gave the high loading value in the fourth factor.
It was determined that the factor number is 4, KMO value .96;
Bartlett value χ2=12680.88; df=371 (p=.00) in the
scale consists of 29 items. It is stated that factor loading values
vary as follows: .61 and .77 in the first factor .48
and .68 in the second factor .41 and .47 in the third factor and
.53 and .71 in the fourth factor.
After the measurement factors have been determined, the items
collected in each factor have been identified.
Correlation values of the items and item-total scores were
calculated. The alternating factor loadings, item-total
scale correlation, common factor variance values and factor
loading values obtained according to the analysis
result are given in Table 1.
TOJET: The Turkish Online Journal of Educational Technology
– January 2018, volume 17 issue 1
Copyright © The Turkish Online Journal of Educational
Technology
174
Table 1. The factor loadings of social media addiction scale-
student form and item-total correlation
Draft
Scale
Item No
Scale
Item
No
Factor
Loadings
before
Rotation
Factor Loading Values
Item-total
Correlation
Coefficients
Virtual
Tolerance
Virtual
Communication
Virtual
Proble
m
Virtual
Information
M1 1 .66 .77 .59
M2 2 .64 .75 .60
M4 3 .63 .71 .57
M3 4 .60 .70 .66
M5 5 .54 .61 .64
M18 6 .51 .68 .50
M11 7 .34 .55 .41
M21 8 .39 .54 .49
M26 9 .56 .54 .71
M24 10 .49 .53 .64
M28 11 .59 .51 .72
M20 12 .34 .50 .52
M34 13 .50 .50 .67
M27 14 .49 .48 .67
M14 15 .62 .67 .68
M30 16 .53 .66 .53
M10 17 .56 .64 .59
M31 18 .57 .57 .59
M15 19 .49 .55 .53
M17 20 .53 .54 .63
M29 21 .51 .50 .64
M22 22 .49 .48 .67
M16 23 .50 .41 .68
M38 24 .61 ,715 .62
M40 25 .62 ,703 .61
M39 26 .44 ,562 .53
M37 27 .44 ,560 .59
M35 28 .53 ,556 .65
M36 29 .58 ,539 .69
Variance (%) 14.17 14.15 12.97 11.86
Total Variance: 53.16%
When Table 1 is examined, it is seen that the factor loadings of
the scale items are collected in 4 sub-dimensions.
According to the results of the repeated factor analysis, the
items with factor loading values of less than 0,30
were eliminated from the scale which consists of 41 items.
Item-test correlations were used to determine the
discriminative power of the items. In the study, substances with
a substance-test correlation values of 0.30 and
above were taken as the basis. As a result of the analysis, 4
factor scale structure, which consists of 29 items, was
reached. Factor loading values of the items were found to be
between .41 and .77 for the overall measurement.
These factors are named according to the information obtained
from the literature and the expert opinion.
According to this, the first factor is virtual tolerance, the second
factor is virtual communication, the third factor
is virtual problem and the fourth factor is virtual information.
Confirmatory Factor Analysis
First and second level confirmatory factor analysis were
performed to test the accuracy of its 4-dimensional
structure which is determined as the result of the exploratory
factor analysis. Confirmatory factor analysis was
performed on data collected from 298 students, except for the
sample collected for the explanatory factor
analysis. As shown in Figure 2, a model of equality has been
established, which can be predicted by a four-
factorial and a 29-factor structure, which is revealed by
exploratory factor analysis.
As a result of the confirmatory factor analysis, the Chi Square
value is (χ2)=1576.98, the degree of freedom is
χ2/df=4.25. It can be said that the Chi square values, which vary
according to the sample size, have an acceptable
concordance for the current sample to which this sample applies
(Kline, 2005). For the structural suitability of
TOJET: The Turkish Online Journal of Educational Technology
– January 2018, volume 17 issue 1
Copyright © The Turkish Online Journal of Educational
Technology
175
the scale, the RMSEA (Root Mean Square Error of
Approximation), SRMR (Standardized Root Mean Square
Residual, GFI(Good Fit Index), AGFI (Adjusted Goodness of
Fit Index) and NFI (Normed Fit Index) values are
taken into account (Browne and Cudeck, 1993; Kline, 2005;
Raykov and Marcoulides, 2006; Byrne, 2010). The
data obtained by the confirmatory factor analysis validates the
model.
Figure 2. First-level confirmatory factor analysis correlation
diagram (standardized)
As seen in Figure 2, the sub-dimension virtual tolerance of
scale’s factor loadings control ranges from .69 to .76;
the sub-dimension virtual communication ranges from .39 to
.77; the sub-dimension virtual problem ranges from
.55 to .73; the sub-dimension virtual information ranges from
.54 to .75.
The t values obtained as a result of confirmatory factor analysis
are presented in Table 2. According to the
findings in Table 2, it was determined that the t value for the
items in the Social Addiction Scale-Student Form
TOJET: The Turkish Online Journal of Educational Technology
– January 2018, volume 17 issue 1
Copyright © The Turkish Online Journal of Educational
Technology
176
changed between 12.26 and 27.61. According to this, all t
values obtained in the first level confirmatory factor
analysis were found to be significant at .01 level.
Table 2. First-Level Confirmatory Factor Analysis t-Test Values
Item No t Item No t Item No t Item No t
M1 25.58** M6 16.69** M15 25.40** M24 22.95**
M2 26.52** M7 12.26** M16 17.97** M25 23.28**
M3 26.61** M8 14.89** M17 19.72** M26 17.07**
M4 24.14** M9 26.28** M18 22.24** M27 19.85**
M5 23.13** M10 21.92** M19 20.40** M28 24.23**
M11 27.61** M20 23.26** M29 26.35**
M12 16.62** M21 23.15**
M13 23.66** M22 23.39**
M14 24.44** M23 23.51**
**p�.01
Second level confirmatory factor analysis was conducted to
show that the 4 factors obtained by the first level
confirmatory factor analysis of the scale represent a social
media addiction variable defined as a superstructure.
The second level factor model was tested by adding second
level variables to the first level confirmatory
structure which were tested with 4 potential and 29 indicator
variables. The connection diagram of the second
level confirmatory factor analysis of the scale is presented in
Figure 3.
Figure 3. Second-level confirmatory factor analysis correlation
diagram (standardized)
The factor loadings of the model obtained from the
confirmatory factor analysis are shown in Figure 3. The sub-
dimension virtual tolerance for factor loadings ranges from .69
to .77; the sub-dimension virtual communication
TOJET: The Turkish Online Journal of Educational Technology
– January 2018, volume 17 issue 1
Copyright © The Turkish Online Journal of Educational
Technology
177
ranges from .39 to .76; the sub-dimension virtual problem
ranges from .56 to .73 and the sub-dimension virtual
information ranges from .54 to .75.
The absence of a red arrow in the t values between the factors
and the items after the standardized analyzes
indicates that all the items are significant at the level of �.05
(Jöreskog and Sörbom, 1993). The perfect and
acceptable compliance measures for the fit indices examined in
the study and the fit indices obtained from the
first and second confirmatory factor analyzes are presented in
Table 3.
Table 3. Fit indices and fit indices values obtained from DFA
Inspected
FitIndices Perfect Fit Acceptable Fit
First Level
Confirmatory Factor
Analysis Fit Indices
Second Level
Confirmatory
Factor Analysis Fit
Indices
χ2/sd 0 ≤ χ2/df ≤ 2.00 2.00 ≤ χ2/d<5.00 3.25 3.67
RMSEA 0 ≤ RMSEA ≤ 0.05 0.05 ≤ RMSEA ≤ 0.08 0,05 0.06
S-RMR 0 ≤ S-RMR ≤ 0.05 0.05 ≤ S-RMR ≤ 0.10 0.04 0.05
NFI 0.95 ≤ NFI ≤ 1.00 0.90 ≤ NFI ≤ 0.95 0.97 0.97
CFI 0.97 ≤ CFI ≤ 1.00 0.95 ≤ CFI ≤ 0.97 0.98 0.98
GFI 0.95 ≤ GFI ≤ 1.00 0.90 ≤ GFI ≤ 0.95 0.90 0.89
AGFI 0.95 ≤ AGFI ≤ 1.00 0.85 ≤ AGFI ≤ 0.95 0.88 0.87
According to the findings in Table 3, it can be seen that the
values obtained as a result of explanatory and
confirmatory factor analysis are consistent. This indicates that
the construct validity of the "Social Media
Addiction Scale: Student Form" is confirmed.
Item Discrimination
The discrimination power of the items in the scale was
calculated. For this, the raw scores obtained from each
item are ranked from small to large. Subsequently, the
significance of the difference between subgroup 27% and
upper 27% group item scores was tested. Findings of t values
and significance levels obtained after the test are
presented in Table 4.
Table 4. Levels of item discrimination
Virtual Tolerance Virtual Communication Virtual Problem
Virtual Information
Item t Item T Item t Item t
M1 18.51(**) M7 11.83(**) M15 23.46(**) M24 19.16(**)
M2 21.69(**) M8 15.50(**) M16 16.72(**) M25 22.87(**)
M3 22.48(**) M9 22.52(**) M17 19.00(**) M26 16.64(**)
M4 21.21(**) M10 19.60(**) M19 14.10(**) M27 20.40(**)
M5 20.43(**) M11 18.62(**) M20 16.59(**) M28 20.74(**)
M12 16.36(**) M21 16.06(**) M29 26.58(**)
M13 19.40(**) M22 19.92(**)
M14 22.25(**) M23 19.16(**)
F1 32.76(**) F2 32.95(**) F3 30.07(**) F4 35.65(**)
Total 45.45(**)
df: 338; **p<.01
As seen in Table 4, the 29 items in the scale, the factors and the
independent sample t-test values for the total
score vary from 11.83 to 26.58. The t value for the general
population is 45.45; 32.76 for F1 (VT) subdimension;
32.95 for F2 (VC); 30.07 for F3 (VP) and 35.65 for F4 (VI) (p
<.01). According to this finding, it can be said
that the scale has internal validity, meaning that it distinguishes
students with high addiction and students with
minor addiction.
Findings Related to the Reliability of the Scale
Internal consistency and stability analyses were performed on
the data to calculate the reliability of the scale.
The processes and findings are presented below.
TOJET: The Turkish Online Journal of Educational Technology
– January 2018, volume 17 issue 1
Copyright © The Turkish Online Journal of Educational
Technology
178
Internal Consistency Levels
The reliability of the scale according to the factors and general
is calculated by using Peer-to-Peer Correlations,
Sperman-Brown formula, Guttmann Split-Half reliability
coefficient, and Cronbach Alpha reliability formulas.
Reliability analysis values for the overall scale and factors are
presented in Table 5.
Table 5. Social media addiction scale-student form’s reliability
coefficients
Factors Item No Peer-to-Peer Correlations
Sperman
Brown
Guttmann
Split-Half
Cronbach
Alpha
Virtual Tolerance 5 .70 .82 .82 .81
Virtual
Communication 9 .69 .81 .81 .81
Virtual Problem 9 .75 .86 .74 .86
Virtual
Information 6 .66 .79 .79 .82
Total 29 .83 .91 .90 .93
As shown in Table 5, Peer-to-Peer Correlations was calculated
as .83; Sperman Brown reliability coefficient was
calculated as .91; Guttmann Split-Half value was calculated as
.90, and Cronbach Alpha reliability coefficient
was calculated as .93. On the other hand, it is seen that the co-
half correlations for the factors vary between .66
to .75; Sperman Brown values vary between .79 and .86;
Guttmann Split-Half values vary between .79 and .82
and Cronbach Alpha values vary between .81 and .86. The data
on reliability coefficients show that all
dimensions and sub-dimensions have reliable results.
Stability Level
The stability characteristics of the scale were examined and the
test-retest method was used. This study group
was conducted with the participation of 224 students who did
not participate in the previous stages of the scale.
In the study group, the time between the two applications was
determined as four weeks. Table 6 summarizes the
findings that show the test-retest results for the general scale
and the factors.
Table 6. Social media addiction scale-test-retest reliability
coefficient of student form
Second Application
Virtual
Tolerance
Virtual
Communication
Virtual
Problem
Virtual
Information
Total
Factor1 Virtual Tolerance .83(**)
Factor2 Virtual
Communication
.87(**)
Factor3 Virtual Problem .87(**)
Factor4 Virtual
Information
.81(**)
Total .94(**)
n=224; **p<.01
As can be seen in Table 6, the correlation coefficients between
the responses of the students were found to be
positively correlated between ,81 and ,87 (p<.01), despite the
four-week time interval. The high correlation value
(r=.94) for the overall scale is another indicator of stability.
Kalaycı (2009) shows that Pearson correlation
coefficient is .70, .89 and states that relation is high. According
to this, it can be said that the overall scale and
the items in each factor measurements produce stable
measurements.
According to the results of the reliability analysis, it can be said
that "Social Media Addiction Scale-Student's
Form (SMAS-SF)" is a valid and reliable scale.
CONCLUSIONS AND RECOMMENDATIONS
Since social networking deeply affects the daily lives of
students, it reveals the necessity of a measurement tool
to determine social media addiction. This study aimed to
develop the "Social Media Addiction Scale-Student
Form (SMAS-SF)" and to conduct validity and reliability
calculations of the scale. As a result of a literature
survey in Turkey, it has been observed that social media are
widely used among 12-22 year olds. However, no
scale or test was found to measure the addiction levels of
students in this age group. For this reason, it can be
thought that this measurement tool can provide important
contributions to the literature survey.
TOJET: The Turkish Online Journal of Educational Technology
– January 2018, volume 17 issue 1
Copyright © The Turkish Online Journal of Educational
Technology
179
In the development process of the scale, an item pool consisting
of 86 items was created in line with the
information obtained from the literature survey, and opinions of
field experts and a draft form was prepared.
Then, a draft scaleconsisting of 41 items was prepared and this
scale was applied to a participant group of 476
students between the ages of 12-22. The validity and reliability
studies were performed on the obtained data. The
first application of scale to which exploratory factor analysis
was performed by 476 participants attended in the
first application of scale, and 298 participants attended in the
second application in which confirmatory factor
analysis was performed. 224 participants took part in the test-
retest application within the scope of the reliability
study of the scale. A total of 998 students participated in the
development process of the scale.
Findings from validity and reliability studies show that the
scale is a valid and reliable measurement tool and that
can be used to identify students' social media addictions. The
developed scale consists of 29 items and 4 factors
(virtual tolerance, virtual communication, virtual problem and
virtual information) with Likert type five grades.
All the items on the scale are positive. When the relevant
literature survey is examined, it is seen that the results
of explanatory and confirmatory factor analysis of the SMAS-
SF are at an acceptable level.
Findings of validity and reliability of the scale indicate that
SMAS-SF is available to determine the social media
addiction of the students. In the later period, descriptive
research that explores the relationship between the
developed scale in this study and different variables may
contribute to the literature survey. It is thought that
with the developed scale, it is possible to determine the
addiction levels of students and help to take appropriate
measures according to the results.
As a final result of the study, it can be said that the current
scale can be used to determine social media
addictions of the students, aged 12-22 years. Validity and
reliability studies of the scale can be repeated in
different sample groups and other age ranges.
There are a few assessment tools to determine the social media
addiction of university students in Turkish
literature. This assessment tool is different from other
assessment tools and contributes to the relevant literature
in that it aims at determining the social media addiction levels
of 12-22 year-old students.
Social Media Addiction Scale Student Form (SMAS-SF)
EXPLANATION: Different states related to social media use on
the
internet are given below. You are asked to read each expression
carefully
and put (X) for the expression you deem the most correct for
you. Do not
skip any item and mark each state please.
Strongly disagree
Disagree
Neither agree nor disagree
Agree
Strongly agree
1 I am eager to go on social media.
2 I look for internet connectivity everywhere so as to go on
social media.
3 Going on social media is the first thing I do when I wake up
in the
morning.
4 I see social media as an escape from the real world.
5 A life without social media becomes meaningless for me.
6 I prefer to use social media even there are somebody around
me.
7 I prefer the friendships on social media to the friendships in
the real
life.
8 I express myself better to the people with whom I get in
contact on
social media.
9 I am as I want to seem on social media.
10 I usually prefer to communicate with people via social
media.
11 Even my family frown upon, I cannot give up using social
media.
12 I want to spend time on social media when I am alone.
13 I prefer virtual communication on social media to going out.
14 Social media activities lay hold on my everyday life.
15 I pass over my homework because I spend much time on
social media.
16 I feel bad if I am obliged to decrease the time I spend on
social media.
17 I feel unhappy when I am not on social media.
18 Being on social media excites me.
19 I use social media so frequently that I fall afoul of my
family.
20 The mysterious world of social media always captivates me.
21 I do not even notice that I am hungry and thirsty when I am
on social
TOJET: The Turkish Online Journal of Educational Technology
– January 2018, volume 17 issue 1
Copyright © The Turkish Online Journal of Educational
Technology
180
media.
22 I notice that my productivity has diminished due to social
media.
23 I have physical problems because of social media use.
24 I use social media even when walking on the road in order to
be
instantly informed about developments.
25 I like using social media to keep informed about what
happens.
26 I surf on social media to keep informed about what social
media groups
share.
27 I spend more time on social media to see some special
announcements
(e.g. birthdays).
28 Keeping informed about the things related to my courses
(e.g.
homework, activities) makes me always stay on social media.
29 I am always active on social media to be instantly informed
about what
my kith and kin share.
REFERENCES
Akın, A., Özbay, A., & Baykut, İ. (2015). Sosyal medya
kullanımı ölçeği’nin türkçe formu’nun geçerliği ve
güvenirliği. The Journal of International Social Research,
8(38), 628-633.
Almenayes, J. (2015). Empirical analysis of religiosity as
predictor of social media addiction. Journal of Arts &
Humanities, 4(10), 44-52.
Al-Menayes, J. (2015). Psychometric properties and validation
of the arabic social media addiction scale.
Journal of Addiction, 2015, 1-6.
Andreassen, C.S., Torsheim, T., Brunborg, G.S. & Pallesen, S.
(2012). Development of a facebook addiction
scale 1, 2. Psychological Reports, 110(2), 501-517.
Arnett, J.J. (2004). Emerging Adulthood: The Winding Road
from the Late Teens through the Twenties. (First
ed.). Oxford University Press, New York.
Arnett, J.J. (2007). Emerging adulthood: What is it, and what is
it good for? Child Dev Pers 1 (2), 68-73.
Balcı, A. (2009). Sosyal Bilimlerde Araştırma: Yöntem, Teknik
ve İlkeler. Ankara: PegemA
Banyai, F., Zsila, A., Kiraly, O., Maraz, A., Elekes, Z.,
Griffiths, M.D., Cecilie, SA. & Demetrovics, Z. (2017).
Problematic social media use: results from a large-scale
nationally representative adolescent sample.
PLoS ONE, 12(1), 1-13.
Bianchi, A. & Philips, J. G. (2005). Psychological predictors of
problem mobile phone use. Cyberpsychology
and Behavior, 8, 39-51.
Büyüköztürk, Ş. (2002). Sosyal Bilimler İçin Veri Analizi El
Kitabı. Ankara: Pegem A Yayıncılık.
Büyüköztürk, Ş., Çakmak, E. K., Akgün, Ö. E., Karadeniz, Ş. &
Demirel, F. (2015). Bilimsel araştırma
yöntemleri. Ankara: Pegem Akademi.
Cavaglıon, G. (2009). Cyber-porn dependence: voices of
distress in an Italian internet self-help community.
International Journal of Mental Health and Addiction, 7(2),
295–310.
Fidan, H. (2016). Mobil bağımlılık ölçeği'nin geliştirilmesi ve
geçerliliği: Bileşenler modeli yaklaşımı. Addicta:
The Turkish Journal on Addictions, 3, 433–469.
Fisher, S. (1994). Identifying video game addiction in children
and adolescents. Addictive Behaviors, 19, 545-
553.
Grıffıths, M.D. & Hunt, N. (1998). Dependence on computer
games by adolescents. Psychological Reports,
82(2), 475–480.
Griffiths M.D. (2012). Facebook addiction: Concerns, criticism,
and recommendations a response to Andreassen
and colleagues. Psychological Reports, 110(2), 518-520.
Griffiths, M.D. (2012). Social networking addiction. Emerging
themes and ıssues. 4(5), 1-2. Retrieved from
http://dx.doi.org/10.4172/2155-6105.1000e118
Griffiths, M. D. (1995). Technological addictions. Clinical
Psychology Forum, 76, 14–19.
Griffiths, M.D., Kuss, D.J. & Demetrovics, Z. (2014). Social
networking addiction: An overview of preliminary
findings. Behavioral Addictions Criteria, Evidence, and
Treatment. New York: Elsevier; ss. 119-141.
Gündoğdu, R. (2016). Gelişim Psikolojisi. C. Şahin (Ed.).
Eğitim Psikolojisi: Gelişim-Öğrenme-Öğretim içinde
(s. 29-45). Ankara: Nobel.
Hall A. S., ve Parsons, J. (2001). Internet addiction: College
student case study using best practices in cognitive
behavior therapy. Journal of Mental Health Counsiling, 23(4),
312-327.
Harris, P., Nagy, S., & Vardaxis, N. (2014). Mosby's Dictionary
of Medicine, Nursing and Health Professions-
Australian & New Zealand Edition. Elsevier Health Sciences.
Horzum, M. B. (2011). Examining computer game addiction
level of primary school students in terms of
different variables. Education and Science, 36 (159), 56-68.
TOJET: The Turkish Online Journal of Educational Technology
– January 2018, volume 17 issue 1
Copyright © The Turkish Online Journal of Educational
Technology
181
Internet World Stats (2017). Internet world stats. Usage and
population statistics. Retrieved
http://www.internetworldstats.com/stats.htm.
Jöreskog, K. & Sörbom, D. (1993). Lisrel 8: Structural equation
modeling with the simplis command language.
USA: Scientific Software International.
Kalaycı, Ş. (2009). SPSS Uygulamalı Çok Değişkenli İstatistik
Teknikleri. Ankara: Asil Yayınevi.
Karasu, M. ve Arıkan, D. (2016). Öğretmen adaylarının sosyal
medya kullanım durumları ve medya
okuryazarlık düzeyleri arasındaki ilişkinin incelenmesi. Ege
Eğitim Dergisi, 17(2), 549 – 566.
Kırık, A.M., Arslan, A., Çetinkaya, A. & Gül, M. (2015). A
quantitative research on the level of social media
addiction among young people in Turkey. International Journal
of Science Culture and Sport (IntJSCS),
3(3), 108-122.
Kline, R. B. (2005). Principles and practice of structural
equation modeling. New York: The Guilford Press.
Kuss, D. ve Griffiths, M. (2012). Internet gaming addiction: a
systematic review of empirical research.
International Journal of Mental Health Addiction, 10, 278-296.
Morahan-Martin J. & Schumacher, P. (2000). Incidence and
correlates of pathological internet use among
college students. Computers in Human Behavior, 16(1), 13-29.
Pohlmann, J. T. (2004). Use and interpretation of factor analysis
in The Journal of Educational Research: 1992-
2002. The Journal of Educational Research, 98(1), 14-22.
Raykov, T., & Marcoulides, G.A. (2006). A first course
structural equation modeling. New Jersey: Lawrence
Erlbaum Assocation Inc.
Russell, D. W. (2002). In search of underlying dimensions: The
use (and abuse) of factor analysis. Personality
and Social Psychology Bulletin, 28, 1629–1646.
Saaid, S.A., Al-Rashid, N.A.A. & Abdullah, Z. (2014). The
impact of addiction to twitter among university
students. Future Information Technology. New York: Springer;
ss. 231-236.
Schwartz, M.F. & Southern, S. (2000). Compulsive cybersex:
the new tea room. Sexual Addiction &
Compulsivity 7(1-2), 127–144.
Seçer, İ. (2013). SPSS ve LISREL ile pratik veri analizi ve
raporlaştırma. Ankara: Anı Yayıncılık.
Shapira, N.A., Goldsmith, T.D., Keck, P.E. Jr., Khosla, U.M., &
McElroy, S.L. (2000), Psychiatric features of
individuals with problematic internet use. Journal of Affective
Disorders,57(1-3), 267-272.
Sönmez, V. & Alacapınar, G.F. (2014). Örneklendirilmiş
Bilimsel Araştırma Yöntemleri. Ankara: Anı
Yayıncılık.
Şahin, C. (2011). An analysis of internet addiction levels of
individuals according to various variables. The
Turkish Online Journal of Educational Technology, 10 (4), 60-
66.
Şahin, C. ve Beydoğan, H.Ö. (2016). Öğretmenlerin öğrencileri
tanıma yeterliliği ölçeği. 21. Yüzyılda Eğitim ve
Toplum-Eğitim Bilimleri ve Sosyal Araştırmalar Dergisi, 5(14),
177-198.
Şahin, C. ve Yağcı, M. (2017). Sosyal medya bağımlılığı ölçeği-
yetişkin formu: Geçerlik ve güvenirlik
çalışması. Ahi Evran Üniversitesi Eğitim Fakültesi Dergisi,
18(1), 523-538.
Tekvar, S.O. (2012). Yeni medya ve halkla ilişkilerde dönüşüm:
farklı kurumsal yapılarda halkla ilişkiler algısı
ve sosyal paylaşım ağları. (Yayımlanmamış doktora tezi,
Ankara Üniversitesi Eğitim Bilimleri
Enstitüsü).
Turel, O. & Serenko, A. (2012). The benefits and dangers of
enjoyment with social networking websites.
European Journal of Information Systems, 21, 512–528.
Tutgun Ünal, A. & Deniz, L. (2015). Development of the social
media addiction scale. Online Academic
Journal of Information Technology, 6(21), 52-70.
Türkiye İstatistik Kurumu (TUİK) (2016). Hane Halkı Bilişim
Teknolojileri Kullanımı Araştırması.
http://www.tuik.gov.tr
Tüzer, V. (2011). İnternet, siberseks ve sadakatsizlik.
Psikiyatride Güncel Yaklaşımlar, 3 (1), 100-116.
van den Eijnden, R.J.J.M., Lemmens, J.S. & Valkenurg, P.M.
(2016). The social media disorder scale.
Computers in Human Behavior, 61, 478-487.
Veneziano, L. & Hooper J. (1997). A method for quantifying
content validity of health-related questionnaires.
American Journal of Health Behavior, 21(1), 67-70.
Wang, W. (2001). Internet dependency and psychosocial
maturity among college students. International Journal
Human Computer Study, 55(6), 919-938.
Wegmann E., Stodt B. & Brand M. (2015). Addictive use of
social networking sites can be explained by the
interaction of internet use expectancies, internet literacy, and
psychopathological symptoms. Journal of
Behavioral Addictions, 4(3), 155-162.
Xu, H., Tan, B.C.Y. (2012). Why do I keep checking facebook:
Effects of message characteristics on the
formation of social network services addiction. Thirty Third
International Conference on Information
Systems,1-12,Orlando.Retrieved
http://aisel.aisnet.org/cgi/viewcontent.cgi?article=1216&
context=icis2012
TOJET: The Turkish Online Journal of Educational Technology
– January 2018, volume 17 issue 1
Copyright © The Turkish Online Journal of Educational
Technology
182
Yang, S., & Tung, C. (2007). Comparison of Internet addicts
and non-addicts in Taiwanese high schools,
Computers in Human Behavior, 23, 79-96.
Young K. S. (2004). Internet addiction: A new clinical
phenomenon and its consequences. American Behaviour
Scientist, 48, 402- 415.
Reproduced with permission of copyright owner. Further
reproduction
prohibited without permission.
46
The Role of Facebook Affirmation towards Ideal Self-Image and
Self-Esteem
Yokfah Isaranon1
Although research has found that people often use Facebook to
present their ideal
image, it is not clear whether Facebook can bring out the best
self of its users. The
present research investigated whether Facebook would help its
users feel their best
and have higher self-esteem through affirmation of the ideal self
on Facebook. In
particular, such Facebook affirmation might be most beneficial
among moderate
users. Using a correlational research design, 330 Thai
participants (aged 18-35 years)
were recruited through Facebook advertisements and asked to
complete a set of online
questionnaires. Using a moderated mediation analysis, results
showed that Facebook
affirmation had a positive effect on self-esteem (β = .14, p <
.05). Such an effect was
partially mediated by actual and ideal-self congruence (β = .02,
p < .05). In addition,
time spent on Facebook moderated both direct and indirect
effects of Facebook
affirmation on self-esteem. The direct effect of Facebook
affirmation was more
pronounced among moderate users (β = .24, p < .05) than heavy
users (β = .02, ns).
Moreover, the indirect effect of Facebook affirmation was more
pronounced among
moderate users (β = .04, p < .05) than light users (β = -.00, ns).
These results supported
hypotheses that users who experienced Facebook affirmation
reported having
increased levels of self-esteem as a result of experiencing actual
and ideal-self
congruence. Specifically, moderate users benefited mostly from
using Facebook,
compared with light and heavy users. Key findings from this
study could contribute
to literature on social media behavior and the benefits from
using Facebook.
Keywords: Facebook, affirmation, ideal self, time spent
With over 2.27 billion users worldwide in 2018 (The Statistics
Portal, 2019), Facebook
has become a part of people’s lives in this generation. Not only
has it enabled users to control
the pace of conversations (Boyd & Ellison, 2008), manage their
physical appearance during
their social interactions (Amichai-Hamburger, 2007), or find a
perfect romantic partner
(Sangkapreecha, 2015), but Facebook has also provided an ideal
space for people to present
their best self (Amichai-Hamburger & Hayat, 2013; Lee-Won,
Shim, Joo, & Park, 2014).
Unsurprisingly, previous research found that many people
utilized Facebook for self-enhancing
benefits (Kim & Lee, 2011; Malik, Dhir, & Nieminen, 2016;
Tosun, 2012).
Prior research on social media has shown that some Facebook
activities (such as self-
description on Facebook) help its users construct and express
their ideal self (Zhao, Grasmuck,
& Martin, 2008). Moreover, with its unique characteristics,
including privacy settings, and
information filtering, Facebook seems to elicit positive
interactions (Lin, Tov, & Qiu, 2014).
Consequently, expected positive feedback from others may
likely occur and play an important
role in fulfilling such ideal self-projection. This process is
consistent with that of behavioral
affirmation which suggests that receiving behavioral affirmation
from romantic partners is
essential in assisting movement towards the ideal self of one
another, yielding both life and
relationship satisfaction (Kumashiro, Rusbult, Finkenauer, &
Stocker, 2007). Once applied to
Facebook, it is highly likely that people may act out their ideal
self on Facebook and attain
positive affirmation in return.
1 Lecturer, Faculty of Psychology, Chulalongkorn University,
Thailand. Email: [email protected]
The Journal of Behavioral Science
Copyright © Behavioral Science Research Institute
2019, Vol. 14, Issue 1, 46-62
ISSN: 1906-4675 (Print), 2651-2246 (Online)
Ideal Self on Facebook
47
However, spending extensive time on or being addicted to
Facebook may lead to mental
health problems. For example, excessive use of Facebook was
found to lower levels of self-
esteem and life satisfaction (Błachnio, Przepiorka, & Pantic,
2016; Faraon & Kaipainen, 2014).
Similarly, it increased the risk of other mental problems such as
anxiety, depression, and eating
disorders (Frost & Rickwood, 2017). Therefore, the extent to
which individuals benefit from
using Facebook may depend on their time spent on Facebook. In
particular, moderate usage is
expected to be most beneficial because the decent amount of
time allows users to have positive
interaction with others, without overexposure to other negative
outcomes (Thuseethan &
Kuhanesan, 2014).
Drawing on research about behavioral affirmation (Rusbult,
Finkel, & Kumashiro,
2009), best self-presentation on Facebook (Lee-Won et al.,
2014), and mental health concerns
such as low self-esteem among heavy Facebook users
(O'Sullivan & Hussain, 2017), this study
examines whether Facebook can provide affirmation of the ideal
self and promote actual and
ideal-self congruence to its users. Specifically, an overlap
between actual and ideal self may
increase users’ self-esteem as it brings a sense of self-worth
through accomplishing an ultimate
goal. Yet, because heavy usage of Facebook can lead to lower
self-esteem and other negative
outcomes (Pantic, 2014), it is expected that this affirmation of
the ideal-self process should
mostly benefit the moderate users. This study mainly
investigated such process in a Thai
sample. Since the nationwide number of Facebook users is
approximately 47 million users,
Thailand is ranked among the countries with the most Facebook
users worldwide (Thaitech,
2019). Therefore, a Thai sample may represent more active
users of Facebook.
Facebook and Ideal Self
Facebook is a social networking site that provides a large
number of activities in which
users can engage. Facebook users can choose to update their
Facebook statuses, share their
pictures or videos, leave comments on their friends’ profiles,
tag other people, and approve the
tags added by others to their own posts, as well as send instant
messages (Boyd & Ellison,
2008). Furthermore, Facebook users have full control over their
personal information and
privacy as they can set their profiles as private or public and
filter whom they would like to
include in their social networks (such as friending or
unfriending). Therefore, these functions
of Facebook not only offer users with opportunities to establish
or maintain connection with
others within a bounded system (Ellison, Steinfield, & Lampe,
2007), but also facilitate users’
identity construction (Tosun, 2012) and help project users’ ideal
self (Seidman, 2013; Zhao et
al., 2008).
Photo sharing and wall posting are examples of constructing and
expressing ideal self
on Facebook. As Facebook enables users to manage the
attractiveness of their image presented
within their networks, individuals can post appealing photos to
present their best side (Amichai-
Hamburger & Hayat, 2013; Zhao et al., 2008). For instance,
users can choose to post photos of
their happy moments during vacation. This idea is consistent
with the results found in Siibak’s
(2009) study, which showed that youngsters selected an ideal
photo as a profile image to form
a positive impression to others in order to achieve their ideal
goal as being popular.
Additionally, the advancement of digital photography
technology allows individuals to beautify
their photos as they wish to be perceived (Amichai-Hamburger,
2007; Amichai-Hamburger &
Hayat, 2013). Consequently, individuals might exercise their
control over physical appearance
by choosing an attractive profile picture on their web page just
to look appealing in others’
Yokfah Isaranon
48
perceptions. Thus, at some point, users are capable of
controlling their image and constructing
their best self on Facebook.
Facebook Affirmation
Literature on close relationships and motivation suggests that
significant others are very
important for facilitating personal growth and development
(Kumashiro, Rusbult, Wolf, &
Estrada, 2006). In particular, people who consistently receive
behavioral affirmation from their
loved ones over a long period of time are capable of moving
closer to their ideal selves or
reaching an ultimate goal (Drigotas, Rusbult, Wieselquist, &
Whitton, 1999). The term
“Michelangelo phenomenon” has been coined to describe this
process as it was inspired by an
influential artist, Michelangelo Buonarroti, who believed
sculpturing was to uncover the beauty
hidden inside a block of stone (Rusbult, Finkel, et al., 2009). As
such, in relationships, partners
who help each other bring out the best side of one another can
eventually reach their own ideal
self (Kumashiro et al., 2007).
Even though the concept of affirmation of the ideal self was
initially proposed in the
context of romantic relationships (Drigotas et al., 1999;
Rusbult, Kumashiro, Kubacka, &
Finkel, 2009), it is possible to apply to other contexts involving
mutual interaction such as
Facebook. This is partly because most activities on Facebook
such as sharing, clicking like, and
instant messaging facilitate supportive interactions and elicit
positive feedback from others
(Boyd & Ellison, 2008; Manago, Taylor, & Greenfield, 2012).
Specifically, Facebook users are
likely to receive likes or positive comments from their
Facebook friends (Chin, Lu, & Wu,
2015), which may in turn help affirm their ideal selves.
Moreover, the notion that people have
freedom and power to control the contents or whom they desire
to share those contents with
(Boyd & Ellison, 2008) may enhance the possibility of their
ideal characteristics to been noticed
and affirmed (Wong, 2012). Specifically, as Facebook users can
disclose their personal
information to their friends via status updating or photo sharing,
their friends are able to know
their ideal self or aspiration. Therefore, it is highly likely that
individuals may experience
affirmation of the ideal self on Facebook or “Facebook
affirmation”.
It is noteworthy that affirmation of the ideal self differs from
self-affirmation. The self-
affirmation theory suggests that individuals are motivated to
maintain their self-integrity by
reflecting on other values of life or responding defensively
(Sherman & Cohen, 2006),
especially when the self is threatened (Cohen & Sherman,
2007). However, Facebook
affirmation in this research refers to the perception of Facebook
users that other people on
Facebook regard them in ways consistent to their ideal selves,
regardless of whether the self-
threat is present or not. Specifically, ideal self in this case
refers to the characteristics that
Facebook users ideally wish to have−not what they already
possess. Thus Facebook affirmation
can occur only when their ideal qualities or attributes exhibited
on Facebook are consistently
affirmed by others. Therefore, Facebook affirmation seems to be
a route for self-improvement
or personal development, rather than self-verification or self-
validation.
Modified from the Michelangelo phenomenon model, the
present research proposed that
receiving Facebook affirmation could lead to actual and ideal-
self congruence. Prior research
found that individuals who experienced affirmation of the ideal
self from their partner reported
moving closer to their ideal selves (Kumashiro et al., 2006;
2007). This suggests that movement
towards the ideal self is a product of the affirmation of the ideal
self process. According to this,
Ideal Self on Facebook
49
those who receive Facebook affirmation may also perceive that
their actual selves become
closer to their ideal selves on Facebook or report higher levels
of actual and ideal-self
congruence. Thus, it was predicted that:
H1: Facebook affirmation would positively predict actual and
ideal-self congruence.
In addition, research has shown that self-esteem or a sense of
self-worth can be
interpreted as an outcome of congruence between the actual and
ideal self (Rogers, 1959).
Given Facebook affirmation should yield congruence between
actual and ideal self, they should
also increase levels of self-esteem. That is, being affirmed and
achieving one’s own ideal self
on Facebook should bring about a positive sense of self-view.
Moreover, recent research found
that receiving likes or positive comments from friends on
Facebook increased levels of
happiness because such experience represents an act of caring
or being interested from their
friends (Zell & Moeller, 2018). Thus, it is highly predictable
that receiving Facebook
affirmation may also increase a positive sense of self-view. In
particular, actual and ideal-self
congruence may be a mediator of the association between
Facebook affirmation and self-
esteem. Therefore, it was predicted that:
H2: Facebook affirmation would positively predict self-esteem.
H3: Actual and ideal-self congruence would positively predict
self-esteem.
H4: Actual and ideal-self congruence would mediate the
relationship between Facebook
affirmation and self-esteem.
Time Spent on Facebook
Excessive use of Facebook can be a risk factor for mental
problems such as decreasing
self-esteem (Faraon & Kaipainen, 2014; Kross et al., 2013;
Pantic, 2014). One possible
explanation is related to the social comparison process. Heavy
users of Facebook have higher
chances to encounter information of others in their networks
(Vogel, Rose, Okdie, Eckles, &
Franz, 2015). Given that people are likely to share positive
things in their daily lives, heavy
users may have a higher tendency to witness a large amount of
positive experiences and may
perceive others to be in better situations than themselves
(Pantic et al., 2012). Thus, their sense
of self-worth can be lowered (Arad, Barzilay, & Perchick, 2017;
Pantic, 2014).
On the other hand, moderate Facebook usage has been found to
enhance mental health
and well-being. Hobbs, Burke, Christakis, and Fowler (2016)
compared 12 million Facebook
users to nonusers in order to examine the association between
social interactions and longevity.
Their findings showed that balanced levels of interaction on
Facebook were associated with
lower risks of a number of health problems. In particular, such
benefits were due to social
connection, which has been found to play an important role in
improving well-being (Burke,
Marlow, & Lento, 2010; Sandstrom & Dunn, 2014) and
increasing self-esteem (Steinfield,
Ellison, & Lampe, 2008; Valkenburg, Peter, & Schouten, 2006).
Thus, it is possible that the
extent to which Facebook can lead to positive outcomes,
including Facebook affirmation and
actual and ideal-self congruence, may depend on the time spent
on Facebook. In particular,
moderate usage might be an optimal amount of time for users to
attain positive experiences and
avoid negative consequences.
Yokfah Isaranon
50
Taken together with the proposed model of Facebook
affirmation, time spent on
Facebook should moderate the relationship between Facebook
affirmation and self-esteem.
Moreover, it should moderate the relationship between actual
and ideal-self congruence and
self-esteem as shown in Figure 1. Hence, it was predicted that:
H5: Time spent on Facebook would moderate the relationship
between Facebook
affirmation and self-esteem, such that the relationship between
Facebook affirmation and self-
esteem would be stronger in the moderate use group, as
compared to other groups.
H6: Time spent on Facebook would moderate the relationship
between actual and ideal-
self congruence and self-esteem, such that the relationship
between actual and ideal-self
congruence and self-esteem would be stronger for the moderate
use group, as compared to other
groups.
Figure 1. Hypothesized model
Method
Participants
Participants were recruited through Facebook advertisement
between September 2017
and January 2018 using convenience sampling. The Facebook
advertisement was designed to
target active Thai Facebook users aged between 18-35. The age
range was chosen to represent
the Millennials or Generation Y, a cohort which grew up using
social media (Bergman,
Fearrington, Davenport, & Bergman, 2011). Overall, there were
three hundred and thirty Thai
Facebook users who volunteered to participate in this study
(122 males, 208 females, Meanage
= 20.79).
Research Design and Procedure
A correlational research method was used. The present research
was granted approval
from Ratchadaphiseksomphot Endowment Fund, Chulalongkorn
University. Once it was
reviewed and received ethics clearance (COA No. 155/2560)
through a Research Ethics
Committee at Chulalongkorn University, the Facebook
advertisement was launched.
Participants who were interested in taking part in the study were
asked to complete a set of
online questionnaires and inform their demographics
information. All participants were also
asked to grant their consent to participate in the study before
completing the questionnaires.
Ideal Self on Facebook
51
Measures
Facebook affirmation. Participants were instructed to complete
a Thai version of
Facebook affirmation scale developed by Isaranon (2016). The
scale consisted of 4 items and
was originally modified from scales used in Kumashiro et al.
(2006). An example of the items
was “When I’m on Facebook, I feel free to display the kind of
person I ideally want to become”
(1 = strongly disagree and 7 = strongly agree) (α = .72).
Actual and ideal-self congruence. A Thai version of actual and
ideal-self congruence
scale developed by Isaranon (2016) was used. The scale was
also modified from the
Michelangelo phenomenon model (Kumashiro et al.,2006).
Participants were presented with
one item comprised of nine pairs of circles portraying how close
their actual self is to their ideal
self. The circle on the left represents their actual self and the
one on the right represents their
ideal self as shown in Figure 2.
Figure 2. Actual and ideal-self congruence measure
Participants were then asked to indicate which one of each pair
represented themselves
the most when they were on Facebook (1 = their actual and
ideal selves do not overlap at all
and 9 = their actual and ideal selves are the same).
Self-esteem. Participants were asked to complete a Thai version
of Rosenberg’s (1965)
self-esteem scale developed by Isaranon (2016). This measure
consisted of 10 items assesses
individual difference in the extent to which people report self-
esteem levels, such as “On the
whole, I am satisfied with my life” (1 = strongly disagree and 7
= strongly agree) (α = .76).
Time spent on Facebook. To assess time spent on Facebook,
participants were asked
to indicate the duration of time spent on Facebook in each day
(0 = less than 10 minutes, 1 =
10-30 minutes, 2 = 31-60 minutes, 3 = 1-2 hours, 4 = more than
2 hours but less than 3 hours,
5 = more than 3 hours). According to findings from a research
by Primack et al. (2017), people
who spent more than 2 hours per day logging onto social
networking sites were more likely to
experience negative outcomes such as isolation, compared to
those who spent less than 30
minutes a day. In particular, prior research defined those who
spent more than 2 hours per day
as heavy users (Bélanger, Akre, Berchtold, & Michaud, 2011;
Ryan, Reece, Chester, & Xenos,
2016) while those who spent from 31 minutes to 2 hours per day
were defined as moderate
users and those who spent 30 minutes or less per day were
defined as light users (Ryan et al.,
2016). Thus, time spent on Facebook in this study were
categorized into 3 groups based on such
findings: 1) light use = 30 minutes/day or less; 2) moderate use
= between 31 minutes to 2
hours/day; and 3) and heavy use = more than 2 hours/day.
Yokfah Isaranon
52
Data Analysis
This study sought to explore whether Facebook affirmation
could predict self-esteem
via actual and ideal-self congruence. Moreover, it attempted to
investigate whether the effects
of both Facebook affirmation and actual and ideal-self
congruence on self-esteem were
moderated by time spent on Facebook. Thus, the PROCESS
macro program (Hayes, 2018) was
used to test such moderated-mediation model of the
relationships among Facebook affirmation,
actual and ideal-self congruence, self-esteem, and time spent on
Facebook. In addition, two
dummy variables were created; light (light use = 1 and
otherwise = 0) and heavy (heavy use =
1 and otherwise = 0), whereas moderate use was treated as a
reference group. Aiken and West
(1991) suggested that a comparison group in three dummy
variable coding systems is a group
that is assigned a value of 0 for all dummy variables. Therefore,
the light use group compares
the light users with the moderate users, and the heavy use group
compares the heavy users with
the moderate users.
Results
Descriptive Statistics
In this study, time spent on Facebook were categorized into 3
groups; there were 94
light users who use Facebook 30 minutes/day or less, 115
moderate users who use Facebook
between 31 minutes and 2 hours/day, and 121 heavy users who
use Facebook more than 2
hours/day. Means, standard deviations, and bivariate
correlations among study variables of the
three groups are displayed in Table 1.
Table 1
Means, Standard Deviations, and Bivariate Correlations of
Study Variables
Variables 1 2 3 M SD
Light use (n = 94)
1. Facebook affirmation - 4.29 0.93
2. Actual and ideal-self congruence .07 - 5.63 2.35
3. Self-esteem .14 .00 - 4.51 0.69
Moderate use (n = 115)
1. Facebook affirmation - 4.44 0.88
2. Actual and ideal-self congruence .12 - 5.76 2.08
3. Self-esteem .24* .30** - 4.71 0.81
Heavy use (n = 121)
1. Facebook affirmation - 4.55 0.93
2. Actual and ideal-self congruence .17† - 6.13 2.13
3. Self-esteem .03 .26** - 4.43 0.72
Note: †p < .10, *p < .05, **p < .01
One-way ANOVA was also conducted to explore whether there
were differences in
scores of Facebook affirmation, actual and ideal-self
congruence, and self-esteem among the
three groups. Results showed that although there were no
statistical differences in Facebook
affirmation (F(2,327) = 2.14, ns) and actual and ideal-self
congruence (F(2,327) = 1.61, ns),
there was a difference in self-esteem between group means
(F(2,327) = 4.47, p < .05). In
particular, moderate users reported higher levels of self-esteem
than heavy users (Mmoderate =
4.70, SDmoderate = 0.81, Mheavy = 4.42, SDheavy = 0.72, t =
2.92, p < .01).
Ideal Self on Facebook
53
Simple Mediation Analyses: Actual and ideal-self congruence as
a Mediator
Results from the PROCESS macro program supported
Hypotheses 1 and 2 that
Facebook affirmation was a significant predictor of actual and
ideal-
t(327) = 2.41, p < .05) and self-
p < .05). In addition, actual and
ideal-self congruence positively predicted self-
t(327) = 3.19, p < .01),
supporting Hypothesis 3. The mediation analysis also supported
the mediational hypothesis.
Using a bootstrap estimation approach with 10,000 samples, the
indirect effect coefficient of
Facebook affirmation on self-esteem via actual and ideal-self
.02, SE = .01, 95% CI = .00, .06, p < .05). In particular, the
effect of Facebook affirmation on
self-esteem reduced but remained significant after controlling
for the mediator, actual and ideal-
with partial mediation. Therefore,
these results supported Hypothesis 4 as shown in Figure 3.
Figure 3. Model of mediation of relationships between
Facebook affirmation and self-esteem
Note: *p < .05, **p < .01
Moderated Mediation Analyses: Time Spent on Facebook as a
Moderator
Time spent on Facebook (2 dummy variables: light use and
heavy use) was further tested
whether it moderated the relationship between Facebook
affirmation and self-esteem, and the
relationship between actual and ideal-self congruence and self-
esteem. The PROCESS macro
program was employed to test the moderated mediation model
17. Results revealed that heavy
use group (heavy vs. moderate) was a significant negative
predictor of self- -.39,
t(327) = -3.15, p < .01) while the light use group (light vs.
-.14, t(327)
= -1.04, ns). That is, heavy users reported lower levels of self-
esteem than moderate users. On
the contrary, there was no difference in self-esteem between
light and moderate users.
The standardized regression coefficients between Facebook
affirmation and self-esteem
nd ideal-
self congruence an self-esteem
Additionally, the heavy use group (heavy
vs. moderate) marginally moderated the relationship between
Facebook affirmation and self-
-.21, t(320) = -1.69, p < .10). However, it did not
moderate the relationship between
actual and ideal-self congruence and self- -.04,
t(320) = -0.32, ns). Conversely, the
light use group (light vs. moderate) did not moderate the
relationship between Facebook
affirmation and self- -.10, t(320) = -0.79, ns).
However, it moderated the
relationship between actual and ideal-self congruence and self-
-.30, t(320) = -2.32,
p < .05) as shown in Figure 4.
Yokfah Isaranon
54
Figure 4. Model of moderated mediation of relationships among
Facebook affirmation, actual
and ideal-self congruence, and self-esteem by using time spent
on Facebook (light
use, moderate use, and heavy use) as the moderator
Note: *p < .05, **p < .01
The significance of the conditional direct and indirect effects
was further explored.
Results showed that the conditional direct effect was significant
SE = .09, 95% CI = .05, .41, p < .05). On the contrary, levels of
self-esteem among light users
-.0612, .3177, ns) and heavy users
-.15, .19, ns), were not directly influenced by their Facebook
affirmation experience. The heavy
use group (heavy vs. moderate), unlike the light group (light vs.
moderate) moderated the
relationship between Facebook affirmation and self-esteem.
These findings indicated that
moderate users would have higher self-esteem than heavy users,
but not than light users, when
they experienced Facebook affirmation. Thus, these results
partially supported Hypothesis 5.
Additional results also revealed that the conditional indirect
effect was significant for
-.12, -.00, p < .05)
and hea
.02, 95% CI = .01, .09, p < .05), but not significant for light
-.00, SE = .01, 95% CI
= -.03=, .02=, ns) as shown in Table 2. Moreover, the index of
partial moderated mediation, a
test of equality of the conditional indirect effect for
dichotomous moderators, was significant
-.04, SE = .02, 95% CI = -.12, -.00,
p < .05), but not significant for
-.01, SE = .02, 95% CI = -.06, .03,
ns). These demonstrated that the
indirect effects were different for the light use group (light vs.
moderate), but indifferent for the
heavy use group (heavy vs. moderate), suggesting that the
moderated mediation only occurred
for the light use group. Thus, these results partially supported
Hypothesis 6.
Ideal Self on Facebook
55
Table 2
Direct and Indirect Influences of Facebook Affirmation on Self-
esteem by Using Time Spent on
Facebook as the Moderator
Conditional effects of Facebook
affirmation on self-esteem at different
levels of time spent on Facebook
Direct effect Indirect effect
Light use (30 mins/day or less) .13 -.06 .32 -.00 -.03 .02
Moderate use (31 mins - 2 hours/day) .23* .05 .41 .04* .01 .10
Heavy use (more than 2 hours/day) .02 -.15 .19 .03* .01 .09
Note: LLCI = lower level confidence interval; ULCI = upper
level confidence interval. Bootstrap sample size =
10,000; *p <.05.
In general, results mostly supported the hypotheses that
Facebook affirmation was
positively associated with Actual and ideal-self congruence,
both Facebook affirmation and
Actual and ideal-self congruence were positively associated
with increased self-esteem, the link
between Facebook affirmation and self-esteem was mediated by
Actual and ideal-self
congruence, and such mediation was more pronounced among
moderate users than light users,
but not than heavy users.
Discussion
Facebook, the most popular social networking site, has been
recognized as a platform
for positive self-presentation (Lee-Won et al., 2014), self-
expression (Seidman, 2013), and
social discourse (Thorkildsen & Xing, 2016). Yet, little is
known whether Facebook can bring
out the best self of users. This study, thus attempted to explore
the possibility of having
increased self-esteem through the process of ideal-self
affirmation on Facebook. Particularly, it
sought to investigate whether time spent on Facebook would
play a role in this process.
Modified from behavioral affirmation process, the current
research proposed a new idea
that Facebook might serve as a platform for bringing out the
best self of users by providing
affirmation of the ideal self. It used a correlational research
design to explore the process and
benefits of the affirmation of the ideal self on Facebook.
Results showed two important
findings. Firstly, Facebook users who received Facebook
affirmation experienced greater actual
and ideal-self congruence and had increased self-esteem.
Secondly, time spent on Facebook
affected these positive outcomes.
Facebook Affirmation and Actual and ideal-self congruence
Previous research has shown that consistently receiving
behavioral affirmation by
significant others in close relationships over a long period of
time facilitates movement towards
the ideal self (Kumashiro et al., 2007; Rusbult, Kumashiro, et
al., 2009). Consistently, this study
provides additional evidence that people can also feel affirmed
and experience greater actual
and ideal-self congruence on Facebook, where interaction can
be made either with close friends
or acquaintances. Given positive mutual interaction is the basis
element of affirmation of the
ideal-self process (Drigotas et al., 1999), and Facebook
interaction is mostly under the control
of users (such as deleting negative comments and sharing
selected contents with certain friends)
(Ellison et al., 2007), positive feedback is likely to be elicited.
This is in line with previous
Yokfah Isaranon
56
research which showed that presenting desired images or
characteristics on Facebook was
associated with receiving social support from friends (Wong,
2012). According to this,
Facebook users who present their ideal image or characteristics
in a way that they wish to be
perceived have a high tendency to attain positive feedback in
return. Thus, Facebook
affirmation is likely to occur.
It is worth noting that the ideal self on Facebook in this study
may apprehend only the
dimensions of positive self-description and physical appearance
on Facebook which users can
manage on their own. This is in accordance with previous
studies on self-presentation, which
mostly examined personal characteristics described on profile
photos of the users (Amichai-
Hamburger & Hayat, 2013; Seidman, 2013; Siibak, 2009; Zhao
et al., 2008). Additionally, the
sample in this study was between the age group of 18-30 years,
which the concern of physical
appearance is mostly predominant (Harris & Carr, 2001). Thus,
the effect of Facebook
affirmation found in this study may be partly because of the
match between Facebook activities
and sample’s interests.
Furthermore, this study was conducted in Thailand, a highly
collectivistic country where
expressing one’s own ideal self in face-to-face circumstances is
less discouraged, compared to
focusing on group’s goals (Triandis, 2001). As a result, there
may be a higher tendency for
people in collectivistic cultures to pursue an ideal self on
Facebook to compensate and balance
between their personal desires and social motives (Peters,
Winschiers-Theophilus, &
Mennecke, 2015).
Influences of Time Spent on Facebook
Although Facebook users reported that they came closer to their
ideal selves on
Facebook and had higher levels of self-esteem after receiving
Facebook affirmation, moderate
users (between 31 minutes and 2 hours a day) seemed to benefit
the most from such process.
That is, moderate Facebook users reported higher levels of self-
esteem when being affirmed on
Facebook. They also reported higher levels of self-esteem than
light users when experiencing
greater actual and ideal-self congruence. Moreover, moderate
users had higher levels of self-
esteem than heavy users.
Findings from this research are consistent with those found in
other studies examining
the association between time spent on Facebook and outcomes
in life. For example, prior
research showed that moderate use of Facebook was an optimal
amount of time that individuals
were able to establish social connection with others, yielding to
higher levels of self-esteem, an
indicator of social acceptance (Arad et al., 2017; Hobbs et al.,
2016; Pantic, 2014). Moreover,
medium usage also minimized to an extent which individuals
would extensively engage in
social comparison, causing unhappiness and life dissatisfaction
(Faraon & Kaipainen, 2014).
As such, results from the current study suggest that moderate
use seems to be most beneficial
for reaching an ideal self and elevating self-esteem.
Implications
Findings from the current research have several implications.
First, the notion that
affirmation of the ideal self could occur on Facebook
contributes to literature on ideal self and
Ideal Self on Facebook
57
goal pursuit that positive interaction which helps affirming an
ideal self of individual may not
limit to close relationships. This is due to the characteristics of
Facebook which allow users to
manage their contents and audience (those who provide
feedback) (Boyd & Ellison, 2008).
Thus, those who are unable to find supportive interaction from
their loved ones in face-to-face
circumstances may find Facebook as another venue for pursuing
an ideal self. Additionally,
Facebook may establish other functions that can be more helpful
for users to achieve their ideal
characteristics in relation to self-description or physical
appearance.
In addition, as the process of experience actual and ideal-self
congruencecould occur on
Facebook, there might be a campaign or encouragement for
using Facebook to attain such self-
improvement benefit or promote well-being. In particular,
Facebook might be used as a
practice-based platform for expressing the ideal self. The lack
of face-to-face interaction on
Facebook may assist people who feel constrained to exhibit
their personal aspirations in real
life, especially those in a collectivistic culture or those with
social anxiety, to try achieving their
personal goals without worrying about their physical appearance
or the negative feedback they
may attain.
Another significant implication is that Facebook usage
behaviors could also reflect the
need for ideal self-fulfillment. Although the majority of
research on social media show that
most people use Facebook for maintaining or establishing
relationship with others (Amichai-
Hamburger, 2007; Boyd & Ellison, 2008), the current study
provides additional evidence for
behavioral science research that people may also utilize
Facebook to achieve their ideal selves.
As such, behavior expressed on Facebook may not only
facilitate communication among
Facebook users for relationship maintenance, but also enable
them to act or behave in ways that
they desire to be regarded in order to achieve their ideal aspect
of self. This suggests that
Facebook usage reflects both intrapersonal and interpersonal
behaviors.
This study also found that moderate use between 31 minutes to
2 hours a day was the
most optimal level that users would benefit from using
Facebook, whereas heavy use for more
than 2 hours a day was harmful for users’ self-esteem. As such,
there might be a policy to
monitor time spent on Facebook. For example, Facebook might
develop a system in which a
notification of heavy use would pop up after reaching 2 hours of
Facebook usage per day. On
the other hand, an awareness of the danger of excessive use of
Facebook may be raised among
users. Specifically, young women who are highly concerned
with ideal image (Grabe, Ward, &
Running head PROJECT PLAN INCEPTION1PROJECT PLAN INCEPTION .docx

More Related Content

Similar to Running head PROJECT PLAN INCEPTION1PROJECT PLAN INCEPTION .docx

Replies Required for below Posting 1 user security awarene.docx
Replies Required for below  Posting 1  user security awarene.docxReplies Required for below  Posting 1  user security awarene.docx
Replies Required for below Posting 1 user security awarene.docx
sodhi3
 
Posting 1 Reply required for belowBusiness costs or risks of p.docx
Posting 1  Reply required for belowBusiness costs or risks of p.docxPosting 1  Reply required for belowBusiness costs or risks of p.docx
Posting 1 Reply required for belowBusiness costs or risks of p.docx
harrisonhoward80223
 
Bi in financial industry
Bi in financial industryBi in financial industry
Bi in financial industry
Souvik Chakraborty
 
Bi in financial industry
Bi in financial industryBi in financial industry
Bi in financial industry
Souvik Chakraborty
 
Information-Systems-and-Technology.pptx
Information-Systems-and-Technology.pptxInformation-Systems-and-Technology.pptx
Information-Systems-and-Technology.pptx
AhimsaBhardwaj
 
Using Information Technology to Engage in Electronic Commerce
Using Information Technology to Engage in Electronic CommerceUsing Information Technology to Engage in Electronic Commerce
Using Information Technology to Engage in Electronic Commerce
Ella Mae Ayen
 
Electronic Commerce
Electronic CommerceElectronic Commerce
Electronic Commerceellamee27
 
ENHANCING INFRASTRUCTURE SECURITY IN REAL ESTATE
ENHANCING INFRASTRUCTURE SECURITY IN REAL ESTATEENHANCING INFRASTRUCTURE SECURITY IN REAL ESTATE
ENHANCING INFRASTRUCTURE SECURITY IN REAL ESTATE
IJNSA Journal
 
Notes on Current trends in IT (1) (1).pdf
Notes on Current trends in IT (1) (1).pdfNotes on Current trends in IT (1) (1).pdf
Notes on Current trends in IT (1) (1).pdf
Karishma Chaudhary
 
Igs animation s;lide
Igs animation s;lideIgs animation s;lide
Igs animation s;lideRecommind
 
Impact of business intelligence on
Impact of business intelligence onImpact of business intelligence on
Impact of business intelligence on
ijejournal
 
Data foundation for analytics excellence
Data foundation for analytics excellenceData foundation for analytics excellence
Data foundation for analytics excellence
Mudit Mangal
 
Unlocking big data
Unlocking big dataUnlocking big data
Mis
MisMis
CS309A Final Paper_KM_DD
CS309A Final Paper_KM_DDCS309A Final Paper_KM_DD
CS309A Final Paper_KM_DDDavid Darrough
 
IRJET- Virtual Business Analyst using a Progressive Web Application
IRJET- Virtual Business Analyst using a Progressive Web ApplicationIRJET- Virtual Business Analyst using a Progressive Web Application
IRJET- Virtual Business Analyst using a Progressive Web Application
IRJET Journal
 
How Can Enterprise App Development Help Your Business Growth.pptx
How Can Enterprise App Development Help Your Business Growth.pptxHow Can Enterprise App Development Help Your Business Growth.pptx
How Can Enterprise App Development Help Your Business Growth.pptx
XDuce Corporation
 
Data Science - Part I - Sustaining Predictive Analytics Capabilities
Data Science - Part I - Sustaining Predictive Analytics CapabilitiesData Science - Part I - Sustaining Predictive Analytics Capabilities
Data Science - Part I - Sustaining Predictive Analytics Capabilities
Derek Kane
 
Data Analytics Training in Gurgaon.pdf
Data Analytics Training in Gurgaon.pdfData Analytics Training in Gurgaon.pdf
Data Analytics Training in Gurgaon.pdf
APTRON Gurgaon
 

Similar to Running head PROJECT PLAN INCEPTION1PROJECT PLAN INCEPTION .docx (19)

Replies Required for below Posting 1 user security awarene.docx
Replies Required for below  Posting 1  user security awarene.docxReplies Required for below  Posting 1  user security awarene.docx
Replies Required for below Posting 1 user security awarene.docx
 
Posting 1 Reply required for belowBusiness costs or risks of p.docx
Posting 1  Reply required for belowBusiness costs or risks of p.docxPosting 1  Reply required for belowBusiness costs or risks of p.docx
Posting 1 Reply required for belowBusiness costs or risks of p.docx
 
Bi in financial industry
Bi in financial industryBi in financial industry
Bi in financial industry
 
Bi in financial industry
Bi in financial industryBi in financial industry
Bi in financial industry
 
Information-Systems-and-Technology.pptx
Information-Systems-and-Technology.pptxInformation-Systems-and-Technology.pptx
Information-Systems-and-Technology.pptx
 
Using Information Technology to Engage in Electronic Commerce
Using Information Technology to Engage in Electronic CommerceUsing Information Technology to Engage in Electronic Commerce
Using Information Technology to Engage in Electronic Commerce
 
Electronic Commerce
Electronic CommerceElectronic Commerce
Electronic Commerce
 
ENHANCING INFRASTRUCTURE SECURITY IN REAL ESTATE
ENHANCING INFRASTRUCTURE SECURITY IN REAL ESTATEENHANCING INFRASTRUCTURE SECURITY IN REAL ESTATE
ENHANCING INFRASTRUCTURE SECURITY IN REAL ESTATE
 
Notes on Current trends in IT (1) (1).pdf
Notes on Current trends in IT (1) (1).pdfNotes on Current trends in IT (1) (1).pdf
Notes on Current trends in IT (1) (1).pdf
 
Igs animation s;lide
Igs animation s;lideIgs animation s;lide
Igs animation s;lide
 
Impact of business intelligence on
Impact of business intelligence onImpact of business intelligence on
Impact of business intelligence on
 
Data foundation for analytics excellence
Data foundation for analytics excellenceData foundation for analytics excellence
Data foundation for analytics excellence
 
Unlocking big data
Unlocking big dataUnlocking big data
Unlocking big data
 
Mis
MisMis
Mis
 
CS309A Final Paper_KM_DD
CS309A Final Paper_KM_DDCS309A Final Paper_KM_DD
CS309A Final Paper_KM_DD
 
IRJET- Virtual Business Analyst using a Progressive Web Application
IRJET- Virtual Business Analyst using a Progressive Web ApplicationIRJET- Virtual Business Analyst using a Progressive Web Application
IRJET- Virtual Business Analyst using a Progressive Web Application
 
How Can Enterprise App Development Help Your Business Growth.pptx
How Can Enterprise App Development Help Your Business Growth.pptxHow Can Enterprise App Development Help Your Business Growth.pptx
How Can Enterprise App Development Help Your Business Growth.pptx
 
Data Science - Part I - Sustaining Predictive Analytics Capabilities
Data Science - Part I - Sustaining Predictive Analytics CapabilitiesData Science - Part I - Sustaining Predictive Analytics Capabilities
Data Science - Part I - Sustaining Predictive Analytics Capabilities
 
Data Analytics Training in Gurgaon.pdf
Data Analytics Training in Gurgaon.pdfData Analytics Training in Gurgaon.pdf
Data Analytics Training in Gurgaon.pdf
 

More from jeanettehully

250-500  words APA format cite references  Check this scenario out.docx
250-500  words APA format cite references  Check this scenario out.docx250-500  words APA format cite references  Check this scenario out.docx
250-500  words APA format cite references  Check this scenario out.docx
jeanettehully
 
2 DQ’s need to be answers with Zero plagiarism and 250 word count fo.docx
2 DQ’s need to be answers with Zero plagiarism and 250 word count fo.docx2 DQ’s need to be answers with Zero plagiarism and 250 word count fo.docx
2 DQ’s need to be answers with Zero plagiarism and 250 word count fo.docx
jeanettehully
 
270w3Respond to the followingStress can be the root cause of ps.docx
270w3Respond to the followingStress can be the root cause of ps.docx270w3Respond to the followingStress can be the root cause of ps.docx
270w3Respond to the followingStress can be the root cause of ps.docx
jeanettehully
 
250 word response. Chicago Style citingAccording to Kluver, what.docx
250 word response. Chicago Style citingAccording to Kluver, what.docx250 word response. Chicago Style citingAccording to Kluver, what.docx
250 word response. Chicago Style citingAccording to Kluver, what.docx
jeanettehully
 
250+ Words – Strategic Intelligence CollectionChoose one of th.docx
250+ Words – Strategic Intelligence CollectionChoose one of th.docx250+ Words – Strategic Intelligence CollectionChoose one of th.docx
250+ Words – Strategic Intelligence CollectionChoose one of th.docx
jeanettehully
 
2–3 pages; APA formatDetailsThere are several steps to take w.docx
2–3 pages; APA formatDetailsThere are several steps to take w.docx2–3 pages; APA formatDetailsThere are several steps to take w.docx
2–3 pages; APA formatDetailsThere are several steps to take w.docx
jeanettehully
 
2LeadershipEighth Edition3To Madison.docx
2LeadershipEighth Edition3To Madison.docx2LeadershipEighth Edition3To Madison.docx
2LeadershipEighth Edition3To Madison.docx
jeanettehully
 
250 Word Resoponse. Chicago Style Citing.According to Kluver, .docx
250 Word Resoponse. Chicago Style Citing.According to Kluver, .docx250 Word Resoponse. Chicago Style Citing.According to Kluver, .docx
250 Word Resoponse. Chicago Style Citing.According to Kluver, .docx
jeanettehully
 
250 word mini essay question.Textbook is Getlein, Mark. Living wi.docx
250 word mini essay question.Textbook is Getlein, Mark. Living wi.docx250 word mini essay question.Textbook is Getlein, Mark. Living wi.docx
250 word mini essay question.Textbook is Getlein, Mark. Living wi.docx
jeanettehully
 
250 word discussion post--today please. Make sure you put in the dq .docx
250 word discussion post--today please. Make sure you put in the dq .docx250 word discussion post--today please. Make sure you put in the dq .docx
250 word discussion post--today please. Make sure you put in the dq .docx
jeanettehully
 
2By 2015, projections indicate that the largest category of househ.docx
2By 2015, projections indicate that the largest category of househ.docx2By 2015, projections indicate that the largest category of househ.docx
2By 2015, projections indicate that the largest category of househ.docx
jeanettehully
 
29Answer[removed] That is the house whe.docx
29Answer[removed]                    That is the house whe.docx29Answer[removed]                    That is the house whe.docx
29Answer[removed] That is the house whe.docx
jeanettehully
 
250 words discussion not an assignementThe purpose of this discuss.docx
250 words discussion not an assignementThe purpose of this discuss.docx250 words discussion not an assignementThe purpose of this discuss.docx
250 words discussion not an assignementThe purpose of this discuss.docx
jeanettehully
 
25. For each of the transactions listed below, indicate whether it.docx
25.   For each of the transactions listed below, indicate whether it.docx25.   For each of the transactions listed below, indicate whether it.docx
25. For each of the transactions listed below, indicate whether it.docx
jeanettehully
 
250-word minimum. Must use textbook Jandt, Fred E. (editor) Intercu.docx
250-word minimum. Must use textbook Jandt, Fred E. (editor) Intercu.docx250-word minimum. Must use textbook Jandt, Fred E. (editor) Intercu.docx
250-word minimum. Must use textbook Jandt, Fred E. (editor) Intercu.docx
jeanettehully
 
250-500  words APA format cite references  Check this scenario o.docx
250-500  words APA format cite references  Check this scenario o.docx250-500  words APA format cite references  Check this scenario o.docx
250-500  words APA format cite references  Check this scenario o.docx
jeanettehully
 
250+ Words – Insider Threat Analysis Penetration AnalysisCho.docx
250+ Words – Insider Threat Analysis  Penetration AnalysisCho.docx250+ Words – Insider Threat Analysis  Penetration AnalysisCho.docx
250+ Words – Insider Threat Analysis Penetration AnalysisCho.docx
jeanettehully
 
250 wordsUsing the same company (Bank of America) that you have .docx
250 wordsUsing the same company (Bank of America) that you have .docx250 wordsUsing the same company (Bank of America) that you have .docx
250 wordsUsing the same company (Bank of America) that you have .docx
jeanettehully
 
250 mini essay questiontextbook Getlein, Mark. Living with Art, 9.docx
250 mini essay questiontextbook Getlein, Mark. Living with Art, 9.docx250 mini essay questiontextbook Getlein, Mark. Living with Art, 9.docx
250 mini essay questiontextbook Getlein, Mark. Living with Art, 9.docx
jeanettehully
 
22.¿Saber o conocer…   With a partner, tell what thes.docx
22.¿Saber o conocer…   With a partner, tell what thes.docx22.¿Saber o conocer…   With a partner, tell what thes.docx
22.¿Saber o conocer…   With a partner, tell what thes.docx
jeanettehully
 

More from jeanettehully (20)

250-500  words APA format cite references  Check this scenario out.docx
250-500  words APA format cite references  Check this scenario out.docx250-500  words APA format cite references  Check this scenario out.docx
250-500  words APA format cite references  Check this scenario out.docx
 
2 DQ’s need to be answers with Zero plagiarism and 250 word count fo.docx
2 DQ’s need to be answers with Zero plagiarism and 250 word count fo.docx2 DQ’s need to be answers with Zero plagiarism and 250 word count fo.docx
2 DQ’s need to be answers with Zero plagiarism and 250 word count fo.docx
 
270w3Respond to the followingStress can be the root cause of ps.docx
270w3Respond to the followingStress can be the root cause of ps.docx270w3Respond to the followingStress can be the root cause of ps.docx
270w3Respond to the followingStress can be the root cause of ps.docx
 
250 word response. Chicago Style citingAccording to Kluver, what.docx
250 word response. Chicago Style citingAccording to Kluver, what.docx250 word response. Chicago Style citingAccording to Kluver, what.docx
250 word response. Chicago Style citingAccording to Kluver, what.docx
 
250+ Words – Strategic Intelligence CollectionChoose one of th.docx
250+ Words – Strategic Intelligence CollectionChoose one of th.docx250+ Words – Strategic Intelligence CollectionChoose one of th.docx
250+ Words – Strategic Intelligence CollectionChoose one of th.docx
 
2–3 pages; APA formatDetailsThere are several steps to take w.docx
2–3 pages; APA formatDetailsThere are several steps to take w.docx2–3 pages; APA formatDetailsThere are several steps to take w.docx
2–3 pages; APA formatDetailsThere are several steps to take w.docx
 
2LeadershipEighth Edition3To Madison.docx
2LeadershipEighth Edition3To Madison.docx2LeadershipEighth Edition3To Madison.docx
2LeadershipEighth Edition3To Madison.docx
 
250 Word Resoponse. Chicago Style Citing.According to Kluver, .docx
250 Word Resoponse. Chicago Style Citing.According to Kluver, .docx250 Word Resoponse. Chicago Style Citing.According to Kluver, .docx
250 Word Resoponse. Chicago Style Citing.According to Kluver, .docx
 
250 word mini essay question.Textbook is Getlein, Mark. Living wi.docx
250 word mini essay question.Textbook is Getlein, Mark. Living wi.docx250 word mini essay question.Textbook is Getlein, Mark. Living wi.docx
250 word mini essay question.Textbook is Getlein, Mark. Living wi.docx
 
250 word discussion post--today please. Make sure you put in the dq .docx
250 word discussion post--today please. Make sure you put in the dq .docx250 word discussion post--today please. Make sure you put in the dq .docx
250 word discussion post--today please. Make sure you put in the dq .docx
 
2By 2015, projections indicate that the largest category of househ.docx
2By 2015, projections indicate that the largest category of househ.docx2By 2015, projections indicate that the largest category of househ.docx
2By 2015, projections indicate that the largest category of househ.docx
 
29Answer[removed] That is the house whe.docx
29Answer[removed]                    That is the house whe.docx29Answer[removed]                    That is the house whe.docx
29Answer[removed] That is the house whe.docx
 
250 words discussion not an assignementThe purpose of this discuss.docx
250 words discussion not an assignementThe purpose of this discuss.docx250 words discussion not an assignementThe purpose of this discuss.docx
250 words discussion not an assignementThe purpose of this discuss.docx
 
25. For each of the transactions listed below, indicate whether it.docx
25.   For each of the transactions listed below, indicate whether it.docx25.   For each of the transactions listed below, indicate whether it.docx
25. For each of the transactions listed below, indicate whether it.docx
 
250-word minimum. Must use textbook Jandt, Fred E. (editor) Intercu.docx
250-word minimum. Must use textbook Jandt, Fred E. (editor) Intercu.docx250-word minimum. Must use textbook Jandt, Fred E. (editor) Intercu.docx
250-word minimum. Must use textbook Jandt, Fred E. (editor) Intercu.docx
 
250-500  words APA format cite references  Check this scenario o.docx
250-500  words APA format cite references  Check this scenario o.docx250-500  words APA format cite references  Check this scenario o.docx
250-500  words APA format cite references  Check this scenario o.docx
 
250+ Words – Insider Threat Analysis Penetration AnalysisCho.docx
250+ Words – Insider Threat Analysis  Penetration AnalysisCho.docx250+ Words – Insider Threat Analysis  Penetration AnalysisCho.docx
250+ Words – Insider Threat Analysis Penetration AnalysisCho.docx
 
250 wordsUsing the same company (Bank of America) that you have .docx
250 wordsUsing the same company (Bank of America) that you have .docx250 wordsUsing the same company (Bank of America) that you have .docx
250 wordsUsing the same company (Bank of America) that you have .docx
 
250 mini essay questiontextbook Getlein, Mark. Living with Art, 9.docx
250 mini essay questiontextbook Getlein, Mark. Living with Art, 9.docx250 mini essay questiontextbook Getlein, Mark. Living with Art, 9.docx
250 mini essay questiontextbook Getlein, Mark. Living with Art, 9.docx
 
22.¿Saber o conocer…   With a partner, tell what thes.docx
22.¿Saber o conocer…   With a partner, tell what thes.docx22.¿Saber o conocer…   With a partner, tell what thes.docx
22.¿Saber o conocer…   With a partner, tell what thes.docx
 

Recently uploaded

Lapbook sobre os Regimes Totalitários.pdf
Lapbook sobre os Regimes Totalitários.pdfLapbook sobre os Regimes Totalitários.pdf
Lapbook sobre os Regimes Totalitários.pdf
Jean Carlos Nunes Paixão
 
June 3, 2024 Anti-Semitism Letter Sent to MIT President Kornbluth and MIT Cor...
June 3, 2024 Anti-Semitism Letter Sent to MIT President Kornbluth and MIT Cor...June 3, 2024 Anti-Semitism Letter Sent to MIT President Kornbluth and MIT Cor...
June 3, 2024 Anti-Semitism Letter Sent to MIT President Kornbluth and MIT Cor...
Levi Shapiro
 
Embracing GenAI - A Strategic Imperative
Embracing GenAI - A Strategic ImperativeEmbracing GenAI - A Strategic Imperative
Embracing GenAI - A Strategic Imperative
Peter Windle
 
Welcome to TechSoup New Member Orientation and Q&A (May 2024).pdf
Welcome to TechSoup   New Member Orientation and Q&A (May 2024).pdfWelcome to TechSoup   New Member Orientation and Q&A (May 2024).pdf
Welcome to TechSoup New Member Orientation and Q&A (May 2024).pdf
TechSoup
 
Operation Blue Star - Saka Neela Tara
Operation Blue Star   -  Saka Neela TaraOperation Blue Star   -  Saka Neela Tara
Operation Blue Star - Saka Neela Tara
Balvir Singh
 
The French Revolution Class 9 Study Material pdf free download
The French Revolution Class 9 Study Material pdf free downloadThe French Revolution Class 9 Study Material pdf free download
The French Revolution Class 9 Study Material pdf free download
Vivekanand Anglo Vedic Academy
 
Supporting (UKRI) OA monographs at Salford.pptx
Supporting (UKRI) OA monographs at Salford.pptxSupporting (UKRI) OA monographs at Salford.pptx
Supporting (UKRI) OA monographs at Salford.pptx
Jisc
 
Francesca Gottschalk - How can education support child empowerment.pptx
Francesca Gottschalk - How can education support child empowerment.pptxFrancesca Gottschalk - How can education support child empowerment.pptx
Francesca Gottschalk - How can education support child empowerment.pptx
EduSkills OECD
 
Model Attribute Check Company Auto Property
Model Attribute  Check Company Auto PropertyModel Attribute  Check Company Auto Property
Model Attribute Check Company Auto Property
Celine George
 
The Challenger.pdf DNHS Official Publication
The Challenger.pdf DNHS Official PublicationThe Challenger.pdf DNHS Official Publication
The Challenger.pdf DNHS Official Publication
Delapenabediema
 
Overview on Edible Vaccine: Pros & Cons with Mechanism
Overview on Edible Vaccine: Pros & Cons with MechanismOverview on Edible Vaccine: Pros & Cons with Mechanism
Overview on Edible Vaccine: Pros & Cons with Mechanism
DeeptiGupta154
 
Acetabularia Information For Class 9 .docx
Acetabularia Information For Class 9  .docxAcetabularia Information For Class 9  .docx
Acetabularia Information For Class 9 .docx
vaibhavrinwa19
 
Polish students' mobility in the Czech Republic
Polish students' mobility in the Czech RepublicPolish students' mobility in the Czech Republic
Polish students' mobility in the Czech Republic
Anna Sz.
 
Palestine last event orientationfvgnh .pptx
Palestine last event orientationfvgnh .pptxPalestine last event orientationfvgnh .pptx
Palestine last event orientationfvgnh .pptx
RaedMohamed3
 
The Accursed House by Émile Gaboriau.pptx
The Accursed House by Émile Gaboriau.pptxThe Accursed House by Émile Gaboriau.pptx
The Accursed House by Émile Gaboriau.pptx
DhatriParmar
 
The basics of sentences session 5pptx.pptx
The basics of sentences session 5pptx.pptxThe basics of sentences session 5pptx.pptx
The basics of sentences session 5pptx.pptx
heathfieldcps1
 
Mule 4.6 & Java 17 Upgrade | MuleSoft Mysore Meetup #46
Mule 4.6 & Java 17 Upgrade | MuleSoft Mysore Meetup #46Mule 4.6 & Java 17 Upgrade | MuleSoft Mysore Meetup #46
Mule 4.6 & Java 17 Upgrade | MuleSoft Mysore Meetup #46
MysoreMuleSoftMeetup
 
A Strategic Approach: GenAI in Education
A Strategic Approach: GenAI in EducationA Strategic Approach: GenAI in Education
A Strategic Approach: GenAI in Education
Peter Windle
 
How to Make a Field invisible in Odoo 17
How to Make a Field invisible in Odoo 17How to Make a Field invisible in Odoo 17
How to Make a Field invisible in Odoo 17
Celine George
 
1.4 modern child centered education - mahatma gandhi-2.pptx
1.4 modern child centered education - mahatma gandhi-2.pptx1.4 modern child centered education - mahatma gandhi-2.pptx
1.4 modern child centered education - mahatma gandhi-2.pptx
JosvitaDsouza2
 

Recently uploaded (20)

Lapbook sobre os Regimes Totalitários.pdf
Lapbook sobre os Regimes Totalitários.pdfLapbook sobre os Regimes Totalitários.pdf
Lapbook sobre os Regimes Totalitários.pdf
 
June 3, 2024 Anti-Semitism Letter Sent to MIT President Kornbluth and MIT Cor...
June 3, 2024 Anti-Semitism Letter Sent to MIT President Kornbluth and MIT Cor...June 3, 2024 Anti-Semitism Letter Sent to MIT President Kornbluth and MIT Cor...
June 3, 2024 Anti-Semitism Letter Sent to MIT President Kornbluth and MIT Cor...
 
Embracing GenAI - A Strategic Imperative
Embracing GenAI - A Strategic ImperativeEmbracing GenAI - A Strategic Imperative
Embracing GenAI - A Strategic Imperative
 
Welcome to TechSoup New Member Orientation and Q&A (May 2024).pdf
Welcome to TechSoup   New Member Orientation and Q&A (May 2024).pdfWelcome to TechSoup   New Member Orientation and Q&A (May 2024).pdf
Welcome to TechSoup New Member Orientation and Q&A (May 2024).pdf
 
Operation Blue Star - Saka Neela Tara
Operation Blue Star   -  Saka Neela TaraOperation Blue Star   -  Saka Neela Tara
Operation Blue Star - Saka Neela Tara
 
The French Revolution Class 9 Study Material pdf free download
The French Revolution Class 9 Study Material pdf free downloadThe French Revolution Class 9 Study Material pdf free download
The French Revolution Class 9 Study Material pdf free download
 
Supporting (UKRI) OA monographs at Salford.pptx
Supporting (UKRI) OA monographs at Salford.pptxSupporting (UKRI) OA monographs at Salford.pptx
Supporting (UKRI) OA monographs at Salford.pptx
 
Francesca Gottschalk - How can education support child empowerment.pptx
Francesca Gottschalk - How can education support child empowerment.pptxFrancesca Gottschalk - How can education support child empowerment.pptx
Francesca Gottschalk - How can education support child empowerment.pptx
 
Model Attribute Check Company Auto Property
Model Attribute  Check Company Auto PropertyModel Attribute  Check Company Auto Property
Model Attribute Check Company Auto Property
 
The Challenger.pdf DNHS Official Publication
The Challenger.pdf DNHS Official PublicationThe Challenger.pdf DNHS Official Publication
The Challenger.pdf DNHS Official Publication
 
Overview on Edible Vaccine: Pros & Cons with Mechanism
Overview on Edible Vaccine: Pros & Cons with MechanismOverview on Edible Vaccine: Pros & Cons with Mechanism
Overview on Edible Vaccine: Pros & Cons with Mechanism
 
Acetabularia Information For Class 9 .docx
Acetabularia Information For Class 9  .docxAcetabularia Information For Class 9  .docx
Acetabularia Information For Class 9 .docx
 
Polish students' mobility in the Czech Republic
Polish students' mobility in the Czech RepublicPolish students' mobility in the Czech Republic
Polish students' mobility in the Czech Republic
 
Palestine last event orientationfvgnh .pptx
Palestine last event orientationfvgnh .pptxPalestine last event orientationfvgnh .pptx
Palestine last event orientationfvgnh .pptx
 
The Accursed House by Émile Gaboriau.pptx
The Accursed House by Émile Gaboriau.pptxThe Accursed House by Émile Gaboriau.pptx
The Accursed House by Émile Gaboriau.pptx
 
The basics of sentences session 5pptx.pptx
The basics of sentences session 5pptx.pptxThe basics of sentences session 5pptx.pptx
The basics of sentences session 5pptx.pptx
 
Mule 4.6 & Java 17 Upgrade | MuleSoft Mysore Meetup #46
Mule 4.6 & Java 17 Upgrade | MuleSoft Mysore Meetup #46Mule 4.6 & Java 17 Upgrade | MuleSoft Mysore Meetup #46
Mule 4.6 & Java 17 Upgrade | MuleSoft Mysore Meetup #46
 
A Strategic Approach: GenAI in Education
A Strategic Approach: GenAI in EducationA Strategic Approach: GenAI in Education
A Strategic Approach: GenAI in Education
 
How to Make a Field invisible in Odoo 17
How to Make a Field invisible in Odoo 17How to Make a Field invisible in Odoo 17
How to Make a Field invisible in Odoo 17
 
1.4 modern child centered education - mahatma gandhi-2.pptx
1.4 modern child centered education - mahatma gandhi-2.pptx1.4 modern child centered education - mahatma gandhi-2.pptx
1.4 modern child centered education - mahatma gandhi-2.pptx
 

Running head PROJECT PLAN INCEPTION1PROJECT PLAN INCEPTION .docx

  • 1. Running head: PROJECT PLAN INCEPTION 1 PROJECT PLAN INCEPTION 2 Information Technology and Business Babatunde Ogunade CIS499: Information System Capston Professor Reddy Urimindi October 13, 2019 Information Technology and Business Project Introduction The very core operation of this company involves the collection and analysis of data through a currently limited technological infrastructure. The basis of this business may focus on leadership structure, the type of industry, business culture, core
  • 2. vision and mission including objectives. The company has a Chief Executive Officer (CEO) as the highest rank, four Information Technology experts and other employees. Marketing can, therefore, categorize this company as a service industry company with a core vision of a 60 percent growth in the next eighteen months and mission of redesigning its information technology to fulfill its organizational needs. Product features, new market product, differentiation techniques, and value addition defines the type of business which the company is operating. The assessment of its product features which involves data indicate that the opportunities focus on marketing. In the continued operations of the company, the management is not foreseeing any shift from its original product but is rather fixing a differentiation technique within six months. An addition in product value should be achieved by employing an exclusively new technology based on a hybrid model, hosted solution or on-site solution. The idea of integrating technologies from other partners to realize cost-effective outcomes and best operations outlines the outsourcing policies as far as new technology is concerned. Consequently, future intentions to acquire services such as Software-as-a-Service (SaaS) and cloud computing technologies may involve the adoption of knowledge and skills from outside the country, therefore, describing offshoring activities. As asserted by Aithal, (2017), the success of fulfilling the effective company operation, these activities are important. One of the skilled personnel in the company is the Chief Information Officer (CIO) whose basic role is to keep a charge on the computer systems and information technology (IT) necessary in ensuring a company’s goals and objectives. Additionally, the CEO has devolved the responsibility of security protocols to the CIO in the process of more digitized frameworks. Other personnel includes the company CEO tasked with communicating to partners, creating the company mission and vision, and generally heading the implementation of both long term and short term objectives. The other information
  • 3. technician is mandated in both the installation and configuration of computer hardware and software. Based on the current collection and analysis method, data on the customer, marketing, lifecycle, website engagement, and funnel analytics. In broad-spectrum, funnel analytics provide customer information through registration, lead generation, and other checkout pages. Website engagement deals with data on how users dwell on-site to buy products, subscribe or take any other action. Additionally, lifecycle analytics deals with giving access to large volumes of product durability and informed product investment decisions. Marketing and customer analytics provide a solution for accessing customer understanding of superior delivery experiences. The major current information system used by the company include Web analytics in combination with other operating systems. With this tool, the company can gain customer behavior regarding their visits to the websites. Therefore, it is easy to establish a customer-management relationship from which the company can retain and attract new customers or gain insight attraction to visitors and expand the amount that a customer spends. The specificity of this system is to provide information on how to promote a product and determine the other products that customers are likely to purchase. Operational systems and database used by Web analytics; numerous operational systems are available depending on the choice of the user. Potential clients may have their default browsers to be internet explorer, firefox and chrome which have an operational system in windows predominant in computer usage. Consequently, android and iPhone also give platforms to other users. Microsoft SQL server is a rational database system that can be used to store and retrieve data as requested by other web users. Another database in this web analytics includes embedded which is highly integrated, requires little or no maintenance and the end-user is not capable of accessing the system through applications. The good user interface is important for instilling confidence,
  • 4. improving data discoverability, broadening the context and easy understanding of the data. A command-line interface is text- based and the customer or the user can respond to prompts by typing commands and receiving feedback. Natural language interface allows interaction by use of normal languages such as English or French as opposed to the use of computer language and is meant for understanding spoken or written texts. As earlier discussed, the analytics contained in the company includes the marketing, customer, life cycle and web-site engagement analytics and are regarded as important elements in interpreting, communicating and discovering meaningful data patterns. Since the company deals in information technology, the infrastructural components of the company are divided into three important splits of computing, network, and storage. About the young age of the company, the technological infrastructure is still very limited and therefore the current system is not strong enough to warrant its reliability. Fundamental facility and system are achievable for serving its market and supporting day-to-day functions. The company's physical infrastructure such as buildings is also inadequate to allow an expanded system. The security of the company’s system can be defined by countermeasures that are put in place to ensure that cyber, computer and information technology are protected. The risks that are associated with these facilities cover those from theft, physical damage and electronic damages such as file corruption, cyberattacks, and hacking. Web analytics is a modern technique that is considered secure. In this system, the information technologist can set predetermined rules which a firewall protects against untrusted networks. Firewall security system controls and monitors outgoing and incoming networks which in the overall view protects computers against cyber-attacks. Data encryption in another security measure which is enabled in the web analytics. The company can decide to encode information and only be accessed to those employees or users
  • 5. with the correct encryption key. Consequently, the data can also be made to appear unreadable and scrambled to users who have permission to access these files. The security technique provides the company with the necessary data protection against accessibility from unauthorized users. Sensitive information on tax, confidential emails and other important files cannot be intercepted or be viewed by other parties. Additionally, creating passwords and biometrics is also a security feature relevant in the daily web analytics operations. The biometrics system is a more secure system where access to files can only be granted to a person through the identification of a unique biological trait such as DNA, voice or fingerprints. According to Pane, Awangga, Nuraini & Fathonah, (2018) establishing a strong password is adequate protection against identity theft and financial fraud in accompany. Combining these two can be used by the company to offer protection against cyber hacks.
  • 6. References Aithal, P. S. (2017). Company Analysis–The Beginning Step for Scholarly Research. International Journal of Case Studies in Business, IT and Education (IJCSBE), 1(1), 1-18. Pane, S. F., Awangga, R. M., Nuraini, R., & Fathonah, S. (2018, April). Analysis of Investment IT Planning on Logistic Company Using COBIT 5. In Journal of Physics: Conference Series (Vol. 1007, No. 1, p. 012051). IOP Publishing. I have chosen Social Media as the behavior for this assignment. Addictions come in many forms and almost always involve a complex three-way interaction between the person, the object of the addiction (e.g., drugs, gambling, chocolate), and the societal context of the addiction. This complex interaction raises a controversial social question: Is addiction always a bad thing? Although there is often a significant amount of social stigma attached to addictions, and popular media often focuses on the treatment and prevention of addiction, there may also be associated positive qualities of addictive substances and behaviors. For your initial post, the class will be split into two groups. Please see below for your assigned topic group. Initial post will be written on social media which is a specific behavior that has addictive potential. Begin your initial post by choosing a behavior with addictive. For this discussion, you must explain both the positive and negative potential of addiction to your chosen behavior. The behavior should present both positive and negative potential outcomes. Research your behavior providing at least two peer-reviewed resources to support any claims made. In your post, construct clear and concise arguments using evidence-based psychological
  • 7. concepts and theories to create a brief scenario or example of a situation in which your chosen addiction provides both positive and negative potential outcomes for a subject. Integrate concepts developed from different content domains to support your arguments. Evaluate and comment on the reliability and generalizability of the specific articles and research findings you have chosen to support your arguments. Explain how the APA’s Ethical Principles and Code of Conduct might be used to guide your decisions as a psychology professional if you were assigned to consult with the subject in the situation you have created. The following websites may help when explaining the APA’s Ethical Principles and Code of Conduct might be used to guide your decisions as a psychology professional: American Psychological Association. (2010). Ethical principles of psychologists and code of conduct: Including 2010 amendments (Links to an external site.). Retrieved from http://www.apa.org/ethics/code/index.aspx I have chosen Social Media as the behavior for this assignment. Addictions come in many forms and almost always involve a complex three - way interaction between the person, the object of the addiction (e.g., drugs, gambling, chocolate), and the societal context of the addiction. This complex interaction raises a controversial social question: Is addiction always a bad thing? Although there is often a
  • 8. significant amount of social stigma attached to addictions, and popular media often focuses on the treatme nt and prevention of addiction, there may also be associated positive qualities of addictive substances and behaviors. For your initial post, the class will be split into two groups. Please see below for your assigned topic group. Initial post will be writ ten on social media which is a specific behavior that has addictive potential . Begin your initial post by choosing a behavior with addictive. For this discussion, you must explain both the positive and negative potential of addiction to your chosen behav ior. The behavior should present both positive and negative potential outcomes.
  • 9. Research your behavior providing at least two peer - reviewed resources to support any claims made. In your post, construct clear and concise arguments using evidence - based psych ological concepts and theories to create a brief scenario or example of a situation in which your chosen addiction provides both positive and negative potential outcomes for a subject. Integrate concepts developed from different content domains to support your arguments. Evaluate and comment on the reliability and generalizability of the specific articles and research findings you have chosen to support your arguments. Explain how the APA’s Ethical Principles and Code of Conduct might be used to guide your decisions as a psychology professional if you were assigned to consult with the subject in the situation you have created. The following websites may help when explaining the APA’s Ethical Principles and Code of Conduct might be used to guide your decisi ons as a psychology professional: American Psychological Association. (2010). Ethical principles of psychologists and code of conduct: Including 2010 amendments
  • 10. (Links to an external site. ) . Retrieved from http://www.apa.org/ethics/code/index.aspx TOJET: The Turkish Online Journal of Educational Technology – January 2018, volume 17 issue 1 Copyright © The Turkish Online Journal of Educational Technology 169 Social Media Addiction Scale - Student Form: The Reliability and Validity Study Cengiz Şahin Faculty of Education, Ahi Evran University, Kirsehir, Turkey [email protected] ABSTRACT The purpose of this study is to develop a valid and reliable measurement tool to determine the social media addictions of secondary school, high school and university students. 998 students participated in the study. 476 students from secondary schools, high schools and universities participated in the first application during which the exploratory factor analysis of the scale was conducted. 298
  • 11. students participated in the second application during which the confirmatory factor analysis was carried out. Test-retest method was used to determine the consistency of the scale with the participation of 224 student. Expert opinion, exploratory factor analysis, confirmatory factor analysis, total item correlations, mean differences between upper and lower groups, internal consistency coefficient and test-retest correlation coefficients were calculated within the scope of assessing the validity and reliability of the research. According to the exploratory and confirmatory factor analysis, the scale has a 4-factor structure accounting for 53.16% of the total variance. Kaiser-Meyer-Olkin (KMO) coefficient and the Bartlett’s test were found significant respectively at .96 and χ2=12680.88 (p=.00). Internal consistency coefficient (Cronbach’s alpha coefficient) was found .93 for the whole scale and at values ranging from .81 to .86 for the sub-factors. Test-retest coefficient was found .94. In conclusion, SMA-SF is a 5-point Likert-type scale consisting of 29 items grouped under 4 factors (virtual tolerance, virtual communication, virtual problem and virtual information). The statistical analysis indicates that the scale is valid and reliable enough to be used in determining the social media addictions of secondary school, high school and university students. Keywords: Social media, addiction, student, scale development, reliability and validity. INTRODUCTION The Internet is a knowledge technology that has entered into every aspect of life as a means of information, trade and communication. Although the purpose of its emergence was to reach secure, fast, inexpensive information and to facilitate communication, today it has become a means of causing significant changes in individuals and society. The fact that internet usage takes place independently
  • 12. of time and space over a virtual environment leads to changing forms of communication. And social media, which is an extension of internet technology, changes communication channels among people. The use of social media in Turkey and around the world is increasing, especially young people and students show intense interest in it. According to information provided by Internet World Stats (2017) based on data provided by leading organizations in Internet researches (Nielsen/NR, eTForcasts, CIAlmanac, ITU, IWS, CIA), as of March 2017 the number of Internet users worldwide has increased by approximately 3 billion 732 million people (49.6%). The rate of increase in internet usage 2000-2017 was 933.8%. In the same research, it is reported that the number of internet users in Turkey is approximately 46 million 283 people (59.6%) and the number of social media (Facebook) users is about 41 million people (53.2%). It is observed that the rate of social media usage in Turkey is higher than that of Europe (37.6%). According to the Turkish Statistical Institute (TUIK, 2016), the rate of individuals using the internet in Turkey is 61.2%. When purposes of internet usage in Turkey is taken into consideration, 82.4% of the individuals who use the internet in the first three months of 2016 have shared their social networking profile or photo, messages and content. This ratio is higher in adolescents and students compared with other age groups (TUIK, 2016). Social networks are applications that run over the internet and cannot be evaluated independently from the internet. Today, social media tools have enabled each user to become a content producer through account/profile creation with the burst of web 2.0 technologies (Tekvar, 2012). Social media contributes to the transformation of users from passive listeners to active content producers and it
  • 13. makes it easier to stay connected and to produce content by providing applications for different mobile devices and operating systems (Karasu & Arıkan, 2016). Therefore, people use social media more widely than expected. Excessive, problematic, and pathological use leads to personal, social, vocational and educational problems for individuals (Griffiths Kuss & Demetrovics, 2014). There is no consensus among researchers about identifying problematic social networking or Internet TOJET: The Turkish Online Journal of Educational Technology – January 2018, volume 17 issue 1 Copyright © The Turkish Online Journal of Educational Technology 170 addiction (Wegmann, Stodt & Brand, 2015), depending on the conceptual confusion surrounding the problematic internet use classification. People think that addiction usually involves substances use such as drugs or alcohol. Uncontrollable habits or practices are also referred to as addiction (Harris, Nagy & Vardaxis, 2014). In this sense, the concept of technological dependency has also been used to describe the extreme Internet usage behaviors that arise due to developed technologies (Kuss & Griffiths, 2012; Turel & Seronko, 2012). Internet addiction (Young, 2004, Sahin, 2011), game addiction (Fisher, 1994, Griffiths & Hunt, 1998; Horzum, 2011), CyberSex addiction (Cavaglion, 2009; Schwartz & Southern, 2000); online addiction
  • 14. (Tüzer, 2011), Social network addiction (Griffiths, 2012), mobile phone addiction (Bianchi & Phillips, 2005; Fidan, 2016), Facebook addiction (Andreassen, Torsheim, Brunborg & Pallesen, 2012), Twitter addiction (Said, Al-Rashid & Abdullah, 2014), social media disorder (van den Eijnden, Lemmens & Valkenburg, 2016) and social media addiction (Andreassen, Torsheim, Brunborg and Pallesen, 2012; Şahin & Yağcı, 2017) have been investigated in the context of behavioral addiction and are gaining importance along with developing technology. Social media addiction is considered as a kind of internet addiction (Kuss & Griffiths, 2012). Individuals who spend too much time on social media have a desire to be notified of anything immediately, which can cause virtual tolerance, virtual communication and virtual problem. Behaviors that force the person into these actions can be explained as social media addiction. Turne & Serenko (2012) have identified three notionally different perspectives to explain the formation of social network addiction: Cognitive-behavioral model; this model emphasizes that ‘abnormal’ social networking arises from maladaptive cognitions and is amplified by various environmental factors, and eventually leads to compulsive and/or addictive social networking. Social skill model; this model emphasizes that ‘abnormal’ social networking arises because people lack self-presentational skills and prefer virtual communication to face-to-face interactions, and it eventually leads to compulsive and/or addictive use of social networking. Socio-cognitive model; this model emphasizes that ‘abnormal’ social networking arises due to the expectation of positive outcomes, combined with internet self-efficacy and deficient internet self-regulation eventually leads to
  • 15. compulsive and/or addictive social networking behavior (Griffiths, 2013). The transition from normal to problematic social media use is seen as an important mechanism to alleviate stress, loneliness or depression for the individual, so they become more active with more social media. This ultimately leads to many problems and exacerbates the unwanted mental states of the individual (Xu & Tan, 2012). Brown & Bobkowski (2011) stated that social media use can lead to harmful behaviors such as aggression, personality disorder, unhealthy diet, early sexuality, tobacco and alcohol use in young people. As a result, the psychological dependence level in social sharing develops when this cyclical situation is repeated in order to get rid of the unwanted mood in social media use. The researchers conducted in different countries revealed that internet usage addiction is not limited to university students, but also includes secondary school and high school students (Al-Menayes, 2015). Individuals who spend 8.5 to 21.5 hours online per week are considered to be addicted (Yang & Tung, 2007). It can be said that the determination of this situation is important when considering the problems caused by social media addiction. The diagnosis of social media addiction cannot be justified indiscriminately or just by observation. Valid and reliable scales can be used for this. In this respect, when the literature about social media addiction scales was examined, various researches, tests and scales were found (Banyai at.al, 2017; Al-Menayes, 2015). It seems that there are a few researches in Turkish literature to determine the social media addiction of university students (Tutkun Ünal & Deniz, 2015; Kırık, Arslan, Çetinkaya & Gül, 2015; Şahin ve Yağcı, 2017).
  • 16. However, there were no tests or scales that measured the social media addiction of 12-22 year old students in the literature. 12-18 age group is accepted as puberty or adolescence in developmental psychology literature (Gündoğdu, 2016). The term late puberty is proposed as well for 18-25 ages (Arnett, 2004). The latter is considered as the prolongation of development (Arnett, 2007). From this point of view, it can be said that 12-22 ages show similar properties. In this context, this study aims to develop a measurement for the determination of social media addiction of students and reveal the validity and reliability results. METHOD The progress of the scale development work carried out to determine the social media addiction of the students and the characteristics of the working group are presented below. TOJET: The Turkish Online Journal of Educational Technology – January 2018, volume 17 issue 1 Copyright © The Turkish Online Journal of Educational Technology 171 Study Group The study included students from 12 to 22 years of age (M=17.26 ± SD=3.09) who were studying in different departments of a university as well as secondary and high
  • 17. school students in the districts representing different socio-economic levels of a city during the 2016-2017 academic year. The scale development process was carried out with the participation of a total of 998 students. 566 (56.7%) female students and 432 (43.3%) male students participated voluntarily. The participants were determined by simple random sampling. The working group has been considered to be "at least ten times the number of items" (Sönmez & Alacapınar, 2014). 476 students from secondary school, high school and university participated in the first application in which explanatory factor analysis of the scale was performed and 298 students participated in the second application in which confirmatory factor analysis was performed. The test-retest method was used to determine the consistency of the scale and the application was performed with the participation of 224 students. Development of Scale Form In order to establish a trial form for determining the social media addiction of students, it was necessary firstly to create a conceptual framework by examining the social media use and addiction research (Griffiths, 1995; Young, 2004; Şahin, 2011; Al-Menayes, 2015, Tutgun Unal & Deniz, 2015, Banya et al., 2015). In this framework, a frame for the scope of the "Social Media Addiction Scale-Student Form (SMAS-SF)" was determined in line with the information obtained from the related literature and opinions of field experts, an item pool consisting of 41 items was formed and a draft form was prepared. The scale includes 39 positive and 2 negative items. A 5-point grading is used in the scale: “(1) Definitely not appropriate”, “(2) Not appropriate”, “(3) Undecided”, “(4) Appropriate” and “(5) Quite appropriate”. The negative items are scored reversely.
  • 18. The collected data were uploaded to SPSS 22.00 and LISREL 8.80 programs in order to conduct statistically reliability and validity tests of the scale. Values for negative expressions are inversely encoded when loading to the programs. The Scoring of the Scale This is a 5-point Likert type scale which consists of 29 items and 4 sub-dimensions. 1-5 items are within virtual tolerance sub dimension;6-14 items are within virtual communication sub dimension, 15-23 items are under virtual problem sub dimension and 24-29 items are under virtual information sub dimension. All of the items in the scale are positive. The highest point that can be scored from the scale is 145, and the least one is 29. The higher scores indicate that agent perceives himself as a “social media addict”. Analysis of Data The construct validity of the scale was examined by the Kaiser- Meyer-Olkin (KMO) coefficient and the Bartlett Sphericity test, and it was determined whether or not to perform factor analysis (Russell, 2002; Kalayci, 2009). Explanatory factor analysis was performed on the data through the obtained data. A factor analysis method has been adopted to determine the validity structure of the scale (Balcı, 2009; Seçer, 2013). An analysis of basic components was conducted to determine the factors underlying the scale; Factor loadings were investigated by choosing Varimax rotation technique. The factorization technique was used in the analysis of the basic components (Büyüköztürk, 2002). By identifying the grouped factors observed in the scale, the number of variables was reduced (Seçer, 2013). The factor analysis was repeated by removing the items below 30 as a result of the principal components analysis and by removing the
  • 19. factor loadings which are distributed to two factors (Kline, 1994; Büyüköztürk, 2002; Balcı, 2009). The exploratory factor analysis was applied to a different study group in order to test the model structure. Confirmatory factor analysis was performed on the obtained data. Confirmatory factor analysis is based on the relationship between observed and unobserved variables (items and factors) that are treated as hypotheses (Pohlmann, 2004). It has been tested whether the model created through previously acquired information has been verified by the present data. Many adaptation indices are used in literature to demonstrate the adequacy of the model (Kline, 2005). As a result of the factor analysis, the item discriminative powers of the remaining scale items are determined by testing them with independent sample t test and the validity feature of the scale is determined by testing the item- total correlations with Pearson's r test (Büyüköztürk, 2002). Discrimination is considered to be one of the most important pieces of evidence used in determining the validity of a scale (Büyüköztürk, 2008). The discrimination of items on the scale is determined by testing the meaningfulness of the difference between the scale scores of the 27% upper and 27% subgroups after the raw scores are ranked from small to large. TOJET: The Turkish Online Journal of Educational Technology – January 2018, volume 17 issue 1
  • 20. Copyright © The Turkish Online Journal of Educational Technology 172 Internal consistency coefficients and stability tests were performed to determine the reliability of the scale. The internal consistency level of the scale was calculated using the Cronbach Alpha reliability coefficient and the correlation value between two peer half was calculated by using the Sperman-Brown and the Guttmann split-half reliability formula. The level of stability within the reliability of the scale was calculated by determining the correlation values between the results of the two applications which were conducted within four weeks intervals (Büyüköztürk, 2002; Balcı, 2009). Negative items on the scale are coded by reverse scoring. The scale is determined as a result of analysisand it was applied to the study group by multiplying the scale. The validity and reliability analysis of the data obtained from the application was conducted using IBM SPSS 20.0 and Lisrel 8.80 programs. FINDINGS In this section, findings on the validity and reliability studies of "Social Media Addiction Scale: Student Form (SMAS-SF)" are included. Findings Related to the Validity of the Scale The validity of a measurement tool can be defined as the degree of serving purpose of the items prepared to measure a specific feature (Seçer, 2013). In this context, the findings of content validity and construct validity, total item correlations and item discrimination levels of SMAS- SF are presented below.
  • 21. Content Validity The validity of the quantitative and qualitative content of the scaled items has been consulted by expert opinion (Balcı, 2009; Büyüköztürk, Çakmak, Akgün, Karadeniz & Demirel, 2015). One expert in the field of psychological counseling and guidance,one expert in psychiatric field, two experts in computer and instructional technology field, one expert in measurement and evaluation field and one expert in Turkish language education have shared their opinions about whether SMAS-SF is adequate to measure social media addiction. Opinions of these experts were obtained using a 3-point rating form. Experts were asked to respond by marking the "appropriate", "partially appropriate" and "not suitable" options for the items on the form. In the view of the experts, the content validity rate of the items has been determined (Veneziano & Hooper, 1997). The said ratios were determined by the ratio of the total number of experts who responded positively to each item to the total number of experts. The items with a coverage rate of less than 0.80 in the created item pool were subtracted from the draft scale. The draft scales were read by two Turkish literature experts in order to eliminate mistakes related to imputation and punctuation errors. Some items were removed from the scale in line with the calculated coverage validity ratios and some items were rearranged (Şahin & Beydoğan, 2016). The draft scale of 41 items has been prepared for initial implementation with the contribution of student opinions, information obtained from the literature and the literature experts. 38 of the items in the draft scale were positive and 3 of them were negative. Against the material created, five-grade options have been placed to determine the attitude levels of the students. These options were edited and scored as: (1) I do not agree at all, (2) I
  • 22. little agree, (3) I agree, (4) I quite agree, and (5) I strongly agree. The final scale was multiplied and applied. Construct Validity Exploratory Factor Analysis The suitability of the data obtained from the scale items for the factor analysis was determined by using the Kaiser Meyer Olkin (KMO) and Bartlett test. The values have been obtained as KMO test value, 965; Bartlett test value χ2 = 18304.06; df=400 (p=.00). In order to perform item factor analysis, it is suggested that the value of KMO should be at least .70 (Sönmez & Alacapınar, 2014) and the Bartlett test should be meaningful (Kalayci, 2009). Findings on the scale show that the data are appropriate for factor analysis. First, we conducted the basic components analysis in order to determine if the scale is one-dimensional. The basic components analysis used in the factor analysis and varimax vertical rotation technique is used to remove the items with factor loading values less than .40 and the items with two loading value at different factors (Balcı, 2009). At the end of the analysis of the basic components analysis in the factor analysis and the rotation process with the Varimax technique, 6 factors were determined with a value greater than 1.00. Due to excessive factor numbers, Cattel's scree test was done. TOJET: The Turkish Online Journal of Educational Technology – January 2018, volume 17 issue 1 Copyright © The Turkish Online Journal of Educational
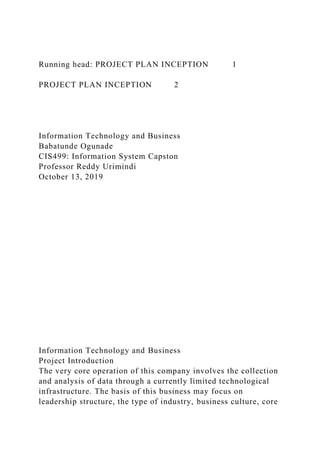
  • 23. Technology 173 Figure 1. Social media addiction scale-student form self-value factor graph It is possible to say that the number of factors in the scale can be limited to 4 because the factors after the fourth point are small and the distances between them are very close and similar in the eigenvalue graph. Büyüköztürk (2002) states that the eigenvalue graph will give the number of factors of fast drops or fracture points as seen in the graph. As a result of the exploratory factor analysis, factor loading values of the items were examined and 5 items were subtracted from the measurement since they were not determinative of which factor is measured. As a result of the factor analysis, it was seen that the items in the measure were collected in four groups. Experts examine the items in the group and determine what they measure thematically. Four items which had high loading values in more than one factor were removed from the scale after the restructuring analysis. In the scope of the study, it was determined that there are 4 factors with an eigenvalue greater than 1 and a variance value of more than 5%. The variance explained by the first factor is 14.17%; The variance explained by the second factor is 14.15%; The variance explained by the third factor is 12.97% and the variance explained by the fourth factor is 11.86%. The total variance explained by the scale is 53.16%. The results of the analysis showed that 5 items of 29 items on the scale gave the first
  • 24. factor, 9 gave the second factor, 9 gave the third factor and 6 gave the high loading value in the fourth factor. It was determined that the factor number is 4, KMO value .96; Bartlett value χ2=12680.88; df=371 (p=.00) in the scale consists of 29 items. It is stated that factor loading values vary as follows: .61 and .77 in the first factor .48 and .68 in the second factor .41 and .47 in the third factor and .53 and .71 in the fourth factor. After the measurement factors have been determined, the items collected in each factor have been identified. Correlation values of the items and item-total scores were calculated. The alternating factor loadings, item-total scale correlation, common factor variance values and factor loading values obtained according to the analysis result are given in Table 1. TOJET: The Turkish Online Journal of Educational Technology – January 2018, volume 17 issue 1 Copyright © The Turkish Online Journal of Educational Technology 174
  • 25. Table 1. The factor loadings of social media addiction scale- student form and item-total correlation Draft Scale Item No Scale Item No Factor Loadings before Rotation Factor Loading Values Item-total Correlation Coefficients Virtual Tolerance Virtual Communication Virtual Proble m
  • 26. Virtual Information M1 1 .66 .77 .59 M2 2 .64 .75 .60 M4 3 .63 .71 .57 M3 4 .60 .70 .66 M5 5 .54 .61 .64 M18 6 .51 .68 .50 M11 7 .34 .55 .41 M21 8 .39 .54 .49 M26 9 .56 .54 .71 M24 10 .49 .53 .64 M28 11 .59 .51 .72 M20 12 .34 .50 .52 M34 13 .50 .50 .67 M27 14 .49 .48 .67 M14 15 .62 .67 .68 M30 16 .53 .66 .53 M10 17 .56 .64 .59 M31 18 .57 .57 .59 M15 19 .49 .55 .53 M17 20 .53 .54 .63 M29 21 .51 .50 .64 M22 22 .49 .48 .67 M16 23 .50 .41 .68 M38 24 .61 ,715 .62 M40 25 .62 ,703 .61 M39 26 .44 ,562 .53 M37 27 .44 ,560 .59 M35 28 .53 ,556 .65 M36 29 .58 ,539 .69 Variance (%) 14.17 14.15 12.97 11.86
  • 27. Total Variance: 53.16% When Table 1 is examined, it is seen that the factor loadings of the scale items are collected in 4 sub-dimensions. According to the results of the repeated factor analysis, the items with factor loading values of less than 0,30 were eliminated from the scale which consists of 41 items. Item-test correlations were used to determine the discriminative power of the items. In the study, substances with a substance-test correlation values of 0.30 and above were taken as the basis. As a result of the analysis, 4 factor scale structure, which consists of 29 items, was reached. Factor loading values of the items were found to be between .41 and .77 for the overall measurement. These factors are named according to the information obtained from the literature and the expert opinion. According to this, the first factor is virtual tolerance, the second factor is virtual communication, the third factor is virtual problem and the fourth factor is virtual information. Confirmatory Factor Analysis First and second level confirmatory factor analysis were performed to test the accuracy of its 4-dimensional structure which is determined as the result of the exploratory factor analysis. Confirmatory factor analysis was performed on data collected from 298 students, except for the sample collected for the explanatory factor analysis. As shown in Figure 2, a model of equality has been established, which can be predicted by a four- factorial and a 29-factor structure, which is revealed by exploratory factor analysis. As a result of the confirmatory factor analysis, the Chi Square value is (χ2)=1576.98, the degree of freedom is χ2/df=4.25. It can be said that the Chi square values, which vary according to the sample size, have an acceptable
  • 28. concordance for the current sample to which this sample applies (Kline, 2005). For the structural suitability of TOJET: The Turkish Online Journal of Educational Technology – January 2018, volume 17 issue 1 Copyright © The Turkish Online Journal of Educational Technology 175 the scale, the RMSEA (Root Mean Square Error of Approximation), SRMR (Standardized Root Mean Square Residual, GFI(Good Fit Index), AGFI (Adjusted Goodness of Fit Index) and NFI (Normed Fit Index) values are taken into account (Browne and Cudeck, 1993; Kline, 2005; Raykov and Marcoulides, 2006; Byrne, 2010). The data obtained by the confirmatory factor analysis validates the model. Figure 2. First-level confirmatory factor analysis correlation diagram (standardized) As seen in Figure 2, the sub-dimension virtual tolerance of scale’s factor loadings control ranges from .69 to .76; the sub-dimension virtual communication ranges from .39 to .77; the sub-dimension virtual problem ranges from .55 to .73; the sub-dimension virtual information ranges from .54 to .75.
  • 29. The t values obtained as a result of confirmatory factor analysis are presented in Table 2. According to the findings in Table 2, it was determined that the t value for the items in the Social Addiction Scale-Student Form TOJET: The Turkish Online Journal of Educational Technology – January 2018, volume 17 issue 1 Copyright © The Turkish Online Journal of Educational Technology 176 changed between 12.26 and 27.61. According to this, all t values obtained in the first level confirmatory factor analysis were found to be significant at .01 level. Table 2. First-Level Confirmatory Factor Analysis t-Test Values Item No t Item No t Item No t Item No t M1 25.58** M6 16.69** M15 25.40** M24 22.95** M2 26.52** M7 12.26** M16 17.97** M25 23.28** M3 26.61** M8 14.89** M17 19.72** M26 17.07** M4 24.14** M9 26.28** M18 22.24** M27 19.85** M5 23.13** M10 21.92** M19 20.40** M28 24.23** M11 27.61** M20 23.26** M29 26.35** M12 16.62** M21 23.15** M13 23.66** M22 23.39** M14 24.44** M23 23.51** **p�.01
  • 30. Second level confirmatory factor analysis was conducted to show that the 4 factors obtained by the first level confirmatory factor analysis of the scale represent a social media addiction variable defined as a superstructure. The second level factor model was tested by adding second level variables to the first level confirmatory structure which were tested with 4 potential and 29 indicator variables. The connection diagram of the second level confirmatory factor analysis of the scale is presented in Figure 3. Figure 3. Second-level confirmatory factor analysis correlation diagram (standardized) The factor loadings of the model obtained from the confirmatory factor analysis are shown in Figure 3. The sub- dimension virtual tolerance for factor loadings ranges from .69 to .77; the sub-dimension virtual communication TOJET: The Turkish Online Journal of Educational Technology – January 2018, volume 17 issue 1 Copyright © The Turkish Online Journal of Educational Technology 177 ranges from .39 to .76; the sub-dimension virtual problem ranges from .56 to .73 and the sub-dimension virtual information ranges from .54 to .75.
  • 31. The absence of a red arrow in the t values between the factors and the items after the standardized analyzes indicates that all the items are significant at the level of �.05 (Jöreskog and Sörbom, 1993). The perfect and acceptable compliance measures for the fit indices examined in the study and the fit indices obtained from the first and second confirmatory factor analyzes are presented in Table 3. Table 3. Fit indices and fit indices values obtained from DFA Inspected FitIndices Perfect Fit Acceptable Fit First Level Confirmatory Factor Analysis Fit Indices Second Level Confirmatory Factor Analysis Fit Indices χ2/sd 0 ≤ χ2/df ≤ 2.00 2.00 ≤ χ2/d<5.00 3.25 3.67 RMSEA 0 ≤ RMSEA ≤ 0.05 0.05 ≤ RMSEA ≤ 0.08 0,05 0.06 S-RMR 0 ≤ S-RMR ≤ 0.05 0.05 ≤ S-RMR ≤ 0.10 0.04 0.05 NFI 0.95 ≤ NFI ≤ 1.00 0.90 ≤ NFI ≤ 0.95 0.97 0.97 CFI 0.97 ≤ CFI ≤ 1.00 0.95 ≤ CFI ≤ 0.97 0.98 0.98 GFI 0.95 ≤ GFI ≤ 1.00 0.90 ≤ GFI ≤ 0.95 0.90 0.89 AGFI 0.95 ≤ AGFI ≤ 1.00 0.85 ≤ AGFI ≤ 0.95 0.88 0.87
  • 32. According to the findings in Table 3, it can be seen that the values obtained as a result of explanatory and confirmatory factor analysis are consistent. This indicates that the construct validity of the "Social Media Addiction Scale: Student Form" is confirmed. Item Discrimination The discrimination power of the items in the scale was calculated. For this, the raw scores obtained from each item are ranked from small to large. Subsequently, the significance of the difference between subgroup 27% and upper 27% group item scores was tested. Findings of t values and significance levels obtained after the test are presented in Table 4. Table 4. Levels of item discrimination Virtual Tolerance Virtual Communication Virtual Problem Virtual Information Item t Item T Item t Item t M1 18.51(**) M7 11.83(**) M15 23.46(**) M24 19.16(**) M2 21.69(**) M8 15.50(**) M16 16.72(**) M25 22.87(**) M3 22.48(**) M9 22.52(**) M17 19.00(**) M26 16.64(**) M4 21.21(**) M10 19.60(**) M19 14.10(**) M27 20.40(**) M5 20.43(**) M11 18.62(**) M20 16.59(**) M28 20.74(**) M12 16.36(**) M21 16.06(**) M29 26.58(**) M13 19.40(**) M22 19.92(**) M14 22.25(**) M23 19.16(**) F1 32.76(**) F2 32.95(**) F3 30.07(**) F4 35.65(**) Total 45.45(**) df: 338; **p<.01
  • 33. As seen in Table 4, the 29 items in the scale, the factors and the independent sample t-test values for the total score vary from 11.83 to 26.58. The t value for the general population is 45.45; 32.76 for F1 (VT) subdimension; 32.95 for F2 (VC); 30.07 for F3 (VP) and 35.65 for F4 (VI) (p <.01). According to this finding, it can be said that the scale has internal validity, meaning that it distinguishes students with high addiction and students with minor addiction. Findings Related to the Reliability of the Scale Internal consistency and stability analyses were performed on the data to calculate the reliability of the scale. The processes and findings are presented below. TOJET: The Turkish Online Journal of Educational Technology – January 2018, volume 17 issue 1 Copyright © The Turkish Online Journal of Educational Technology 178 Internal Consistency Levels The reliability of the scale according to the factors and general is calculated by using Peer-to-Peer Correlations, Sperman-Brown formula, Guttmann Split-Half reliability coefficient, and Cronbach Alpha reliability formulas. Reliability analysis values for the overall scale and factors are
  • 34. presented in Table 5. Table 5. Social media addiction scale-student form’s reliability coefficients Factors Item No Peer-to-Peer Correlations Sperman Brown Guttmann Split-Half Cronbach Alpha Virtual Tolerance 5 .70 .82 .82 .81 Virtual Communication 9 .69 .81 .81 .81 Virtual Problem 9 .75 .86 .74 .86 Virtual Information 6 .66 .79 .79 .82 Total 29 .83 .91 .90 .93 As shown in Table 5, Peer-to-Peer Correlations was calculated as .83; Sperman Brown reliability coefficient was calculated as .91; Guttmann Split-Half value was calculated as .90, and Cronbach Alpha reliability coefficient was calculated as .93. On the other hand, it is seen that the co- half correlations for the factors vary between .66 to .75; Sperman Brown values vary between .79 and .86; Guttmann Split-Half values vary between .79 and .82 and Cronbach Alpha values vary between .81 and .86. The data on reliability coefficients show that all
  • 35. dimensions and sub-dimensions have reliable results. Stability Level The stability characteristics of the scale were examined and the test-retest method was used. This study group was conducted with the participation of 224 students who did not participate in the previous stages of the scale. In the study group, the time between the two applications was determined as four weeks. Table 6 summarizes the findings that show the test-retest results for the general scale and the factors. Table 6. Social media addiction scale-test-retest reliability coefficient of student form Second Application Virtual Tolerance Virtual Communication Virtual Problem Virtual Information Total Factor1 Virtual Tolerance .83(**) Factor2 Virtual Communication .87(**)
  • 36. Factor3 Virtual Problem .87(**) Factor4 Virtual Information .81(**) Total .94(**) n=224; **p<.01 As can be seen in Table 6, the correlation coefficients between the responses of the students were found to be positively correlated between ,81 and ,87 (p<.01), despite the four-week time interval. The high correlation value (r=.94) for the overall scale is another indicator of stability. Kalaycı (2009) shows that Pearson correlation coefficient is .70, .89 and states that relation is high. According to this, it can be said that the overall scale and the items in each factor measurements produce stable measurements. According to the results of the reliability analysis, it can be said that "Social Media Addiction Scale-Student's Form (SMAS-SF)" is a valid and reliable scale. CONCLUSIONS AND RECOMMENDATIONS Since social networking deeply affects the daily lives of students, it reveals the necessity of a measurement tool to determine social media addiction. This study aimed to develop the "Social Media Addiction Scale-Student Form (SMAS-SF)" and to conduct validity and reliability calculations of the scale. As a result of a literature survey in Turkey, it has been observed that social media are widely used among 12-22 year olds. However, no scale or test was found to measure the addiction levels of students in this age group. For this reason, it can be
  • 37. thought that this measurement tool can provide important contributions to the literature survey. TOJET: The Turkish Online Journal of Educational Technology – January 2018, volume 17 issue 1 Copyright © The Turkish Online Journal of Educational Technology 179 In the development process of the scale, an item pool consisting of 86 items was created in line with the information obtained from the literature survey, and opinions of field experts and a draft form was prepared. Then, a draft scaleconsisting of 41 items was prepared and this scale was applied to a participant group of 476 students between the ages of 12-22. The validity and reliability studies were performed on the obtained data. The first application of scale to which exploratory factor analysis was performed by 476 participants attended in the first application of scale, and 298 participants attended in the second application in which confirmatory factor analysis was performed. 224 participants took part in the test- retest application within the scope of the reliability study of the scale. A total of 998 students participated in the development process of the scale. Findings from validity and reliability studies show that the scale is a valid and reliable measurement tool and that can be used to identify students' social media addictions. The developed scale consists of 29 items and 4 factors
  • 38. (virtual tolerance, virtual communication, virtual problem and virtual information) with Likert type five grades. All the items on the scale are positive. When the relevant literature survey is examined, it is seen that the results of explanatory and confirmatory factor analysis of the SMAS- SF are at an acceptable level. Findings of validity and reliability of the scale indicate that SMAS-SF is available to determine the social media addiction of the students. In the later period, descriptive research that explores the relationship between the developed scale in this study and different variables may contribute to the literature survey. It is thought that with the developed scale, it is possible to determine the addiction levels of students and help to take appropriate measures according to the results. As a final result of the study, it can be said that the current scale can be used to determine social media addictions of the students, aged 12-22 years. Validity and reliability studies of the scale can be repeated in different sample groups and other age ranges. There are a few assessment tools to determine the social media addiction of university students in Turkish literature. This assessment tool is different from other assessment tools and contributes to the relevant literature in that it aims at determining the social media addiction levels of 12-22 year-old students. Social Media Addiction Scale Student Form (SMAS-SF) EXPLANATION: Different states related to social media use on the internet are given below. You are asked to read each expression
  • 39. carefully and put (X) for the expression you deem the most correct for you. Do not skip any item and mark each state please. Strongly disagree Disagree Neither agree nor disagree Agree Strongly agree 1 I am eager to go on social media. 2 I look for internet connectivity everywhere so as to go on social media. 3 Going on social media is the first thing I do when I wake up in the morning. 4 I see social media as an escape from the real world. 5 A life without social media becomes meaningless for me. 6 I prefer to use social media even there are somebody around me. 7 I prefer the friendships on social media to the friendships in the real life. 8 I express myself better to the people with whom I get in contact on social media. 9 I am as I want to seem on social media. 10 I usually prefer to communicate with people via social media. 11 Even my family frown upon, I cannot give up using social
  • 40. media. 12 I want to spend time on social media when I am alone. 13 I prefer virtual communication on social media to going out. 14 Social media activities lay hold on my everyday life. 15 I pass over my homework because I spend much time on social media. 16 I feel bad if I am obliged to decrease the time I spend on social media. 17 I feel unhappy when I am not on social media. 18 Being on social media excites me. 19 I use social media so frequently that I fall afoul of my family. 20 The mysterious world of social media always captivates me. 21 I do not even notice that I am hungry and thirsty when I am on social TOJET: The Turkish Online Journal of Educational Technology – January 2018, volume 17 issue 1 Copyright © The Turkish Online Journal of Educational Technology 180 media. 22 I notice that my productivity has diminished due to social media. 23 I have physical problems because of social media use. 24 I use social media even when walking on the road in order to be instantly informed about developments.
  • 41. 25 I like using social media to keep informed about what happens. 26 I surf on social media to keep informed about what social media groups share. 27 I spend more time on social media to see some special announcements (e.g. birthdays). 28 Keeping informed about the things related to my courses (e.g. homework, activities) makes me always stay on social media. 29 I am always active on social media to be instantly informed about what my kith and kin share. REFERENCES Akın, A., Özbay, A., & Baykut, İ. (2015). Sosyal medya kullanımı ölçeği’nin türkçe formu’nun geçerliği ve güvenirliği. The Journal of International Social Research, 8(38), 628-633. Almenayes, J. (2015). Empirical analysis of religiosity as predictor of social media addiction. Journal of Arts & Humanities, 4(10), 44-52. Al-Menayes, J. (2015). Psychometric properties and validation of the arabic social media addiction scale. Journal of Addiction, 2015, 1-6. Andreassen, C.S., Torsheim, T., Brunborg, G.S. & Pallesen, S. (2012). Development of a facebook addiction
  • 42. scale 1, 2. Psychological Reports, 110(2), 501-517. Arnett, J.J. (2004). Emerging Adulthood: The Winding Road from the Late Teens through the Twenties. (First ed.). Oxford University Press, New York. Arnett, J.J. (2007). Emerging adulthood: What is it, and what is it good for? Child Dev Pers 1 (2), 68-73. Balcı, A. (2009). Sosyal Bilimlerde Araştırma: Yöntem, Teknik ve İlkeler. Ankara: PegemA Banyai, F., Zsila, A., Kiraly, O., Maraz, A., Elekes, Z., Griffiths, M.D., Cecilie, SA. & Demetrovics, Z. (2017). Problematic social media use: results from a large-scale nationally representative adolescent sample. PLoS ONE, 12(1), 1-13. Bianchi, A. & Philips, J. G. (2005). Psychological predictors of problem mobile phone use. Cyberpsychology and Behavior, 8, 39-51. Büyüköztürk, Ş. (2002). Sosyal Bilimler İçin Veri Analizi El Kitabı. Ankara: Pegem A Yayıncılık. Büyüköztürk, Ş., Çakmak, E. K., Akgün, Ö. E., Karadeniz, Ş. & Demirel, F. (2015). Bilimsel araştırma yöntemleri. Ankara: Pegem Akademi. Cavaglıon, G. (2009). Cyber-porn dependence: voices of distress in an Italian internet self-help community. International Journal of Mental Health and Addiction, 7(2), 295–310. Fidan, H. (2016). Mobil bağımlılık ölçeği'nin geliştirilmesi ve geçerliliği: Bileşenler modeli yaklaşımı. Addicta: The Turkish Journal on Addictions, 3, 433–469.
  • 43. Fisher, S. (1994). Identifying video game addiction in children and adolescents. Addictive Behaviors, 19, 545- 553. Grıffıths, M.D. & Hunt, N. (1998). Dependence on computer games by adolescents. Psychological Reports, 82(2), 475–480. Griffiths M.D. (2012). Facebook addiction: Concerns, criticism, and recommendations a response to Andreassen and colleagues. Psychological Reports, 110(2), 518-520. Griffiths, M.D. (2012). Social networking addiction. Emerging themes and ıssues. 4(5), 1-2. Retrieved from http://dx.doi.org/10.4172/2155-6105.1000e118 Griffiths, M. D. (1995). Technological addictions. Clinical Psychology Forum, 76, 14–19. Griffiths, M.D., Kuss, D.J. & Demetrovics, Z. (2014). Social networking addiction: An overview of preliminary findings. Behavioral Addictions Criteria, Evidence, and Treatment. New York: Elsevier; ss. 119-141. Gündoğdu, R. (2016). Gelişim Psikolojisi. C. Şahin (Ed.). Eğitim Psikolojisi: Gelişim-Öğrenme-Öğretim içinde (s. 29-45). Ankara: Nobel. Hall A. S., ve Parsons, J. (2001). Internet addiction: College student case study using best practices in cognitive behavior therapy. Journal of Mental Health Counsiling, 23(4), 312-327. Harris, P., Nagy, S., & Vardaxis, N. (2014). Mosby's Dictionary of Medicine, Nursing and Health Professions- Australian & New Zealand Edition. Elsevier Health Sciences.
  • 44. Horzum, M. B. (2011). Examining computer game addiction level of primary school students in terms of different variables. Education and Science, 36 (159), 56-68. TOJET: The Turkish Online Journal of Educational Technology – January 2018, volume 17 issue 1 Copyright © The Turkish Online Journal of Educational Technology 181 Internet World Stats (2017). Internet world stats. Usage and population statistics. Retrieved http://www.internetworldstats.com/stats.htm. Jöreskog, K. & Sörbom, D. (1993). Lisrel 8: Structural equation modeling with the simplis command language. USA: Scientific Software International. Kalaycı, Ş. (2009). SPSS Uygulamalı Çok Değişkenli İstatistik Teknikleri. Ankara: Asil Yayınevi. Karasu, M. ve Arıkan, D. (2016). Öğretmen adaylarının sosyal medya kullanım durumları ve medya okuryazarlık düzeyleri arasındaki ilişkinin incelenmesi. Ege Eğitim Dergisi, 17(2), 549 – 566. Kırık, A.M., Arslan, A., Çetinkaya, A. & Gül, M. (2015). A quantitative research on the level of social media addiction among young people in Turkey. International Journal of Science Culture and Sport (IntJSCS),
  • 45. 3(3), 108-122. Kline, R. B. (2005). Principles and practice of structural equation modeling. New York: The Guilford Press. Kuss, D. ve Griffiths, M. (2012). Internet gaming addiction: a systematic review of empirical research. International Journal of Mental Health Addiction, 10, 278-296. Morahan-Martin J. & Schumacher, P. (2000). Incidence and correlates of pathological internet use among college students. Computers in Human Behavior, 16(1), 13-29. Pohlmann, J. T. (2004). Use and interpretation of factor analysis in The Journal of Educational Research: 1992- 2002. The Journal of Educational Research, 98(1), 14-22. Raykov, T., & Marcoulides, G.A. (2006). A first course structural equation modeling. New Jersey: Lawrence Erlbaum Assocation Inc. Russell, D. W. (2002). In search of underlying dimensions: The use (and abuse) of factor analysis. Personality and Social Psychology Bulletin, 28, 1629–1646. Saaid, S.A., Al-Rashid, N.A.A. & Abdullah, Z. (2014). The impact of addiction to twitter among university students. Future Information Technology. New York: Springer; ss. 231-236. Schwartz, M.F. & Southern, S. (2000). Compulsive cybersex: the new tea room. Sexual Addiction & Compulsivity 7(1-2), 127–144. Seçer, İ. (2013). SPSS ve LISREL ile pratik veri analizi ve raporlaştırma. Ankara: Anı Yayıncılık. Shapira, N.A., Goldsmith, T.D., Keck, P.E. Jr., Khosla, U.M., &
  • 46. McElroy, S.L. (2000), Psychiatric features of individuals with problematic internet use. Journal of Affective Disorders,57(1-3), 267-272. Sönmez, V. & Alacapınar, G.F. (2014). Örneklendirilmiş Bilimsel Araştırma Yöntemleri. Ankara: Anı Yayıncılık. Şahin, C. (2011). An analysis of internet addiction levels of individuals according to various variables. The Turkish Online Journal of Educational Technology, 10 (4), 60- 66. Şahin, C. ve Beydoğan, H.Ö. (2016). Öğretmenlerin öğrencileri tanıma yeterliliği ölçeği. 21. Yüzyılda Eğitim ve Toplum-Eğitim Bilimleri ve Sosyal Araştırmalar Dergisi, 5(14), 177-198. Şahin, C. ve Yağcı, M. (2017). Sosyal medya bağımlılığı ölçeği- yetişkin formu: Geçerlik ve güvenirlik çalışması. Ahi Evran Üniversitesi Eğitim Fakültesi Dergisi, 18(1), 523-538. Tekvar, S.O. (2012). Yeni medya ve halkla ilişkilerde dönüşüm: farklı kurumsal yapılarda halkla ilişkiler algısı ve sosyal paylaşım ağları. (Yayımlanmamış doktora tezi, Ankara Üniversitesi Eğitim Bilimleri Enstitüsü). Turel, O. & Serenko, A. (2012). The benefits and dangers of enjoyment with social networking websites. European Journal of Information Systems, 21, 512–528. Tutgun Ünal, A. & Deniz, L. (2015). Development of the social media addiction scale. Online Academic
  • 47. Journal of Information Technology, 6(21), 52-70. Türkiye İstatistik Kurumu (TUİK) (2016). Hane Halkı Bilişim Teknolojileri Kullanımı Araştırması. http://www.tuik.gov.tr Tüzer, V. (2011). İnternet, siberseks ve sadakatsizlik. Psikiyatride Güncel Yaklaşımlar, 3 (1), 100-116. van den Eijnden, R.J.J.M., Lemmens, J.S. & Valkenurg, P.M. (2016). The social media disorder scale. Computers in Human Behavior, 61, 478-487. Veneziano, L. & Hooper J. (1997). A method for quantifying content validity of health-related questionnaires. American Journal of Health Behavior, 21(1), 67-70. Wang, W. (2001). Internet dependency and psychosocial maturity among college students. International Journal Human Computer Study, 55(6), 919-938. Wegmann E., Stodt B. & Brand M. (2015). Addictive use of social networking sites can be explained by the interaction of internet use expectancies, internet literacy, and psychopathological symptoms. Journal of Behavioral Addictions, 4(3), 155-162. Xu, H., Tan, B.C.Y. (2012). Why do I keep checking facebook: Effects of message characteristics on the formation of social network services addiction. Thirty Third International Conference on Information Systems,1-12,Orlando.Retrieved http://aisel.aisnet.org/cgi/viewcontent.cgi?article=1216& context=icis2012
  • 48. TOJET: The Turkish Online Journal of Educational Technology – January 2018, volume 17 issue 1 Copyright © The Turkish Online Journal of Educational Technology 182 Yang, S., & Tung, C. (2007). Comparison of Internet addicts and non-addicts in Taiwanese high schools, Computers in Human Behavior, 23, 79-96. Young K. S. (2004). Internet addiction: A new clinical phenomenon and its consequences. American Behaviour Scientist, 48, 402- 415. Reproduced with permission of copyright owner. Further reproduction prohibited without permission. 46 The Role of Facebook Affirmation towards Ideal Self-Image and Self-Esteem Yokfah Isaranon1
  • 49. Although research has found that people often use Facebook to present their ideal image, it is not clear whether Facebook can bring out the best self of its users. The present research investigated whether Facebook would help its users feel their best and have higher self-esteem through affirmation of the ideal self on Facebook. In particular, such Facebook affirmation might be most beneficial among moderate users. Using a correlational research design, 330 Thai participants (aged 18-35 years) were recruited through Facebook advertisements and asked to complete a set of online questionnaires. Using a moderated mediation analysis, results showed that Facebook affirmation had a positive effect on self-esteem (β = .14, p < .05). Such an effect was partially mediated by actual and ideal-self congruence (β = .02, p < .05). In addition, time spent on Facebook moderated both direct and indirect effects of Facebook affirmation on self-esteem. The direct effect of Facebook affirmation was more
  • 50. pronounced among moderate users (β = .24, p < .05) than heavy users (β = .02, ns). Moreover, the indirect effect of Facebook affirmation was more pronounced among moderate users (β = .04, p < .05) than light users (β = -.00, ns). These results supported hypotheses that users who experienced Facebook affirmation reported having increased levels of self-esteem as a result of experiencing actual and ideal-self congruence. Specifically, moderate users benefited mostly from using Facebook, compared with light and heavy users. Key findings from this study could contribute to literature on social media behavior and the benefits from using Facebook. Keywords: Facebook, affirmation, ideal self, time spent With over 2.27 billion users worldwide in 2018 (The Statistics Portal, 2019), Facebook has become a part of people’s lives in this generation. Not only has it enabled users to control
  • 51. the pace of conversations (Boyd & Ellison, 2008), manage their physical appearance during their social interactions (Amichai-Hamburger, 2007), or find a perfect romantic partner (Sangkapreecha, 2015), but Facebook has also provided an ideal space for people to present their best self (Amichai-Hamburger & Hayat, 2013; Lee-Won, Shim, Joo, & Park, 2014). Unsurprisingly, previous research found that many people utilized Facebook for self-enhancing benefits (Kim & Lee, 2011; Malik, Dhir, & Nieminen, 2016; Tosun, 2012). Prior research on social media has shown that some Facebook activities (such as self- description on Facebook) help its users construct and express their ideal self (Zhao, Grasmuck, & Martin, 2008). Moreover, with its unique characteristics, including privacy settings, and information filtering, Facebook seems to elicit positive interactions (Lin, Tov, & Qiu, 2014). Consequently, expected positive feedback from others may likely occur and play an important role in fulfilling such ideal self-projection. This process is consistent with that of behavioral
  • 52. affirmation which suggests that receiving behavioral affirmation from romantic partners is essential in assisting movement towards the ideal self of one another, yielding both life and relationship satisfaction (Kumashiro, Rusbult, Finkenauer, & Stocker, 2007). Once applied to Facebook, it is highly likely that people may act out their ideal self on Facebook and attain positive affirmation in return. 1 Lecturer, Faculty of Psychology, Chulalongkorn University, Thailand. Email: [email protected] The Journal of Behavioral Science Copyright © Behavioral Science Research Institute 2019, Vol. 14, Issue 1, 46-62 ISSN: 1906-4675 (Print), 2651-2246 (Online) Ideal Self on Facebook 47 However, spending extensive time on or being addicted to Facebook may lead to mental health problems. For example, excessive use of Facebook was found to lower levels of self-
  • 53. esteem and life satisfaction (Błachnio, Przepiorka, & Pantic, 2016; Faraon & Kaipainen, 2014). Similarly, it increased the risk of other mental problems such as anxiety, depression, and eating disorders (Frost & Rickwood, 2017). Therefore, the extent to which individuals benefit from using Facebook may depend on their time spent on Facebook. In particular, moderate usage is expected to be most beneficial because the decent amount of time allows users to have positive interaction with others, without overexposure to other negative outcomes (Thuseethan & Kuhanesan, 2014). Drawing on research about behavioral affirmation (Rusbult, Finkel, & Kumashiro, 2009), best self-presentation on Facebook (Lee-Won et al., 2014), and mental health concerns such as low self-esteem among heavy Facebook users (O'Sullivan & Hussain, 2017), this study examines whether Facebook can provide affirmation of the ideal self and promote actual and ideal-self congruence to its users. Specifically, an overlap between actual and ideal self may
  • 54. increase users’ self-esteem as it brings a sense of self-worth through accomplishing an ultimate goal. Yet, because heavy usage of Facebook can lead to lower self-esteem and other negative outcomes (Pantic, 2014), it is expected that this affirmation of the ideal-self process should mostly benefit the moderate users. This study mainly investigated such process in a Thai sample. Since the nationwide number of Facebook users is approximately 47 million users, Thailand is ranked among the countries with the most Facebook users worldwide (Thaitech, 2019). Therefore, a Thai sample may represent more active users of Facebook. Facebook and Ideal Self Facebook is a social networking site that provides a large number of activities in which users can engage. Facebook users can choose to update their Facebook statuses, share their pictures or videos, leave comments on their friends’ profiles, tag other people, and approve the tags added by others to their own posts, as well as send instant messages (Boyd & Ellison,
  • 55. 2008). Furthermore, Facebook users have full control over their personal information and privacy as they can set their profiles as private or public and filter whom they would like to include in their social networks (such as friending or unfriending). Therefore, these functions of Facebook not only offer users with opportunities to establish or maintain connection with others within a bounded system (Ellison, Steinfield, & Lampe, 2007), but also facilitate users’ identity construction (Tosun, 2012) and help project users’ ideal self (Seidman, 2013; Zhao et al., 2008). Photo sharing and wall posting are examples of constructing and expressing ideal self on Facebook. As Facebook enables users to manage the attractiveness of their image presented within their networks, individuals can post appealing photos to present their best side (Amichai- Hamburger & Hayat, 2013; Zhao et al., 2008). For instance, users can choose to post photos of their happy moments during vacation. This idea is consistent with the results found in Siibak’s
  • 56. (2009) study, which showed that youngsters selected an ideal photo as a profile image to form a positive impression to others in order to achieve their ideal goal as being popular. Additionally, the advancement of digital photography technology allows individuals to beautify their photos as they wish to be perceived (Amichai-Hamburger, 2007; Amichai-Hamburger & Hayat, 2013). Consequently, individuals might exercise their control over physical appearance by choosing an attractive profile picture on their web page just to look appealing in others’ Yokfah Isaranon 48 perceptions. Thus, at some point, users are capable of controlling their image and constructing their best self on Facebook. Facebook Affirmation Literature on close relationships and motivation suggests that significant others are very
  • 57. important for facilitating personal growth and development (Kumashiro, Rusbult, Wolf, & Estrada, 2006). In particular, people who consistently receive behavioral affirmation from their loved ones over a long period of time are capable of moving closer to their ideal selves or reaching an ultimate goal (Drigotas, Rusbult, Wieselquist, & Whitton, 1999). The term “Michelangelo phenomenon” has been coined to describe this process as it was inspired by an influential artist, Michelangelo Buonarroti, who believed sculpturing was to uncover the beauty hidden inside a block of stone (Rusbult, Finkel, et al., 2009). As such, in relationships, partners who help each other bring out the best side of one another can eventually reach their own ideal self (Kumashiro et al., 2007). Even though the concept of affirmation of the ideal self was initially proposed in the context of romantic relationships (Drigotas et al., 1999; Rusbult, Kumashiro, Kubacka, & Finkel, 2009), it is possible to apply to other contexts involving mutual interaction such as
  • 58. Facebook. This is partly because most activities on Facebook such as sharing, clicking like, and instant messaging facilitate supportive interactions and elicit positive feedback from others (Boyd & Ellison, 2008; Manago, Taylor, & Greenfield, 2012). Specifically, Facebook users are likely to receive likes or positive comments from their Facebook friends (Chin, Lu, & Wu, 2015), which may in turn help affirm their ideal selves. Moreover, the notion that people have freedom and power to control the contents or whom they desire to share those contents with (Boyd & Ellison, 2008) may enhance the possibility of their ideal characteristics to been noticed and affirmed (Wong, 2012). Specifically, as Facebook users can disclose their personal information to their friends via status updating or photo sharing, their friends are able to know their ideal self or aspiration. Therefore, it is highly likely that individuals may experience affirmation of the ideal self on Facebook or “Facebook affirmation”. It is noteworthy that affirmation of the ideal self differs from
  • 59. self-affirmation. The self- affirmation theory suggests that individuals are motivated to maintain their self-integrity by reflecting on other values of life or responding defensively (Sherman & Cohen, 2006), especially when the self is threatened (Cohen & Sherman, 2007). However, Facebook affirmation in this research refers to the perception of Facebook users that other people on Facebook regard them in ways consistent to their ideal selves, regardless of whether the self- threat is present or not. Specifically, ideal self in this case refers to the characteristics that Facebook users ideally wish to have−not what they already possess. Thus Facebook affirmation can occur only when their ideal qualities or attributes exhibited on Facebook are consistently affirmed by others. Therefore, Facebook affirmation seems to be a route for self-improvement or personal development, rather than self-verification or self- validation. Modified from the Michelangelo phenomenon model, the present research proposed that
  • 60. receiving Facebook affirmation could lead to actual and ideal- self congruence. Prior research found that individuals who experienced affirmation of the ideal self from their partner reported moving closer to their ideal selves (Kumashiro et al., 2006; 2007). This suggests that movement towards the ideal self is a product of the affirmation of the ideal self process. According to this, Ideal Self on Facebook 49 those who receive Facebook affirmation may also perceive that their actual selves become closer to their ideal selves on Facebook or report higher levels of actual and ideal-self congruence. Thus, it was predicted that: H1: Facebook affirmation would positively predict actual and ideal-self congruence. In addition, research has shown that self-esteem or a sense of self-worth can be interpreted as an outcome of congruence between the actual and ideal self (Rogers, 1959).
  • 61. Given Facebook affirmation should yield congruence between actual and ideal self, they should also increase levels of self-esteem. That is, being affirmed and achieving one’s own ideal self on Facebook should bring about a positive sense of self-view. Moreover, recent research found that receiving likes or positive comments from friends on Facebook increased levels of happiness because such experience represents an act of caring or being interested from their friends (Zell & Moeller, 2018). Thus, it is highly predictable that receiving Facebook affirmation may also increase a positive sense of self-view. In particular, actual and ideal-self congruence may be a mediator of the association between Facebook affirmation and self- esteem. Therefore, it was predicted that: H2: Facebook affirmation would positively predict self-esteem. H3: Actual and ideal-self congruence would positively predict self-esteem. H4: Actual and ideal-self congruence would mediate the
  • 62. relationship between Facebook affirmation and self-esteem. Time Spent on Facebook Excessive use of Facebook can be a risk factor for mental problems such as decreasing self-esteem (Faraon & Kaipainen, 2014; Kross et al., 2013; Pantic, 2014). One possible explanation is related to the social comparison process. Heavy users of Facebook have higher chances to encounter information of others in their networks (Vogel, Rose, Okdie, Eckles, & Franz, 2015). Given that people are likely to share positive things in their daily lives, heavy users may have a higher tendency to witness a large amount of positive experiences and may perceive others to be in better situations than themselves (Pantic et al., 2012). Thus, their sense of self-worth can be lowered (Arad, Barzilay, & Perchick, 2017; Pantic, 2014). On the other hand, moderate Facebook usage has been found to enhance mental health
  • 63. and well-being. Hobbs, Burke, Christakis, and Fowler (2016) compared 12 million Facebook users to nonusers in order to examine the association between social interactions and longevity. Their findings showed that balanced levels of interaction on Facebook were associated with lower risks of a number of health problems. In particular, such benefits were due to social connection, which has been found to play an important role in improving well-being (Burke, Marlow, & Lento, 2010; Sandstrom & Dunn, 2014) and increasing self-esteem (Steinfield, Ellison, & Lampe, 2008; Valkenburg, Peter, & Schouten, 2006). Thus, it is possible that the extent to which Facebook can lead to positive outcomes, including Facebook affirmation and actual and ideal-self congruence, may depend on the time spent on Facebook. In particular, moderate usage might be an optimal amount of time for users to attain positive experiences and avoid negative consequences. Yokfah Isaranon
  • 64. 50 Taken together with the proposed model of Facebook affirmation, time spent on Facebook should moderate the relationship between Facebook affirmation and self-esteem. Moreover, it should moderate the relationship between actual and ideal-self congruence and self-esteem as shown in Figure 1. Hence, it was predicted that: H5: Time spent on Facebook would moderate the relationship between Facebook affirmation and self-esteem, such that the relationship between Facebook affirmation and self- esteem would be stronger in the moderate use group, as compared to other groups. H6: Time spent on Facebook would moderate the relationship between actual and ideal- self congruence and self-esteem, such that the relationship between actual and ideal-self congruence and self-esteem would be stronger for the moderate use group, as compared to other groups.
  • 65. Figure 1. Hypothesized model Method Participants Participants were recruited through Facebook advertisement between September 2017 and January 2018 using convenience sampling. The Facebook advertisement was designed to target active Thai Facebook users aged between 18-35. The age range was chosen to represent the Millennials or Generation Y, a cohort which grew up using social media (Bergman, Fearrington, Davenport, & Bergman, 2011). Overall, there were three hundred and thirty Thai Facebook users who volunteered to participate in this study (122 males, 208 females, Meanage = 20.79). Research Design and Procedure A correlational research method was used. The present research
  • 66. was granted approval from Ratchadaphiseksomphot Endowment Fund, Chulalongkorn University. Once it was reviewed and received ethics clearance (COA No. 155/2560) through a Research Ethics Committee at Chulalongkorn University, the Facebook advertisement was launched. Participants who were interested in taking part in the study were asked to complete a set of online questionnaires and inform their demographics information. All participants were also asked to grant their consent to participate in the study before completing the questionnaires. Ideal Self on Facebook 51 Measures Facebook affirmation. Participants were instructed to complete a Thai version of Facebook affirmation scale developed by Isaranon (2016). The scale consisted of 4 items and was originally modified from scales used in Kumashiro et al. (2006). An example of the items was “When I’m on Facebook, I feel free to display the kind of person I ideally want to become” (1 = strongly disagree and 7 = strongly agree) (α = .72).
  • 67. Actual and ideal-self congruence. A Thai version of actual and ideal-self congruence scale developed by Isaranon (2016) was used. The scale was also modified from the Michelangelo phenomenon model (Kumashiro et al.,2006). Participants were presented with one item comprised of nine pairs of circles portraying how close their actual self is to their ideal self. The circle on the left represents their actual self and the one on the right represents their ideal self as shown in Figure 2. Figure 2. Actual and ideal-self congruence measure Participants were then asked to indicate which one of each pair represented themselves the most when they were on Facebook (1 = their actual and ideal selves do not overlap at all and 9 = their actual and ideal selves are the same). Self-esteem. Participants were asked to complete a Thai version of Rosenberg’s (1965)
  • 68. self-esteem scale developed by Isaranon (2016). This measure consisted of 10 items assesses individual difference in the extent to which people report self- esteem levels, such as “On the whole, I am satisfied with my life” (1 = strongly disagree and 7 = strongly agree) (α = .76). Time spent on Facebook. To assess time spent on Facebook, participants were asked to indicate the duration of time spent on Facebook in each day (0 = less than 10 minutes, 1 = 10-30 minutes, 2 = 31-60 minutes, 3 = 1-2 hours, 4 = more than 2 hours but less than 3 hours, 5 = more than 3 hours). According to findings from a research by Primack et al. (2017), people who spent more than 2 hours per day logging onto social networking sites were more likely to experience negative outcomes such as isolation, compared to those who spent less than 30 minutes a day. In particular, prior research defined those who spent more than 2 hours per day as heavy users (Bélanger, Akre, Berchtold, & Michaud, 2011; Ryan, Reece, Chester, & Xenos, 2016) while those who spent from 31 minutes to 2 hours per day were defined as moderate
  • 69. users and those who spent 30 minutes or less per day were defined as light users (Ryan et al., 2016). Thus, time spent on Facebook in this study were categorized into 3 groups based on such findings: 1) light use = 30 minutes/day or less; 2) moderate use = between 31 minutes to 2 hours/day; and 3) and heavy use = more than 2 hours/day. Yokfah Isaranon 52 Data Analysis This study sought to explore whether Facebook affirmation could predict self-esteem via actual and ideal-self congruence. Moreover, it attempted to investigate whether the effects of both Facebook affirmation and actual and ideal-self congruence on self-esteem were moderated by time spent on Facebook. Thus, the PROCESS macro program (Hayes, 2018) was used to test such moderated-mediation model of the relationships among Facebook affirmation, actual and ideal-self congruence, self-esteem, and time spent on Facebook. In addition, two dummy variables were created; light (light use = 1 and otherwise = 0) and heavy (heavy use = 1 and otherwise = 0), whereas moderate use was treated as a
  • 70. reference group. Aiken and West (1991) suggested that a comparison group in three dummy variable coding systems is a group that is assigned a value of 0 for all dummy variables. Therefore, the light use group compares the light users with the moderate users, and the heavy use group compares the heavy users with the moderate users. Results Descriptive Statistics In this study, time spent on Facebook were categorized into 3 groups; there were 94 light users who use Facebook 30 minutes/day or less, 115 moderate users who use Facebook between 31 minutes and 2 hours/day, and 121 heavy users who use Facebook more than 2 hours/day. Means, standard deviations, and bivariate correlations among study variables of the three groups are displayed in Table 1. Table 1 Means, Standard Deviations, and Bivariate Correlations of Study Variables Variables 1 2 3 M SD Light use (n = 94) 1. Facebook affirmation - 4.29 0.93
  • 71. 2. Actual and ideal-self congruence .07 - 5.63 2.35 3. Self-esteem .14 .00 - 4.51 0.69 Moderate use (n = 115) 1. Facebook affirmation - 4.44 0.88 2. Actual and ideal-self congruence .12 - 5.76 2.08 3. Self-esteem .24* .30** - 4.71 0.81 Heavy use (n = 121) 1. Facebook affirmation - 4.55 0.93 2. Actual and ideal-self congruence .17† - 6.13 2.13 3. Self-esteem .03 .26** - 4.43 0.72 Note: †p < .10, *p < .05, **p < .01 One-way ANOVA was also conducted to explore whether there were differences in scores of Facebook affirmation, actual and ideal-self congruence, and self-esteem among the three groups. Results showed that although there were no statistical differences in Facebook affirmation (F(2,327) = 2.14, ns) and actual and ideal-self congruence (F(2,327) = 1.61, ns), there was a difference in self-esteem between group means (F(2,327) = 4.47, p < .05). In particular, moderate users reported higher levels of self-esteem than heavy users (Mmoderate =
  • 72. 4.70, SDmoderate = 0.81, Mheavy = 4.42, SDheavy = 0.72, t = 2.92, p < .01). Ideal Self on Facebook 53 Simple Mediation Analyses: Actual and ideal-self congruence as a Mediator Results from the PROCESS macro program supported Hypotheses 1 and 2 that Facebook affirmation was a significant predictor of actual and ideal- t(327) = 2.41, p < .05) and self- p < .05). In addition, actual and ideal-self congruence positively predicted self- t(327) = 3.19, p < .01), supporting Hypothesis 3. The mediation analysis also supported the mediational hypothesis. Using a bootstrap estimation approach with 10,000 samples, the indirect effect coefficient of Facebook affirmation on self-esteem via actual and ideal-self .02, SE = .01, 95% CI = .00, .06, p < .05). In particular, the effect of Facebook affirmation on
  • 73. self-esteem reduced but remained significant after controlling for the mediator, actual and ideal- with partial mediation. Therefore, these results supported Hypothesis 4 as shown in Figure 3. Figure 3. Model of mediation of relationships between Facebook affirmation and self-esteem Note: *p < .05, **p < .01 Moderated Mediation Analyses: Time Spent on Facebook as a Moderator Time spent on Facebook (2 dummy variables: light use and heavy use) was further tested whether it moderated the relationship between Facebook affirmation and self-esteem, and the relationship between actual and ideal-self congruence and self- esteem. The PROCESS macro program was employed to test the moderated mediation model 17. Results revealed that heavy use group (heavy vs. moderate) was a significant negative predictor of self- -.39, t(327) = -3.15, p < .01) while the light use group (light vs.
  • 74. -.14, t(327) = -1.04, ns). That is, heavy users reported lower levels of self- esteem than moderate users. On the contrary, there was no difference in self-esteem between light and moderate users. The standardized regression coefficients between Facebook affirmation and self-esteem nd ideal- self congruence an self-esteem Additionally, the heavy use group (heavy vs. moderate) marginally moderated the relationship between Facebook affirmation and self- -.21, t(320) = -1.69, p < .10). However, it did not moderate the relationship between actual and ideal-self congruence and self- -.04, t(320) = -0.32, ns). Conversely, the light use group (light vs. moderate) did not moderate the relationship between Facebook affirmation and self- -.10, t(320) = -0.79, ns). However, it moderated the relationship between actual and ideal-self congruence and self- -.30, t(320) = -2.32,
  • 75. p < .05) as shown in Figure 4. Yokfah Isaranon 54 Figure 4. Model of moderated mediation of relationships among Facebook affirmation, actual and ideal-self congruence, and self-esteem by using time spent on Facebook (light use, moderate use, and heavy use) as the moderator Note: *p < .05, **p < .01 The significance of the conditional direct and indirect effects was further explored. Results showed that the conditional direct effect was significant SE = .09, 95% CI = .05, .41, p < .05). On the contrary, levels of self-esteem among light users -.0612, .3177, ns) and heavy users -.15, .19, ns), were not directly influenced by their Facebook affirmation experience. The heavy use group (heavy vs. moderate), unlike the light group (light vs. moderate) moderated the
  • 76. relationship between Facebook affirmation and self-esteem. These findings indicated that moderate users would have higher self-esteem than heavy users, but not than light users, when they experienced Facebook affirmation. Thus, these results partially supported Hypothesis 5. Additional results also revealed that the conditional indirect effect was significant for -.12, -.00, p < .05) and hea .02, 95% CI = .01, .09, p < .05), but not significant for light -.00, SE = .01, 95% CI = -.03=, .02=, ns) as shown in Table 2. Moreover, the index of partial moderated mediation, a test of equality of the conditional indirect effect for dichotomous moderators, was significant -.04, SE = .02, 95% CI = -.12, -.00, p < .05), but not significant for -.01, SE = .02, 95% CI = -.06, .03, ns). These demonstrated that the indirect effects were different for the light use group (light vs. moderate), but indifferent for the heavy use group (heavy vs. moderate), suggesting that the moderated mediation only occurred
  • 77. for the light use group. Thus, these results partially supported Hypothesis 6. Ideal Self on Facebook 55 Table 2 Direct and Indirect Influences of Facebook Affirmation on Self- esteem by Using Time Spent on Facebook as the Moderator Conditional effects of Facebook affirmation on self-esteem at different levels of time spent on Facebook Direct effect Indirect effect Light use (30 mins/day or less) .13 -.06 .32 -.00 -.03 .02 Moderate use (31 mins - 2 hours/day) .23* .05 .41 .04* .01 .10 Heavy use (more than 2 hours/day) .02 -.15 .19 .03* .01 .09 Note: LLCI = lower level confidence interval; ULCI = upper
  • 78. level confidence interval. Bootstrap sample size = 10,000; *p <.05. In general, results mostly supported the hypotheses that Facebook affirmation was positively associated with Actual and ideal-self congruence, both Facebook affirmation and Actual and ideal-self congruence were positively associated with increased self-esteem, the link between Facebook affirmation and self-esteem was mediated by Actual and ideal-self congruence, and such mediation was more pronounced among moderate users than light users, but not than heavy users. Discussion Facebook, the most popular social networking site, has been recognized as a platform for positive self-presentation (Lee-Won et al., 2014), self- expression (Seidman, 2013), and social discourse (Thorkildsen & Xing, 2016). Yet, little is known whether Facebook can bring
  • 79. out the best self of users. This study, thus attempted to explore the possibility of having increased self-esteem through the process of ideal-self affirmation on Facebook. Particularly, it sought to investigate whether time spent on Facebook would play a role in this process. Modified from behavioral affirmation process, the current research proposed a new idea that Facebook might serve as a platform for bringing out the best self of users by providing affirmation of the ideal self. It used a correlational research design to explore the process and benefits of the affirmation of the ideal self on Facebook. Results showed two important findings. Firstly, Facebook users who received Facebook affirmation experienced greater actual and ideal-self congruence and had increased self-esteem. Secondly, time spent on Facebook affected these positive outcomes. Facebook Affirmation and Actual and ideal-self congruence Previous research has shown that consistently receiving behavioral affirmation by
  • 80. significant others in close relationships over a long period of time facilitates movement towards the ideal self (Kumashiro et al., 2007; Rusbult, Kumashiro, et al., 2009). Consistently, this study provides additional evidence that people can also feel affirmed and experience greater actual and ideal-self congruence on Facebook, where interaction can be made either with close friends or acquaintances. Given positive mutual interaction is the basis element of affirmation of the ideal-self process (Drigotas et al., 1999), and Facebook interaction is mostly under the control of users (such as deleting negative comments and sharing selected contents with certain friends) (Ellison et al., 2007), positive feedback is likely to be elicited. This is in line with previous Yokfah Isaranon 56 research which showed that presenting desired images or characteristics on Facebook was associated with receiving social support from friends (Wong, 2012). According to this,
  • 81. Facebook users who present their ideal image or characteristics in a way that they wish to be perceived have a high tendency to attain positive feedback in return. Thus, Facebook affirmation is likely to occur. It is worth noting that the ideal self on Facebook in this study may apprehend only the dimensions of positive self-description and physical appearance on Facebook which users can manage on their own. This is in accordance with previous studies on self-presentation, which mostly examined personal characteristics described on profile photos of the users (Amichai- Hamburger & Hayat, 2013; Seidman, 2013; Siibak, 2009; Zhao et al., 2008). Additionally, the sample in this study was between the age group of 18-30 years, which the concern of physical appearance is mostly predominant (Harris & Carr, 2001). Thus, the effect of Facebook affirmation found in this study may be partly because of the match between Facebook activities and sample’s interests.
  • 82. Furthermore, this study was conducted in Thailand, a highly collectivistic country where expressing one’s own ideal self in face-to-face circumstances is less discouraged, compared to focusing on group’s goals (Triandis, 2001). As a result, there may be a higher tendency for people in collectivistic cultures to pursue an ideal self on Facebook to compensate and balance between their personal desires and social motives (Peters, Winschiers-Theophilus, & Mennecke, 2015). Influences of Time Spent on Facebook Although Facebook users reported that they came closer to their ideal selves on Facebook and had higher levels of self-esteem after receiving Facebook affirmation, moderate users (between 31 minutes and 2 hours a day) seemed to benefit the most from such process. That is, moderate Facebook users reported higher levels of self- esteem when being affirmed on Facebook. They also reported higher levels of self-esteem than light users when experiencing
  • 83. greater actual and ideal-self congruence. Moreover, moderate users had higher levels of self- esteem than heavy users. Findings from this research are consistent with those found in other studies examining the association between time spent on Facebook and outcomes in life. For example, prior research showed that moderate use of Facebook was an optimal amount of time that individuals were able to establish social connection with others, yielding to higher levels of self-esteem, an indicator of social acceptance (Arad et al., 2017; Hobbs et al., 2016; Pantic, 2014). Moreover, medium usage also minimized to an extent which individuals would extensively engage in social comparison, causing unhappiness and life dissatisfaction (Faraon & Kaipainen, 2014). As such, results from the current study suggest that moderate use seems to be most beneficial for reaching an ideal self and elevating self-esteem. Implications
  • 84. Findings from the current research have several implications. First, the notion that affirmation of the ideal self could occur on Facebook contributes to literature on ideal self and Ideal Self on Facebook 57 goal pursuit that positive interaction which helps affirming an ideal self of individual may not limit to close relationships. This is due to the characteristics of Facebook which allow users to manage their contents and audience (those who provide feedback) (Boyd & Ellison, 2008). Thus, those who are unable to find supportive interaction from their loved ones in face-to-face circumstances may find Facebook as another venue for pursuing an ideal self. Additionally, Facebook may establish other functions that can be more helpful for users to achieve their ideal characteristics in relation to self-description or physical appearance. In addition, as the process of experience actual and ideal-self
  • 85. congruencecould occur on Facebook, there might be a campaign or encouragement for using Facebook to attain such self- improvement benefit or promote well-being. In particular, Facebook might be used as a practice-based platform for expressing the ideal self. The lack of face-to-face interaction on Facebook may assist people who feel constrained to exhibit their personal aspirations in real life, especially those in a collectivistic culture or those with social anxiety, to try achieving their personal goals without worrying about their physical appearance or the negative feedback they may attain. Another significant implication is that Facebook usage behaviors could also reflect the need for ideal self-fulfillment. Although the majority of research on social media show that most people use Facebook for maintaining or establishing relationship with others (Amichai- Hamburger, 2007; Boyd & Ellison, 2008), the current study provides additional evidence for behavioral science research that people may also utilize
  • 86. Facebook to achieve their ideal selves. As such, behavior expressed on Facebook may not only facilitate communication among Facebook users for relationship maintenance, but also enable them to act or behave in ways that they desire to be regarded in order to achieve their ideal aspect of self. This suggests that Facebook usage reflects both intrapersonal and interpersonal behaviors. This study also found that moderate use between 31 minutes to 2 hours a day was the most optimal level that users would benefit from using Facebook, whereas heavy use for more than 2 hours a day was harmful for users’ self-esteem. As such, there might be a policy to monitor time spent on Facebook. For example, Facebook might develop a system in which a notification of heavy use would pop up after reaching 2 hours of Facebook usage per day. On the other hand, an awareness of the danger of excessive use of Facebook may be raised among users. Specifically, young women who are highly concerned with ideal image (Grabe, Ward, &